Article

Modelling the Contribution of Domestic Heat Pumps to Delivering UK Energy Policy Objectives

CREST (Centre for Renewable Energy Systems Technology), School of Electronic, Electrical & Systems Engineering, Loughborough University, Leics. LE11 3TU UK
*
Author to whom correspondence should be addressed.
Appl. Sci. 2013, 3(2), 338-354; https://doi.org/10.3390/app3020338
Submission received: 25 December 2012 / Revised: 8 February 2013 / Accepted: 17 February 2013 / Published: 28 March 2013
(This article belongs to the Special Issue Renewable Energy)

Abstract

:
The UK Government has ambitious targets for CO2 emissions reductions, particularly for the domestic housing stock. One technology that is expected to contribute significantly is heat pumps, both air and ground source. However, recent field trial results suggest that heat pumps in the UK are not delivering to performance expectations. This paper looks at the implications of these results for the UK housing stock’s future CO2 emissions. The English Housing Condition Survey dataset is used as the basis for a Monte Carlo simulation in order to model CO2 emissions and energy consumption for the whole of English housing stock out to 2050. The results suggest that, given the current UK electricity grid CO2 emission factor, in the short term poor heat pump performance could lead to a rise in emissions where natural gas boilers are displaced. In the longer term, heat pumps can realise emissions reductions when installed at high penetration levels when combined with a grid decarbonisation strategy. Until grid decarbonisation occurs, an alternative phased strategy is proposed that includes phased replacement of resistive electric heating, first in households in fuel poverty and then the remainder of properties with this heating type. Following this phased strategy, real emissions savings are possible along with a potential reduction in fuel poverty.

1. Introduction

1.1. Context

It is widely accepted that global climate change is predominantly due to the emissions of greenhouse gases (GHG), 75% of which is attributable to CO2 [1]. In the United Kingdom, 47% of CO2 emissions are due to the production of heat [2], with a significant contributor to that total being the domestic sector [3]. One means of reducing CO2 emissions is via a greater use of renewable energy technology both in the production of electricity and heat. As part of the EU 2020 renewables targets, the UK is aiming for 12% renewable heat [4], 22% of that being from the domestic sector. Studies conducted to support the Government’s analysis estimates that by 2020, 7.1% (4.7 TWh per annum) of this domestic renewable heat could be delivered by heat pumps (4.7% from air source, 2.4% ground source) [5]. A later report published mid-2011 has extrapolated models to 2030 with heat pumps in the residential sector predicted to be 55%–75% of all installations [6].

2. Current Situation

2.1. Heat Pump Performance—The Expectation

UK projections are predicated on the assumption that air and ground source heat pumps perform at efficiency levels of 250%–275% and 315%–385% respectively [6]. These levels of performance are consistent with the assumptions in widely used domestic energy models published by BRE, e.g., BREDEM [7], and the Governments own energy performance measure of dwellings, the Standard Assessment Procedure (SAP) [8] (SAP itself being a simplified BREDEM model) with values of 250% for air and 320% for ground source. Manufacturers tend to present more optimistic performance levels for air source of up to 350% [9] and up to 420% for ground source [10]. Furthermore, many energy models developed for academic research, particularly those focusing on UK housing stock and carbon emission scenarios, often use the BREDEM models at their heart, e.g., UKDCM, DeCARB, CDEM [11].
Across all sectors (i.e., residential and non-residential) a predicted total of 66 TWh of heat could be generated from renewable sources by 2020 with 18 Mt of CO2 abated as a result [6]. This projection gives no breakdown of the CO2 abatement contribution from heat pumps; however, air source heat pumps (ASHP) are projected to contribute 40% of the total by 2030 in the residential sector for a medium abatement scenario [6].
With 85% of heating installations currently being natural gas central heating [12], given the 2030 installation levels being considered, heat pumps will be displacing significant amounts of gas central heating. The UK’s Energy Saving Trust (EST) states that ASHPs may emit more CO2 than a baseline mains gas boiler system supplying both space and water heating, with Ground Source Heat Pumps (GSHP) being comparable with gas under real operational conditions study [13]. Therefore it is difficult to identify how heat pumps could contribute to such significant CO2 reductions as forecast. On the other hand, this report confirmed that most heat pump installations had lower emissions than the other non-gas grid connected heating alternatives, hence the identified contribution that ASHP’s can make to CO2 abatement. In support of this, the aforementioned Office of Climate Change (OCC) report [3] also identified that the main opportunity for renewable heat, from an economic perspective, lies in off gas grid properties. Furthermore, other modelling studies have also identified ASHPs as yielding more CO2 savings than other low-carbon micro-generation heating technologies examined in the same study [14].

2.2. Heat Pump Performance—The Reality

There is a lack of published field trial data for heat pump installations in the UK, with specific studies focusing on user perception (e.g., internal warmth, ease of operation) and economic benefits rather than heat pumps performance in terms of efficiency [15,16,17]. In 2010 the EST [17] published a field trial report on heat pumps in the UK that identified that heat pumps performed at efficiency levels between 160%–220% and 180%–300% for air and ground source respectively, as illustrated in Figure 1. One other study conducted by Croft [18] had results broadly consistent with EST data. When the published studies are investigated more closely, it is concerning that many of the sites studied are clustered geographically and there is no indication whether this may skew the results in terms of ambient temperature, humidity, exposure, etc.
Figure 1. Energy Saving Trust (EST) field trial results. Data derived from [17].
Applsci 03 00338 g001
A study in New Zealand [19], which has a similar climate to the UK, investigated the energy performance of ASHP water heaters (i.e., no space heating) both in real-world installations and corresponding models, confirmed that efficiency can drop to as low as 100%–150%, for water heated to 60 °C and for an ambient temperature of 5 °C. This observation is consistent with other ASHP water heater studies [20] that compared performance with an increasing difference between ambient air temperature and water output temperature.
Studies carrying out sensitivity analyses on energy efficiency measures and CO2 emissions [21] identified that modest changes in boiler efficiency (baseline efficiency 70%) of ±10% could result in CO2 emissions varying by 5%. Furthermore, heating demand temperature and external temperature sensitivity analysis also contributed to variations of CO2 emissions by up to 15% and 5% respectively, however this was only as an influence on heat loss calculations and not as an influence on the heating source efficiency, as in the case of heat pumps.
The sensitivity analysis conducted by Firth [21], ASHP studies and modelling by Pollard [19] and the early EST field trial [17] evidence is of concern because, although some of these discrepancies are recognised in The Renewable Energy Review [6], the Government models still appear to be very optimistic with regards future performance and do not recognise the potential significant impact that poor performance of heat pumps could have on Government renewable and CO2 abatement targets. Furthermore, the current modelling methods and Government strategies tend to focus more on absolute values rather than looking at the probability distribution of emission levels or market penetration, for example, which is supported in work by Strachan [22].
In order to address these shortcomings, this study will use field trial data along with Monte Carlo analysis of heat pump efficiency and data from the English Housing Condition Survey (EHCS) [12] to ascertain the potential scale of the discrepancies of heat pump performance and introduce CO2 emissions and energy consumption probability distributions in to the modelling outputs.

3. Methodology

3.1. Standard Assessment Procedure (SAP)

The UK Government’s recognised methodology for calculating the energy performance of dwellings, and hence CO2 emissions, is SAP 2005 [8]. SAP is based on the BRE Domestic Energy Model (BREDEM) [7] which provides a framework for the calculation of energy use in dwellings. The method underpinning SAP was first published by the Government and BRE in 1993 and was updated a number of times until the publication of SAP 1998. As this study concentrates on the Government’s own forecasts for CO2 emission reduction and heat pump penetration, it is appropriate to use SAP 2005 [8] for the analysis.
Whilst a number of assumptions and generalisations are used within SAP, it does produce a reasonable estimate of the energy needs and CO2 emissions for UK housing when compared with more complex BREDEM models in that output values are similar despite the more simplified SAP methodology. A significant simplification is that SAP does not consider geographical location, so that any given property will yield the same result regardless of where it is located. This is important for this study, as location has been shown to be an important factor that affects CoP values [23]. However, due to the geographically clustered nature of the heat pump performance dataset used here, the influence of location on outputs in the present study is not significant. Furthermore, the sensitivity analysis conducted by Firth [21] supports the use of a simplified model as it identified that in BREDEM the most significant factor on heat pump CoP is external temperature in comparison to, for example, building configuration.
Despite the influence of external temperature on the outputs, no model identified during this study considers the effect that ambient temperature has on the efficiency of the heating system itself, i.e., it is only considered as part of the heat loss/gains calculation, therefore there is no way to properly model the influence of external temperature on the performance of a heat pump fitted property. This is an area that should be considered in further developments of BREDEM models as heat pump installations become more widespread.
The SAP inputs for heat pump and gas boiler performance were derived using a Monte Carlo (MC) modelling approach by producing a range of values following a particular probability distribution that broadly matched the heat pump distribution described previously.
In order to ensure that the results in this study were representative of the UK housing stock, the English Housing Condition Survey (EHCS) dataset from 2007 to 2008 was used, which contains data for over 16,000 properties. As such, the EHCS data along with some standard SAP assumptions were used as the primary input data for the SAP model. It should be noted that a shortcoming identified with the EHCS data was that the basis for certain assumptions were not available, such as that for the EHCS energy efficiency models.

3.2. Modelling Heat Pump and Gas Boiler Efficiency

Although the cumulative dataset from the various field trials is relatively small, it did provide an indication of the performance distribution for heat pumps, and a gamma distribution was ascertained to be a representative Monte Carlo (MC) input distribution for the efficiency of GSHP and ASHP. Subsequently gamma MC distributions were produced using the mean and standard deviation values shown in Table 1 as the definition factors for the distributions.
Table 1. Monte Carlo parameters for heating system performance.
Modelling ScenarioHeating System Performance
MeanStandard deviationMeanStandard deviation
Present2030
Field Trials ASHP215%55%--
Field Trials GSHP234%50%--
ASHP COP 2.0200%55%200%55%
ASHP COP 2.5250%55%250%55%
ASHP COP 4.5450%55%450%55%
Gas Boiler76%10%93%10%
The MC heat pump performance distributions were then applied as the heating system efficiency parameters for the SAP calculation with the EHCS dataset to produce a distribution of the energy requirement for a representative snapshot of the UK housing stock. To provide reference output distributions with which to compare the heat pump data, a gas boiler reference was modelled using a MC weibull distribution with the values shown in Table 1, along with an electrical resistive heating reference using a degenerate distribution of 100%. The input distributions for heat pump and boiler efficiencies are shown in Figure 2, Figure 3.
In addition to heat pump input distributions matching the field trials dataset, further distributions were produced in order to evaluate the sensitivity of the outputs to variations in the MC distribution mean input values for both heat pumps and gas boilers. It was considered unnecessary to evaluate the performance of both heat pump technologies as their input distributions were very similar as illustrated in Figure 2. The values described in Table 1 were chosen to represent:
  • ASHP COP 2.0—A poor performing heat pump;
  • ASHP COP 2.5—Heat pump performing as per SAP/BREDEM default;
  • ASHP COP 4.5—Heat pump performing at the level expected by 2030 [6].
Figure 2. Heat pumps Monte Carlo (MC) performance input distribution.
Applsci 03 00338 g002
Figure 3. Gas boiler MC performance input distribution.
Applsci 03 00338 g003

3.3. Annual Energy Consumption and CO2 Emissions

The total annual energy consumption per property was calculated which included all items contained within the SAP model, i.e., Primary space and water heating, secondary resistive heating (e.g., fan heater), central heating pumps, lights and appliances. Total annual CO2 emissions per property were calculated using the total energy consumption and the CO2 emissions intensity values of the national electricity and gas grids [24], also shown in Table 2. It should be noted that the projected electricity grid emission factor for 2030, though consistent with UK Government projections, is subject to considerable uncertainty given possible future scenarios relating to political, social and techno-economic factors [25]. Importantly, these include risks and uncertainties related to the development of the UK’s proposed fleet of new nuclear generation facilities.
Table 2. Energy source emissions factors.
Energy SourceEmissions Factor (kg CO2 per kWh)
Electricity Grid—Present0.55
Mains Gas Grid—Present0.19
LPG—Present0.21
Oil—Present0.27
Electricity Grid—20300.05
Probability and cumulative distributions of total annual property energy consumption and CO2 emissions were produced in order to illustrate how heat pump technologies performed when compared with traditional gas boiler central heating and electrical resistive heating. A cumulative distribution was also produced to illustrate the performance that could be expected of the majority of properties.
In order to ascertain how the variability of performance of heat pumps may affect emissions with penetration levels of 55% and 75% (equivalent to 12.1 million and 16.5 million installations respectively) and the planned decarbonisation of the electricity grid, the mean energy consumption for the 16,000 EHCS properties was extrapolated to cover the entire English housing stock of 22 million properties. By 2030 it is expected that the English housing stock will have grown to 27 million properties; however with the forthcoming tightening of building regulations in 2016 [26], the extra 5 million properties are assumed to be zero carbon, i.e., no CO2 emissions [27]. As a result of this assumption, all the comparison scenarios consider the 22 million properties in the current housing stock only and then project their emissions performance to 2030.
A baseline measure was used that represents the current housing stock; based upon the EHCS (16,000 properties), there is broadly a split of 85% gas central heating and 15% non-central resistive electric heating [12,28], along with other heating types such as oil or LPG boilers and district heating. However, these are of a sufficiently small penetration (<3%) to be disregarded in this case. Furthermore, the total average heating efficiency across the housing stock is cited as being 74% [28], which is broadly consistent with the current UK gas boiler efficiency benchmark, and the emission factors for LPG and oil (the other non-gas grid yet centrally heated heating sources), Table 2, are close to that for natural gas.

4. Results and Discussion

4.1. Validation

Before analysing the output data in depth, validation of the SAP-based model was carried out. Comparing the material and ventilation heat loss values for 2006 from the Domestic Energy Fact File 2008 (DEFF 08) [28] with those from the model, a total variation of around 2% is evident. This indicates an acceptable level of accuracy. The large discrepancy for the heat loss value for the roof could be down to the fact that the assumption for the roof area may be incorrect as well as the assumption that the entire roof area has the same level of insulation. Despite this discrepancy, the other individual values and the total are within acceptable limits of the DEFF 08 values.
A heat loss value that is included in the model that is excluded from DEFF 08 is that for thermal bridging. At a mean of 30 W/K, this value does make a reasonable contribution to the mean total heat loss parameter (280.7 W/K). This is an oversight that should perhaps be considered with later publications of DEFF.
A second output parameter that bears comparison with DEFF 08 values is that for total annual energy consumption per household for that part of the model that considered a gas boiler installation at a mean efficiency of 76%. As can be seen in Table 3 there is only 1% discrepancy, thus once again indicating the model is producing meaningful results.
Table 3. Model validation comparison.
Average Dwelling Heat Loss W/K
DEFF 08 aModelDifference
Walls97.198.72%
Windows & Doors61.564.34%
Roof18.615.4−21%
Floor 20.521.02%
Ventilation49.051.24%
Total246.7250.62%
Average Annual Dwelling Energy Consumption (kWh)
DEFF 08ModelDifference
Total20,30520,4661%
a Domestic Energy Fact File 2008 [28].
Firth [21], using an older EHCS dataset from 2001 and a modified version of the BREDEM-8 model called CDEM, showed an average dwelling heat loss value of 261 W/K and an annual energy consumption of 23,989 kWh across all 21,000 dwellings in the dataset. The model developed for this study compares well with this, as properties have seen efficiency improvements over the intervening years between the two EHCS studies. Furthermore, DEFF 08 gives values for 2001 as 268 W/K and 22,472 kWh respectively, both values very close to those from Firth, indicating that DEFF 08 is a reasonable benchmark to evaluate the validity of BREDEM based models. A further validation for DEFF being used as a benchmark is found in work by ECI [29] which gives annual household energy values from two different models of 22,606 kWh for 1996 and 22,335 kWh for 2000 compared with DEFF values of 23,139 kWh and 21,964 kWh respectively—a 2% and 3% deviation from DEFF.
Whilst not the primary focus of this study, it was considered important to evaluate the total energy consumption per property, including all thermal energy requirements, along with lights and appliances as calculated by the SAP model. When total annual energy consumption is evaluated, the results highlight that even poorly-performing heat pumps contribute to a significant reduction in total consumption per property. This is illustrated in Figure 4, where the maxima for both heat pump technologies is significantly lower than those for electric and gas heating respectively. The cumulative distribution also identifies that around 85% of heat pump-fitted properties will consume less than 10,000 kWh energy compared with only 15% of gas boiler fitted properties and 30% of electrically heated properties.
Figure 4 also shows the mean annual energy consumption for heat pump-fitted properties as being between 8200 kWh (GSHP) and 8900 kWh (ASHP), whereas that for gas boiler fitted properties is 20,400 kWh. This is a reduction in annual energy consumption of between 56% and 60% when compared with gas boilers. A further comparison was made with electric resistive heating operating at 100% efficiency, this being representative of properties that are not on the gas distribution network. For these properties, the mean annual energy consumption is 15,650 kWh. This represents a 43% and 48% reduction in consumption for ASHP and GSHP-fitted properties respectively (Table 4).
Although non-thermal energy use is included in the total, this on average is around 800 kWh (based upon the floor areas of the properties) and so only has the effect of shifting the curves slightly to the right. However, the basic profiles remain the same when a comparable plot was produced that excluded non-thermal energy requirements. Lights and appliances are a larger percentage of the overall energy consumption for heat pump fitted properties due to the fact that these properties use less energy for the same thermal load than the equivalent gas boiler fitted property. Despite this, it does not significantly affect the results. Removing one element of the energy consumption of a property would not provide a realistic picture, particularly as the presence of lighting and appliances contributes to the overall heat gains for the property—i.e., if it is included for heat gains, it should remain for energy consumption.
Figure 4. Annual energy consumption per property.
Applsci 03 00338 g004
Table 4. Annual energy consumption per property fitted with different heating technologies.
Heating TechnologyMean EfficiencyMean Annual Energy Consumption (kWh)Percentage Decrease Compared with GasPercentage Decrease Compared with Resistive Electric
Gas Boiler76%20,400--
Resistive Electric100%15,65023%-
Air Source HP215%8,90056%43%
Ground Source HP234%8,20060%48%
Although from an energy consumption perspective, heat pumps operating even at a relatively low level of expected performance realise fairly significant reductions in energy consumption, the increased running cost implication of these results is significant; despite the reduction in energy use, the higher cost of electricity compared with gas, not to mention the capital cost of the heating hardware, may negate any perceived financial savings. These results are only likely to be of interest in terms of planning nationwide power generation strategies as a reduced electrical energy requirement translates to a reduced power generation capacity, i.e., less power stations. The results could be of interest when targeting non-centrally heated properties once the cost of energy is factored in.

4.2. CO2 Emissions for Individual Properties

When CO2 emissions are considered, by contrast the performance of the heat pumps has a very significant influence on the overall performance of the properties. Using CO2 emission factors of 0.545 and 0.185 kg CO2 per kWh of grid electricity and natural gas respectively [24], the distributions shown in Figure 5 are produced.
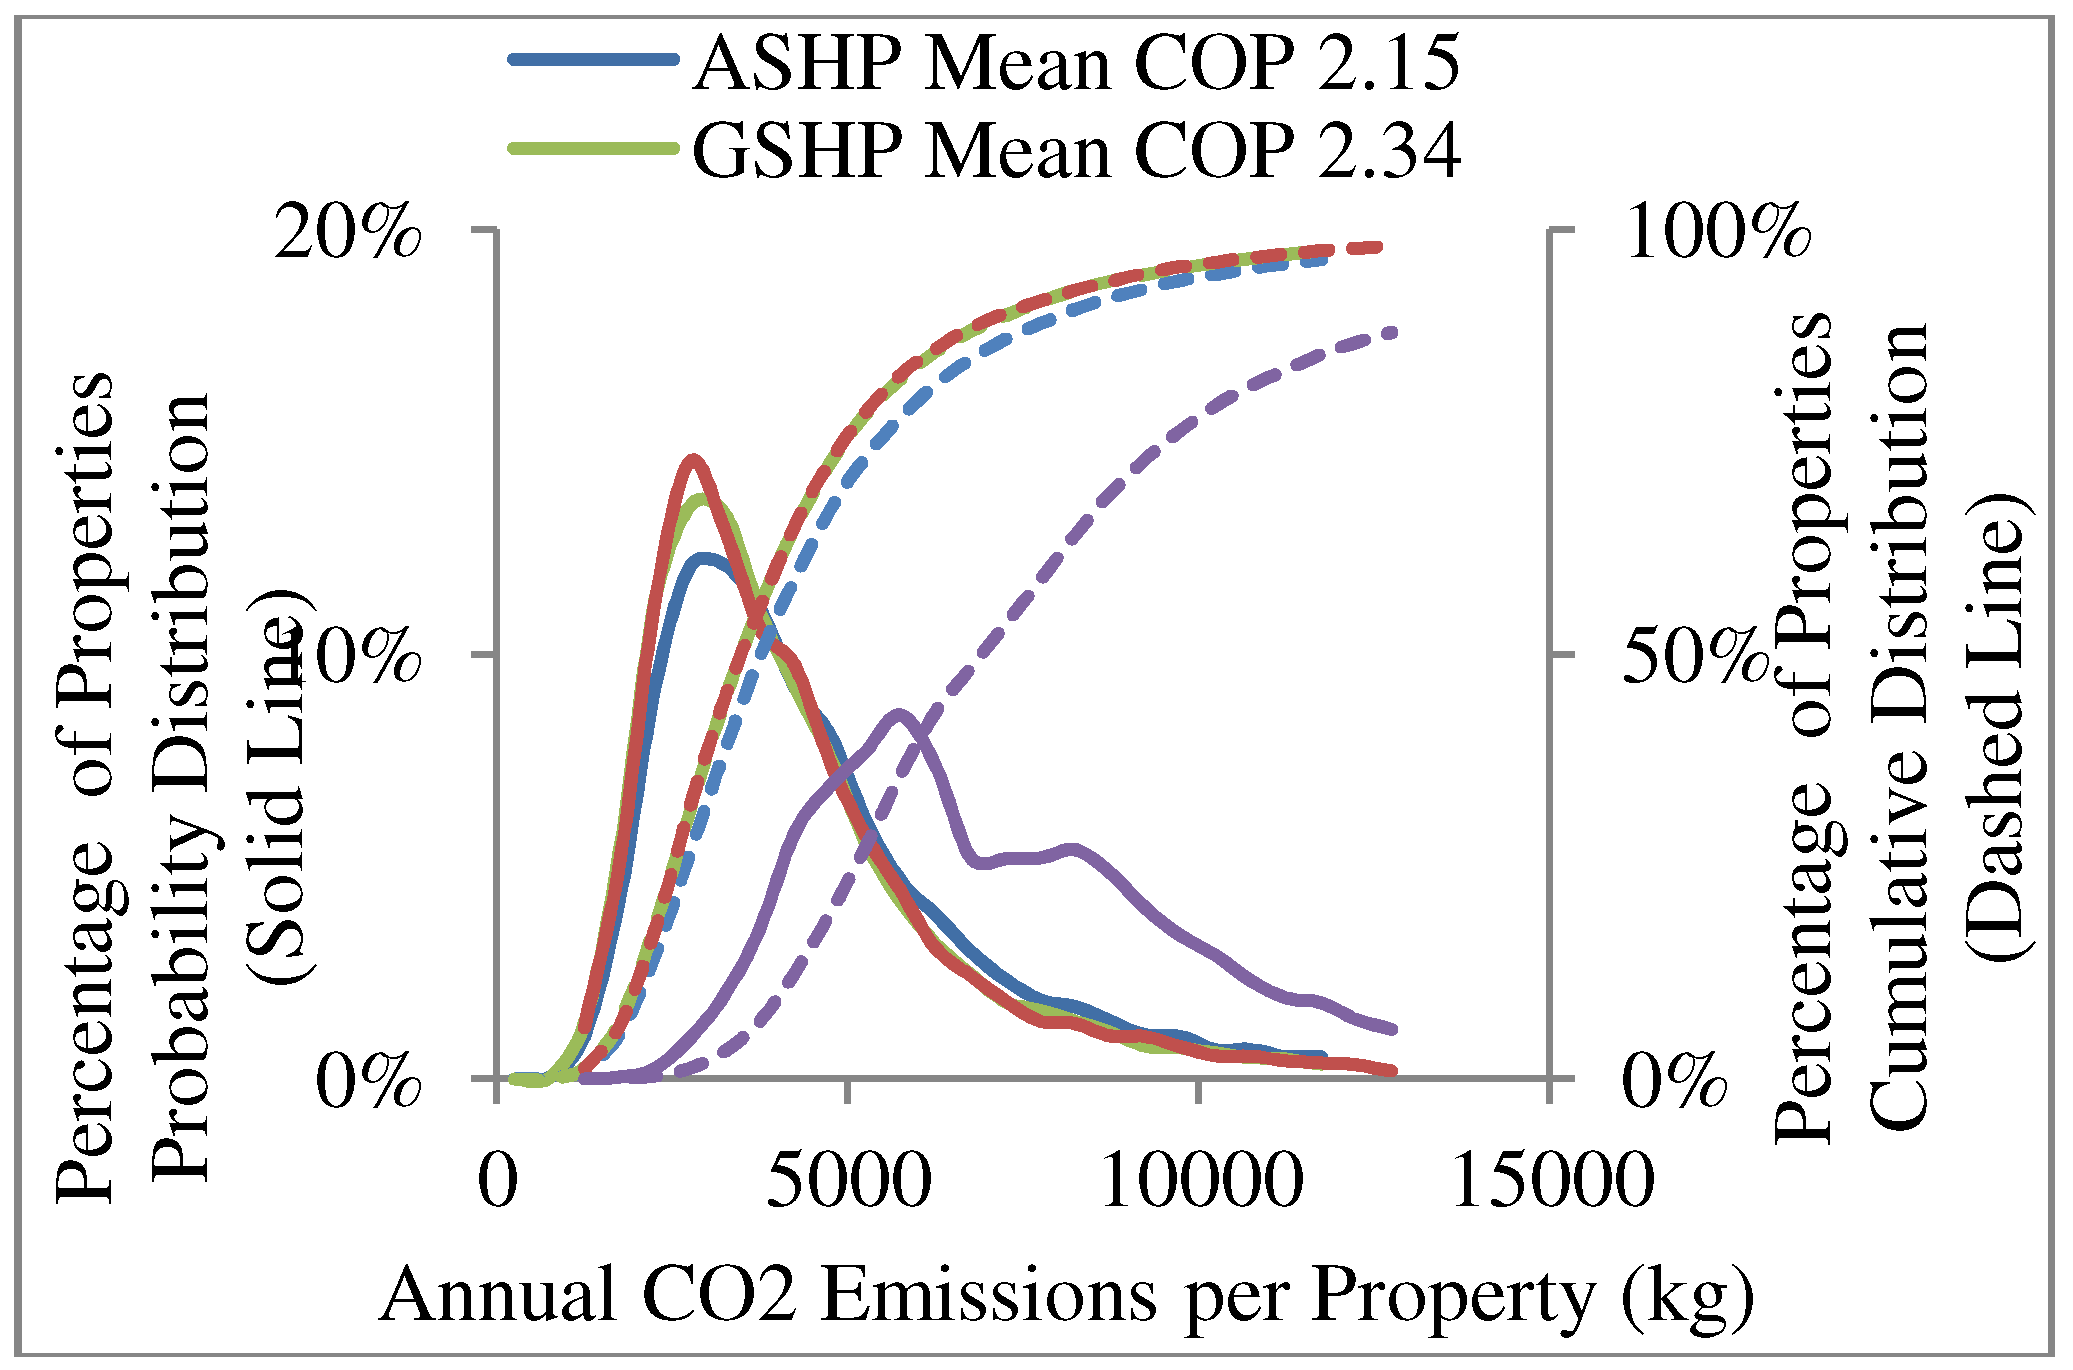
Figure 5. Annual CO2 emissions for heat pumps operating at field study levels of performance.
Applsci 03 00338 g005
These distributions illustrate that with heat pumps operating at the levels of efficiency indicated by the field trials, total property CO2 emissions are very similar to that of a gas boiler fitted property. Looking closer at the results in Table 5, both heat pump technologies show higher CO2 emissions than gas boiler fitted properties, with mean annual emissions of 4485 kg CO2 per year compared with 4858 kg CO2 for ASHP and 4512 kg CO2, an 8% and 1% increase in emissions respectively.
Table 5. Annual CO2 emissions for properties fitted with different heating technologies.
Heating TechnologyMean EfficiencyMean Annual CO2 Emissions (kg)Percentage Increase Compared with GasPercentage Decrease Compared with Resistive Electric
Gas Boiler76%4485--
Resistive Electric100%853390%-
Air Source HP215%48588%43%
Ground Source HP234%45121%47%
This similarity between gas boiler and heat pump emissions is due to the fact that the emissions factor for the electricity grid is around 3 times that of natural gas; therefore with heat pumps operating at 3 times the efficiency of gas boilers the distributions are similar.
Referring to the cumulative distribution curve, it can be seen that 70% of properties have emissions at or below the headline mean values which illustrates that focusing solely on mean values is not sufficient for an accurate analysis. Further studies of the data may be able to identify the characteristics of the 30% of properties that are above the mean in order to better target efficiency and technology measures that may have greatest impact. When the distributions are compared with electric resistive heating, there are significant reductions in emissions of between 43%–47% with heat pump fitted properties as shown in Table 5.
In order to evaluate the impact of heat pump operational efficiency on property CO2 emissions, further analysis was conducted by adjusting the input mean of the MC distribution as described in Section 3.2 with the values shown in 
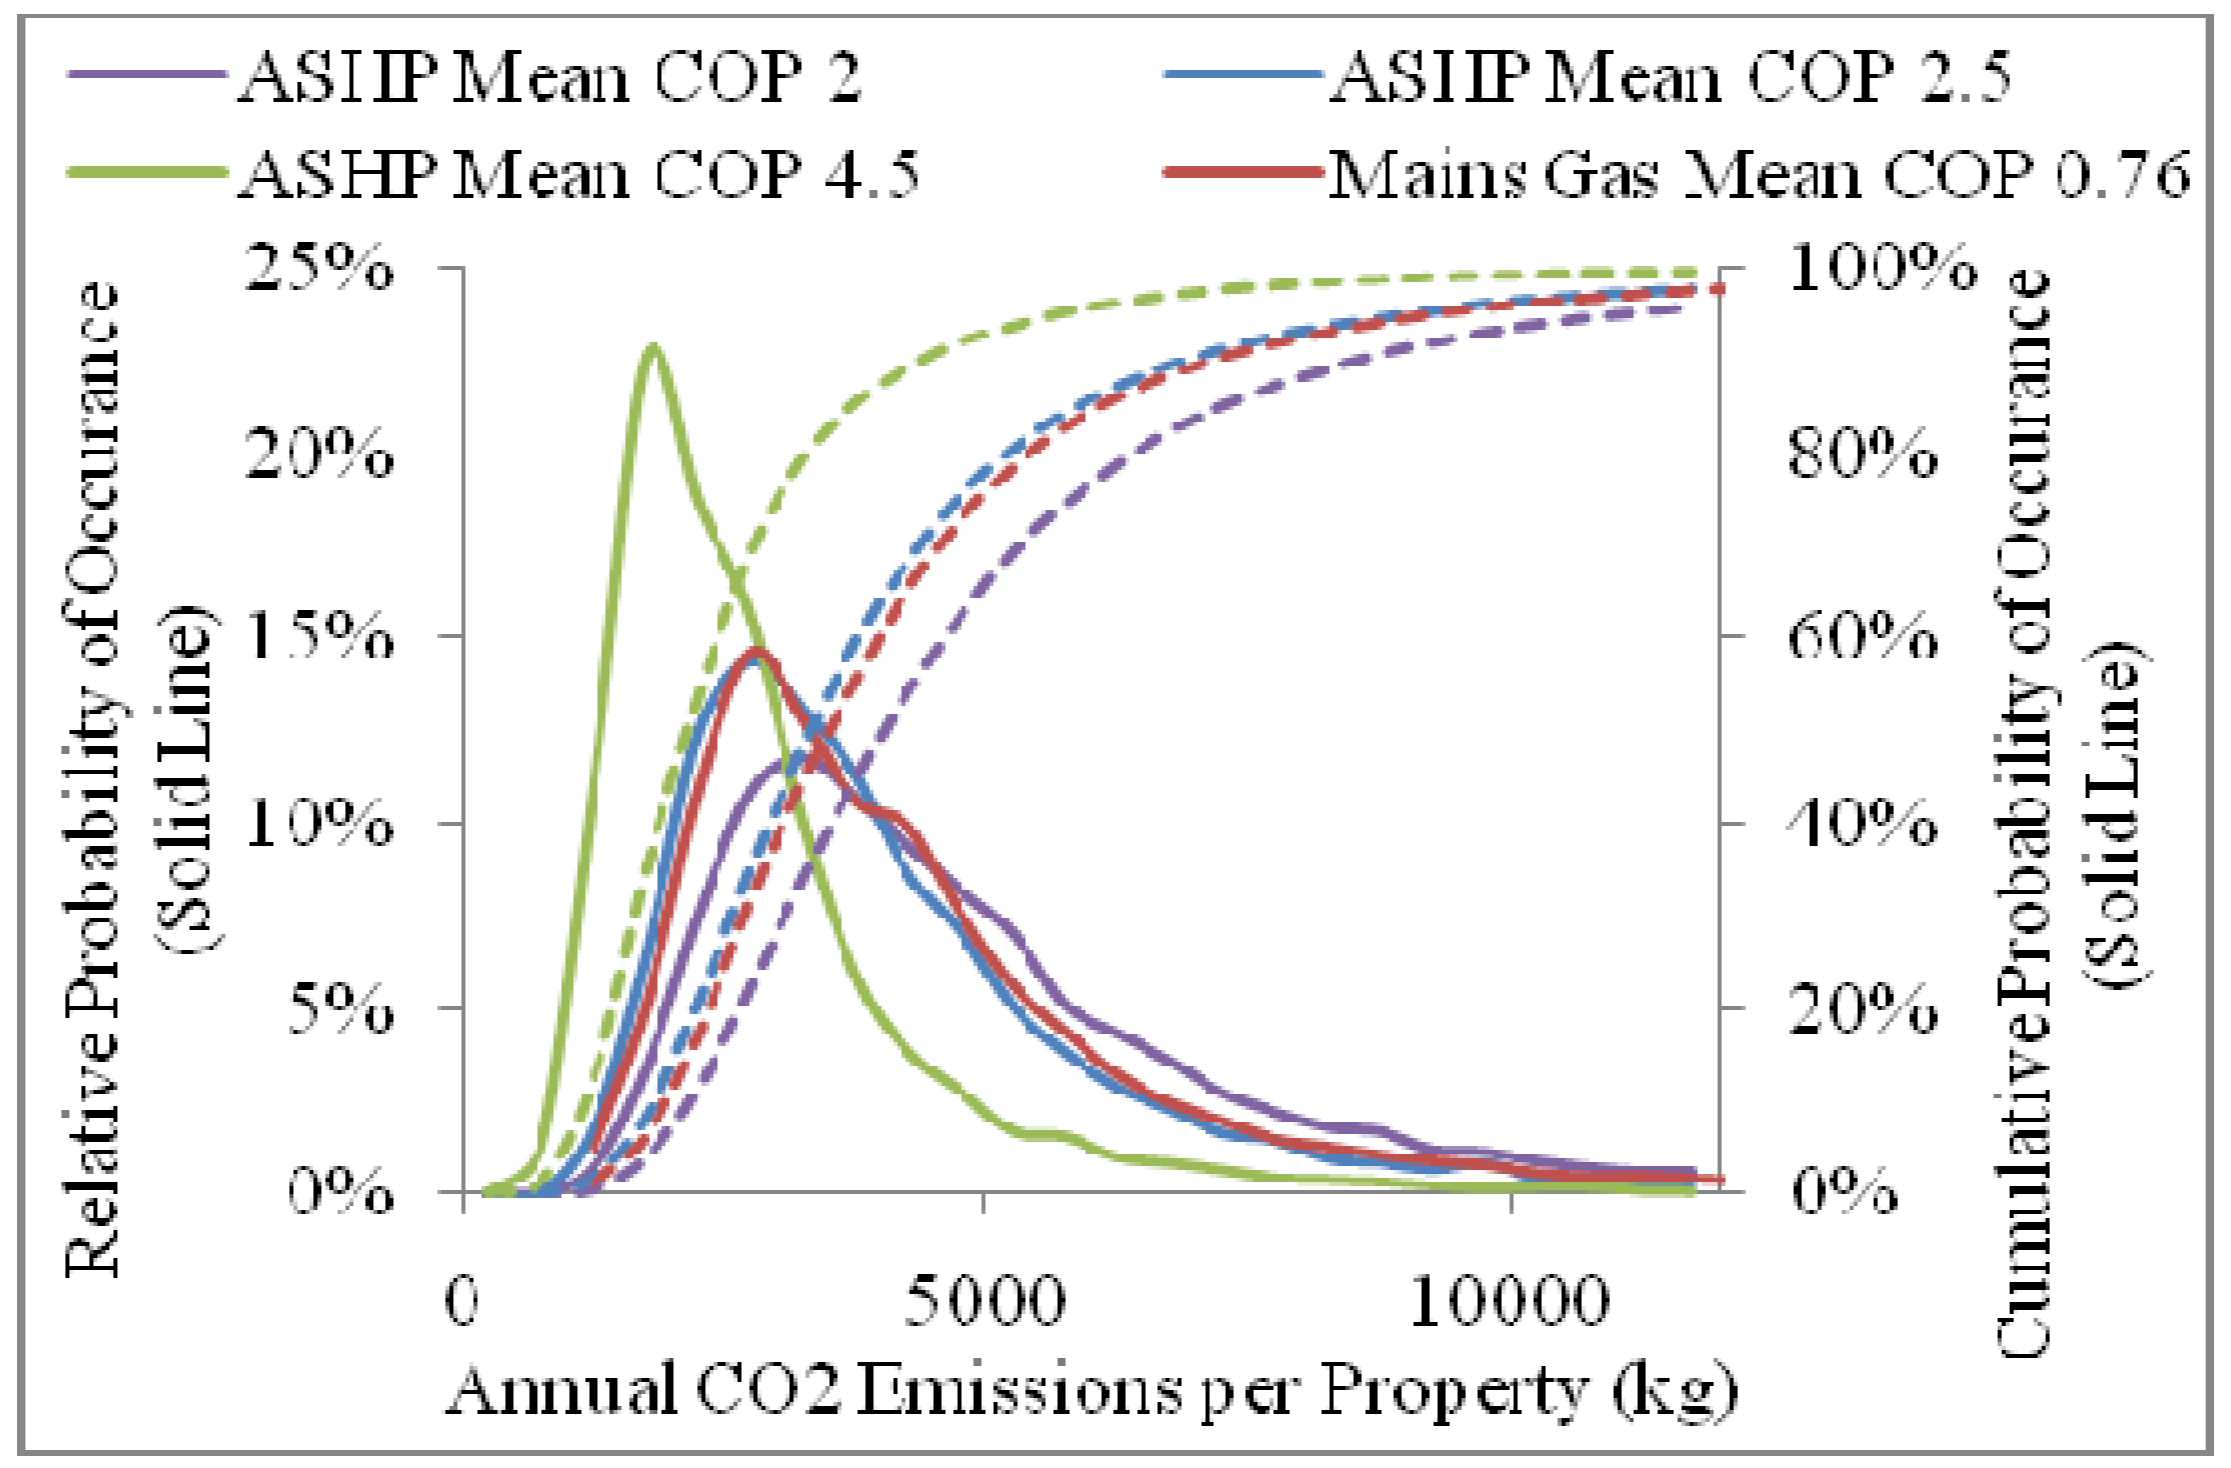
Table 1. The outputs of this sensitivity analysis are illustrated in Figure 6. As observed previously for ASHPs operating at performance levels recorded in field trials, CO2 emissions are similar to or worse than a gas boiler fitted property. When performance is assumed to be at the level assumed by BREDEM and SAP models (250%), emissions are still only comparable with a gas boiler operating at current mean levels of performance, i.e., 76% efficient.
Figure 6. Annual CO2 emissions for ASHPs.
Applsci 03 00338 g006
If performance levels are assumed to be those expected in 2030, i.e., 450%, there is a much greater reduction in emissions. Operating at this level of performance, mean annual emissions reduce to around 2840 kg CO2, a fall of 40% when compared with a gas alternative. In addition, the cumulative distribution indicates that 70% of properties would emit less than 3000 kg CO2.
From a probabilistic perspective, at current grid emissions intensity, the cumulative distributions indicate a 70% probability that a given property will emit less than 2800 kg CO2 (the mean value for a 450% efficient heat pump property) if they are fitted with a heat pump operating at 450% efficiency. However, there is only a 37% probability that the heat pump is operating at the default BREDEM efficiency of 250%, with this falling to 24% for an ASHP operating at 200%, as shown in Table 6.
Table 6. Emissions probability for a given emissions level.
Heat Pump Performance (% Efficiency)Probability of Emissions Below 2800 kg CO2
20024%
25037%
45070%
If the electric resistive heating distribution (Figure 5) was also included in this analysis, an even greater decrease in emissions is indicated for more efficient heat pumps relative to the resistive heating alternative. In this case, a reduction in emissions is indicated due to an improvement in the efficiency of heat pumps expected by 2030, but does not include an increase in the housing stock volume, any improvements to the housing stock nor a reduction in the CO2 emissions intensity of the electricity grid.

4.3. CO2 Emissions for the Whole English Housing Stock

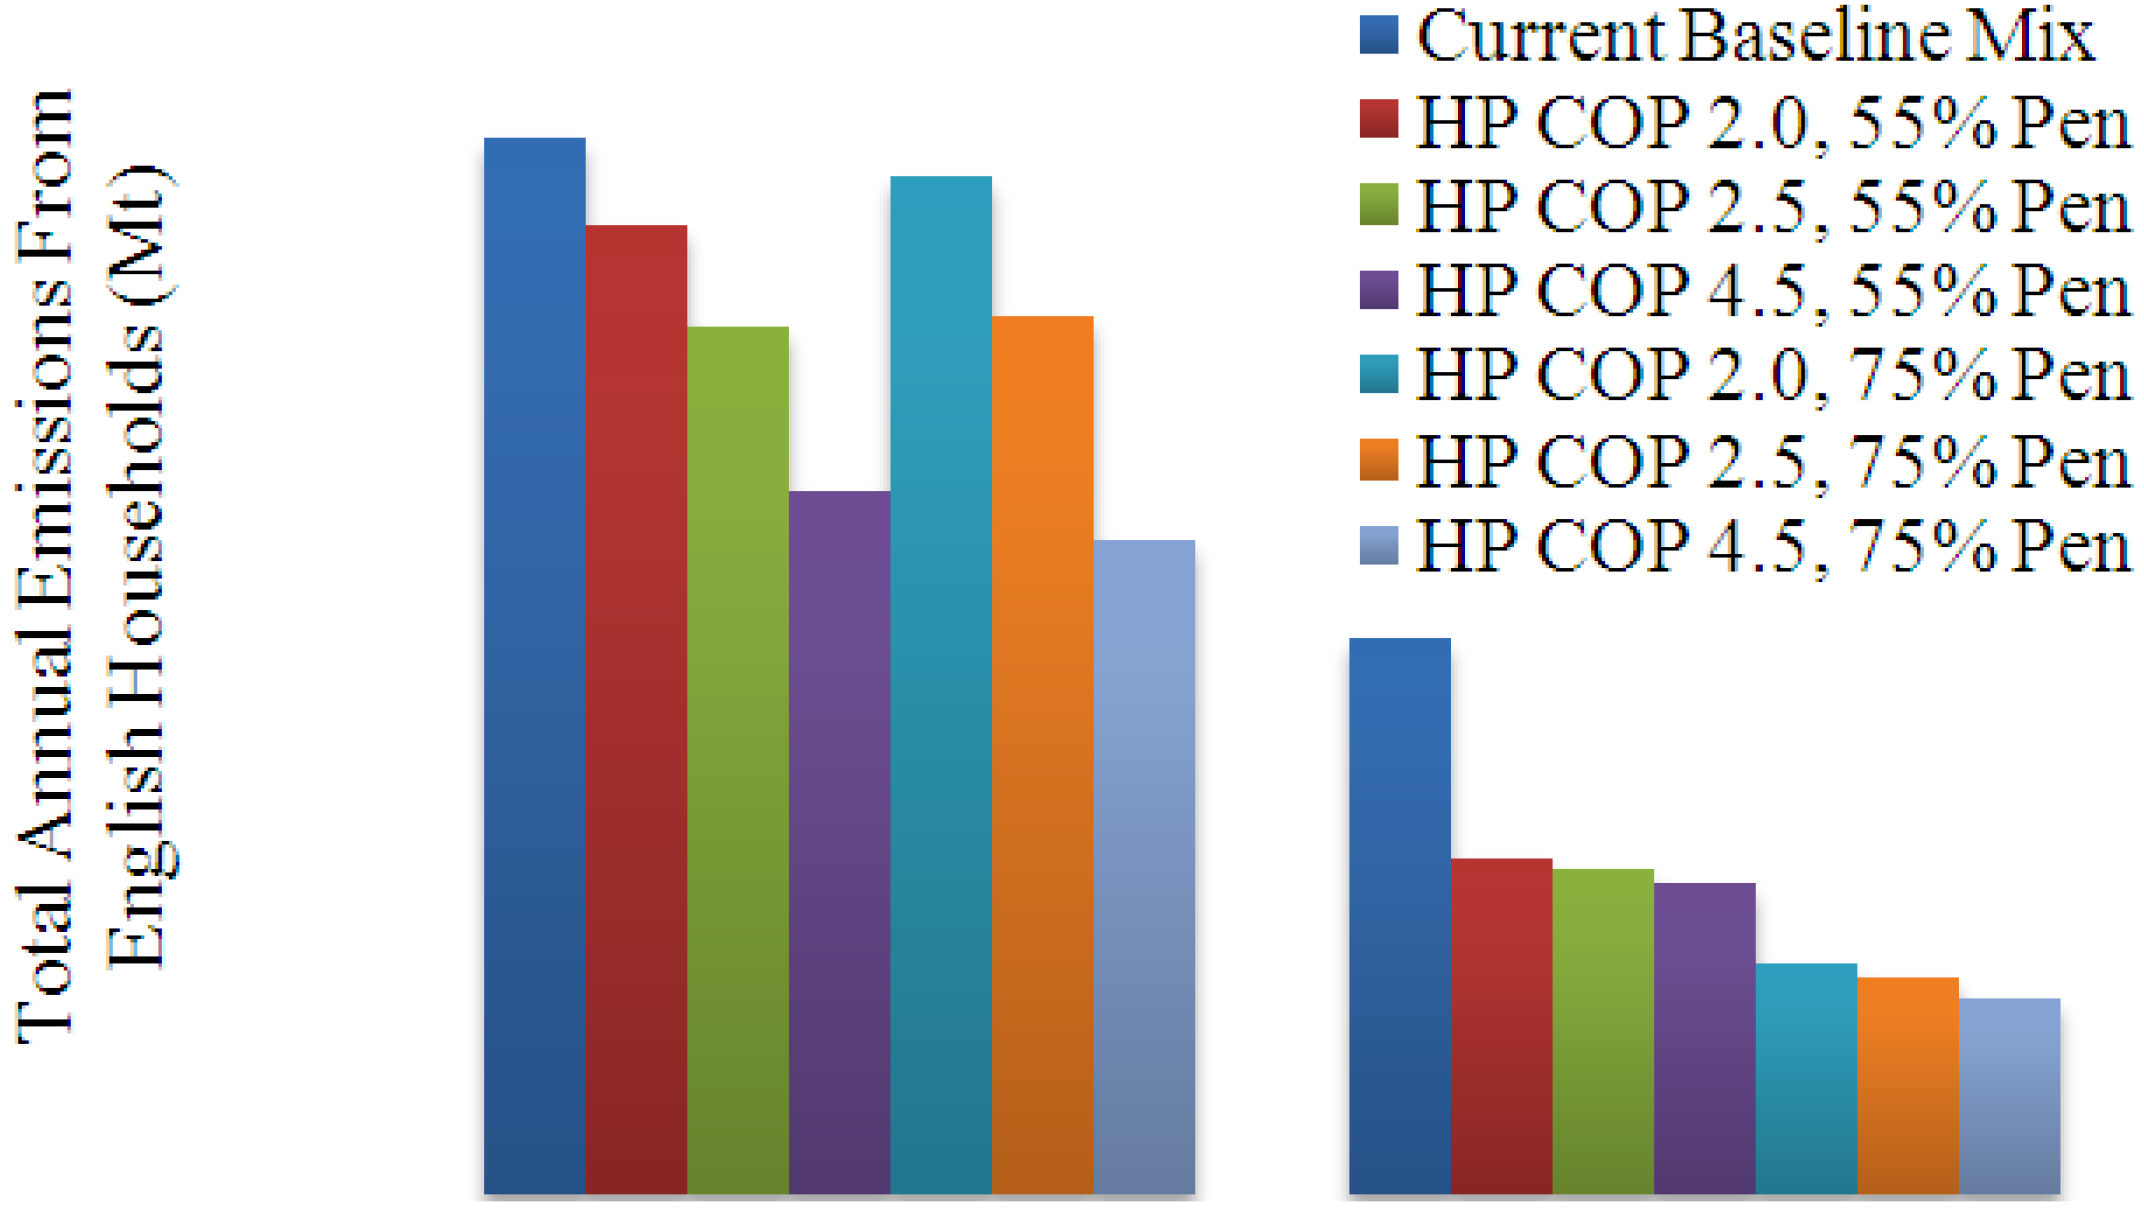
Assuming that the 16,000 properties described in the EHCS are representative of the whole of the English housing stock, it is reasonable to extrapolate mean CO2 emissions to the 22 million properties that currently exist in England, giving a baseline estimate of emissions of 112 Mt CO2. Assuming this and the other assumptions described in Section 3.3, a series of scenarios have been modelled with the results detailed in Table 7 and summarised in Figure 7, Figure 8.
Table 7. 
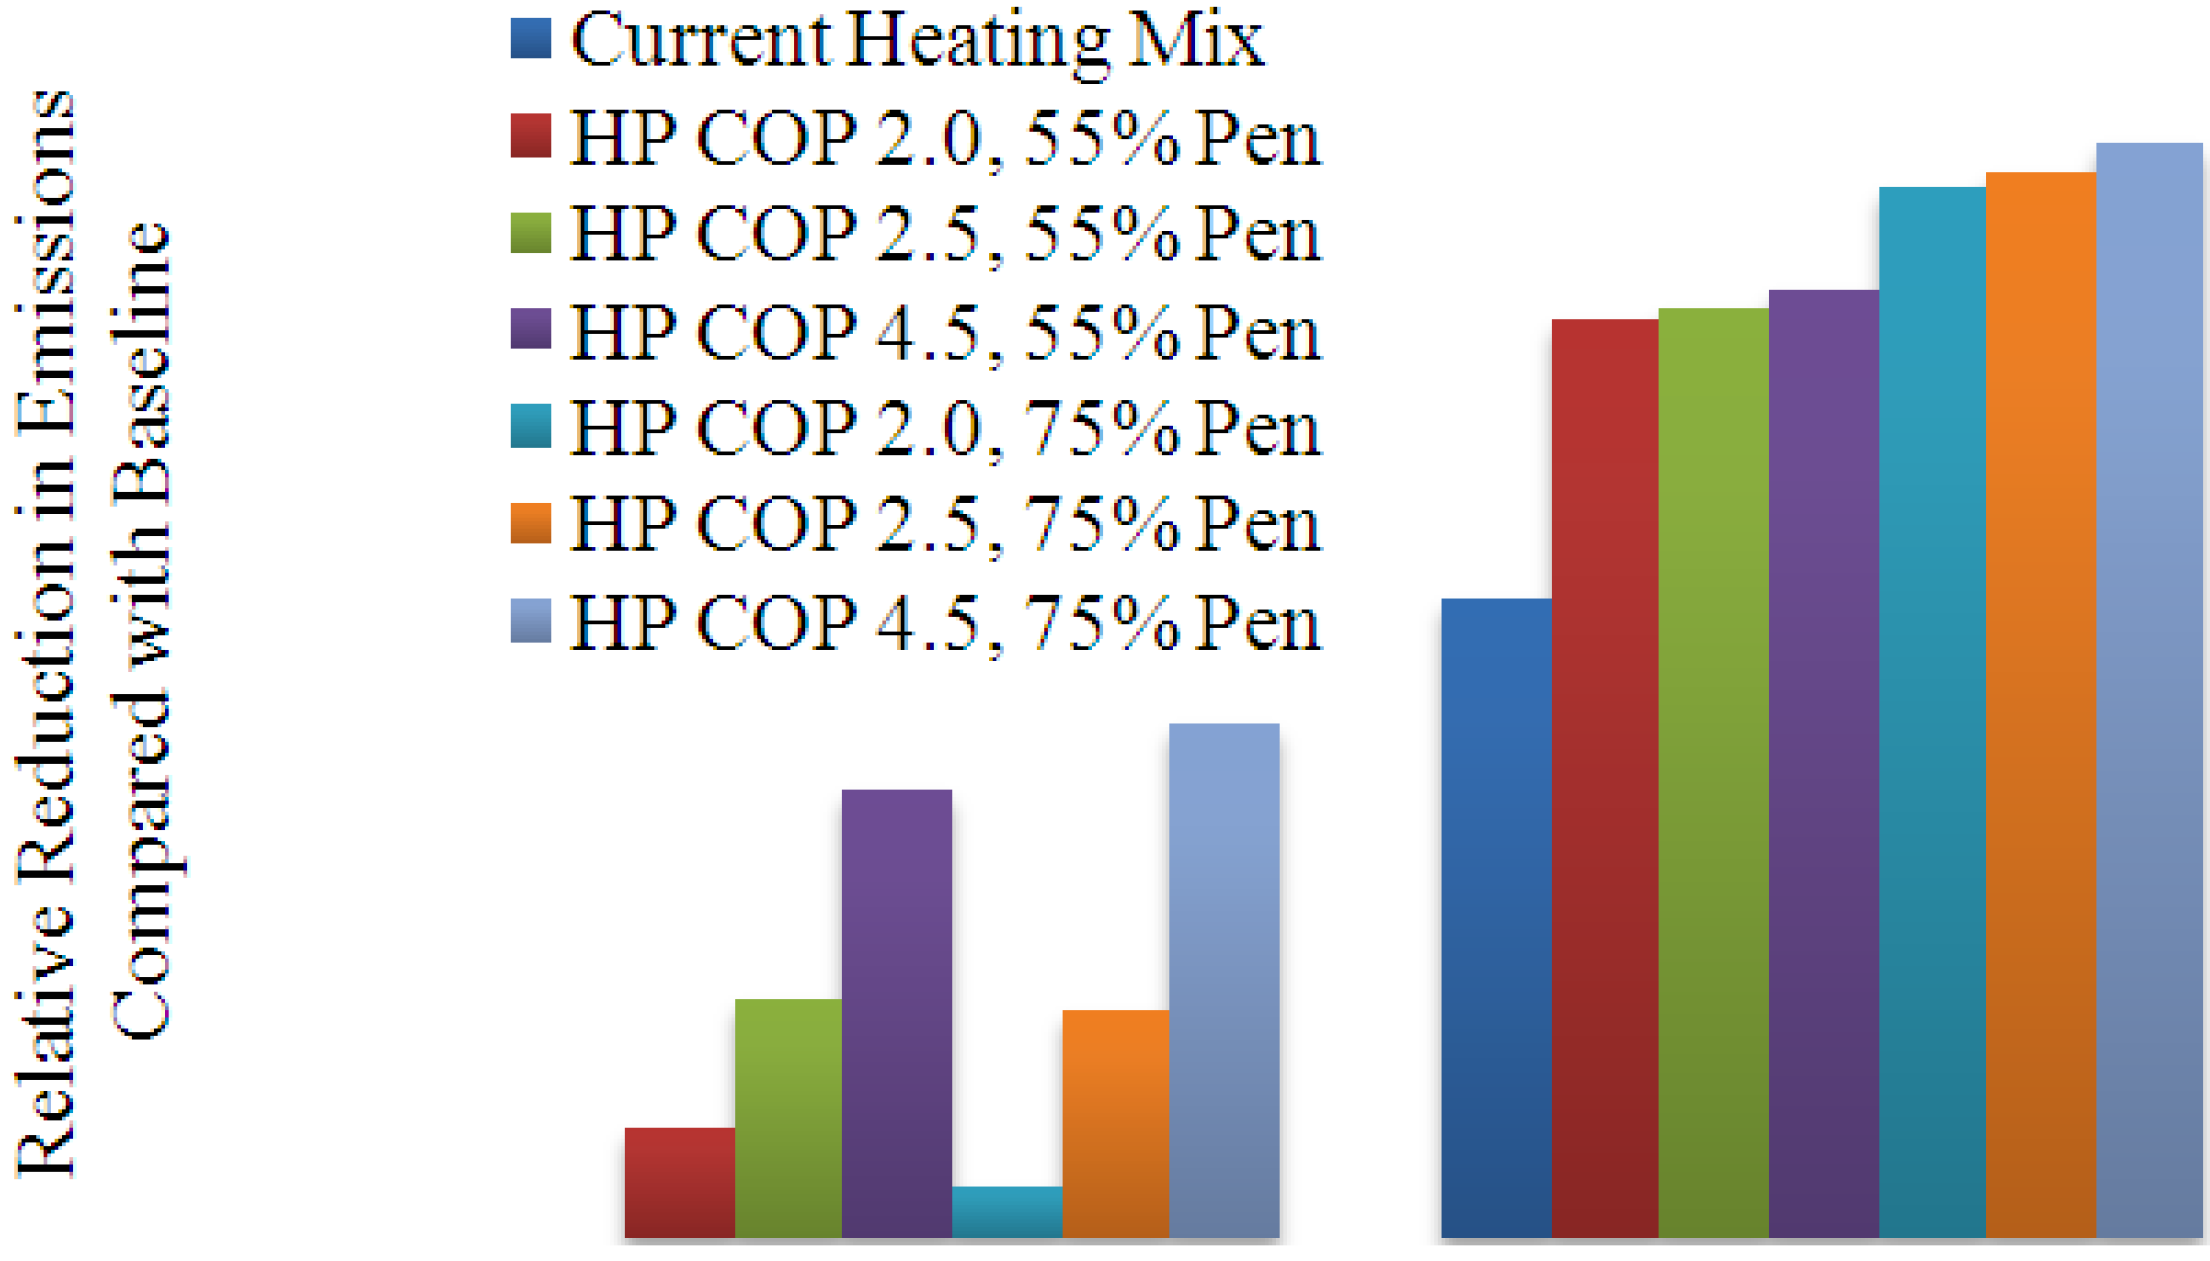
Total estimated English household CO2 emissions for different technology performance and penetration levels at current and aspirational electricity grid emission intensities.
DescriptionGrid Emission Intensity aHeating Technology Mix bTotal Annual CO2 Emissions From English Households (Mt)Relative Reduction in Emissions Compared with Baseline
Only GasCurrent100% B7699-
Current Baseline MixCurrent85% B76:15% R112Baseline
HP COP 2.0, 55% PenCurrent45% B76:55% HP21038%
HP COP 2.5, 55% PenCurrent45% B76:55% HP2.59218%
HP COP 4.5, 55% PenCurrent45% B76:55% HP4.57533%
HP COP 2.0, 75% PenCurrent25% B76:75% HP21083%
HP COP 2.5, 75% PenCurrent25% B76:75% HP2.59317%
HP COP 4.5, 75% PenCurrent25% B76:75% HP4.56938%
Current Heating Mix203085% B93:15% R5947%
HP COP 2.0, 55% Pen203045% B93:55% HP23668%
HP COP 2.5, 55% Pen203045% B93:55% HP2.53569%
HP COP 4.5, 55% Pen203045% B93:55% HP4.53371%
HP COP 2.0, 75% Pen203025% B93:75% HP22478%
HP COP 2.5, 75% Pen203025% B93:75% HP2.52379%
HP COP 4.5, 75% Pen203025% B93:75% HP4.52181%
a See Table 2 for grid emissions intensity; bB76 = Gas Boiler with mean efficiency of 76%, B93 = Gas Boiler with mean efficiency of 93%, R = Resistive Heating at 100% efficiency, HP2 = Heat Pump at COP of 2 (200% efficiency), HP2.5 = Heat Pump at COP of 2.5 (250% efficiency), etc. An increase in gas boiler efficiency is assumed for 2030 given increasing performance standards within the UK regulatory framework.
For the current electricity grid CO2 emission intensity, it is evident that at a heat pump penetration level of 55%, heat pumps performing at a mean CoP of 450% will realise an emissions reduction of 33%. With the penetration level increased to 75%, the emissions reduction increases to 38%. At the same grid emissions level and heat pumps operating at 250%, there is virtually no difference to the emissions reduction level of 17%–18% whether there is a 55% or 75% penetration level. At heat pump efficiencies of 200%, the reduction in emissions for 55% to 75% penetration levels is 8% and 3% respectively, i.e., there is a smaller reduction in emissions with a greater level of heat pump penetration. This anomaly for heat pumps operating at 200% is due to the smaller percentage of efficient gas boilers (93% efficiency in 2030) with a significant increase in relatively poor performing electrical heating systems within a high emissions grid. Thus, it can be seen that given the current emission factor ratio for electricity and gas respectively (2.78), for households currently heated by efficient gas boilers, only heat pump CoPs greater than 2.78 will deliver reduced GHG emissions for households.
Figure 7. Emissions reduction at different electricity grid emissions factors, heat pump efficiencies and penetration levels.
Applsci 03 00338 g007
Figure 8. Emissions at different electricity grid emissions factors, heat pump efficiencies and penetration levels.
Applsci 03 00338 g008
With a dramatic reduction in the electricity grid emissions intensity, Figure 7 shows that at a heat pump penetration level of 55%, heat pumps performing at 450% will now realise an emissions reduction of 71%. With the penetration level increased to 75%, the emissions reduction increases to 81%, i.e., a further 10% fall compared with only 5% for the high emissions scenario. This picture of an additional 10% improvement with an increase in penetration level is broadly repeated with lower efficiency heat pumps, i.e., 68%–78% and 69%–79% for heat pumps at 200% and 250% respectively. It is interesting to note that improvements in heat pump efficiency has very little overall effect in reducing emissions with there being only an additional 3% reduction with the heat pump efficiency moving from 200% to 450%.
Looking at the different scenarios and how they are illustrated in Figure 7, Figure 8, it can be seen that the largest impact on the reduction of CO2 emissions across the English housing stock comes from reducing the emissions intensity of the electricity grid. Even with no heat pumps installed, a CO2 emission reduction of 47% is achievable. This emissions reduction value can be improved upon if there is a significant penetration of heat pumps, with an 81% reduction possible at a 75% level of penetration. Moreover, improved heat pump performance has little overall effect on this reduction. This demonstrates that the majority of future emissions reduction arises from the reduction in CO2 emissions intensity from the electricity grid rather than any improvement in heat pump efficiency. However, it should be noted that given the aforementioned uncertainty in projecting the UK electricity grid emission factor out to 2030, the “best case” emission scenario should be considered within this context. Parametric analysis shows that, given a pragmatic scenario of a 2030 emission reduction of 50% below current levels, then CO2 emissions would be greater than the “best case” by a factor of 5.

4.4. Discussion

Heat pumps operating at the levels observed in recent UK field trials are disappointing and demonstrate that with the current emissions intensity of the electricity grid, heat pumps aren’t capable of contributing significantly to CO2 reductions when considered as a replacement for gas boilers. Where heat pumps do demonstrate benefits, even operating at these disappointing levels of performance, are as a replacement for electric resistive heating. This is clearly illustrated in Figure 4, Figure 5 by the fact that the heat pump performance distributions are significantly above those for electric heating in comparable properties.
By evaluating UK Government strategy in depth [4,5], it is found that the probability of energy consumption and emissions for a property fitted with ASHP or GSHP is around half that of the mean of the resistive heating alternative, i.e., 7500 kWh and 4000 kg CO2 respectively, is shown in Table 8.
Table 8. Probability of heat pump energy consumption and CO2 emissions being half of that of resistive heating alternative.
Heating Technology and EfficiencyProbability of Annual Energy Consumption Below 7500 kWhProbability of Annual Emissions Below 4000 kg CO2
Resistive Heating (100%)12%10%
ASHP (215%)64%54%
GSHP (234%)72%60%
It is relevant to evaluate this subset of heating type, as electric non-central heating falls into the Government classification of a Hard to Treat (HTT) or Hard to Heat home [30]. Furthermore, as identified in Section 4.2, a greater than 40% reduction in energy consumption is indicated with a heat pump, even when operating at poor levels of performance, which for a household living in fuel poverty would be a welcome saving. From the EHCS it is possible to identify 451 households (3% of the EHCS dataset) which have electric heating and are in fuel poverty, and a further 4.5% [30] are not classed as fuel poor but still have electric heating. Extrapolating these values suggests that 639,000 of the total English housing stock fall into the fuel poverty subset with a further 1 million utilising electric resistive heating.
By considering hard-to-heat and fuel poor households, it is possible to develop a prioritisation plan for heat pump roll-out that does not necessarily require the highest performance efficiencies in order to deliver savings in both energy consumption and CO2 emissions. Phase 1 would begin with the 639,000 homes electrically heated homes in fuel poverty. The followed phase would include the remaining 1 million electrically heated homes. The net and relative emission reductions across the English housing stock are shown in Table 9; this shows that even heat pumps performing at or below efficiency levels recorded in UK field trials could deliver real emissions savings.
Table 9. Annual emission reductions resulting from a phased heat pump installation strategy for all electrical resistive heated homes—phase 1 in fuel poverty, phase 2 the remainder.
DescriptionGrid Emission Intensity a Heating Technology Mix bReduction in CO2 Emissions From English Households (Mt)Relative Reduction in Emissions Compared with Baseline Total
HTT & Fuel PovertyHTT, Not Fuel PovertyTotalHTT & Fuel PovertyHTT, Not Fuel PovertyTotal
HP COP 2.0Current100%HP22.23.35.52.0%3.0%4.9%
HP COP 2.5Current100%HP2.52.84.27.02.5%3.7%6.3%
HP COP 4.5Current100%HP4.53.85.69.43.4%5.0%8.4%
HP COP 2.02030100%HP25.38.013.34.8%7.1%11.9%
HP COP 2.52030100%HP2.55.48.113.44.8%7.2%12.0%
HP COP 4.52030100%HP4.55.58.213.64.9%7.3%12.2%
a See Table 2 for grid emissions intensity; bHP2 = Heat Pump at COP of 2 (200% efficiency), HP2.5 = Heat Pump at COP of 2.5 (250% efficiency), etc.
It should be noted that in the wider international context, domestic air conditioning cooling loads can be significant for regions with warmer climates than the UK. For these regions, the potential for a reduction in electricity consumption via the replacement by GSHPs of both resistive heaters and electric chillers may be significant where HPs provide heating in the winter and also cooling in the summer. Although outside the scope of this paper, future analysis for relevant regions may prove fruitful.

5. Conclusions

This study was conducted to establish the impact on emissions, and to a lesser extent energy consumption, of variably performing heat pump technology as observed in recent field trial data. The context for the study was the UK Government’s ambitious targets for heat pump penetration in the English housing stock where all types of heating would be displaced, including relatively efficient mains gas central heating boilers. In this context, heat pumps performing at efficiency levels observed in the field trial, or even at BREDEM model assumed levels, could actually lead to a rise in emissions levels due to the relatively high emissions intensity of the electricity grid. There are however modest savings to be realised from heat pumps operating at efficiencies of 450%.
Given the aspirations for 2030, the only way to realise significant emissions reductions using heat pumps is to concurrently decarbonise the grid. However further analysis similar to that used by Lin [31] is required to understand the efficacy, scale and scope of each strategy. Although outside the scope of this work, the adoption of a suitable probabilistic approach would be beneficial, such as Bayesian inference modelling used in previous studies [32,33]. In the mean time, a phased approach targeting those properties with electric resistive heating, beginning with those in fuel poverty, could realise reasonable emissions savings, in addition to corresponding savings in electricity consumption and hence related reductions in fuel poverty.

Acknowledgment

The authors of this paper would like to express thanks to Ella Quigley for her valuable input.

References

  1. Climate Change 2007: Synthesis Report. Contribution of Working Groups I, II and III to the Fourth Assessment Report of the Intergovernmental Panel on Climate Change; Pachauri, R.K.; Reisinger, A. (Eds.) IPCC: Geneva, Switzerland, 2007; pp. 301–320.
  2. Heat Call for Evidence; Department for Business, Enterprise and Regulatory Reform: London, UK, 2008.
  3. OCC Household Emissions Project–Analysis Pack; Office of Climate Change: London, UK, 2007.
  4. The UK Renewable Energy Strategy; HM Government: London, UK, 2009.
  5. The UK Supply Curve for Renewable Heat; Department of Energy and Climate Change: London, UK, 2009.
  6. The Renewable Energy Review; UK Committee on Climate Change: London, UK, 2011.
  7. Anderson, B.R.; Chapman, P.F.; Cutland, N.G.; Dickson, C.M.; Doran, S.M.; Henderson, G. BREDEM-8 Model Description, 2001 update, BR439 ed; BRE Press: Watford, UK, 2008. [Google Scholar]
  8. The Government’s Standard Assessment Procedure for Energy Rating of Dwellings, Revision 3; BRE Press: Watford, UK, 2005.
  9. Mitsubishi Ecodan Product Brochure. Available online: http://www.engensa.com/heatpumps/uploads/Mitsubishi-Ecodan-Brochure.pdf (accessed on 10 March 2013).
  10. Mitsubishi Product Data. Available online: http://www.intelligentenergysolutions.com/ground-source-heat-pumps_c65.aspx (accessed on 10 March 2013).
  11. Kavgic, M.; Mavrogianni, A.; Mumovic, D.; Summerfield, A.; Stevanovic, Z.; Djurovic-Petrovic, M. A review of bottom-up building stock models for energy consumption in the residential sector. Build. Environ. 2010, 45, 1683–1697. [Google Scholar] [CrossRef]
  12. English Housing Survey Housing Stock Report 2008; Department for Communities and Local Government: London, UK, 2010.
  13. Domestic Heating Systems Ranked by Carbon Emission; Energy Saving Trust: London, UK, 2008.
  14. Cockroft, J.; Kelly, N. A comparative assessment of future heat and power sources for the UK domestic sector. Energy Convers. Manage. 2006, 47, 2349–2360. [Google Scholar] [CrossRef]
  15. The Scottish Renewables Heating Pilot; The Scottish Government: Edinburgh, Germany, 2008.
  16. European Commission: Directorate-General for Energy and Transport, Case study 269. Available online: http://www.managenergy.net/download/nr269.pdf (accessed 10 March 2013).
  17. Getting Warmer: A Field Trial of Heat Pumps; Energy Saving Trust: London, UK, 2010.
  18. Kelly, N.J.; Cockcroft, J. Analysis of retrofit air source heat pump performance: Results from detailed simulations and comparison to field trial data. Energy Build. 2011, 43, 239–245. [Google Scholar] [CrossRef] [Green Version]
  19. Pollard, A.R. The Energy Performance of Heat Pump Water Heaters; Branz Study Report 237; Branz Ltd.: Judgeford, New Zealand, 2010. [Google Scholar]
  20. Morrison, G.L.; Anderson, T.; Behnia, M. Seasonal performance rating of heat pump water heaters. Solar Energy 2004, 76, 147–152. [Google Scholar] [CrossRef]
  21. Firth, S.K.; Lomas, K.J.; Wright, A.J. Targeting household energy-efficiency measures using sensitivity analysis. Build. Res. Inf. 2010, 38, 25–30. [Google Scholar] [CrossRef] [Green Version]
  22. Strachan, N. UK energy policy ambition and UK energy modelling—Fit for purpose? Energy Policy 2011, 39, 1037–1040. [Google Scholar] [CrossRef]
  23. Cabrol, L.; Rowley, P.N. Towards low carbon homes—A simulation analysis of building-integrated air-source heat pump systems. Energy Build. 2012, 48, 127–136. [Google Scholar] [CrossRef] [Green Version]
  24. Carbon Trust—Conversion factors. Available online: http://www.carbontrust.com/media/18223/ctl153_conversion_factors.pdf (accessed on 12 March 2013).
  25. Odenberger, M.; Johnsson, F. Achieving 60% CO2 reductions within the UK energy system—Implications for the electricity generation sector. Energy Policy 2007, 35, 2433–2452. [Google Scholar] [CrossRef]
  26. Allowable Solutions for Tomorrow’s New Homes: Towards a Workable Framework; UK Zero Carbon Hub: London, UK, 2011.
  27. Department for Communities and Local Government, Household Projections, 2008 to 2033. Available online: https://www.gov.uk/government/uploads/system/uploads/attachment_data/file/6395/1780763.pdf (accessed 10 March 2013).
  28. Shorrock, L.D.; Utley, J.I. Domestic Energy Fact File 2008; UK Department for Energy and Climate Change: London, UK, 2008.
  29. Palmer, J.; Boardman, B.; Bottrill, C.; Darby, S.; Hinnells, M.; Killip, G.; Layberry, R.; Lovell, H. Reducing the Environmental Impact of Housing; Consultancy study in support of the Royal Commission on Environmental Pollution’s 26th Report on the Urban Environment; Environmental Change Institute: Oxford, UK, 2006. [Google Scholar]
  30. A Study of Hard to Treat Homes Using the English House Condition Survey; Energy Analysis Focus Report; Department for Environment, Food and Rural Affairs: London, UK, 2008.
  31. Lin, C. Identifying Lowest-Emission Choices and Environmental Pareto Frontiers for Wastewater Treatment Wastewater Treatment Input-Output Model based Linear Programming. J. Ind. Ecol. 2011, 15, 367–380. [Google Scholar] [CrossRef]
  32. Wilson, D.; Rowley, P.N.; Watson, S.J. Utilising a Risk-Based Systems Approach in the Due Diligence Process for Renewable Energy Generation. IEEE Syst. J. 2011, 5, 223–232. [Google Scholar] [CrossRef]
  33. Leicester, P.; Goodier, C.; Rowley, P. Evaluating the Impacts of Community Renewable Energy Initiatives. In Proceedings of the ISES Solar World Congress, Kassel, Germany, 28 August–2 September 2011.

