Article

Autocorrelation and Frequency-Resolved Optical Gating Measurements Based on the Third Harmonic Generation in a Gaseous Medium

1
Department of Applied Chemistry, Graduate School of Engineering, Kyushu University, 744, Motooka, Nishi-ku, Fukuoka 819-0395, Japan
2
Laboratory of Chemistry, Graduate School of Design, Kyushu University, 4-9-1, Shiobaru, Minami-ku, Fukuoka 815-8540, Japan
3
Division of Optoelectronics and Photonics, Center for Future Chemistry, Kyushu University, 744, Motooka, Nishi-ku, Fukuoka 819-0395, Japan
*
Author to whom correspondence should be addressed.
These authors contributed equally to this work.
Appl. Sci. 2015, 5(2), 136-144; https://doi.org/10.3390/app5020136
Submission received: 7 April 2015 / Revised: 2 June 2015 / Accepted: 3 June 2015 / Published: 9 June 2015

Abstract

:
A gas was utilized in producing the third harmonic emission as a nonlinear optical medium for autocorrelation and frequency-resolved optical gating measurements to evaluate the pulse width and chirp of a Ti:sapphire laser. Due to a wide frequency domain available for a gas, this approach has potential for use in measuring the pulse width in the optical (ultraviolet/visible) region beyond one octave and thus for measuring an optical pulse width less than 1 fs.

1. Introduction

Many papers report attosecond pulse generation via high-order harmonic generation (HHG) for use in the studies of ultrafast phenomena related to electrons in an inner-shell orbital of an atom and molecule [1]. On the other hand, an ultrashort optical pulse approaching 1 fs, the spectrum of which is extended from the ultraviolet (UV) to the visible (VIS) region, would be useful for studies of ultrafast phenomena related to electrons in an outer-shell orbital, which are directly concerned with chemical bond/reaction and are more important in chemistry. For example, a molecular ion in mass spectrometry can be strongly enhanced by decreasing the optical pulse width in the femtosecond regime, which is then useful for more reliable identification of the explosive substances [2]. Several methods have been developed for generating an extremely-short optical pulse. For example, numerous emission lines have been generated in the entire VIS region, based on non-resonant four-wave mixing in a thin fused silica plate. This technique has been utilized to generate 2.2-fs optical pulses [3]. On the other hand, coherent supercontinua have been generated from the UV to near-infrared (NIR) by focusing the beam in a hollow-core fiber filled with neon gas, and a three-channel optical field synthesizer has been utilized to generate 2.1-fs pulse [1]. As recognized from the uncertainty principle, a wider spectral domain is essential for the generation of a 1-fs optical pulse. The generation of high-order Raman sidebands extending from the deep-UV (DUV) to the NIR region was first reported in a few decays ago [4]. To date, an extremely wide spectral region extending from 183 to 1203 nm has been covered, based on resonant vibrational four-wave Raman mixing in molecular hydrogen, suggesting that the generation of a 1-fs optical pulse by a phase control of the emission lines is possible [5].
A variety of techniques, including autocorrelation (AC) and frequency-resolved optical gating (FROG), have been developed to measure optical pulse widths [6]. In these techniques, a nonlinear optical effect such as second harmonic generation (SHG), self-diffraction (SD), and others have been utilized. To measure a 1-fs optical pulse, it is necessary to use a nonlinear optical effect that is usable in a wide frequency domain in the UV-VIS region. A GaN diode with a nature of two-photon absorption in the VIS region (at round 400 nm) has been employed as a detector in a fringe-resolved autocorrelator (FRAC) [7]. In a previous study, we reported on the development of an FRAC, in which a mass spectrometer was employed as a two-photon-response device in the DUV region (at around 267 nm) [8]. However, the frequency domain of these techniques is limited to one octave [9]. As a result, it is difficult to measure optical pulse widths less than 1 fs in the UV-VIS region. In order to overcome this problem, the use of a nonlinear optical effect that can be used in the spectral region wider than one octave would be necessary. One of the approaches would be the use of a third harmonic generation (THG) as a nonlinear optical effect, since it has a frequency domain of twice one octave [10]. A surface-sensitive THG has been successfully used for the autocorrelation measurement [11,12]. Moreover, several papers have reported on the FROG system based on THG (THG-FROG), including the THG on the surface of a glass plate [13], in organic films [14], and in a glass coverslip used in multiphoton microscopy [15]. The use of a solid material is simple and easy-to-use. It is, however, difficult to transmit the THG beam generated in the vacuum-UV (VUV) region and to reduce dispersion to negligible levels, especially in the DUV region. On the other hand, a gas such as helium or argon is transparent, even in the VUV region, and the dispersion sufficiently small to be negligible. Thus, the THG in a gaseous medium would be useful for measuring a pulse width in a wide frequency domain. To our knowledge, a THG-based technique such as THG-FROG using a gaseous medium has not been reported to date.
In this study, we used argon or air as a nonlinear optical medium for THG to measure the pulse width of a fundamental beam of a Ti:sapphire laser emitting at 800 nm as a proof-of-principle experiment. Two types of AC systems, i.e., fringe-resolved AC (FRAC) and intensity-AC (IAC), were developed and were utilized for measuring the pulse width. In addition, a FROG system was developed that permits the pulse width and the chirp of the pulse to be evaluated more accurately. The results were compared with values obtained using FRAC and IAC.

2. Experimental Section

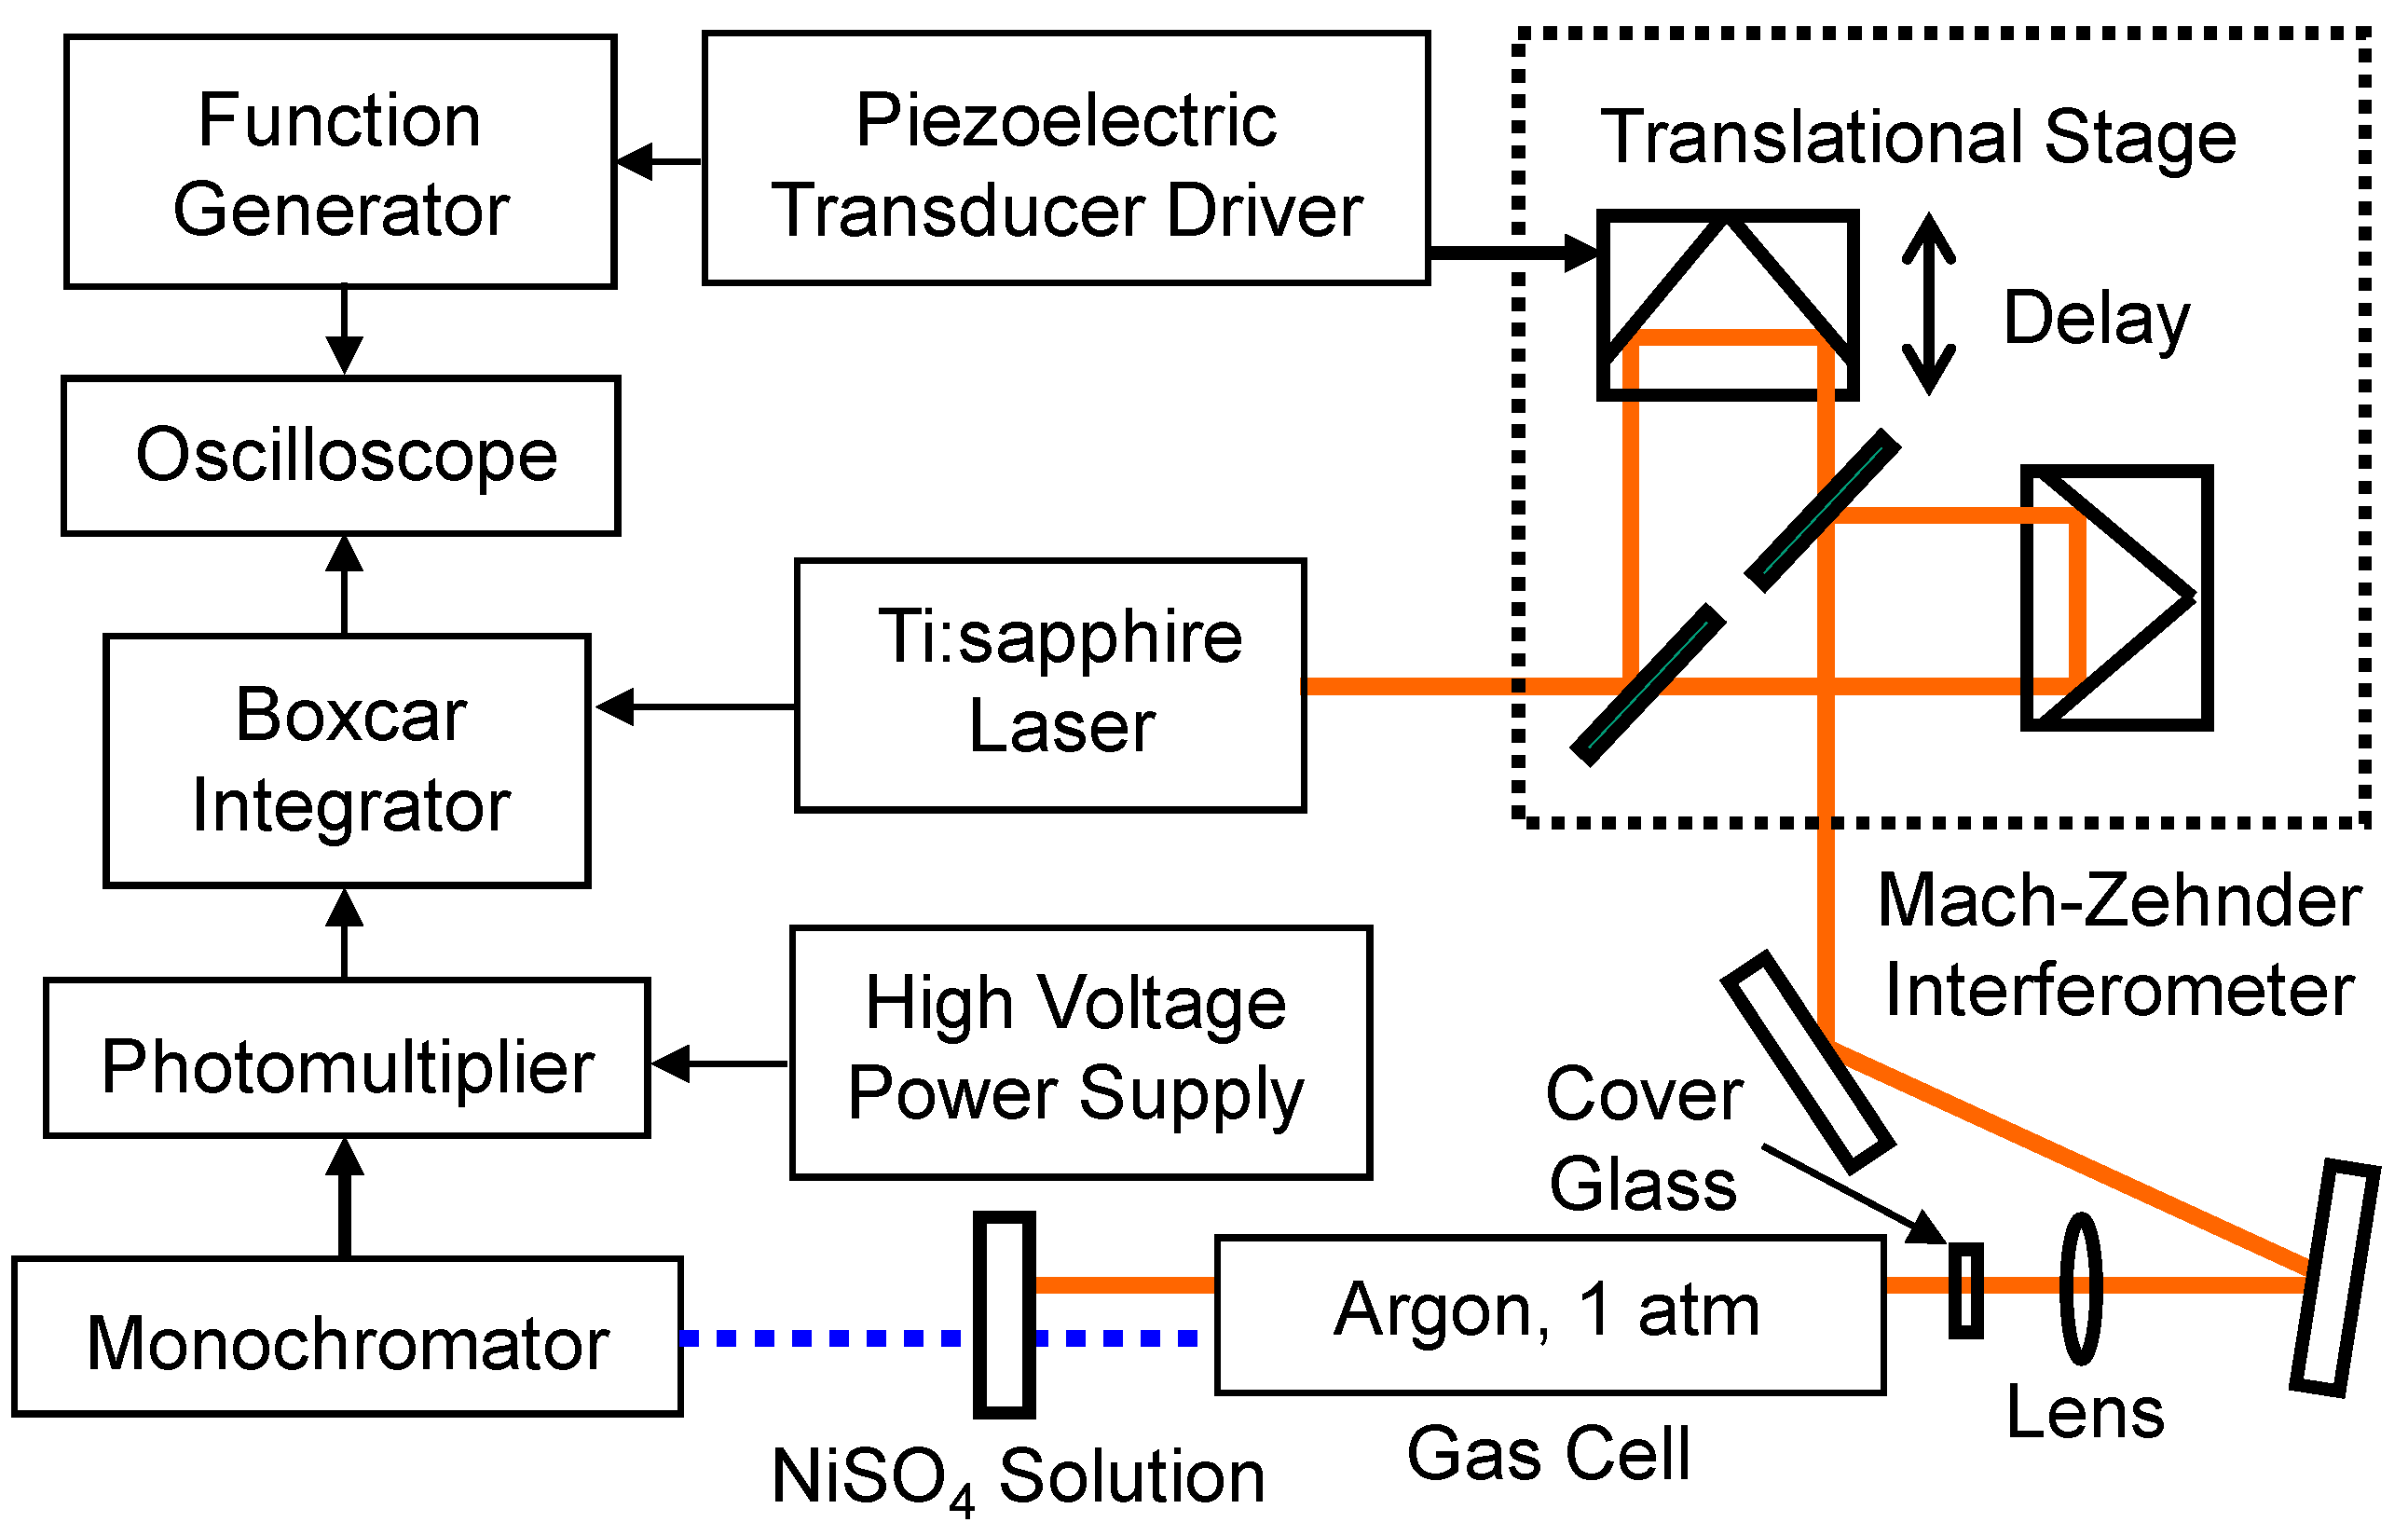
2.1. Fringe-Resolved Autocorrelation

Figure 1 shows a block diagram of the instrument used in this study. In measuring an AC trace, a fundamental beam of a Ti:sapphire laser (Elite, 800 nm, 35 fs, 1 kHz, 4 mJ, Coherent) was passed through a Mach-Zehnder interferometer, consisting of beam splitters made of BK7 plates with a thickness of 3 mm. Using a lens (BK7) with a focal length of 300 mm, the aligned beam was focused into argon gas contained in a cell (700 mm long, 10 mm i.d.) equipped with fused silica windows with a thickness of 0.5 mm. The third harmonic emission generated in the optical components such as the beam splitters was suppressed by passing the beam through a cover glass for microscopy and was confirmed to be negligible levels by evacuating the gas cell. The third harmonic emission generated in the argon gas was passed through an aqueous solution of NiSO4 (500 g/L in water) to suppress the fundamental beam; a substrate of Si was used to remove the fundamental beam of a Ti:sapphire laser in the reported work [16]. The THG beam emitting at 267 nm was further isolated using a monochromator and was measured using a photomultiplier (R1332, no response at 800 nm, Hamamatsu Photonics) designed for measuring a large optical pulse. In the experiment, the signal intensity was measured at the level sufficiently lower than the level of signal saturation. The output signal was fed into a boxcar integrator, and the averaged signal was recorded using an oscilloscope. A function generator provided a signal for a piezoelectric transducer equipped with a translational stage with a retroreflector mounted on it. An autocorrelation trace was collected using the oscilloscope by recording the signal against the time delay between the pulses.

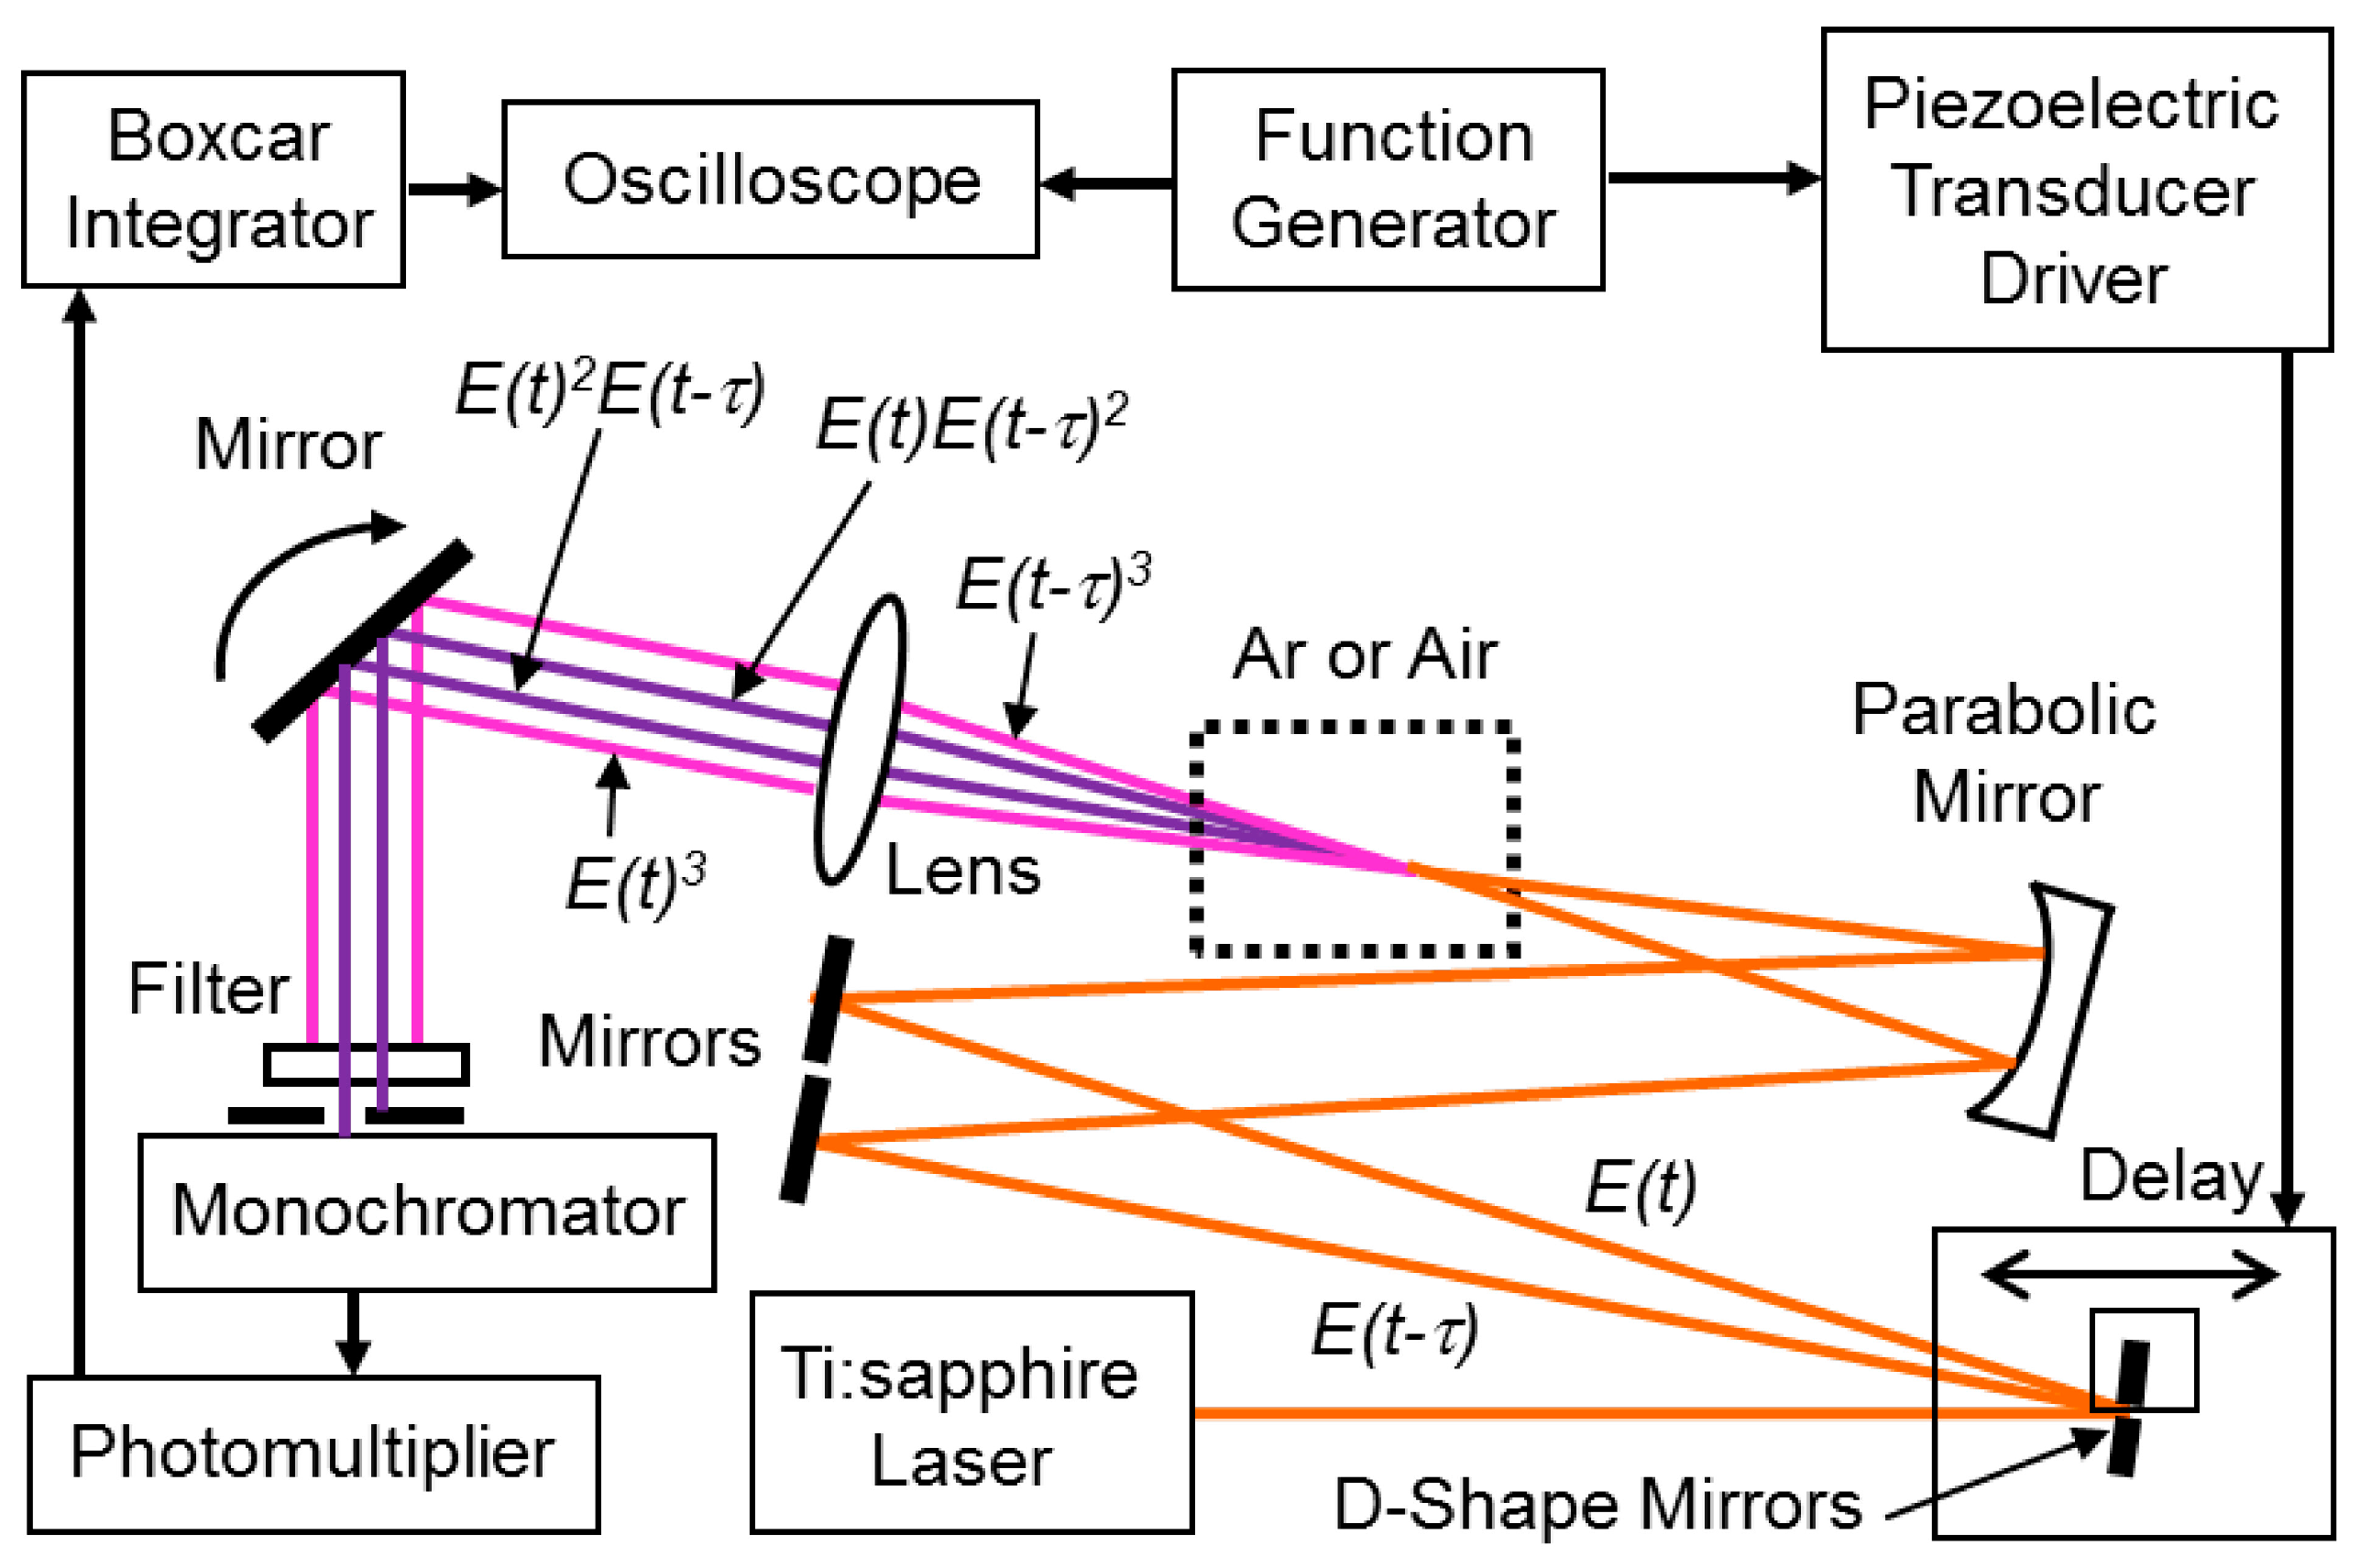
2.2. Frequency-Resolved Optical Gating

A FROG trace was measured using the instrument shown in Figure 2. The fundamental beam of the Ti:sapphire laser was separated into two parts using a pair of D-shape mirrors to remove the dispersion arising from the beam splitters. The beams were reflected by means of a pair of aluminum mirrors and were focused with an off-axis parabolic mirror into a nonlinear optical medium such as argon or air. The beam was collimated using a fused silica lens with a focal length of 10 cm and was introduced into a slit of a monochromator (CT-10, Jasco) using a rotating mirror. One of the THG beams, corresponding to Esig(t, τ) = E(t)2E(tτ), was measured as a signal. Electronics similar to those used in the FRAC experiment were employed for measuring the third harmonic emission. The spectrum of the THG beam was measured using the second-order diffraction of the grating to improve the spectral resolution of the monochromator. A FROG trace was measured by scanning the wavelength of the monochromator at different positions of the delay for one of the D-shape mirrors. The data were measured and analyzed using a program provided by Femtosoft Technologies.
Figure 1. Experimental apparatus for third harmonic generation-fringe-resolved autocorrelator (THG-FRAC). The orange (solid) and blue (broken) lines show the fundamental and THG beams, respectively.
Applsci 05 00136 g001
Figure 2. Experimental apparatus for THG-frequency-resolved optical gating (FROG).
Applsci 05 00136 g002

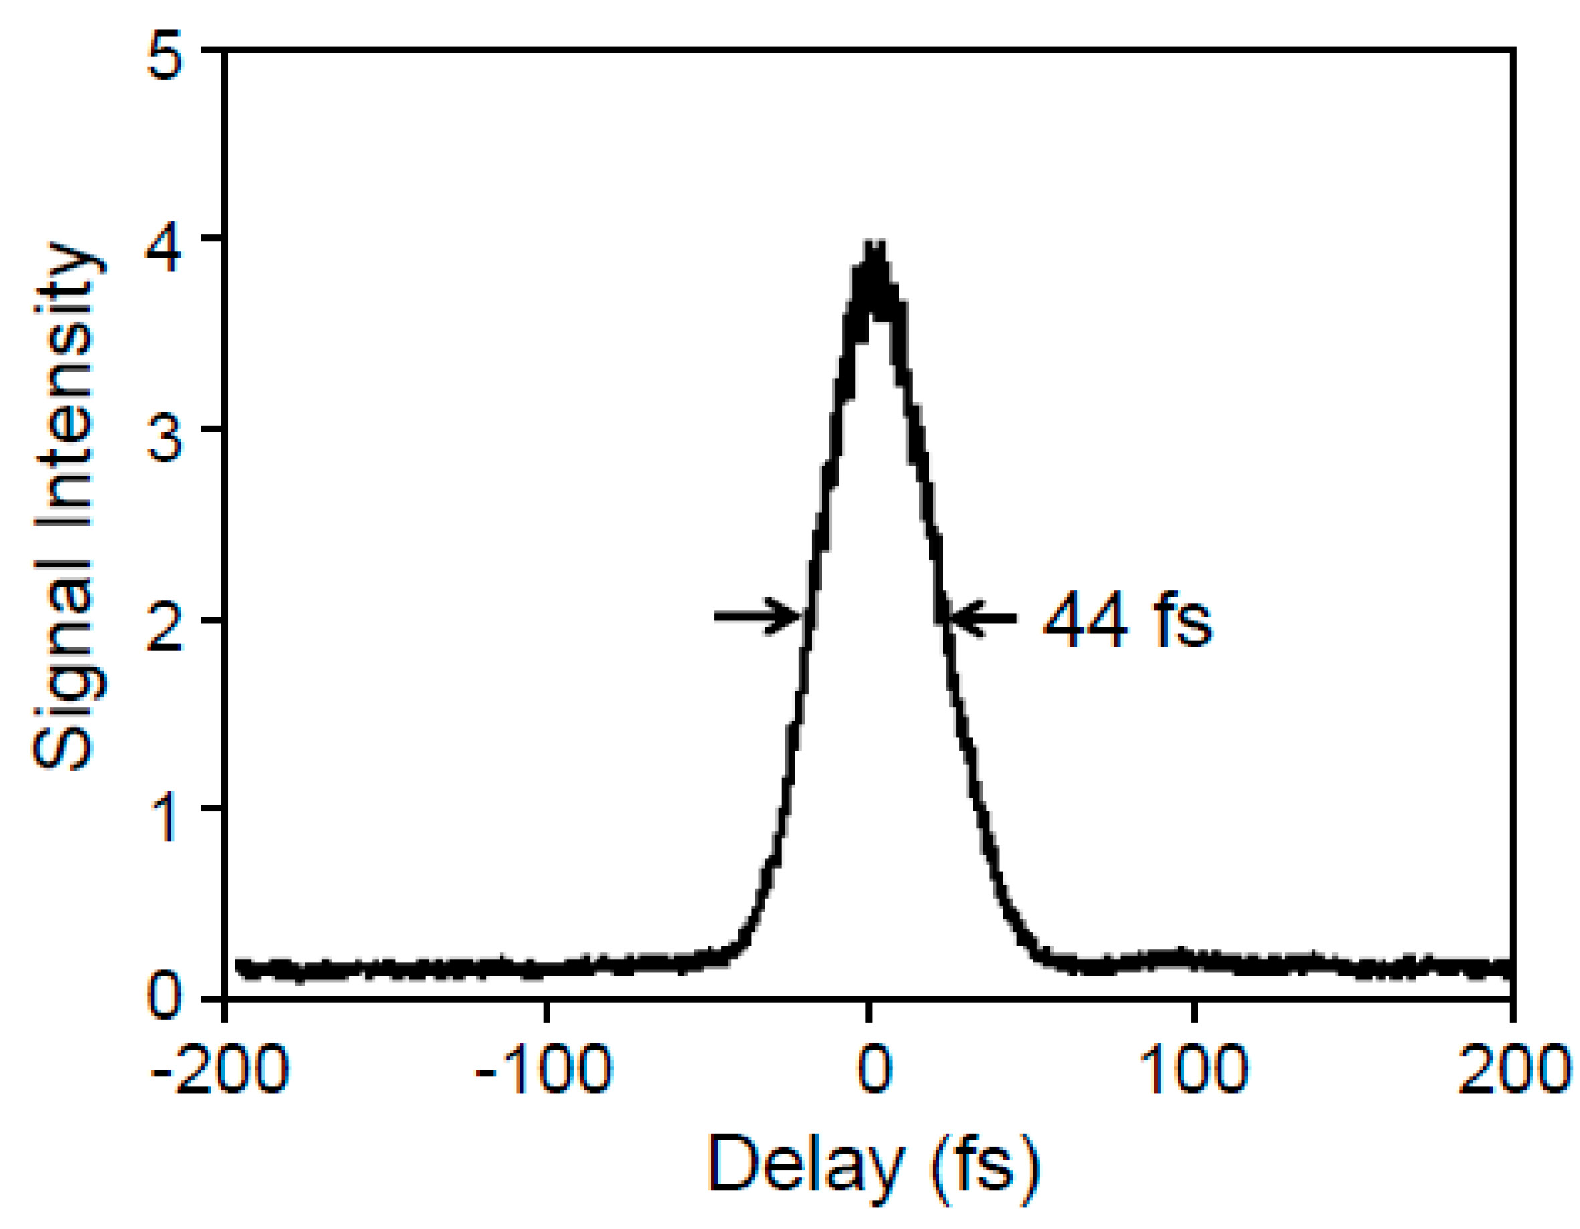
2.3. Intensity Autocorrelation

An IAC trace was obtained using a non-collinear configuration developed for use in a FROG system shown in Figure 2. Thus, the instrument consists of only reflective optics except for a window of the gas cell, allowing a nearly dispersion-free experiment.

3. Results and Discussion

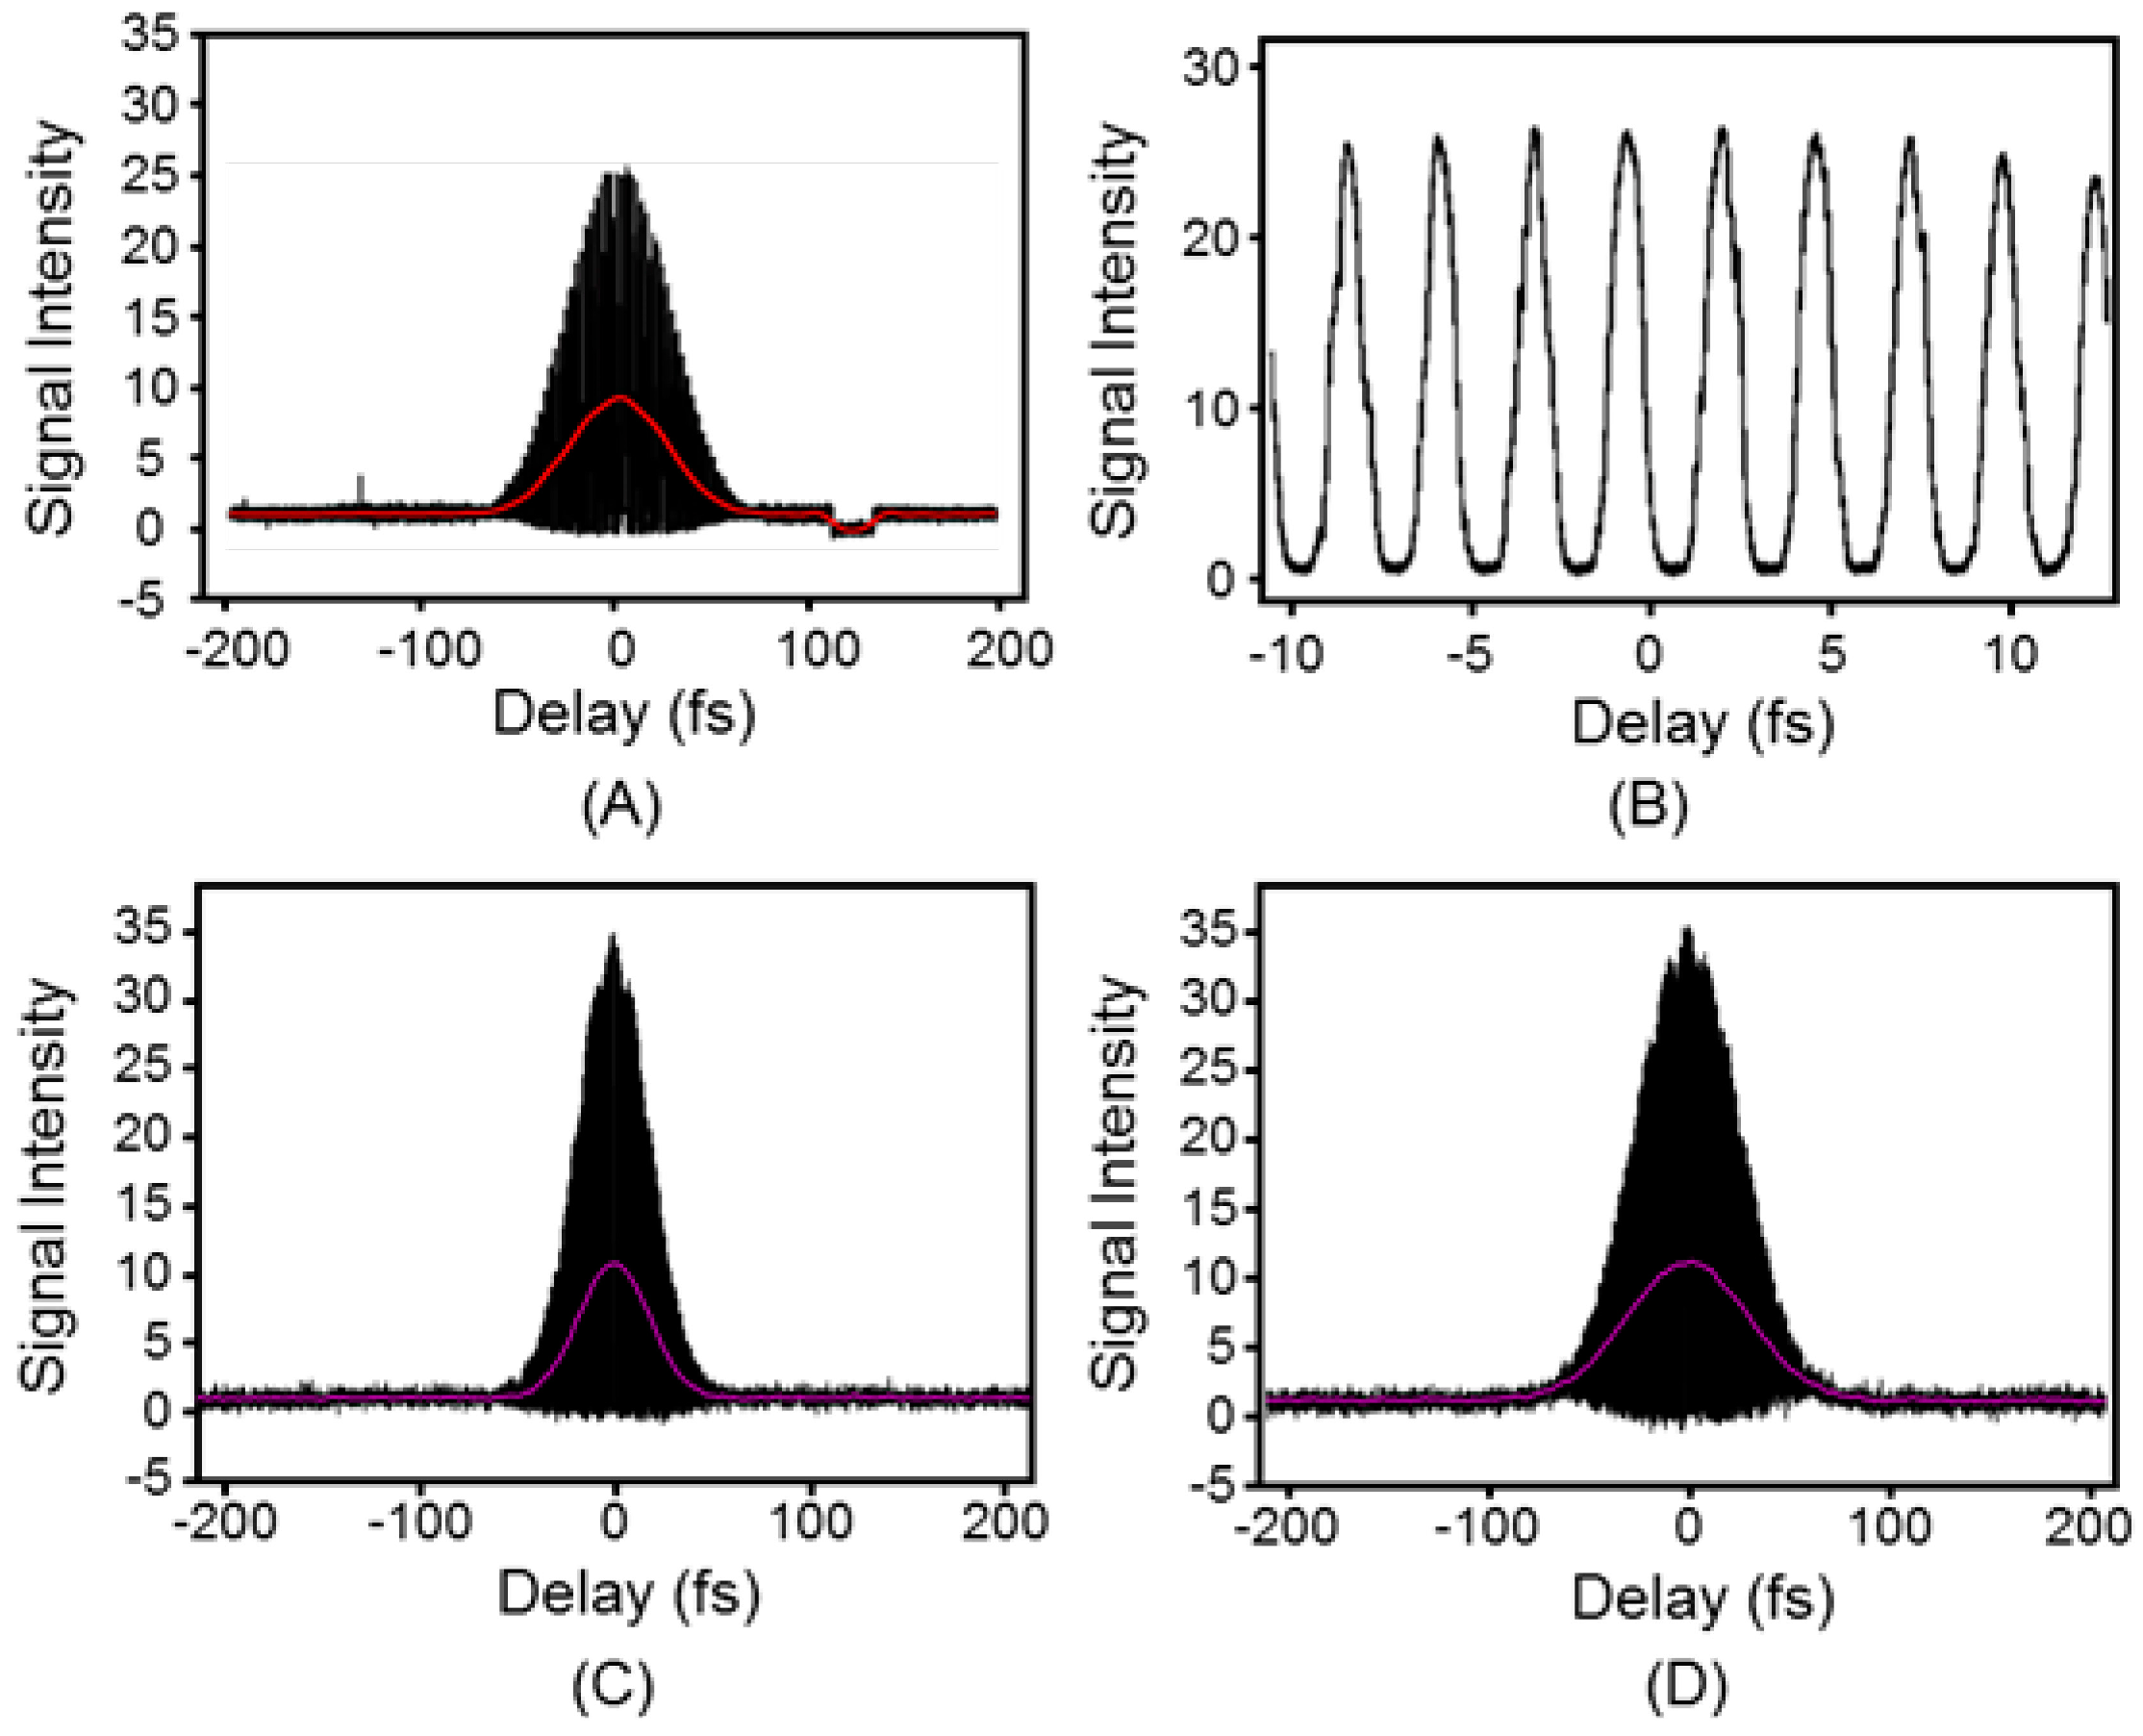
3.1. Fringe-Resolved Autocorrelation

The spectral width measured for the fundamental beam of the Ti:sapphire laser was 27 nm (420 cm−1). The Fourier-transform-limited (FTL) pulse width calculated by assuming a Gaussian temporal profile was 35 fs, identical to the value provided by the manufacturer of the laser. An FRAC trace is shown in Figure 3A. Suppression of the signal to the background level by destructive interference, in addition to a full modulation of the signal shown in the expanded view (Figure 3B), suggests the pump beams were superimposed in generating the THG beam. The ratio of the signal and the background was ca. 25, slightly smaller than the predicted value of 32 for an FTL pulse using the third-order nonlinear effect such as THG [10]. Figure 3C shows the FRAC trace calculated for FTL pulse. The observed trace is slightly wider than this trace, suggesting the chirp of the pulse. Figure 3D shows the FRAC trace calculated under the assumption that the FTL pulse (35 fs) is chirped to 41 fs with a group delay dispersion (GDD) of 500 fs2, which is nearly identical to the value of GDD (ca. 400 fs2) roughly estimated from the thickness of the optical components in the beam path. The pulse width calculated from the IAC trace, which can be obtained by low-pass filtering the data shown in Figure 3A, was 41 fs, which is in good agreement with the above value. Another possible explanation for the discrepancy between the results of (A) and (C) would be the error in the measurement of the spectrum since a wider band width would be observed due to a finite resolution of the spectrometer, which provides a shorter transform-limited pulse width; see a lack of small wings at round ±50 fs in the observed data (A), which is in contrast to the calculated data (D), suggesting that the effect of chirp is minimal.
Figure 3. Autocorrelation trace for (A) observed data (B) expanded view (C) theoretically predicted trace for a Fourier-transform-limited (FTL) pulse (D) theoretically predicted trace for a chirped pulse (GDD = 500 fs2). A random noise was calculated using a computer and was added to the calculated data for better visual comparison. In order to check the baseline level of the observed trace (A), the laser beam was interrupted during a period of 110–130 fs in the experiment, suggesting that the signal was suppressed to zero at the bottom of the trace.
Applsci 05 00136 g003

3.2. Intensity Autocorrelation

The IAC trace observed in this study is shown in Figure 4. The full width at half maximum (FWHM) of the trace was 44 fs, suggesting a pulse width of 36 fs [10]. This value is slightly smaller than that obtained using an FRAC system, which can be attributed to the use of the reflective optics with no dispersion in the IAC system.
Figure 4. Intensity autocorrelation trace observed for the Ti:sapphire laser.
Applsci 05 00136 g004

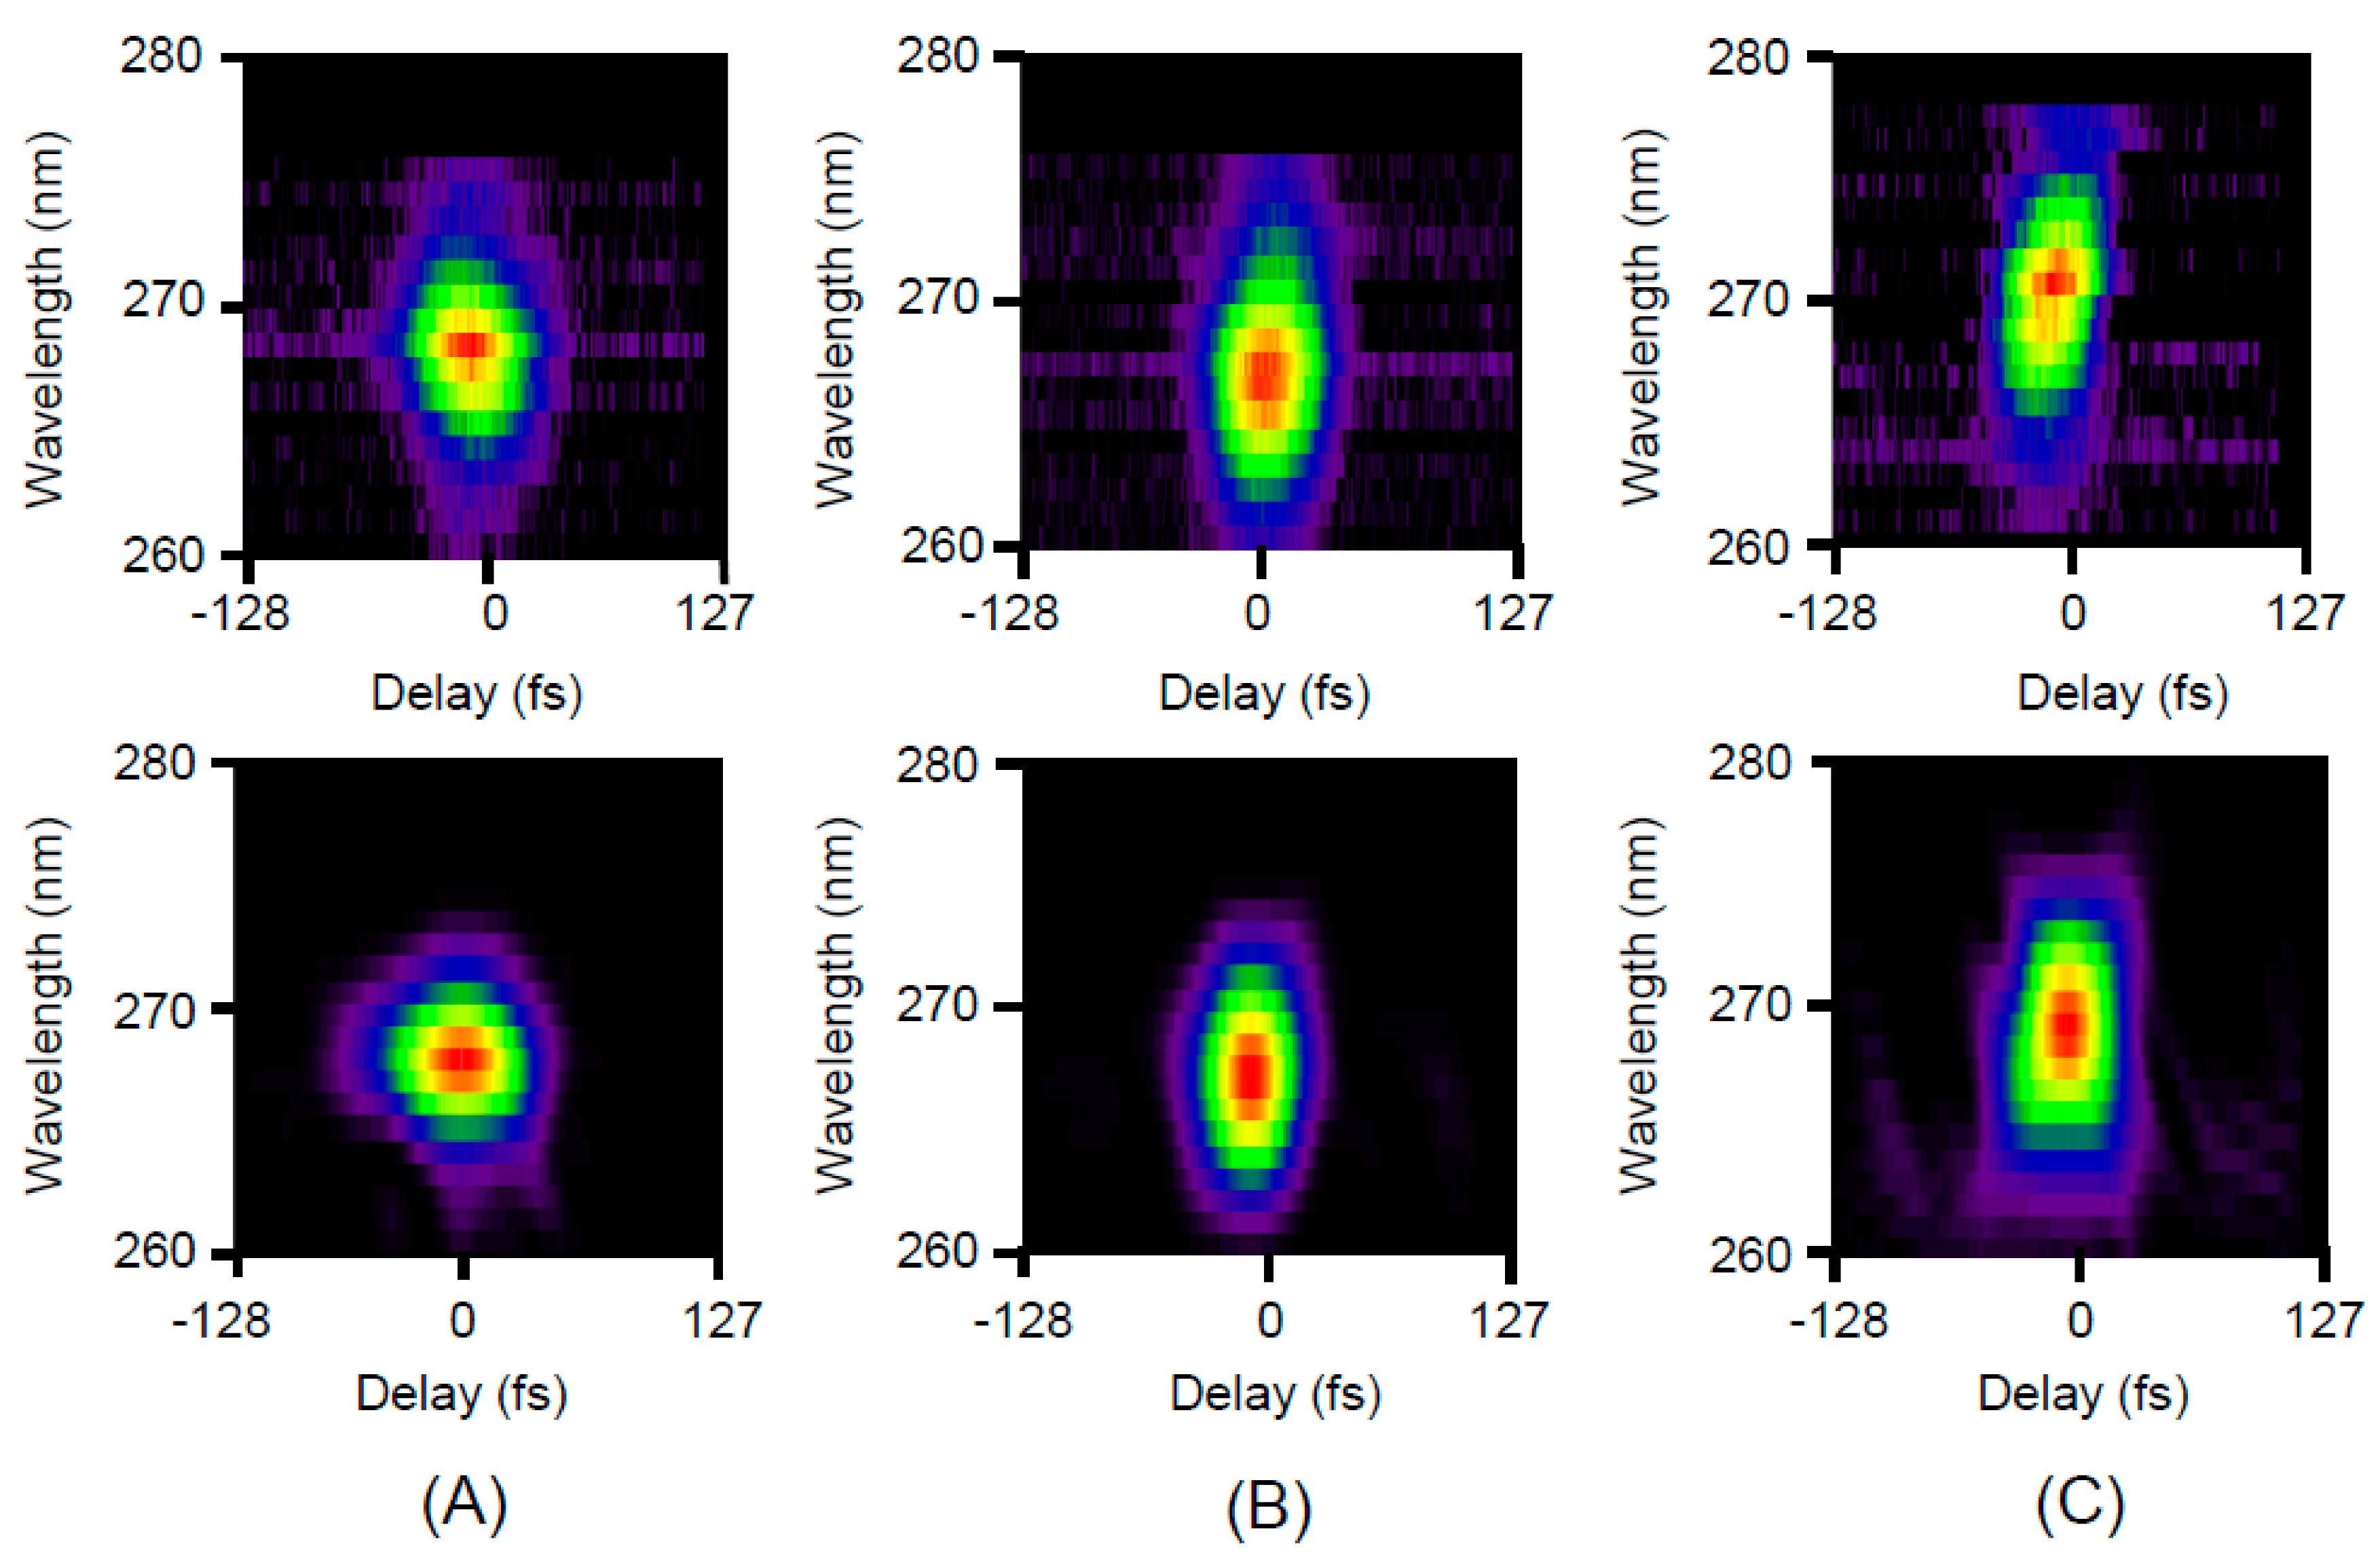
3.3. Frequency-Resolved Optical Gating

The chirp of the pulse can be more accurately evaluated using a FROG system. The efficiency of THG induced in air was similar to that obtained using argon. Because of this, air was used as a nonlinear optical medium in this study for the sake of simplicity. Before recording the FROG trace, the THG beam pattern was measured to properly extract the signal of Esig(t, τ) = E(t)2E(tτ) [6]. The THG beams corresponding to E(t)3, E(t)2E(tτ), E(t)E2(tτ), and E3(tτ) could be clearly observed by rotating the angle of the mirror (see the arrow in Figure 2). Therefore, the intensity of the THG beam for Esig(t, τ) = E(t)2E(tτ) was monitored for measuring the FROG trace. The observed and retrieved data obtained for negatively-chirped, FTL, and positively-chirped pulses are shown in Figure 5. The pulse width measured for an FTL pulse was 32 fs, which appears to be similar to or slightly shorter than the values obtained using IAC. On the other hand, the chirped pulse provided a slightly longer pulse width (positive 42 fs, negative 44 fs) due to the GDD value being calculated to be 300 fs2.
The minimal value of the pulse width measured using conventional SHG-FROG or SD-FROG is determined by the spectral region that is usable as a nonlinear optical medium: although a broad bandwidth spanning a multi-octave frequency domain can be covered using a thin optical crystal, the spectral region is practically limited to the VIS-NIR region [17]. On the other hand, SHG, which would restrict the spectral region of THG, does not occur in an isotropic gas, and a noble gas such as argon is transparent and has a small dispersion in the VUV to IR region. As a result, the present approach using a gas in conjunction with THG-FROG can be utilized to measure pulse widths in a wide frequency domain extending twice one octave. Because of this, this technique would be applied to the measurement of an ultrashort optical pulse less than 1 fs especially in the VUV-DUV region: it should be noted that a higher carrier frequency is desirable for generating a shorter optical pulse. However, in order to avoid the dispersion arising from the optics such as cell windows, it would be necessary to use a nozzle for introduction of a rare gas (not air) into a vacuum. Efficient generation of THG (even HHG) reported to date suggests sufficient sensitivity of this THG-based method using a gas for the measurement of an ultrashort pulse width.
Figure 5. THG-FROG traces obtained for (A) negatively-chirped (B) FTL (C) positively-chirped pulses. The chirp of the pulse was adjusted by changing the position of the grating in the compressor of the Ti:sapphire laser to the value, at which the energy of the THG pulse decreased to a half of the value obtained using the FTL pulse. Above, original traces; below, retrieved data. FROG error: (A) 0.6% (B) 0.6% (C) 1%.
Applsci 05 00136 g005

4. Conclusions

In this study, we report on the development of FRAC, IAC, and FROG systems based on THG using a gaseous medium. This approach can be used to measure an ultrashort optical pulse at any wavelength from the UV to the IR region although the emission generated by THG is located in the VUV-VIS region. Therefore, this technique can be applied to the lasers used in various areas of science and technology.

Acknowledgments

This research was supported by a Grant-in-Aid for the Global COE program, “Science for Future Molecular Systems” from the Ministry of Education, Culture, Sports, Science and Technology of Japan and by Grants-in-Aid for Scientific Research from the Japan Society for the Promotion of Science (JSPS) KAKENHI Grant Number 23245017, 24510227, 26220806, and 15K13726. This study also received support from the Steel Industry Foundation for the Advancement of Environmental Protection Technology.

Author Contributions

Performing the experiment: Yoshinari Takao, Numerical simulation: Tomoko Imasaka, Drafting of manuscript: Totaro Imasaka, Critical revision: Yuichiro Kida, Planning and supervision of the research: Totaro Imasaka.

Conflicts of Interest

The authors declare no conflict of interest.

References

  1. Wirth, A.; Hassan, M.Th.; Grguraš, I.; Gagnon, J.; Moulet, A.; Luu, T.T.; Pabst, S.; Santra, R.; Alahmed, Z.A.; Azzeer, A.M.; et al. Synthesized light transients. Science 2011, 334, 195–200. [Google Scholar] [CrossRef] [PubMed]
  2. Hamachi, A.; Okuno, T.; Imasaka, T.; Kida, Y.; Imasaka, T. Resonant and nonresonant multiphoton ionization processes in the mass spectrometry of explosives. Anal. Chem. 2015, 87, 3027–3031. [Google Scholar] [CrossRef] [PubMed]
  3. Weigand, R.; Mendonça, J.T.; Crespo, H.M. Cascaded nondegenerate four-wave-mixing technique for high-power single-cycle pulse synthesis in the visible and ultraviolet ranges. Phys. Rev. A 2009, 79, 063838. [Google Scholar] [CrossRef]
  4. Imasaka, T.; Kawasaki, S.; Ishibashi, N. Generation of more than 40 laser emission lines from the ultraviolet to the visible regions by two-color stimulated Raman effect. App. Phys. B 1989, 49, 389–392. [Google Scholar] [CrossRef]
  5. Shitamichi, O.; Imasaka, T. High-order Raman sidebands generated from the near-infrared to ultraviolet region by four-wave Raman mixing of hydrogen using an ultrashort two-color pump beam. Opt. Express 2012, 20, 27959. [Google Scholar] [CrossRef] [PubMed]
  6. Trebino, R. Frequency-Resolved Optical Gating: The Measurement of Ultrashort Laser Pulses; Kluwer Academic Publishers: Boston, MA, USA, 2002. [Google Scholar]
  7. Zürch, M.; Hoffmann, A.; Gräfe, M.; Landgraf, B.; Riediger, M.; Spielmann, Ch. Characterization of a broadband interferometric autocorrelator for visible light with ultrashort blue laser pulses. Opt. Commun. 2014, 321, 28–31. [Google Scholar] [CrossRef]
  8. Zaitsu, S.; Miyoshi, Y.; Kira, F.; Yamaguchi, S.; Uchimura, T.; Imasaka, T. Interferometric characterization of ultrashort deep ultraviolet pulses using a multiphoton ionization mass spectrometer. Opt. Lett. 2007, 32, 1716–1718. [Google Scholar] [CrossRef] [PubMed]
  9. Imasaka, T.; Imasaka, T. Searching for a molecule with a wide frequency domain for non-resonant two-photon ionization to measure the ultrashort optical pulse width. Opt. Commun. 2012, 285, 3514–3518. [Google Scholar] [CrossRef]
  10. Meshulach, D.; Barad, Y.; Silberberg, Y. Measurement of ultrashort optical pulses by third-harmonic generation. J. Opt. Soc. Am. B 1997, 14, 2122–2125. [Google Scholar] [CrossRef]
  11. Tsang, T.Y.F. Optical third-harmonic generation at interfaces. Phys. Rev. A 1995, 52, 4116–4125. [Google Scholar] [CrossRef] [PubMed]
  12. Squier, J.A.; Fittinghoff, D.N.; Barty, C.P.J.; Wilson, K.R.; Müller, M.; Brakenhoff, G.J. Characterization of femtosecond pulses focused with high numerical aperture optics using interferometric surface-third-harmonic generation. Opt. Commun. 1998, 147, 153–156. [Google Scholar] [CrossRef]
  13. Tsang, T.; Krumbügel, M.A.; Delong, K.W.; Fittinghoff, D.N.; Trebino, R. Frequency-resolved optical-gating measurements of ultrashort pulses using surface third-harmonic generation. Opt. Lett. 1996, 21, 1381–1383. [Google Scholar] [CrossRef] [PubMed]
  14. Ramos-Ortiz, G.; Cha, M.; Thayumanavan, S.; Mendez, J.; Marder, S.R.; Kippenlen, B. Ultrafast-pulse diagnostic using third-order frequency-resolved optical gating in organic films. Appl. Phys. Lett. 2004, 85, 3348–3350. [Google Scholar] [CrossRef]
  15. Chadwick, R.; Spahr, E.; Squier, J.A.; Durfee, C.G.; Walker, B.C.; Fittinghoff, D.N. Fringe-free, background-free, collinear third-harmonic generation frequency-resolved optical gating measurements for multiphoton microscopy. Opt. Lett. 2006, 31, 3366–3368. [Google Scholar] [CrossRef] [PubMed]
  16. Graf, U.; Fieβ, M.; Schultze, M.; Kienberger, R.; Krausz, F.; Goulielmakis, E. Intense few-cycle light pulses in the deep ultraviolet. Opt. Express 2008, 16, 18956. [Google Scholar] [CrossRef] [PubMed]
  17. Birkholz, S.; Steinmeyer, G.; Koke, S.; Gerth, D.; Bürger, S.; Hofmann, B. Phase retrieval via regularization in self-diffraction based spectral interferometry. 2014. arXiv:1412.2965. [Google Scholar] [CrossRef]

