Article

Analysis of Losses in Open Circuit Voltage for an 18-μm Silicon Solar Cell

1
Tongwei Group Co., Ltd., Chengdu 610041, China
2
School of Photovoltaic and Renewable Energy Engineering, University of New South Wales, Sydney 2052, Australia
3
AmberWave Inc., Salem, NH 03079, USA
4
SolAero Technologies Corp., Albuquerque, NM 87123, USA
*
Authors to whom correspondence should be addressed.
Appl. Sci. 2015, 5(4), 682-694; https://doi.org/10.3390/app5040682
Submission received: 30 June 2015 / Revised: 9 September 2015 / Accepted: 18 September 2015 / Published: 29 September 2015

Abstract

:
An 18 μm thin crystalline silicon solar cell was demonstrated, and its best open circuit voltage is 642.3 mV. However, this value is far from the cell’s theoretical upper limit in an ideal case. This paper explores the open circuit voltage losses of the thin silicon solar cell, starting from the ideal case, through first principle calculation and experiments. The open circuit voltage losses come from the introduced recombination due to the non-ideal surface passivation and contacts integration on front and rear surfaces, and edge isolation. This paper presents a roadmap of the open circuit voltage reduction from an ideal case of 767.0 mV to the best measured value of 642.3 mV.

1. Introduction

The theoretical upper limit performance of both thick silicon solar cells [1] and thin silicon solar cells [2,3] have been well studied. There is a significant performance gap between the ideal and the practical cells, which is caused by optical losses, bulk recombination, surface recombination, contact recombination, and resistance losses in a manner similar to that observed by Swanson [4].
In a previous paper, an 18 μm thin crystalline silicon solar cell on steel has achieved a best efficiency of 16.8% and a best open circuit voltage (Voc) of 642.3 mV [5]. The structure of the ultrathin silicon (UTSi) solar cell is shown in Figure 1. The ultrathin silicon is 20 μm thick, which is attached onto 125 μm steel substrate, and includes three layers: top front surface field (FSF) layer which is n+ and 1 μm, middle base layer, which is n type and 18 μm, and bottom emitter which is p+ 1 μm. Both surfaces of this thin silicon are well passivated and optically designed.
Figure 1. Diagram of the UTSi solar cell on steel substrate [5].
Applsci 05 00682 g001
However, according to our analysis the theoretical maximum Voc of this thin silicon solar cell can be as high as 767 mV [5]. The Voc difference between an ideal case and a practical case is due to the introduced recombination. This paper discusses these recombination sources that include non-ideal passivated front and rear surfaces, laser-introduced damage on the front surface, contacted regions on both front and rear surfaces and edge recombination. Based on our previous analysis, bulk recombination is negligible for such thin crystalline silicon solar cells [5]; thus, it is not discussed in this paper.
This paper explores the Voc losses through the first principle calculation and the measurement results on test samples and the UTSi solar cells. The Voc loss at each step is figured out and a roadmap of Voc reduction from the no loss (or modeled) case of 767 mV to the best measured value of 642.3 mV is established.

2. Fabrication

The detailed fabrication of this UTSi solar cell has been described [5,6]. All semiconductor layers including n+ front surface field, n base and p+ emitter are epitaxially grown on a porous silicon layer on a p+ wafer. After the thin silicon is grown on its host p+ wafer, the rear surface undergoes passivation and metallization. Then, the epitaxial thin silicon layer is exfoliated and transferred onto the steel substrate. After exfoliation, the porous silicon surface becomes the front side, and this surface is shallow textured in an alkaline solvent. This textured front surface is then passivated by PECVD deposited SiOxNy (silicon oxynitride). Front contacts are formed by combining selective laser doping and self-aligned Ni/Cu light induced plating. Fabrication is completed by edge isolation, a combination of laser cut and chemical etching processes, because well isolated edges lead to reduced FF and Voc losses.

3. Voc Losses Analysis

3.1. Voc in Ideal Case

In an ideal case, the UTSi solar cell has a high Voc and efficiency potential. PC1D [7,8] is used to calculate the upper limit efficiency and Voc of a 20 μm silicon solar cell. Lifetimes of the n+ front surface field (FSF) layer, p+ emitter and n base are assumed to be 10 μs, 10 μs and 1000 μs, respectively. The modeled upper values of Voc and efficiency are 767 mV and 25.4%, respectively [5]. To separate the surface recombination from bulk recombination, we assume the surface recombination velocity (SRV) of both surfaces to be 0 cm/s, so that there is only bulk recombination. Table 1 shows the reverse saturation current densities and the corresponding Voc values.
Table 1. J0 components, values and their corresponding Voc values when SRV is 0 cm/s. J0e is the reverse saturation current density in the emitter, J0b is the reverse saturation current density in the base and FSF layer.
StepsJ0 ComponentsJ0 Value (A/cm2)Voc (mV)
--J0b4.73 × 10−15--
--J0e3.03 × 10−17--
1J0b + J0e4.76 × 10−15767.0
In addition to the PC1D model, first principle calculations are used to calculate Voc. We first separate the surface recombination from bulk recombination by assuming SRV(Sn, Sp) to be 0 cm/s so that there is only bulk recombination in the base (J0b) and emitter (J0e). The J0 equation becomes J 0 = J 0 b + J 0 e = q D n n 1 2 L n N A × tanh ( W p L n ) + q D p n 1 2 L p N D × tanh ( W n L p ) , where NA and ND are doping densities; Ln and Lp are minority carriers diffusion lengths; Wp and Wn are the thickness; Sn and Sp are minority carriers surface recombination velocities; Dn and Dp are minority carriers diffusivity at p and n silicon, respectively; and ni is the intrinsic concentration. J0 is determined by W p L n and W n L p , the ratio of thickness over diffusion length. The maximum Voc is 758 mV for a 20-μm cell, with an n base with a thickness of 18-μm, a doping density ND of 5 × 1015 cm−3 and a lifetime of 1000 μs, a p+ emitter 1 μm, 5 × 1017 cm−3 and lifetime of 10 μs. No n+ FSF layer is considered in this calculation.

3.2. Voc Loss Due to Surface Recombination

3.2.1 SRV on a Passivated n type Surface

There is a 1–2 μm 5 × 1017 cm−3 or 1 × 1018 cm−3 n type FSF layer in this UTSi solar cell, and this layer is mostly etched away during the shallow texturing process [5]. The front surface of the textured UTSi solar cell is mainly an n (5 × 1015 cm−3) surface with a partially remaining n+ (5 × 1017 cm−3 or 1 × 1018 cm−3) surface. The front surface is passivated by silicon oxynitride (SiOxNy) [9]. This section tests the surface recombination in the SiOxNy passivated n type surfaces. Two groups of test samples were designed, as shown in Figure 2: group A1 with n (5 × 1015 cm−3) epitaxial surfaces and group B1 with n+ (5 × 1017 cm−3) surfaces. Float-zone (FZ) substrates were chosen because they have negligible bulk recombination and provide an ideal substrate for epitaxial growth. In this way, their lifetime or implied Voc values are not limited by bulk but by surfaces. These FZ substrates were from the same wafer and these samples were processed along with control samples to eliminate extraneous variables. After SiOxNy deposition, these samples were annealed at 400 °C for 10 min to activate surface passivation [9]. Their implied Voc (iVoc) and lifetime were measured by a Sinton lifetime tester [10]. An iVoc of 718 mV and effective lifetime of 1085 μs were obtained in the sample with 18 μm 5 × 1015 cm−3 n type silicon epitaxial layers, while an iVoc of 696 mV and lifetime of 556 μs were measured in the sample with 1 μm heavily doped 1 × 1018 cm−3 n+ epitaxial layers. To calculate the SRV of both surfaces, the equation 1 τ e f f = 1 τ b u l k + 2 × S W is used, where τeff is the effective lifetime measured, S is the SRV, W is the thickness of silicon, τbulk is the bulk lifetime of the FZ wafer. In this calculation, the intrinsic bulk lifetime of the FZ wafer, 1.8 × 10⁴ μs, was estimated using an online program PV Lighthouse [11]. Intrinsic bulk lifetime eliminates the effect of Shockley-Read-Hall recombination and leads to conservative values for the SRV. SRV values for the 5 × 1015 cm−3 surface and 1 × 1018 cm−3 surface are 13 cm/s and 26 cm/s, respectively.
Figure 2. Control sample and two groups of test samples for n and n+ epitaxial layers and their passivation.
Applsci 05 00682 g002
Table 2. iVoc and J0 components for samples in Figure 2.
IDiVoc (mV)Lifetime (μs)SRV (cm/s)
Group A1718108513
Group B169655626

3.2.2. SRV on a Passivated p+ Surface

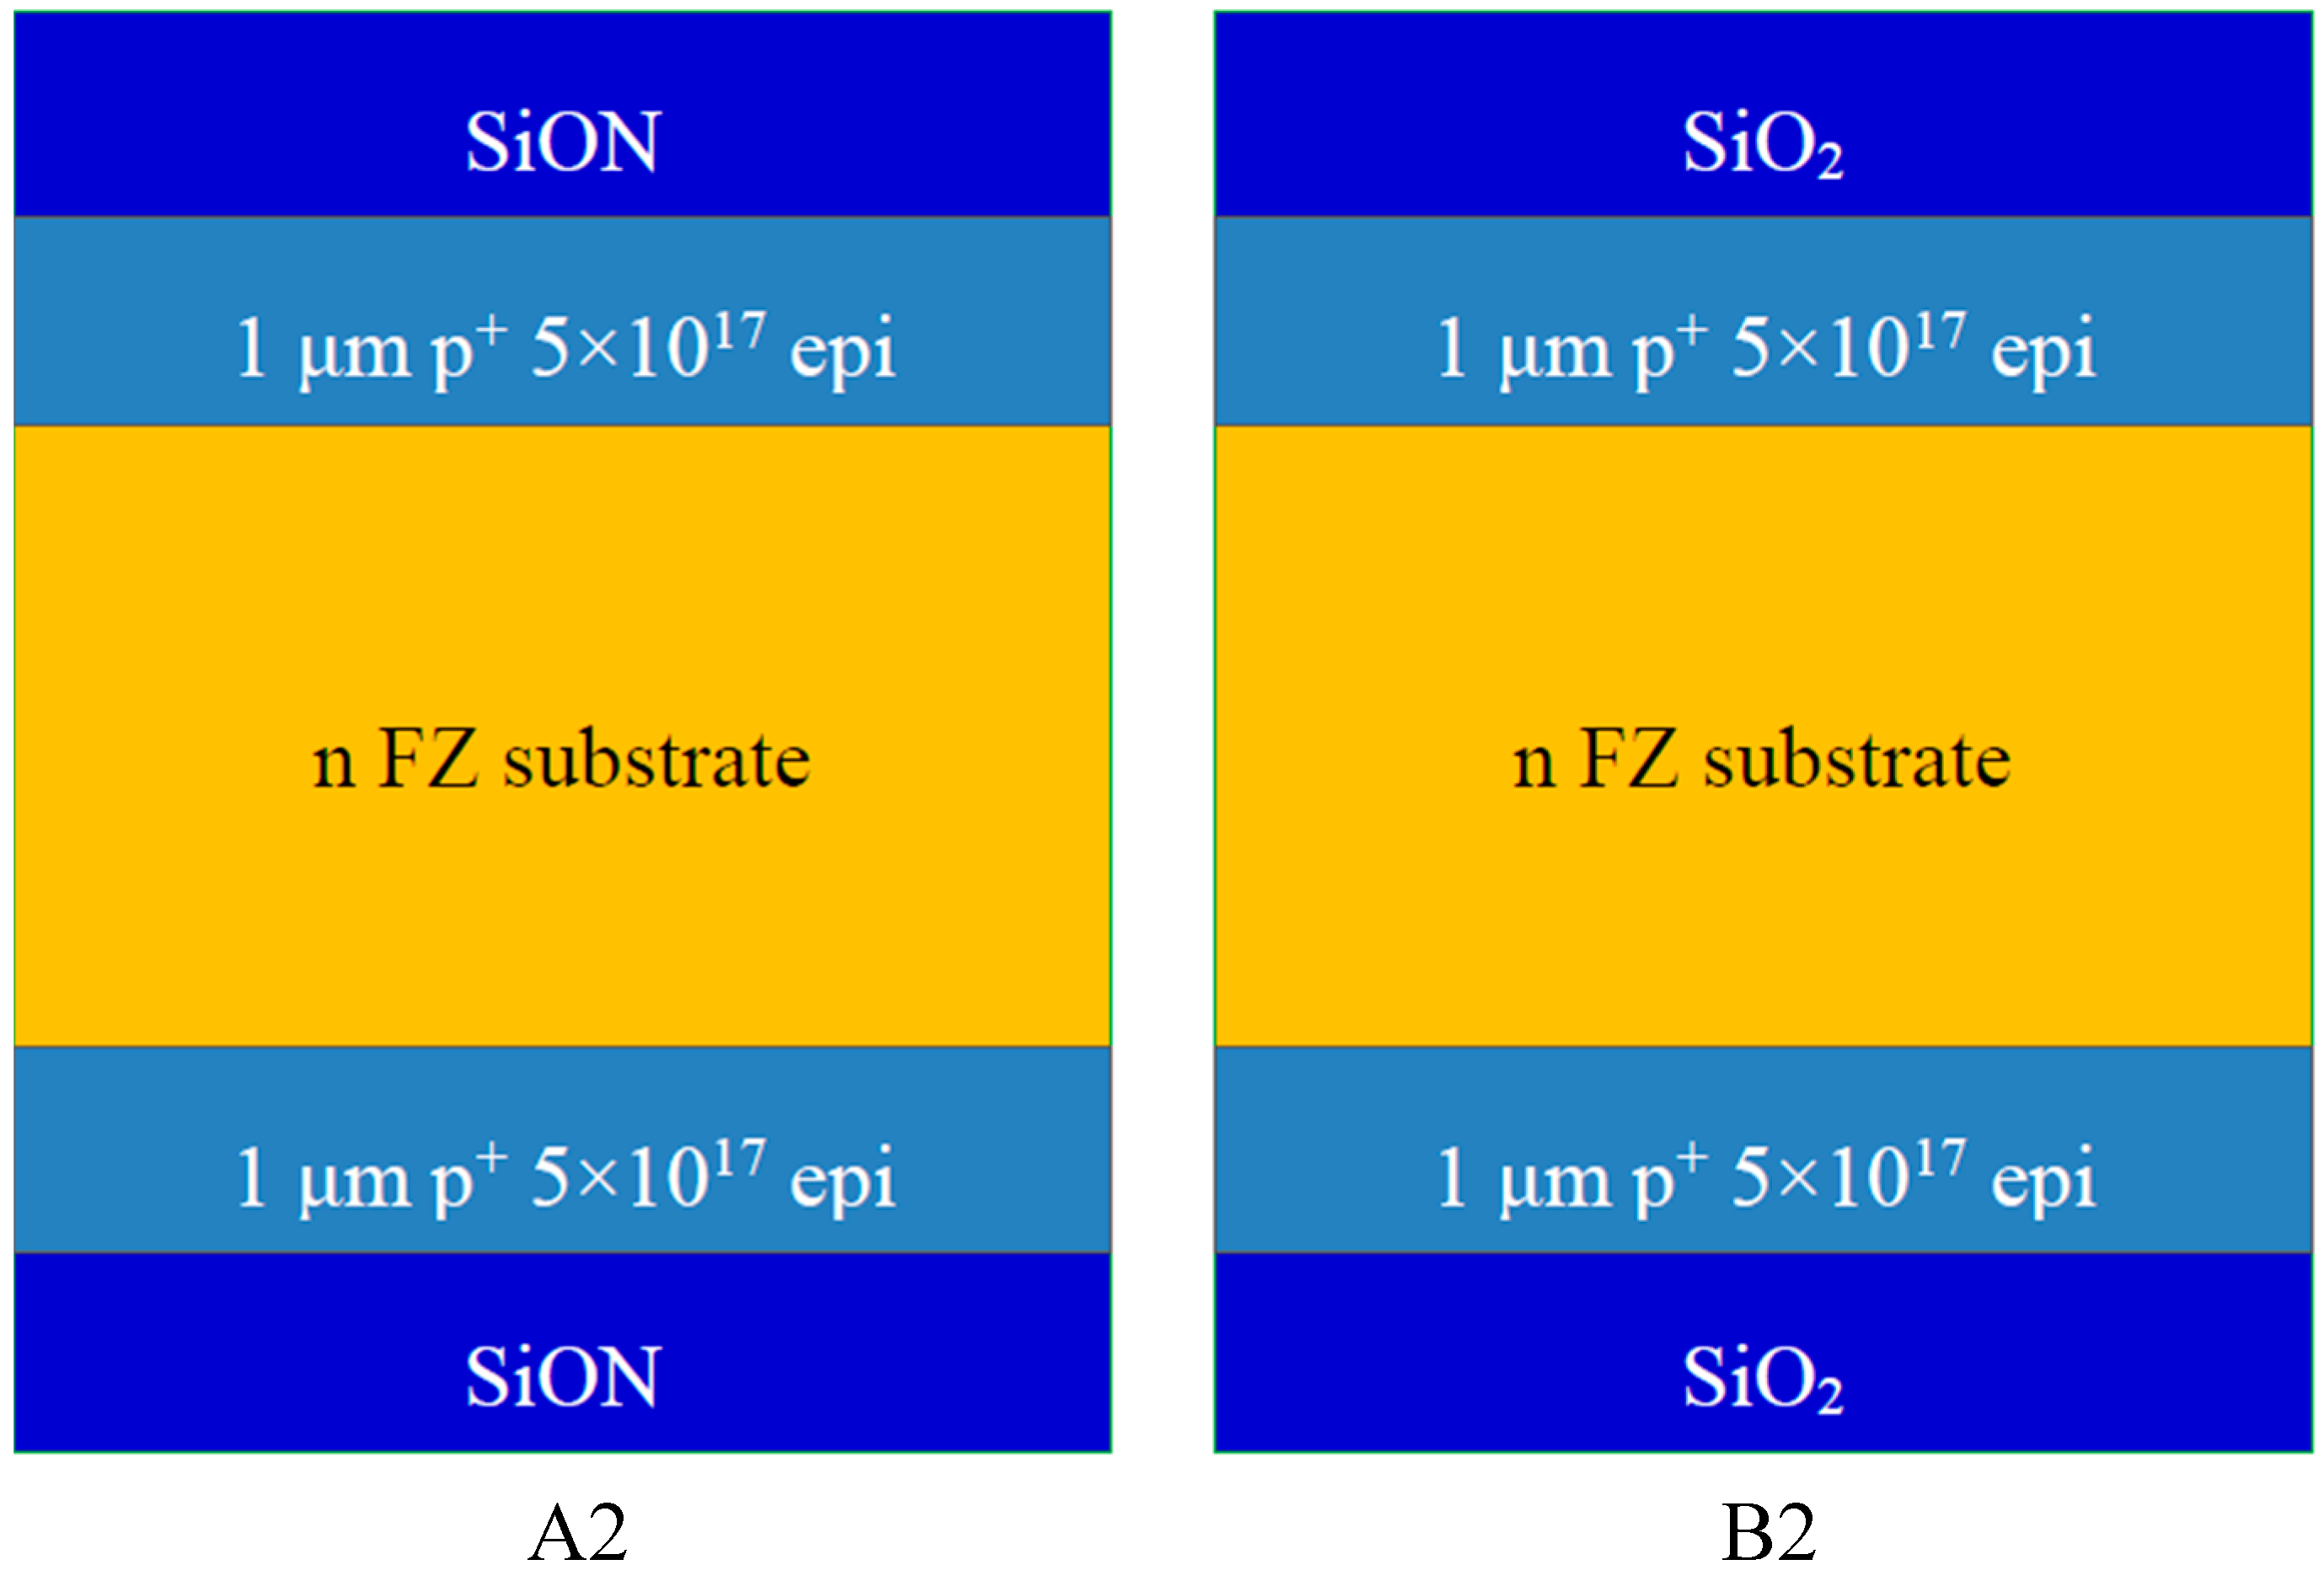
SRV depends strongly on the processing methods, including oxidation conditions, annealing conditions, surface roughness and contamination. King reported a surface recombination velocity of 1640 cm/s on a SiO2 passivated p+ silicon surface, which is independent of injection level [12]. Thermal oxide is used to passivate the heavily doped p+ epitaxial emitter of the UTSi solar cell. This section tests the SRV of the thermal oxide passivated heavily doped p+ type surface. Control samples were used at each step to eliminate contamination and extraneous variables. A doping density of 5 × 1017 cm−3 for the rear emitter was selected in this experiment, and these test samples’ structures are plotted in Figure 3. Group A2 has 1 μm, 5 × 1017 cm−3 epitaxial p+ layers on both surfaces, which are passivated by SiOxNy [9]; Group B2 has 1 μm, 5 × 1017 cm−3 epitaxial p+ silicon layers on both surfaces, which are passivated by SiO2. These samples were from the same wafer and were processed along with the control ones.
Figure 3. Test structures for p+ epitaxial layers and their passivation.
Applsci 05 00682 g003
SRV (Sp) values are extracted in Table 3, using the relation J 0 = q s n i e 2 / N A , s u r f [12], where J0 is extracted from the above lifetime measurements, which is determined by the surface when the bulk recombination is negligibleis; NA,surf is the doping density of surface; q is the electronic charge; nie is the intrinsic carrier concentration in the emitter, and equals to n i 0 2 e Δ E k T , where ni0 is the intrinsic carrier concentration in the absence of bandgap narrowing and ΔE is the bandgap narrowing. ΔE = 0.03 eV for 5 × 1017 cm−3 and ΔE = 0.01 eV for 2 × 1017 cm−3 [12,13]. According to the calculated results, the SRV values of the SiO2 passivated p+ emitter surface are 1551–1677 cm/s, as shown in the table, which is consistent with the value of 1640 cm/s reported by King [12].
Table 3. Lifetime, iVoc, J0e and SRV of Group A2 and B2 test samples from Figure 3.
GroupLifetime (μs)iVoc (mV)J0e (A/cm2)SRV (cm/s)
A2161–221644–658----
B2139–157637–6421.85 × 10−13 ~ 2.0 × 10−131551–1677

3.3. Voc Losses Calculation

The theoretical maximum open circuit voltage achievable in a 20 μm silicon solar cell is 767 mV, when both surface recombination velocities are 0 cm/s. However, the front n type surface and the rear p+ emitter surface of the UTSi solar cell are passivated by SiOxNy and SiO2 respectively, and neither SiOxNy nor SiO2 are the perfect passivation layers; thus, there is surface recombination on each surface. This section calculates the J0 of the UTSi solar cell after introducing the surface recombination. According to Table 2, the SRV value of the SiOxNy passivated n front surface is less than 13 cm/s; According to Table 3, the SRV value of the SiO2 passivated p+ rear surface is 1551–1677 cm/s, and 1640 cm/s is chosen to calculate the new J0 for rear emitter (J0es) because it is very close to the mean value and also consistent with the value reported by King. The rest parameters in this calculation are the same as those in the calculation of Table 1. The J0 values for each layer and the corresponding Voc are shown in Table 4. The Voc decrease from 767.0 mV to 710.1 mV is caused by the recombination on the SiOxNy passivated surface. Since a maximum SRV is used in this calculation, 710.1 mV is a minimum value; in other words, a higher Voc at this step is possible, such as when the front SRV is 5 cm/s, the corresponding Voc is 725 mV. Voc decrease from 710.1 mV to 687.0 mV is caused by recombination on the SiO2 passivated p+ surface.
Table 4. J0 and iVoc of the UTSi solar cell when passivated by SiOxNy and SiO2. J0b + J0e is from Table 1, and J0bs is the reverse saturation current density of the base and J0es is the reverse saturation current density of the emitter when taking SRV into consideration.
StepsComponentJ0 (A/cm2)Voc (mV)Steps
1J0b + J0e4.76 × 10−15767.0Maximum
2J0bs4.23 × 10−14>710.1Front SiOxNy
--J0es6.12 × 10−14----
3J0bs + J0es1.04 × 10−13687.0Front SiOxNy + Rear SiO2

3.4. Measured Voc on Test Samples

To verify the above calculated Voc, test samples based on epi on FZ wafers were designed. These test samples had a similar structure to that of the UTSi solar cell, excluding the fact that the ultrathin silicon in the UTSi solar cell was supported by a steel substrate and the epitaxial layers in the test samples were grown directly on FZ thus no foreign support was needed. Figure 4 shows the structure of these test samples. Again, in the FZ substrate, bulk recombination is negligible and surface recombination dominates the final iVoc. These test samples were processed together with the UTSi solar cells and control samples to eliminate extraneous variables during fabrication. Table 5 lists the lifetime and iVoc values of the test samples measured using a Sinton lifetime tester. These measured iVoc values are between 682–703 mV, and their mean value is 691.7 mV, consistent with the calculated value of 687.0 mV in Table 4.
Figure 4. Structure of the test samples for the UTSi solar cells based on epi on FZ wafer.
Applsci 05 00682 g004
Table 5. Lifetime and iVoc of epi on FZ wafer test samples.
IDLifetime (μs)iVoc (mV)
Test samples383–674682–703

4. Voc Loss Due to Rear Surface Metallization

4.1. Voc Losses Calculation

The reverse saturation current density (J0e) of the emitter is composed of recombination both at the passivated surface (J0es) and at the point contact region (J0e-pc). Therefore, J 0 e = J 0 e s ( 1 f ) + J 0 e p c where J 0 p c = J 100 f ( 1 + 4 ln 2 × W π r + W 2 8 r 2 ) was introduced when the passivated emitter and rear cell (PERC ) solar cell was invented [14], J100 is the saturation current density with 100% rear contact coverage, f is the contact ratio 0.56%, r is the radius of the contact points and W is the cell thickness. The SRV of the point contact region is 107 cm/s [15]. Table 6 summarizes the calculated J0 and Voc values.
Table 6. J0 and Voc values of the thin silicon solar cell after rear surface metallization. J0e-pc is the reverse saturation current density introduced by the point contact on the rear surface.
StepsComponentJ0 (A/cm2)Voc (mV)Steps
3J0bs + J0es1.04 × 10−13687.0Rear SiO2
--J0e-pc9.76 × 10−14----
4J0bs + J0es + J0e-pc2.02 × 10−13670.0Rear contact

4.2. Measured Voc on Test Samples

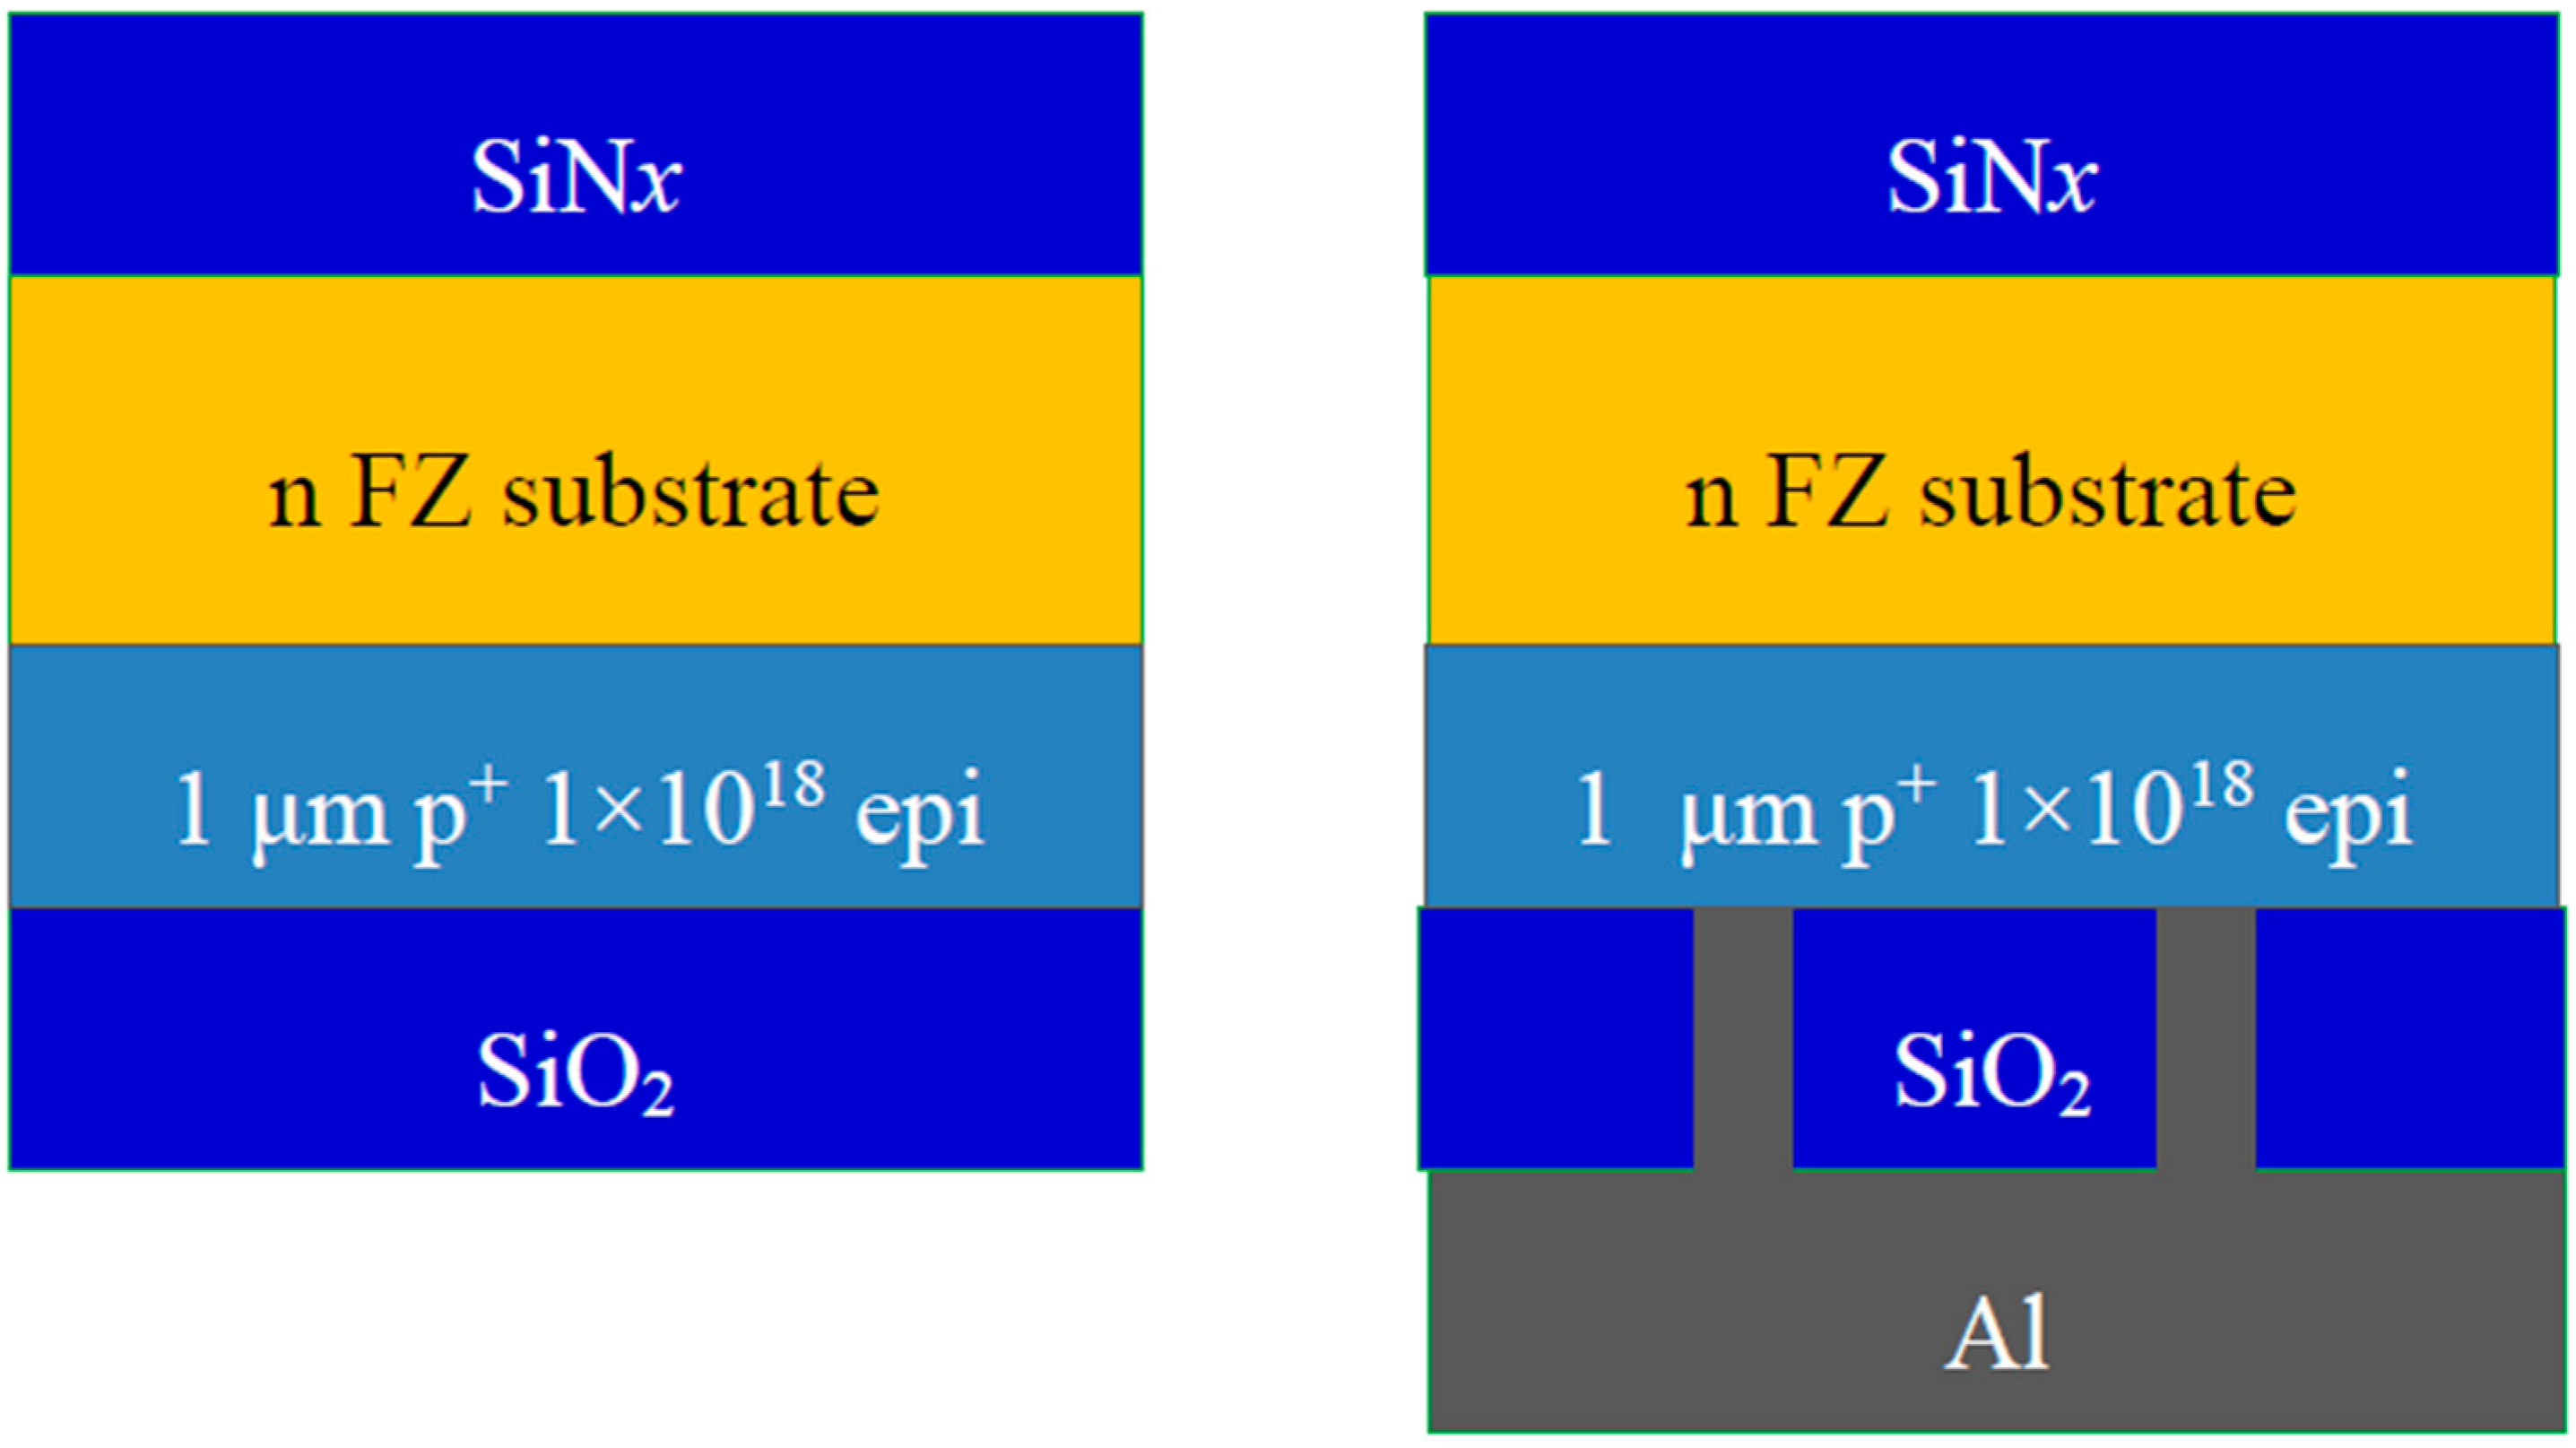
To confirm the calculated results in Table 6 experimentally, test samples based on epitaxial on FZ wafers were made to examine the recombination introduced by the rear pattern and contacts. The test structures are shown in Figure 5, where the left image is the structure after passivation, the right image is the structure after point contact patterning and metallization. The minority carrier lifetime, and iVoc and Voc of these samples were measured at each step as shown in Table 7. The rear point contact patterning and metallization led to a slight decrease in lifetime, iVoc and Voc. The best Voc measured after aluminium metallization was as high as 673 mV. The final Voc values were in the range of 665–673 mV, which are consistent with the calculated value of 670 mV in Table 5. This result demonstrates that the calculation is valid.
Figure 5. Test sample before rear contact patterning (left), PERC rear contact with Al metallization (right).
Applsci 05 00682 g005
Table 7. Lifetime, iVoc and Voc change of test structures before and after rear surface metallization.
StepsFront SiOxNy/Rear SiO2Rear metallization
ValuesLifetime (μs)iVoc (mV)Voc (mV)
445.2685.4665–673

5. Voc Loss Due to Front Surface Metallization

5.1. Laser Doping

The n type front surface is patterned by laser doping, which introduces locally heavy doping within openings. However, laser doping inevitably introduces damage to the surface and bulk of the silicon solar cell. Laser damage can be partially healed by subsequent annealing. The Voc loss depends on the power, speed and wavelength of the laser, the structure of the solar cell and the subsequent annealing temperature. A minimum Voc loss of 6.1 mV has been reported [16]. Figure 6 illustrates this laser doping process on a test sample made of epi on FZ wafer, whose front surface was shallowly textured and passivated by SiOxNy. Based on our experiments, the Voc loss at this laser doping step can be 10–20 mV, and Figure 7 shows the iVoc changes on a test sample in this process.
Figure 6. Laser doping on a textured surface, where the front surface is passivated by SiOxNy (left) and patterned by laser doping (right).
Applsci 05 00682 g006
Figure 7. iVoc changes in the laser doping process on a test sample epi layer on FZ wafer.
Applsci 05 00682 g007

5.2. Metallization

Laser doping is followed by self-aligned metallization (Ni/Cu plating). According to the experimental results, the metallization caused Voc losses are no more than 5 mV. Voc increases after metallization were even observed. This is because the Voc measured before metallization is a local value within the laser opening, while the measurement on the grid represents an average Voc of the whole cell.
According to the measurements, the average Voc loss due to laser doping and metallization is 20 mV. So, after these two steps, Voc decreased from the previous 670.0 mV to 650.0 mV. 650.0 mV is a reasonable estimation, since a maximum Voc of 653 mV was measured in the UTSi solar cells at this processing stage. Table 8 lists the Voc and J0 changes due to front surface processing.
Table 8. J0 and Voc of the thin silicon solar cell after the front surface laser doping and metallization. J0b-ld is the reverse saturation current density introduced by the laser doping and metallization on the front surface.
StepsComponentJ0 (A/cm2)Voc (mV)Steps
4J0bs + J0es + J0e-pc2.02 × 10−13670.0Rear contact
--J0b-ld2.14 × 10−13----
5J0bs + J0es + J0e-pc + J0b-ld4.16 × 10−13650.0Laser doping/metallization

6. Voc Loss Due to Edge Isolation

Edge isolation is an important step for either removing shunts on old edges or redefining active areas of a solar cell. Edge isolation approaches include laser grooving, sawing, grinding with sandpaper and plasma etching [17]. Voc increases have been observed after removing shunts on old edges [18]. In our experiment, the major purpose of edge isolation is to redefine the active areas of a solar cell, and is achieved by a combined process of laser cutting and chemical edge cleaning. A 3 × 3 cm2 raw sample was edge isolated into a 2 × 2 cm2 cell. Based the measurements before and after isolation, a Voc loss as low as 10 mV can be achieved on both the UTSi solar cells on steel and the epitaxial layer on FZ samples. Table 9 lists J0 and Voc values by assuming 10 mV loss during this step. The final Voc is 640.0 mV, which is very close to the best Voc of 642.3 mV measured in the finished UTSi cells on steel.
Table 9. J0 and Voc of the UTSi solar cell after edge isolation. J0-edge is the reverse saturation current density introduced by edge isolation.
StepsComponentJ0 (mA/cm2)Voc (mV)Steps
5J0bs + J0es + J0e-pc + J0b-ld4.16 × 10−13650.0Laser doping/metallization
--J0-edge1.93 × 10−13----
6J0bs + J0es + J0e-pc + J0b-ld + J0-edge6.09 × 10−13640.0Edge isolation

7. Summary of Voc Losses

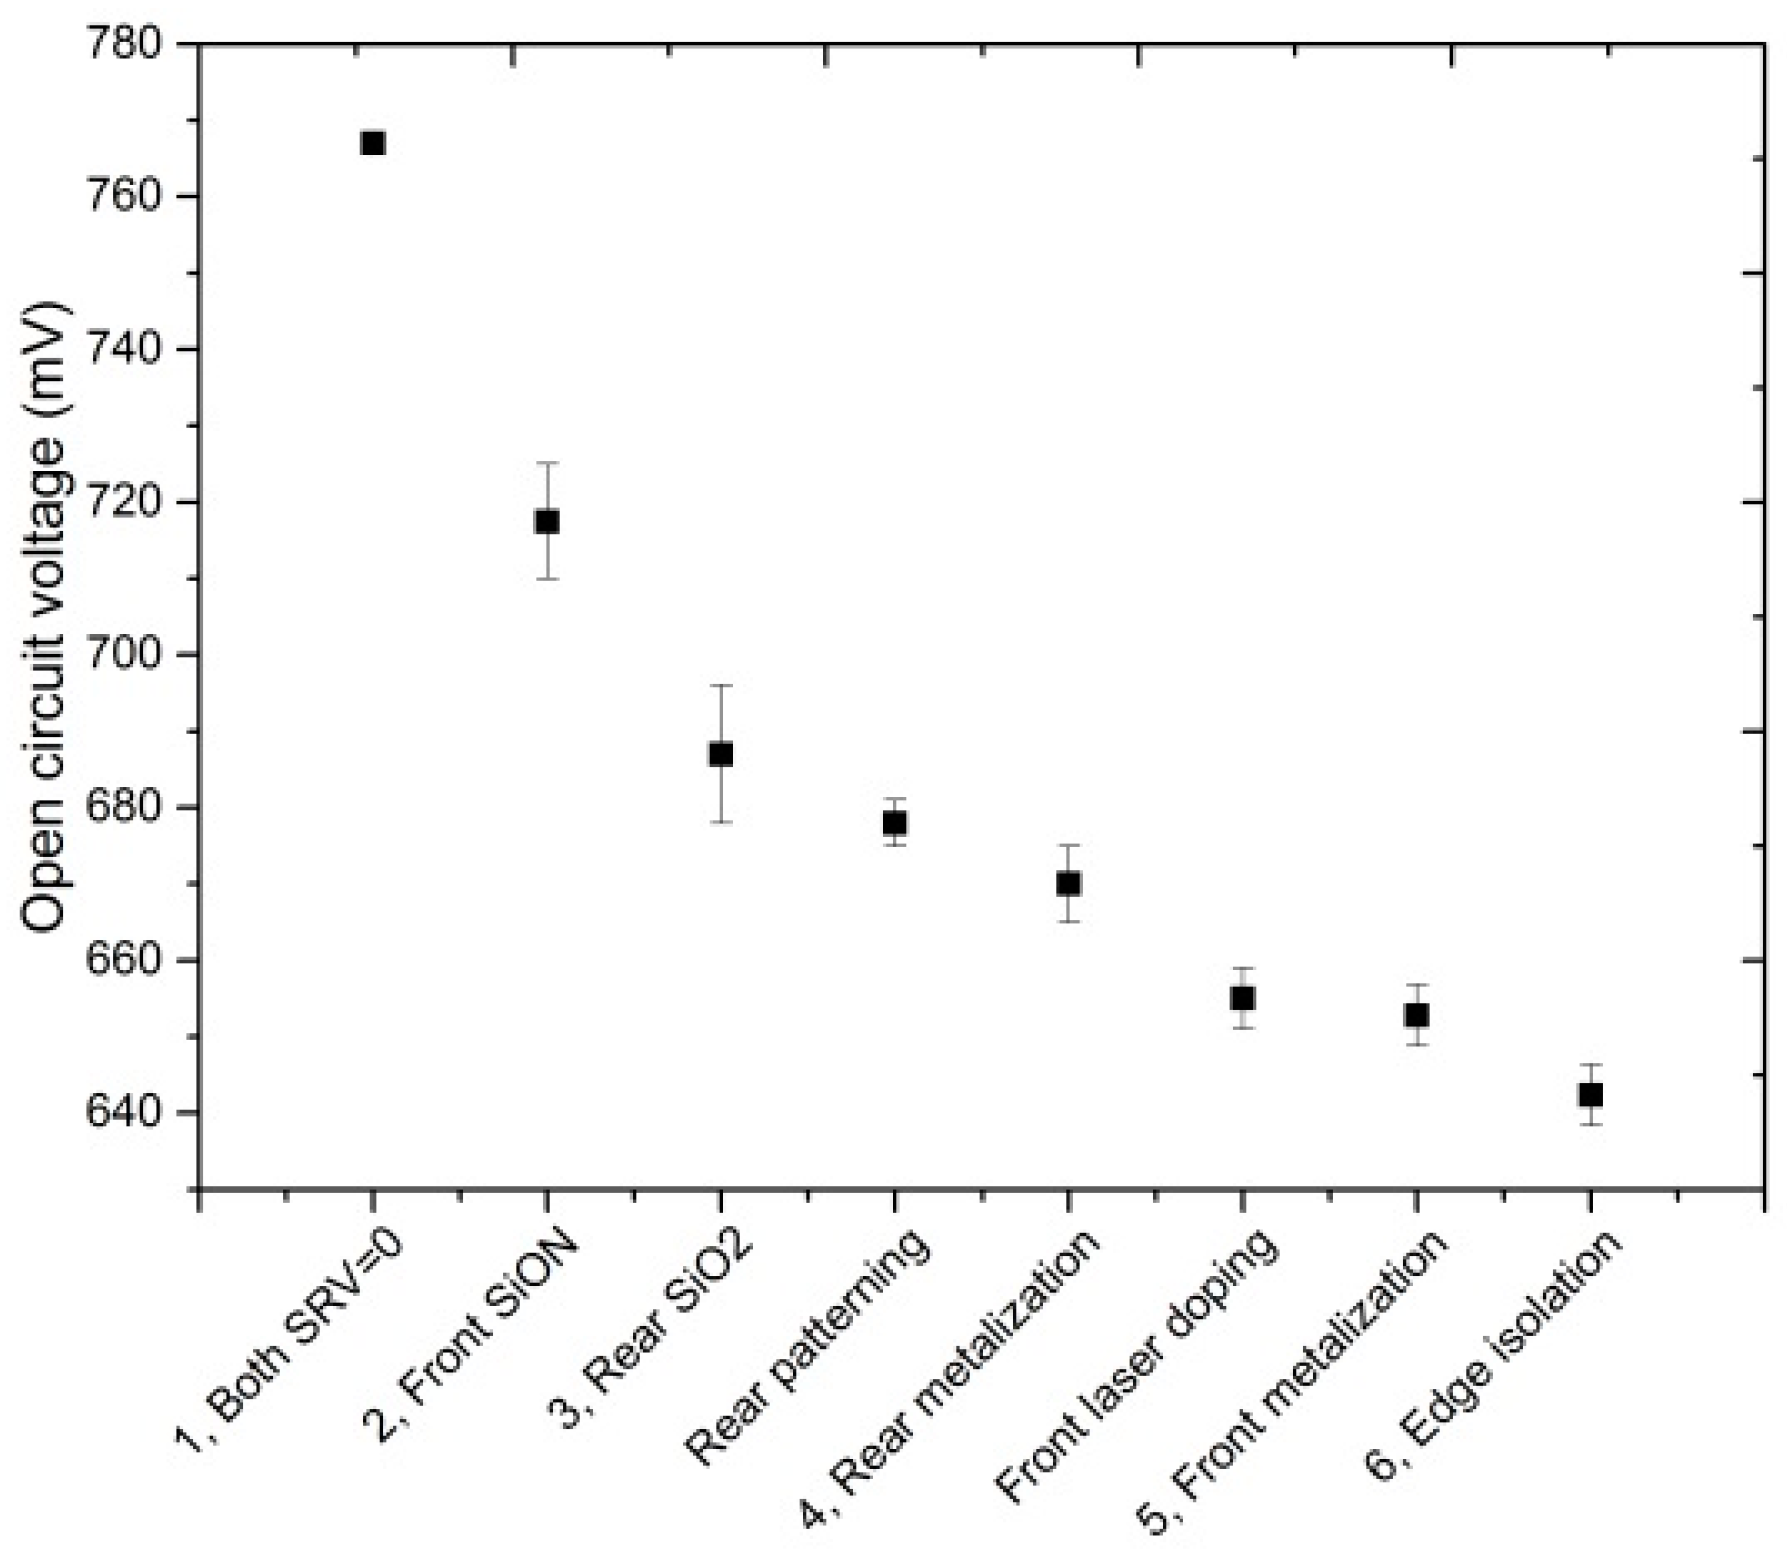
Figure 8 summarizes the Voc at each step. This solar cell has a very high Voc potential when assuming an SRV of 0 cm/s. Each subsequent processing step, such as non-ideal passivation of the front and rear surfaces, laser doping on the front surface, metallization on both front and rear surfaces and edge isolation, introduces an increase of recombination, and thus an increase in J0. Calculation results and measurement results on either FZ test structures or the UTSi solar cells on steel are coincident with each other. The best achieved Voc was of 642.3 mV. The primary Voc loss is due to the recombination at the SiO2 passivated p+ surface. Thus the greatest opportunity to improve Voc lies in the improvement of the rear surface passivation. The second dominant Voc loss that can be further reduced is the 10 mV loss due to edge isolation. Once the cell size increases from 2 × 2 cm2 to 10 × 10 cm2, edge recombination is less critical and zero Voc loss is possible. The third largest Voc loss is caused by the relatively high front SRV. If the SRV decreases from 13 to 5 cm/s, there will be another 15 mV increase. Improvements in these three aspects can lead to a Voc increase of more than 40 mV, hence a Voc of more than 680 mV can be achieved in the UTSi solar cells.
Figure 8. Summary of Voc variation during the fabrication process. The first data point was from the calculation, while the remaining data points were based on the measured results, thus with error bars.
Applsci 05 00682 g008

Acknowledgment

This research was supported in part by the United States Department of Energy SunShot Incubator Program. This program has been supported in part by the Australian government through the Australian Renewable Energy Agency (ARENA). Solar cell test results were provided by the National Renewable Energy Laboratory. Lu Wang would like to thank the China Scholarship Council for partial support. Lu Wang would also like to thank Tingting Feng to edit this paper.

Author Contributions

Lu Wang and Allen Barnett conceived and designed the experiments; Lu Wang, Jianshu Han, Anthony Lochtefeld and Andrew Gerger performed the experiments; Lu Wang analyzed the data and wrote the paper.

Conflicts of Interest

The authors declare no conflict of interest.

References

  1. Tiedje, T.; Yablonovitch, E.; Cody, G.D.; Brooks, B.G. Limiting efficiency of silicon solar cells. IEEE Trans. Electron Devices 1984, 31, 711–716. [Google Scholar] [CrossRef]
  2. Spitzer, M.; Shewchun, J.; Vera, E.; Loferski, J. Ultra high efficiency thin silicon p-n junction solar cells using reflecting surfaces. In Proceedings of the 14th Photovoltaic Specialists Conference, San Diego, CA, USA, 7–10 January 1980; pp. 375–380.
  3. Wolf, M. Updating the limit efficiency of silicon solar cells. IEEE Trans. Electron Devices 1980, 27, 751–760. [Google Scholar] [CrossRef]
  4. Swanson, R.M. Approaching the 29% limit efficiency of silicon solar cells. In Proceedings of the 2005 Conference Record of the Thirty-first IEEE Photovoltaic Specialists Conference, Lake Buena Vista, FL, USA, 3–7 January 2005; pp. 889–894.
  5. Wang, L.; Lochtefeld, A.; Han, J.; Gerger, A.P.; Carroll, M.; Ji, J.; Lennon, A.; Li, H.; Opila, R.; Barnett, A. Development of a 16.8% Efficient 18-μm Silicon Solar Cell on Steel. IEEE J. Photovol. 2014, 4, 1397–1404. [Google Scholar] [CrossRef]
  6. Wang, L.; Li, H.; Shen, C.; Han, J.; Teng, P.; Abbott, M.; Lochtefeld, A.; Opila, R.; Barnett, A. Photoluminescence analysis of a 16.8% efficient 18-um silicon solar cell. Int. J. Emerg. Technol. Adv. Eng. 2015, 5, 8–14. [Google Scholar]
  7. Clugston, D.A.; Basore, P.A. PC1D version 5: 32-bit solar cell modeling on personal computers. In Proceedings of the 1997 Conference Record of the Twenty-Sixth IEEE Photovoltaic Specialists Conference, Anaheim, CA, USA, 29 September–3 October 1997; pp. 207–210.
  8. Ai, B.; Zhang, Y.; Deng, Y.; Shen, H. Study on device simulation and performance optimization of the epitaxial crystalline silicon thin film solar cell. Sci. China Technol. Sci. 2012, 55, 3187–3199. [Google Scholar] [CrossRef]
  9. Hallam, B.; Tjahjono, B.; Wenham, S. Effect of PECVD silicon oxynitride film composition on the surface passivation of silicon wafers. Sol. Energy Mater. Sol. Cells 2012, 96, 173–179. [Google Scholar] [CrossRef]
  10. Sinton, R.A.; Cuevas, A. Contactless determination of current-voltage characteristics and minority—Carrier lifetimes in semiconductors from quasi-steady-state photoconductance data. Appl. Phys. Lett. 1996, 69, 2510–2512. [Google Scholar] [CrossRef]
  11. PV Lighthouse. Available online: http://www.pvlighthouse.com.au/calculators/calculators.aspx (accessed on 23 September 2015).
  12. King, R.R.; Swanson, R.M. Studies of diffused boron emitters: Saturation current, bandgap narrowing, and surface recombination velocity. IEEE Trans. Electron Devices 1991, 38, 1399–1409. [Google Scholar] [CrossRef]
  13. Altermatt, P.P.; Schenk, A.; Geelhaar, F.; Heiser, G. Reassessment of the intrinsic carrier density in crystalline silicon in view of band-gap narrowing. J. Appl. Phys. 2003, 93, 1598–1604. [Google Scholar] [CrossRef]
  14. Green, M.A.; Blakers, A.W.; Zhao, J.; Milne, A.M.; Wang, A.; Dai, X. Characterization of 23-percent efficient silicon solar cells. IEEE Trans. Electron Devices 1990, 37, 331–336. [Google Scholar] [CrossRef]
  15. Sabbah, A.; Riffe, D.M. Measurement of silicon surface recombination velocity using ultrafast pump-probe reflectivityin the near infrared. J. Appl. Phys. 2000, 88, 6954–6957. [Google Scholar] [CrossRef]
  16. Sugianto, A.; Bovatsek, J.; Wenham, S.; Tjahjono, B.; Xu, G.; Yao, Y.; Hallam, B.; Bai, X.; Kuepper, N.; Chong, C.M. 18.5% laser-doped solar cell on CZ p-type silicon. In Proceedings of the 2010 35th IEEE Photovoltaic Specialists Conference (PVSC), Honolulu, HI, USA, 20–25 June 2010; pp. 000689–000694.
  17. Hauser, A.; Hahn, G.; Spiegel, M.; Feist, H.; Breitenstein, O.; Rakotoniaina, J.; Fath, P.; Bucher, E. Comparison of different techniques for edge isolation. In Proceedings of the 17th European Photovoltaic Solar Energy Conference; McNelis, B., Palz, W., Ossenbrink, H.A., Eds.; WIP-ETA: Florence, Italy, 2001; pp. 1739–1742. [Google Scholar]
  18. Hamammu, I.; Ibrahim, K. Solar cell edge shunt isolation: A simplified approach. In Proceedings of IEEE International Conference on Semiconductor Electronics, Pulau Pinang, Malaysia, 19–21 December 2002; pp. 230–232.