Abstract
The ever-growing number of applications for satellites is being compromised by their poor direct positioning precision. Existing orthoimages, such as enhanced thematic mapper (ETM+) orthoimages, can provide georeferences or improve the geo-referencing accuracy of satellite images, such ZY-1-02C images that have unsatisfactory positioning precision, thus enhancing their processing efficiency and application. In this paper, a feasible image matching approach using multi-source satellite images is proposed on the basis of an experiment carried out with ZY-1-02C Level 1 images and ETM+ orthoimages. The proposed approach overcame differences in rotation angle, scale, and translation between images. The rotation and scale variances were evaluated on the basis of rational polynomial coefficients. The translation vectors were generated after blocking the overall phase correlation. Then, normalized cross-correlation and least-squares matching were applied for matching. Finally, the gross errors of the corresponding points were eliminated by local statistic vectors in a TIN structure. Experimental results showed a matching precision of less than two pixels (root-mean-square error), and comparison results indicated that the proposed method outperforms Scale-Invariant Feature Transform (SIFT), Speeded Up Robust Features (SURF), and Affine-Scale Invariant Feature Transform (A-SIFT) in terms of reliability and efficiency.
1. Introduction
In the application of satellite technology, high-accuracy geolocation and joint observation of multi-source data have emerged as core issues in the fields of photogrammetry and remote sensing. Although the positioning precision of satellites on a global scale has improved steadily, as seen with ZY3, the overall positioning precision of some satellites is low and unstable owing to different design purposes and hardware configuration deficiencies, restricting their application. ZY-1-02C, which is equipped with a multispectral (MS) camera with 10 m resolution, a panchromatic (PAN) camera with 5 m resolution, and a high-resolution PAN camera with 2.36 m resolution, is a satellite that is used for surveying land resources. The overall positioning precision of this satellite imagery, whose processing level is aimed at sensor geometry, is approximately 100 m, and achieves only 1000 m precision under extreme conditions. The conventional approach of manually selecting a large number of control points cannot meet the demands of mass data processing. In contrast, an automatic control point matching method—namely, multi-source satellite image matching—allows the combined processing of different data, providing many possibilities for multi-source applications [1]. This study focused on the use of multi-source image registration to compensate for the drawbacks of ZY-1-02C in positioning in the sensor geometry processing, resulting in a rich data source and achieving a high-utility earth observation method.
Automatic multi-source image matching (AMSIM), which is widely used in photogrammetry and remote sensing, has been studied for decades [2,3,4,5,6,7]. Compared to manually measuring control points, image matching can effectively reduce workload and is appropriate for processing mass data. Image matching can be broadly classified into two categories: area-based matching (ABM) and feature-based matching (FBM) [8]. ABM performs a measurement using gray or phase data in a fixed-size window from two images. The most commonly used algorithms are the methods based on mutual information [9,10], frequency-domain correlation [11], and cross-correlation [12,13]. However, ABM exhibits low efficiency. In contrast, FBM extracts salient features from images, can achieve sub-pixel accuracy, and facilitates rapid processing.
Well-known feature extraction operators [14], SIFT [15], and SURF [16,17] have been widely used in image matching. Other methods based on features, such as lines [18], edges [8], contours [19], and shapes [20], are also used in numerous applications. Feature points have been shown to exhibit excellent performance and have been successfully applied to various matching cases, including AMSIM [21,22]. However, some problems remain, such as uneven precision control, mismatch, and high cost. Frequency-domain correlation has also been applied to some AMSIM cases. Phase correlation is known to identify integer pixel displacement. Several Fourier domain methods, and closely-related spatial domain variations, have been proposed for estimating translational shift with sub-pixel accuracy between image pairs [23,24,25]. Liu et al. proposed robust phase correlation methods for sub-pixel feature matching, based on the singular value decomposition method [26]. Nevertheless, phase correlation algorithms may have gross errors in matching results due to minor noise and differences between images.
Gross errors in image matching—namely, the mismatching of point pairs—need to be addressed. Many experiments [27] have indicated that mismatching is inevitable in areas that contain repeated or insufficient textures, clouds, or shades. Hence, gross error elimination has emerged as another key factor in judging algorithms [28]. Conventional methods for eliminating gross errors are classified into two categories. One method involves complex iterative computation in terms of automatic adjustment [29]. However, it is strongly dependent on the data quality as well as being capital-intensive and unreliable. The other method manually eliminates gross errors and is inapplicable to automatic photogrammetry [30]. Kang et al. proposed an outlier detection method using the Triangulated Irregular Network (TIN) structure, which was successfully applied for automatic registration of terrestrial laser scanning point clouds [31,32]. This method effectively estimates complex distortions of point cloud data in local areas and eliminates unapparent gross errors in the overall statistics.
When conducting AMSIM, existing satellite orthoimages provide a georeference for satellite images that have unsatisfactory positioning precision. Enhanced thematic mapper (ETM+) images, which are acquired from the Landsat 7 platform, have been used for remote sensing [33,34]. The Landsat 7 satellite, which was launched in 1999, is equipped with an eight-band MS camera with a 15 m resolution. The ETM+ images captured by Landsat 7 have broad coverage and relatively high positioning precision. Thus, Digital Orthophoto Maps (DOMs), which are also called orthorectified imagery, of ETM+ were adopted as georeferenced images in our approach. AMSIM was conducted to achieve high and uniform global positioning accuracy of ZY-1-02C images.
Even though the positions of the satellite platforms and sensors are rigorously controlled in relation to satellite images from different sources, errors in rotation, scaling, and translation, relative to the same ground target, still occur in image acquisition, [30,35]. A strong relationship exists among these errors, which restricts image matching algorithms. The performance of image matching methods depends on the prediction of the initial position of points to be matched and gross error elimination. In other words, predicting initial positions and eliminating gross errors are the two crucial requirements for stable, precise, and effective image matching methods.
In this study, AMSIM achieved a co-registration accuracy between ZY-1-02C Level 1 images and the DOMs of ETM+. Corresponding point pairs in image space were first obtained according to the rational polynomial coefficients (RPCs) model. Rotation and scale variances between the images were calculated on the basis of these image point pairs. The ZY-1-02C images were then resampled based on the obtained rotation and scale variances. The resampled images were processed by blocking the overall phase correlation (OPC) with ETM+ orthoimages, to generate the translation parameters of the initial matching. The Harris detector was also applied for extracting feature points from the resampled ZY-1-02C images. These feature points were used in image matching. Normalized cross-correlation (NCC) and least-squares matching (LSM) were used for image matching between the resampled ZY-1-02C image and ETM+’s DOM. Finally, the matched points were assembled to construct a triangle network structure. According to the matched points, the local statistic vectors (LSV) of the point pairs were obtained statistically to detect and eliminate the gross errors. The experimental results indicate that the proposed approach can achieve stable and correct matching when the resolution difference is not large (1:3). The matching results of the ZY-1-02C image showed a positioning precision of <10 m.
2. Methods
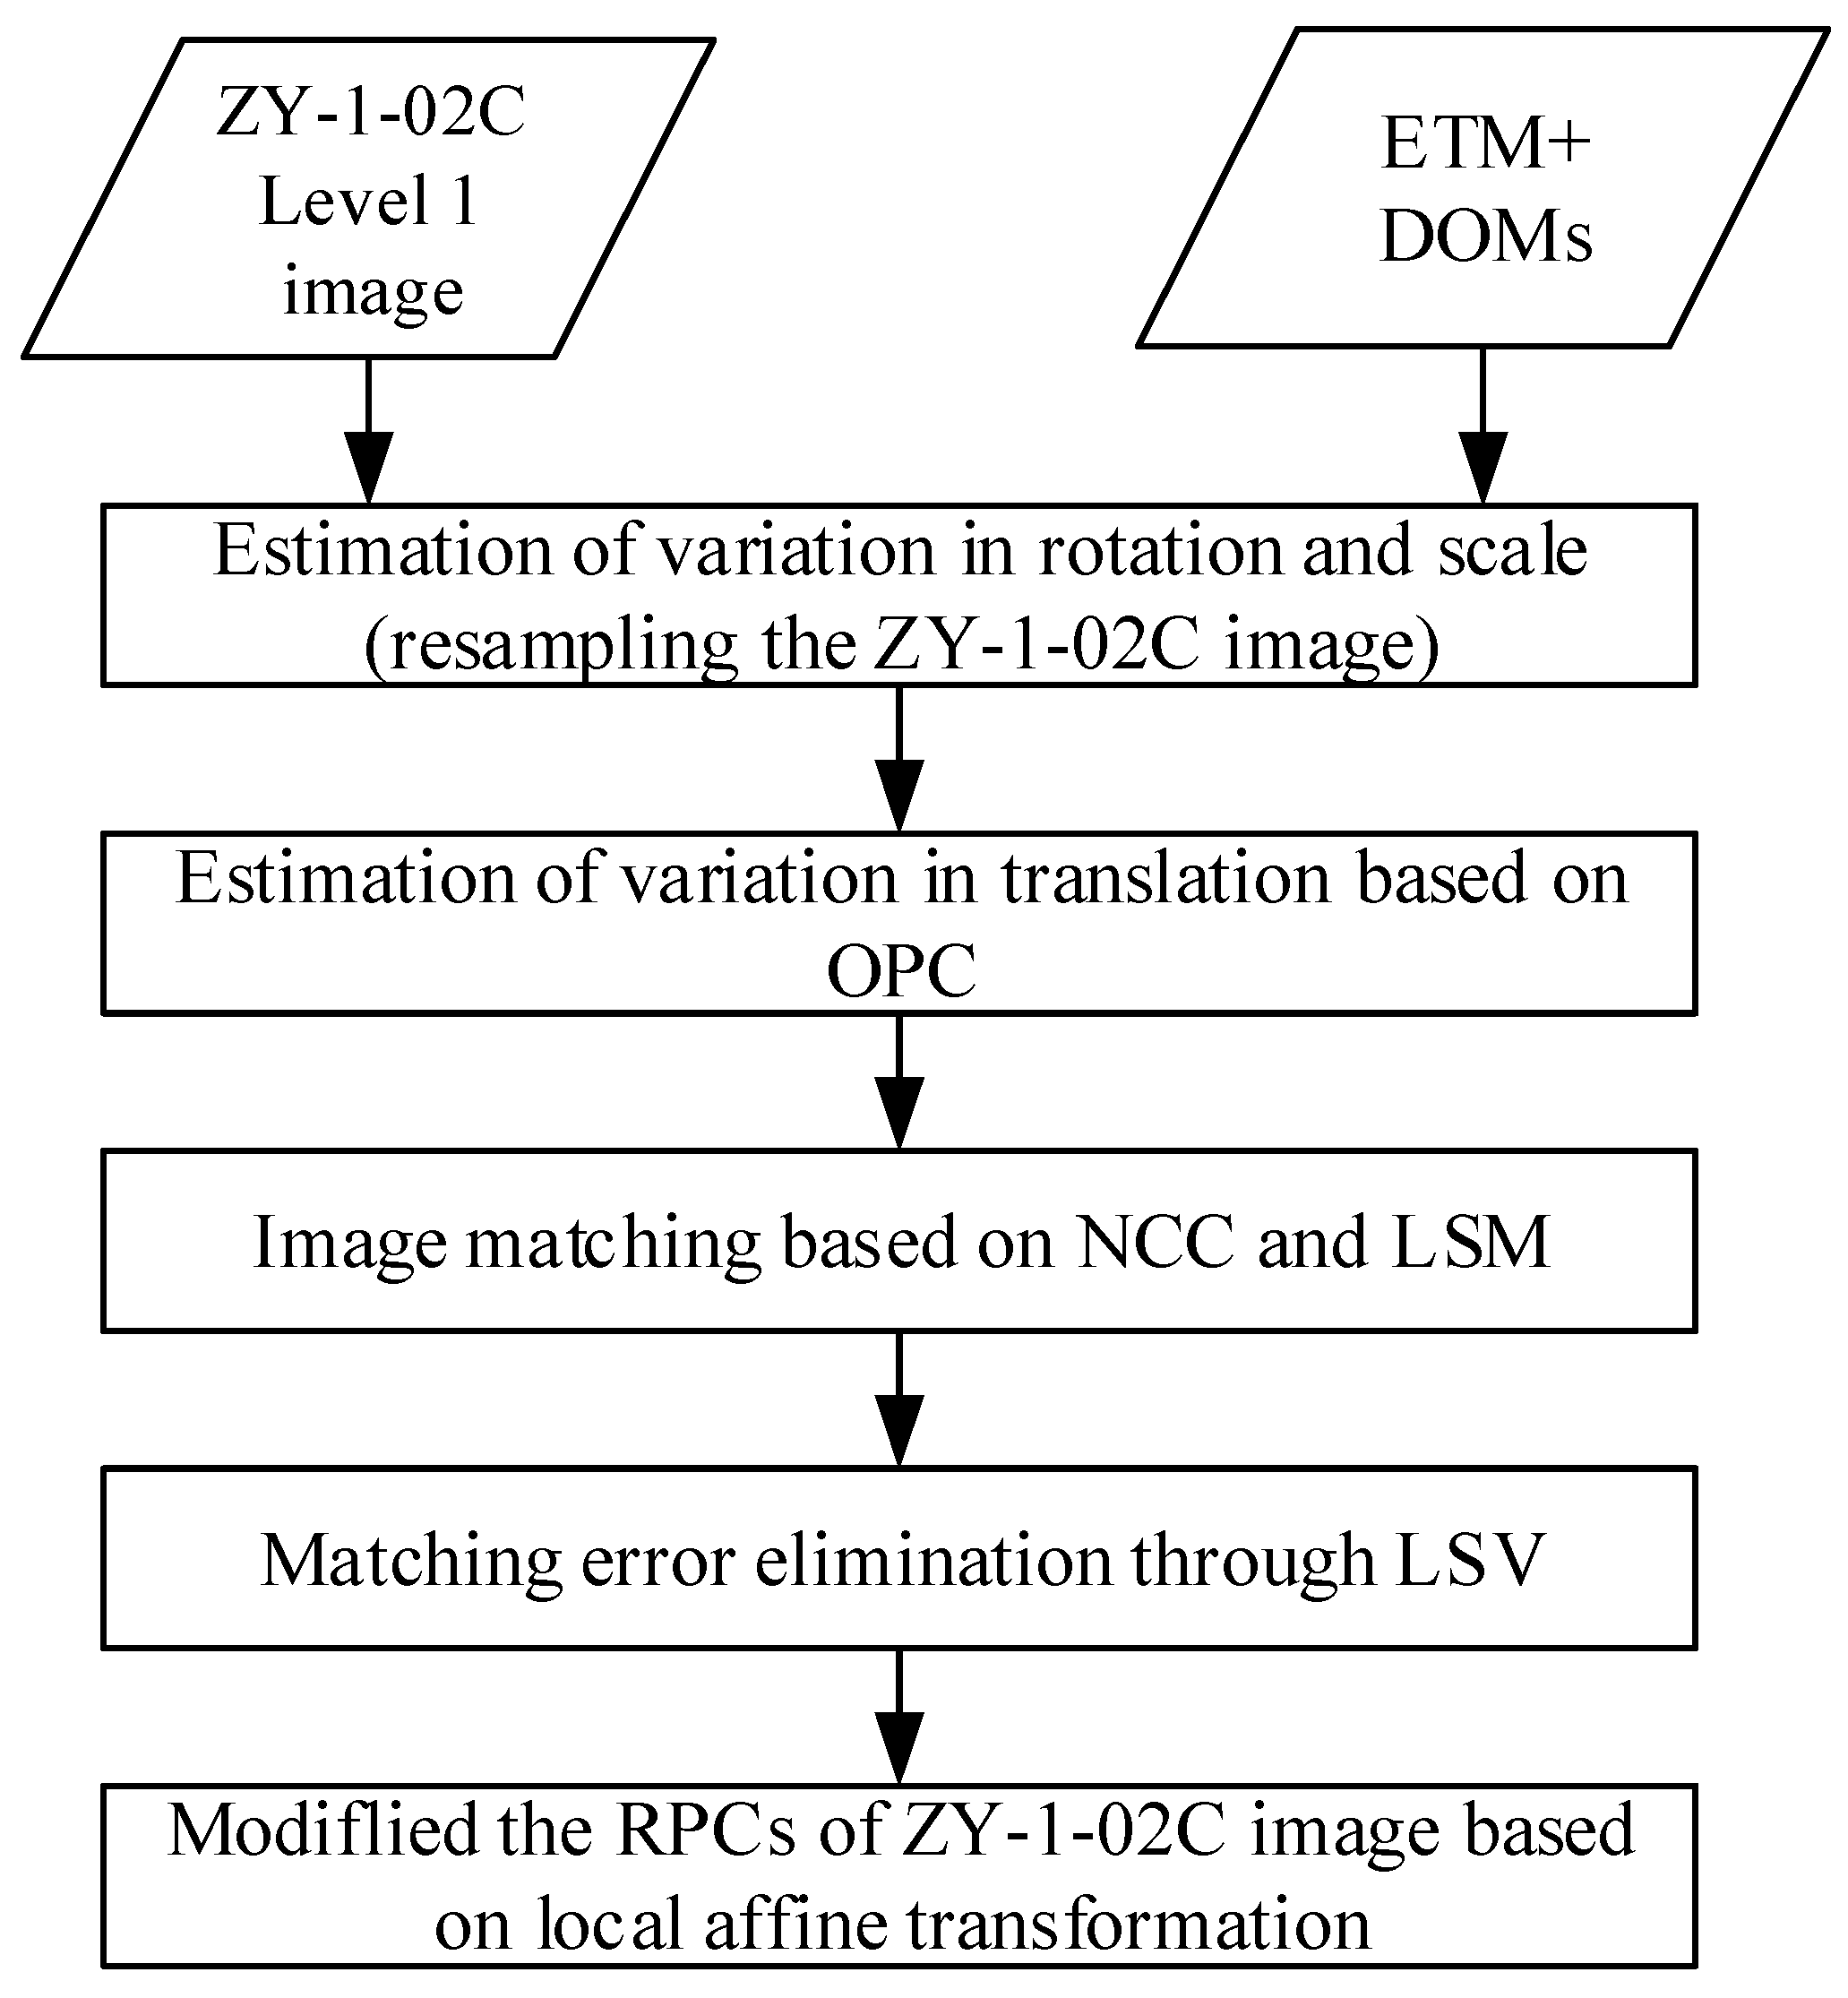
The two crucial requirements for an effective AMSIM method are initial matching value prediction and matching error elimination. Our work focused on these requirements, as shown in Figure 1. Initial matching value prediction includes two steps. In the first step, two or more object points within an overlapping area were projected onto both images, based on the RPCs or some other direct models. RPCs can be used to calculate the parameters of the resampling model, as the resolution of the ETM+ orthoimages is lower than the resolution of the ZY-1-02C images. In the second step, the resampled Zy-1-02C images were processed by blocking the overall phase correlation (OPC) with the ETM+ orthoimages to generate the translation parameters, providing the shift values for NCC. Then, image matching was conducted by NCC and LSM. Finally, according to the matched points, the LSV of the point pairs were obtained statistically to detect and eliminate the gross errors.
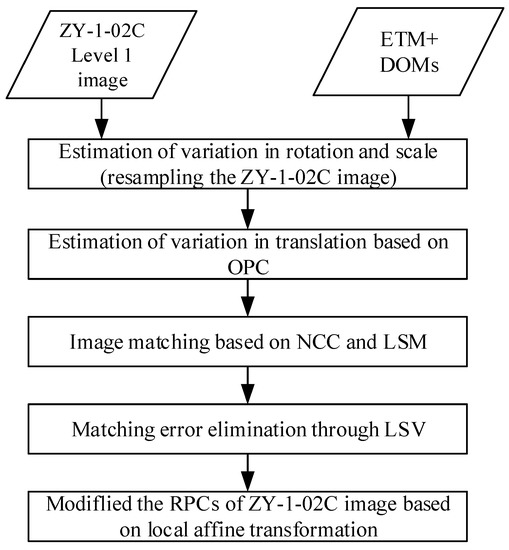
Figure 1.
Flowchart of the process used in this study.
2.1. Initial Matching Point Detection
Considering image differences, the mathematical model between two satellite images can be described based on three aspects: rotation, scale, and translation. For automatic matching of multi-source satellite images, these aspects are usually unknown before processing.
Given the inconsistent positioning precision of RPC, directly predicting the initial value of image matching with the RPC model is generally unreliable. In the RPC model, rotation and scale are typically considered as systemic parameters, whereas translation represents the random parameter. The strong correlation among these three parameters requires minimal separation processing. Image matching should be convenient. Thus, the image to be matched is first resampled using the rotation and scale parameters, followed by initial value prediction of the matching points with the translation parameters. Using RPC to obtain relatively stable prediction parameters [36,37], followed by overall correlation to determine relatively random prediction parameters, is the key to predicting the initial value of image matching.
2.1.1. Estimation of Variation in Rotation and Scale
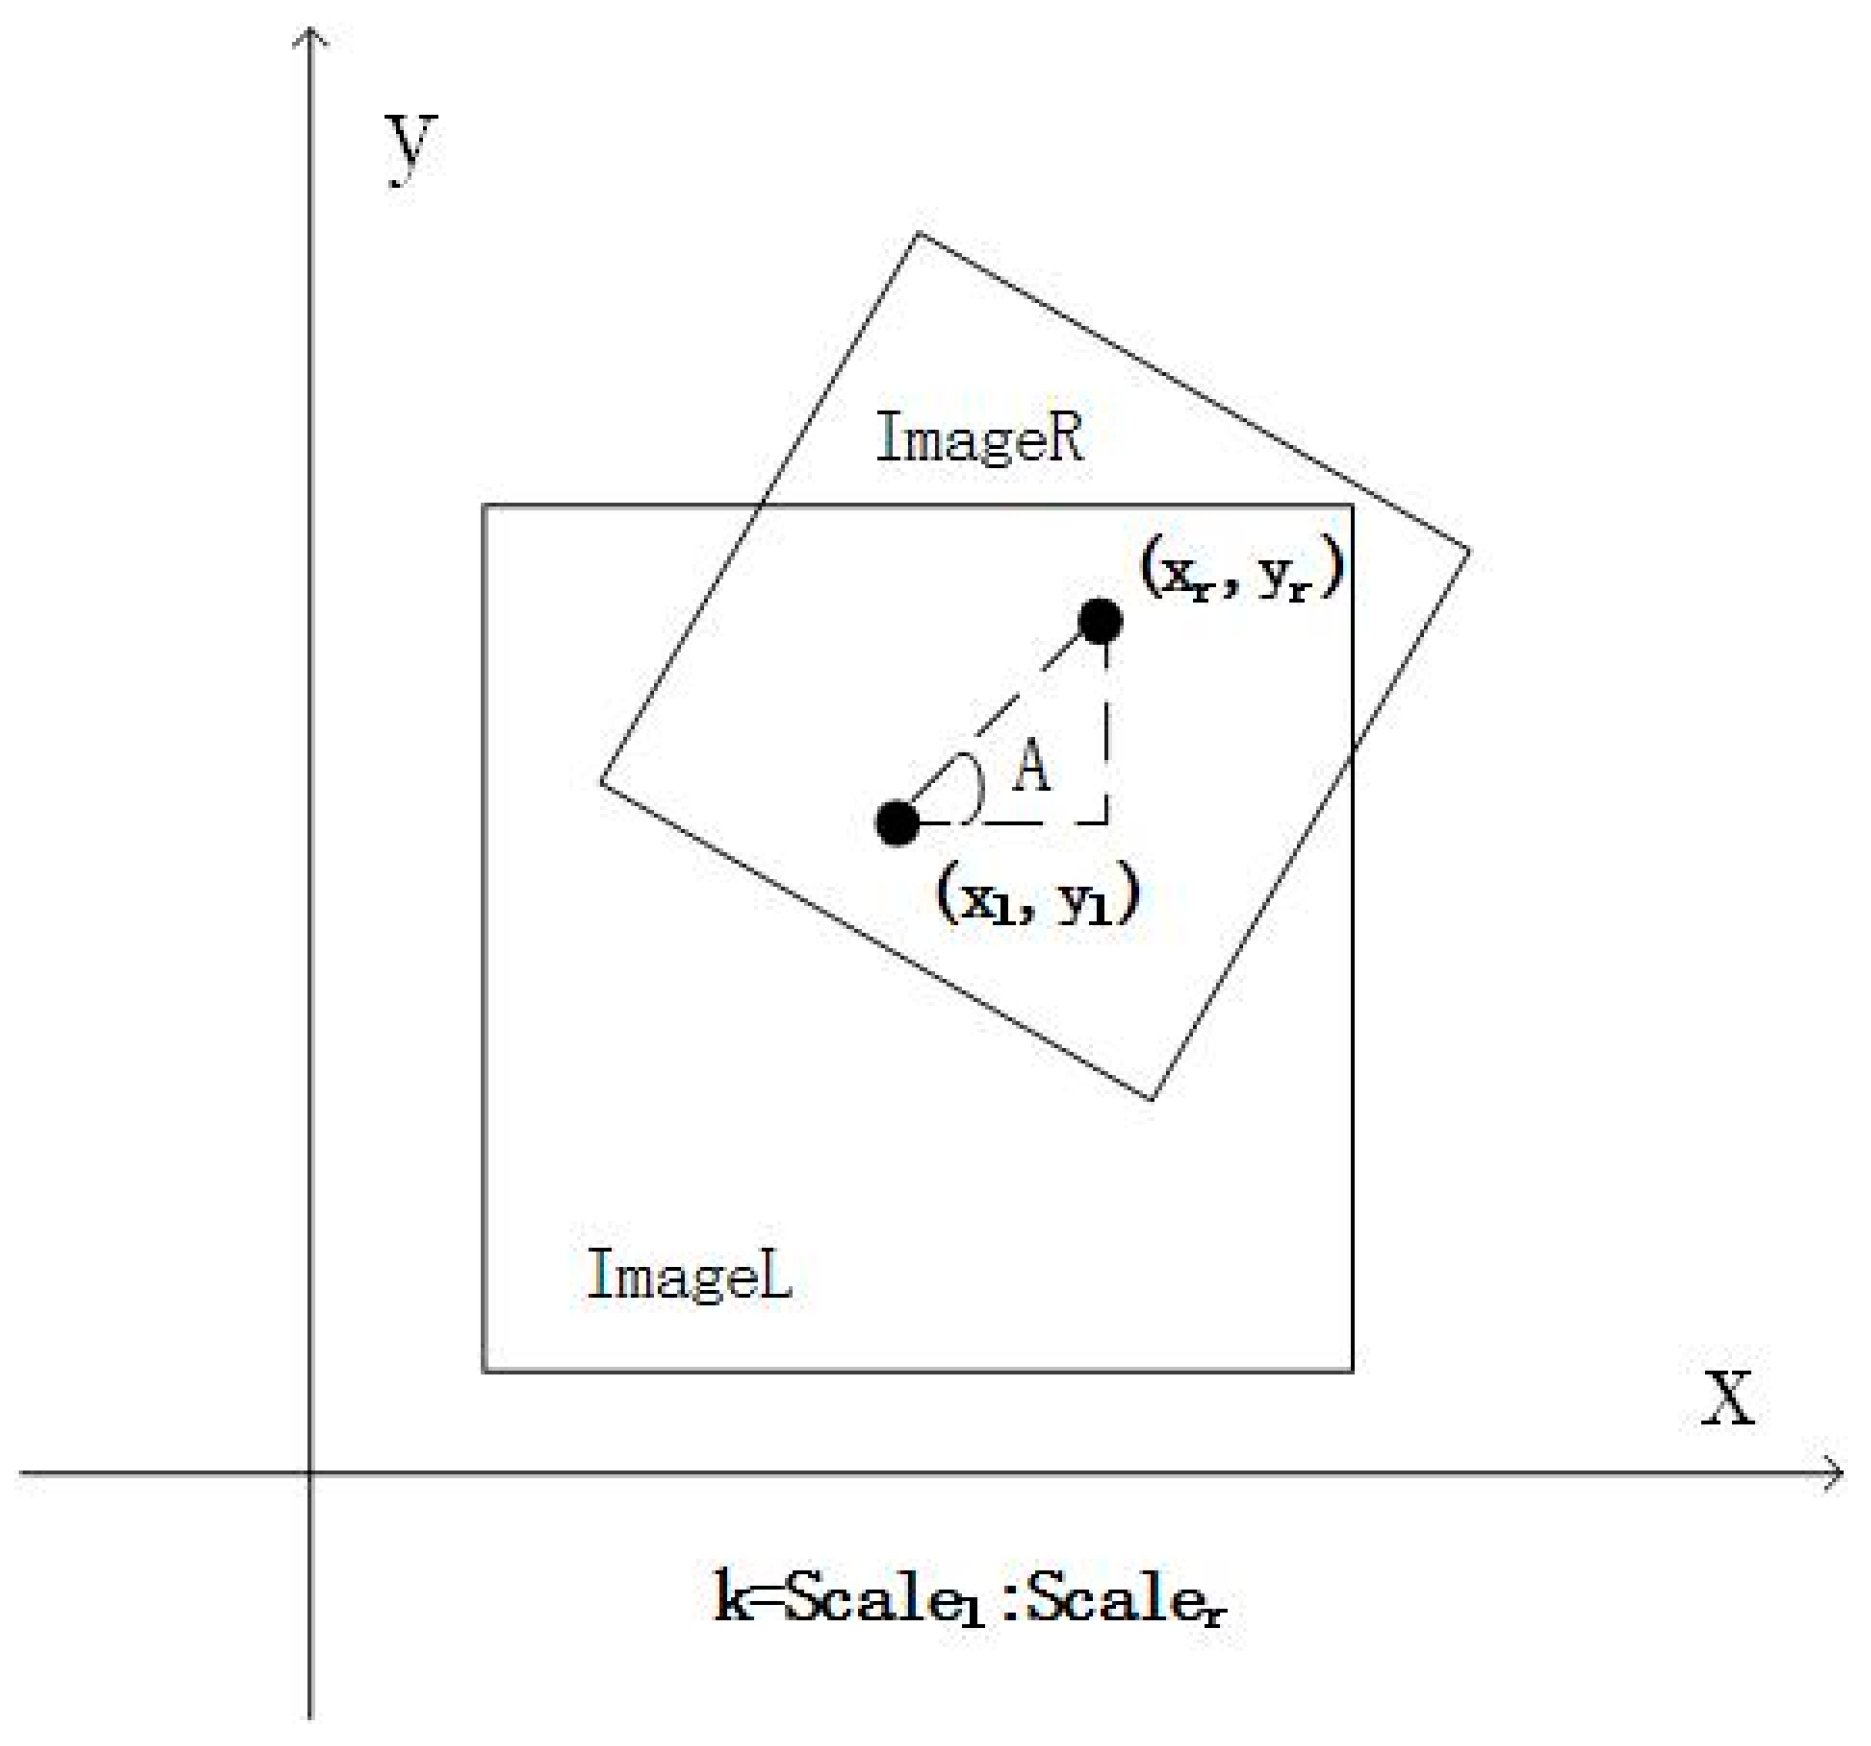
To address the problem of rotation and scale variances between images, establishing a uniform space reference is crucial. Image point pairs that correspond to the same ground tie point can be determined with RPC in the ZY-1-02C imagery and geographic information in the DOMs of ETM+ and SRTM, which were first detected by Harris detectors. As shown in Figure 2, a uniform image coordinate system was adopted. The coordinate system of one image was selected as the standard so variances in rotation, scale, and translation would be reflected in the coordinates of the corresponding points.
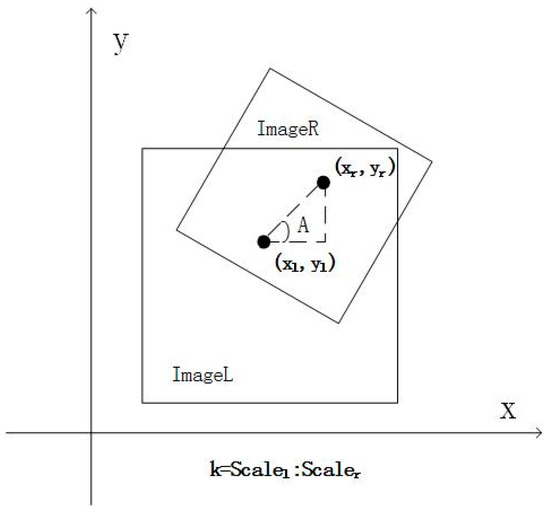
Figure 2.
Transformation between images. Here, and are the normalized coordinates of the two images, is the rotation angle, and is a scale parameter.
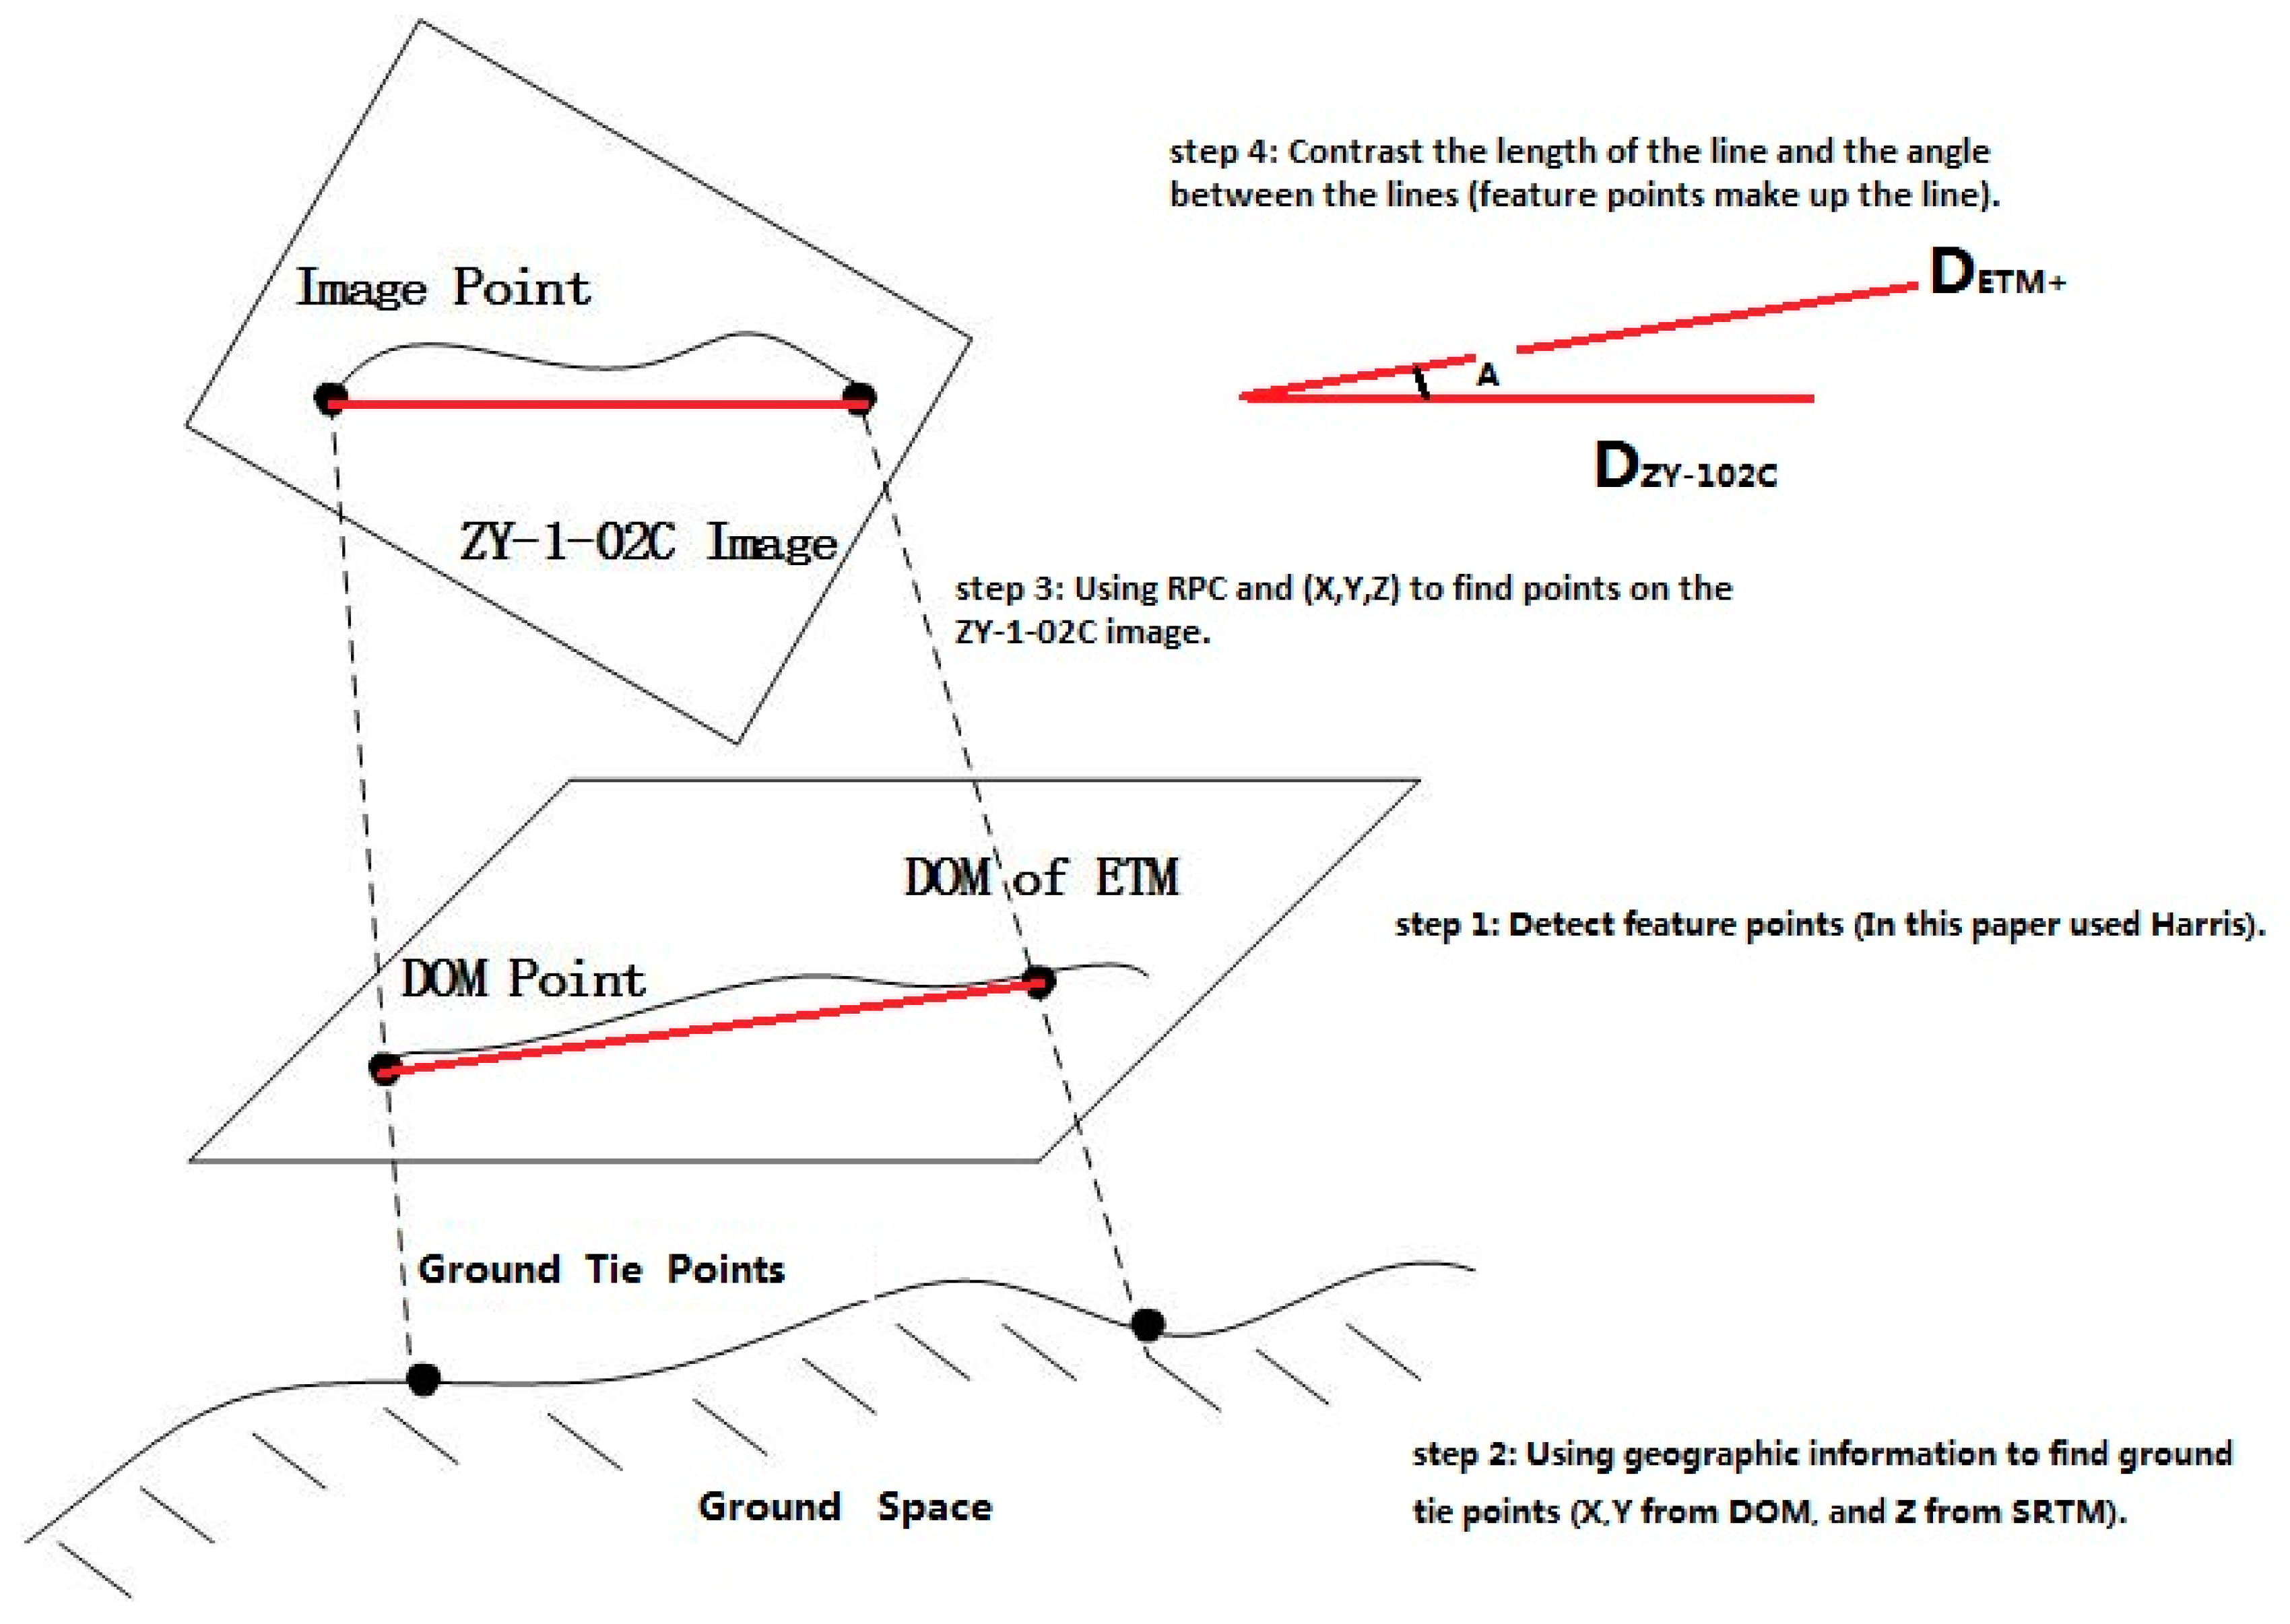
Figure 3 shows the model for transforming one image space to another image space. There are four steps in this process. Step 1: Detect feature points on the DOM of ETM+ by Harris detector. Step 2: Use geographic information to find the ground tie point (X, Y, Z). The X and Y are found in the DOM, and Z is found in the SRTM. Step 3: Use the RPC to find the ground tie point (X, Y, Z) on the ZY1-02C imagery with Equation (1). Step 4: The feature points create a line, where DETM+ and DZY-102c represent the length of the line in ETM+ and ZY-1-02C imagery. Contrast the length of the line and the angle between the lines by using Equation (2).
where and are the normalized coordinates of the image space and the ground space points, respectively, and are the cubic polynomials that represent the rigorous geometric sensor model of satellite imagery.
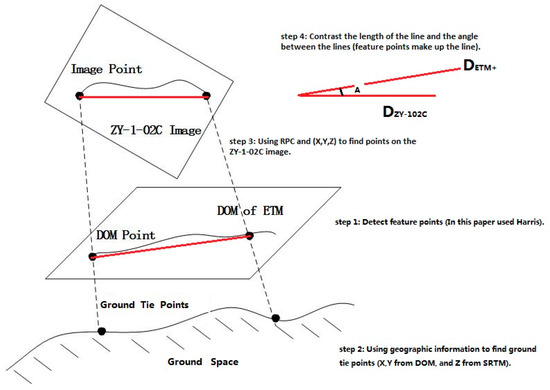
Figure 3.
Model of tie point between ground space and image space.
The rotation angles of the lines were used to obtain the value of A, and the lengths of the lines were used to obtain the value of k, as shown in Figure 2. The following equation represents a simple and effective model for determining the relationship between the two images. To calculate the model in Equation (2), the RPCs and the geographic information of the DOMs play important roles. As shown in Figure 2 and Figure 3, two or more pairs of image points should be used to connect the lines between two image spaces. These statistical points can calculate the value of A and k, which is the preparation work for image matching.
where and are the rotation angles of the lines in the two images, and are the lengths of the lines in the two images, is the rotation angle, k is a scale parameter, and is the number of statistical samples.
Owing to the inconsistent positioning precision, these point pairs may be non-correspondent or far away. However, the relative relationship in ZY-1-02C imagery space between the point pairs tends to be consistent, regardless of whether the geographical positioning is accurate or not. For instance, the distances and angles of lines between two groups of point pairs could highlight the rotation and scale variances between images. In this study, the lengths and angles of lines, consisting of image point pairs with identical geographic coordinates, were calculated to determine the relationship between images in terms of rotation and scale.
2.1.2. Estimation of Variation in Translation
OPC is a nonlinear frequency-domain correlation technique that is based on the Fourier shift property, which is the shift in the spatial coordinate frame of two functions that results in a linear phase difference in the frequency domain of the Fourier transforms (FTs) of the two functions, as shown in the following equations:
where and are the two image functions of the spatial coordinate frames, and are the corresponding image functions of the frequency domain of the FTs, and and are the parameters of the shift [25].
Between the resampled ZY-1-02C image and the DOM of ETM+, the OPC results produce only the overall translation parameters, i.e., . A high level of accuracy is not required. Considering the complex matching conditions, the 20-pixel accuracy of OPC can meet the image-matching requirements for NCC. Given the large size of the scene images, (the size of a ZY-1-02C image scene is approximately 12,000 × 12,000 pixels), OPC is conducted in several image blocks of one image scene to improve its efficiency. Each block has a group of translation parameters for image matching.
2.2. Improving Matching-Point Location Estimation by NCC and LSM
With the translation parameters obtained by OPC, the position of the conjugate points was predicted. The conjugate points can be searched for in a relatively small window around the predicted position. For remote sensing image matching with small rotation and scale variances and initial matching values with good quality, Harris-supported NCC and LSM methods have been shown to be highly efficient and precise [38]. Thus, in our approach, feature extraction based on the Harris detector and matching based on NCC and LSM were adopted for precise image matching [14,39]. The Harris detector is known for its high speed and stability. We used this detector to extract apparent features and refine feature points to the sub-pixel level by using the Förstner operator. To extract an appropriate number of evenly distributed feature points, the image was segmented into 50 by 50 pixel grids. The features with the strongest Harris value in each grid were then extracted. To enhance the positioning precision of the ZY-1-02C by image matching, the feature points needed to correlate with the original ZY-1-02C image. In this study, feature points with positions that corresponded to those of the original image were extracted from the resampled ZY-1-02C image. The corresponding points were then searched from the ETM+ orthoimage. Thus, extracting feature points from the resampled ZY-1-02C images, which were connected to the original ZY-1-02C images, and searching for the corresponding points in DOMs of ETM+, was a good approach for the case study. After feature extraction, the coordinates of the corresponding points on DOMs of the ETM+ images were estimated using the following equation:
where is the point on the DOMs of the ETM+ images, is the feature point in the resampled ZY-1-02C images, and represents the translation parameters.
A small search window was needed around the estimated position to find the conjugate points, which ensured high efficiency and reliability of the matching results when an NCC-based approach is used. To achieve sub-pixel matching precision, the corresponding points obtained by NCC were used as the initial values for LSM. Proposed by Ackermann [40], LSM uses adequate information in the image window that used a second-degree polynomial model for the adjustment calculation.
2.3. Finalizing the Matching Process by LSV
The different imaging timing and undulating terrain in ZY-1-02C images and DOMs of ETM+ can cause errors in image matching. Such error matches must be eliminated before the images can be used to refine the RPCs of ZY-1-02C. However, elimination is difficult when a mathematical model is used to directly describe the image relationships. In most cases, the effects of the differences can be minimized when the judging area is reduced to a relatively small area [27]. In this case, local image relationships could be accurately approximated on a small surface, as shown in Figure 3. A transformation vector that is consistent with statistical laws can be fitted with the coordinate differences between correct matches on the small surface.
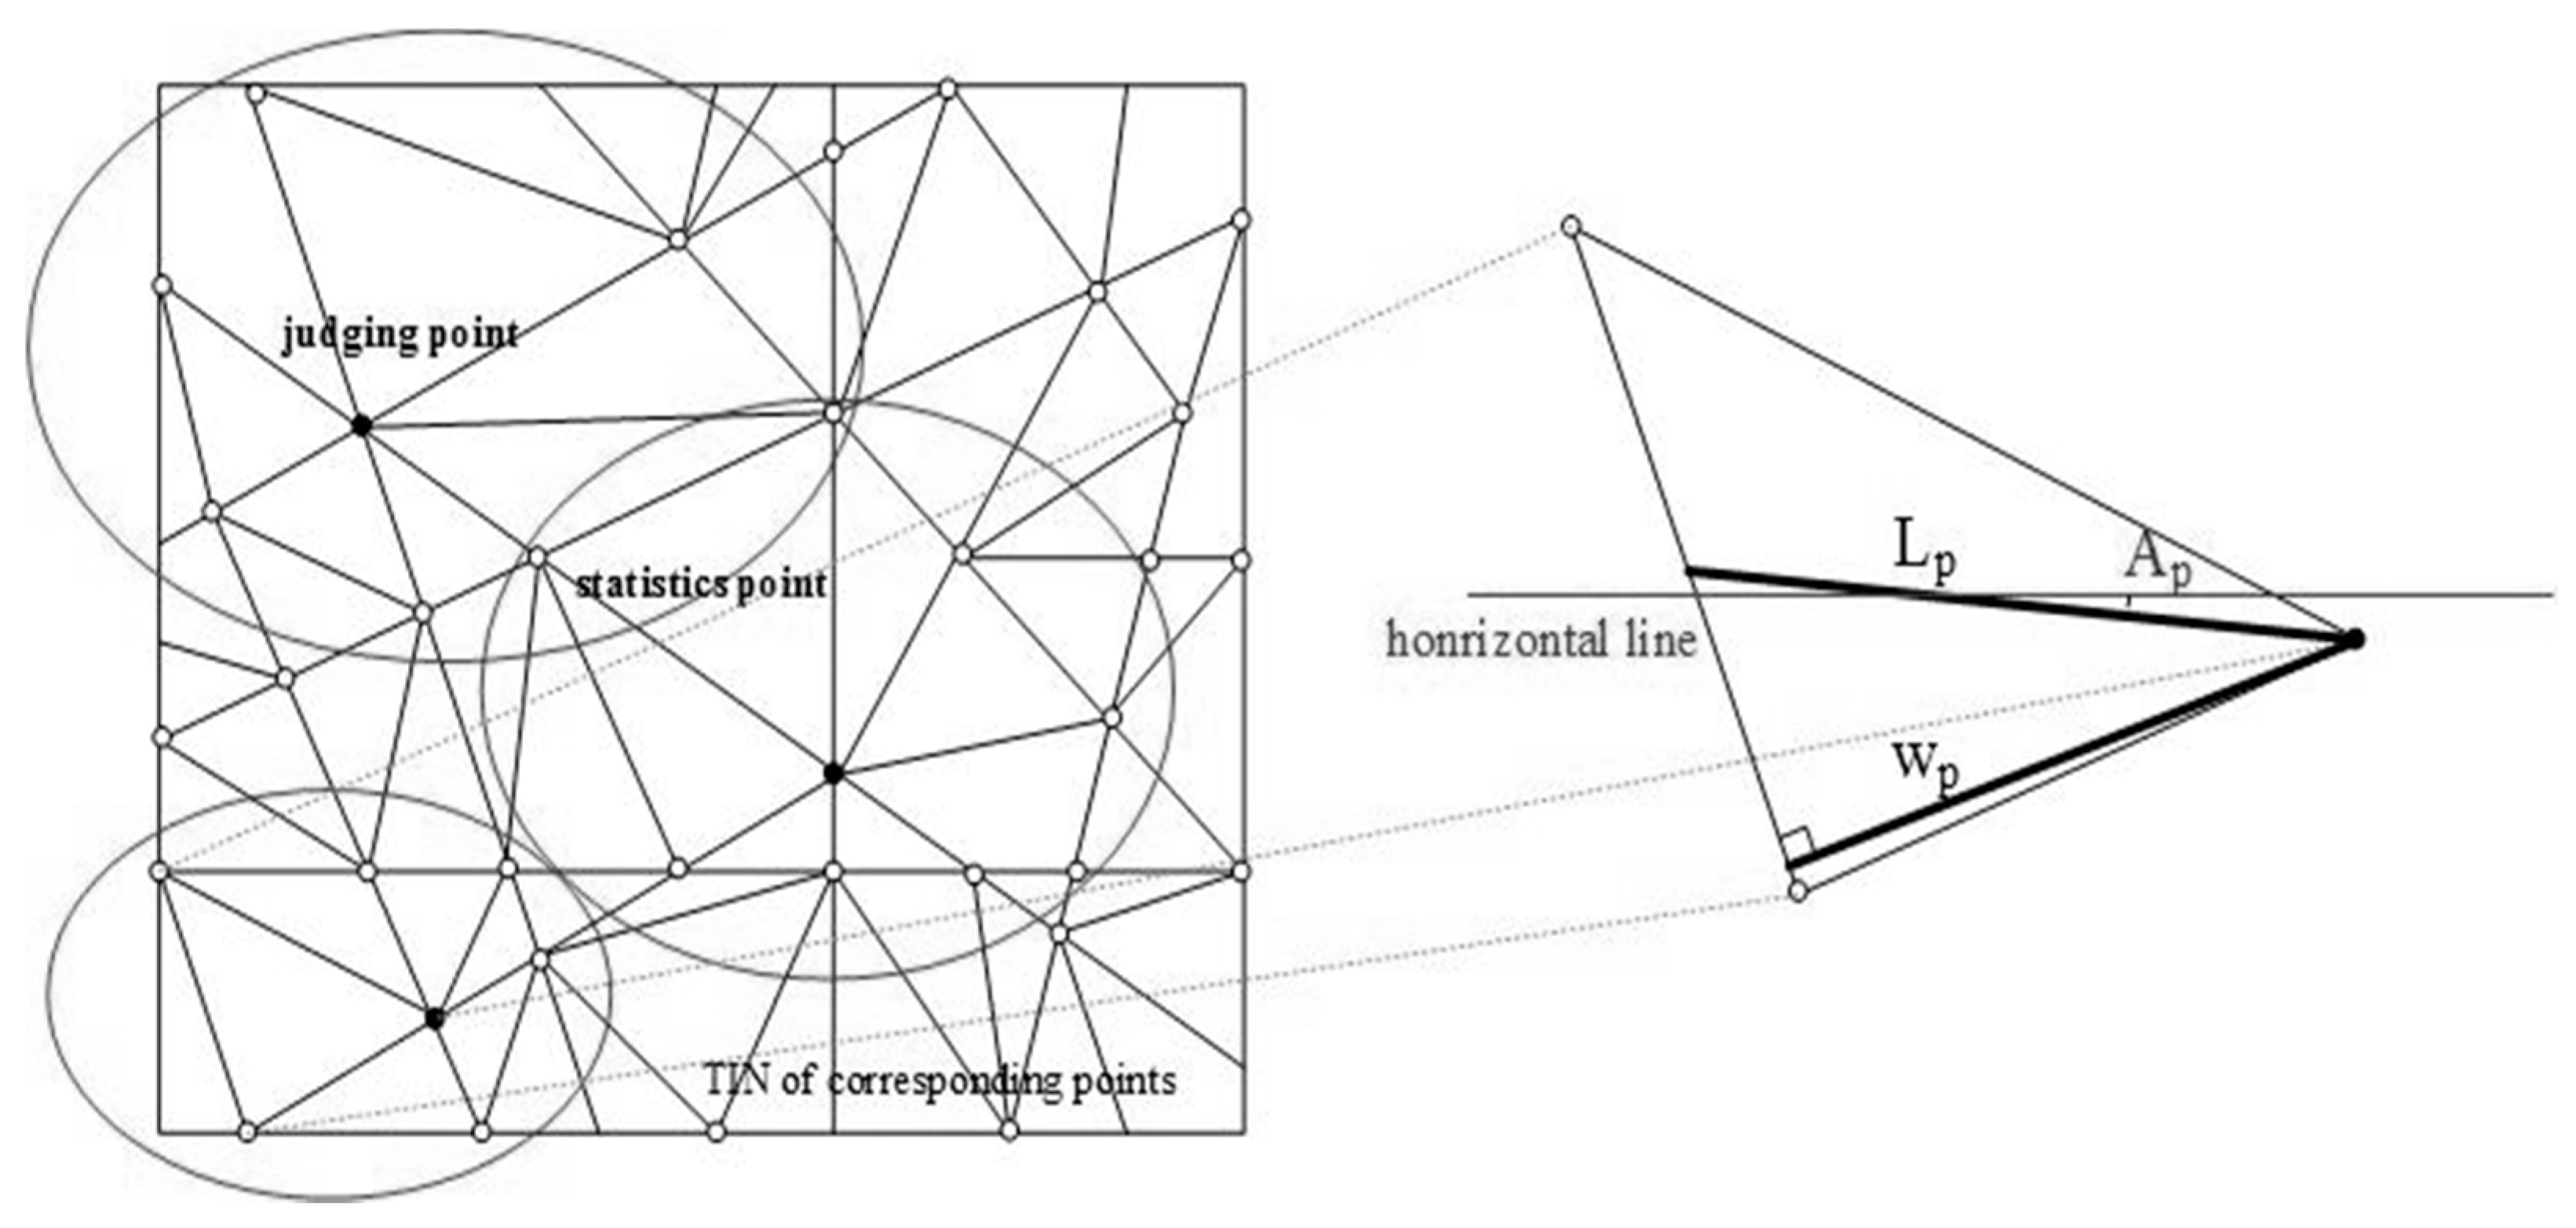
Figure 4 shows that the relationship between the corresponding points, which are organized by Triangulated Irregular Network (TIN), must be analogous when the judging area is limited to a small local part. The median lines of the triangles in TIN are used to build the LSV, , where is the length of the triangle median lines, is the angle of the triangle medians with the horizontal, and is the parameter of the distance weights. The LSV of each triangle, where the point to be determined in the local facet center is located, can be calculated according to the corresponding point pairs in the triangle network. Reliability coefficients are obtained by the statistical results of the points to be determined in the triangle networks of the left and right images. The positions of the points with gross errors are eliminated on the basis of a given reliability coefficient threshold.

Figure 4.
Model of local image and local statistic vectors (LSV).
In this situation, a similarity comparison is conducted for the corresponding points one at a time. The vector differences of the correct matches can be fitted well between the two images, in contrast to those of the error matches. Weighting and voting strategies were designed for connecting the surrounding points with the judging point, as shown in Equation (6). The process of determining the judging point as a gross error to be eliminated is shown in Equation (7).
where is the vector of the left images, is the vector of the right images, is the absolute value of the length difference of the vertical segment through the judging point, and is the judging value.
where is the threshold for determining if the point is a gross error. This threshold is usually set as three times the root-mean-square error (RMSE) of .
Based on the preceding analysis, error matches could be eliminated effectively by the statistics with LSV. The proposed error elimination method is as follows: (1) A TIN, based on the divide-and-conquer approach, was constructed using the coordinates of the matching points, and the points in the TIN were judged individually in the following steps. (2) Several nearest neighboring points around the current judging point were collected based on the TIN structure. All these points, which were collected as candidate points, were selected according to the distance from the judging point. Extremely long distances of more than 300 pixels were disregarded. (3) The LSV of the left and right images were calculated in a small local area, which was based on the selected matching points in Step 2. Through Equation (5), the statistics were initiated. The judging of the current point was estimated using Equation (6) until every point pair had been judged. (4) After traversing all the points in TIN, Step 1 was repeated to reconstruct a new TIN by using the remaining points. The process continued until the residual errors of all the points met the requirements.
3. Experiments and Results
3.1. Description of Test Data
To evaluate the performance of the proposed approach, three datasets from ZY-1-02C and DOM of ETM+ were used in the experiments. The first experiment evaluated the applicability of the matching method. A PAN image of ZY-1-02C was down-sampled and matched with the original image. The matching results were then evaluated. Dataset 1, for an urban area, was used. The second experiment evaluated the accuracy of AMSIM between the ZY-1-02C image and the DOM of ETM+. Datasets 2 and 3, which mainly featured mountainous terrain in Northeast China, were used. The DOM of ETM+ was corrected via scan line correction using UTM-WGS84, which was obtained from the website of the USGS, Chinese Academy of Sciences. In the experiment, the ZY-1-02C image was a PAN image, and the ETM+ image was a Band 8 (PAN) image. The datasets are described in Table 1.

Table 1.
Overview of test datasets.
3.2. Applicability Analysis of Methodology
According to the proposed strategy, image resampling was a key step in the AMSIM case study. A match between the original and sub-sampled images was crucial for evaluating the accuracy and reliability of the method. Dataset 1 was used for this work. Considering the resolution of the ETM+ images, the ZY-1-02C image was down-sampled to resolutions of 15 and 30 m. For image matching, the down-sampled images were resampled to the same ground sampling distance (GSD) of the ZY-1-02C original image. Figure 5 shows the matching results of these two pairs of images. Table 2 summarizes the matching parameters of the experiment.
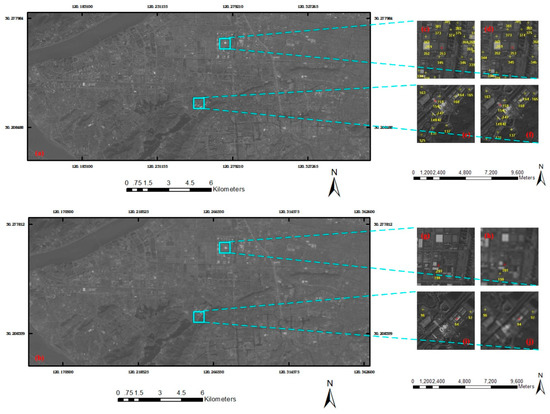
Figure 5.
Results of image matching between the down-sampled and original images of ZY-1-02C.
Table 2.
Chart of matching parameters.
Figure 5a,b,d,f,h,j presents the resampled images of ZY-1-02C. The GSDs of Figure 5a,d,f are 15 m, the GSDs of Figure 5b,h,j are 30 m. Figure 5c,e,g,i shows the original images of ZY-1-02C, where the GSDs are 5 m. The textures of Figure 5a,b,d,f,h,j are much fuzzier than that of the original images. Thus, the feature points in Figure 5c,e,g,i, for the most part, do not match the corresponding points in Figure 5d,f,h,j. Given that the matching image was actually the same image, the image translation was set as 15 × 15 pixels. The approximate parameters of image transformation were detected using the initial value prediction model, as shown in Table 2. The grid size used in our approach to extract the Harris feature points was 50 × 50 pixels, the template window size was 13 × 13 pixels, the search window size was 21 × 21 pixels, and the threshold of the correlation coefficient was 0.9. The total matches were few when matching the original image with the 30 m down-sampled image. Hence, fuzzier original images were more difficult to match.
A method was used for directly calculating the accuracy of the matching experiment. In the image coordinate space, and were defined to describe the matching and resampling error. The RMSE and mean values of and were used to evaluate the matching accuracy, as shown in Table 3.
Table 3.
Statistics of the matching errors, expressed in pixels.
As the down-sampled images originated from the original images, and were the real errors in the matching. Table 3 shows the matching errors of the two groups of matching results. With an increase in the resolution difference, the errors gradually increased, and the correct matches decreased. The experimental results indicate that the ETM+ images with a 15 m resolution are efficient candidates to match the ZY-1-02C 5 m resolution images and obtain good matching results. Thus, the ETM+ images can be used as georeference images to improve the global positioning accuracy of ZY-1-02C images.
3.3. Accuracy Analysis of Matching between ZY-1-02C Images and ETM+ Images
The second experiment used Datasets 2 and 3 to conduct a case study on AMSIM. Matching Level 1 images and the DOM was difficult, because of large topographic variations. The method for solving the problems of the initial value prediction model and gross error elimination in matching was applied. The case study on ZY-1-02C and DOM of ETM+ was a method to improve the direct georeferencing accuracy of the ZY-1-02C images. After processing, the RPCs of these ZY-1-02C images were redefined via matching points.
3.3.1. Results of Initial Matching Value Prediction
According to Section 2.1 and Section 2.2, Table 4 shows the initial matching value parameters of Dataset 3. Fourteen tie points were used to connect 13 lines for calculating the rotation angle (A) and scale variance (k). Given the large image size, blocking technology was used in OPC; the overlapped regions were divided into 16 blocks of small images of the same size, to enhance the precision of detecting translation parameters and the operating efficiency. Table 4 shows the results of the image blocks.
Table 4.
Parameters of transformation between images.
3.3.2. Results of Image Matching
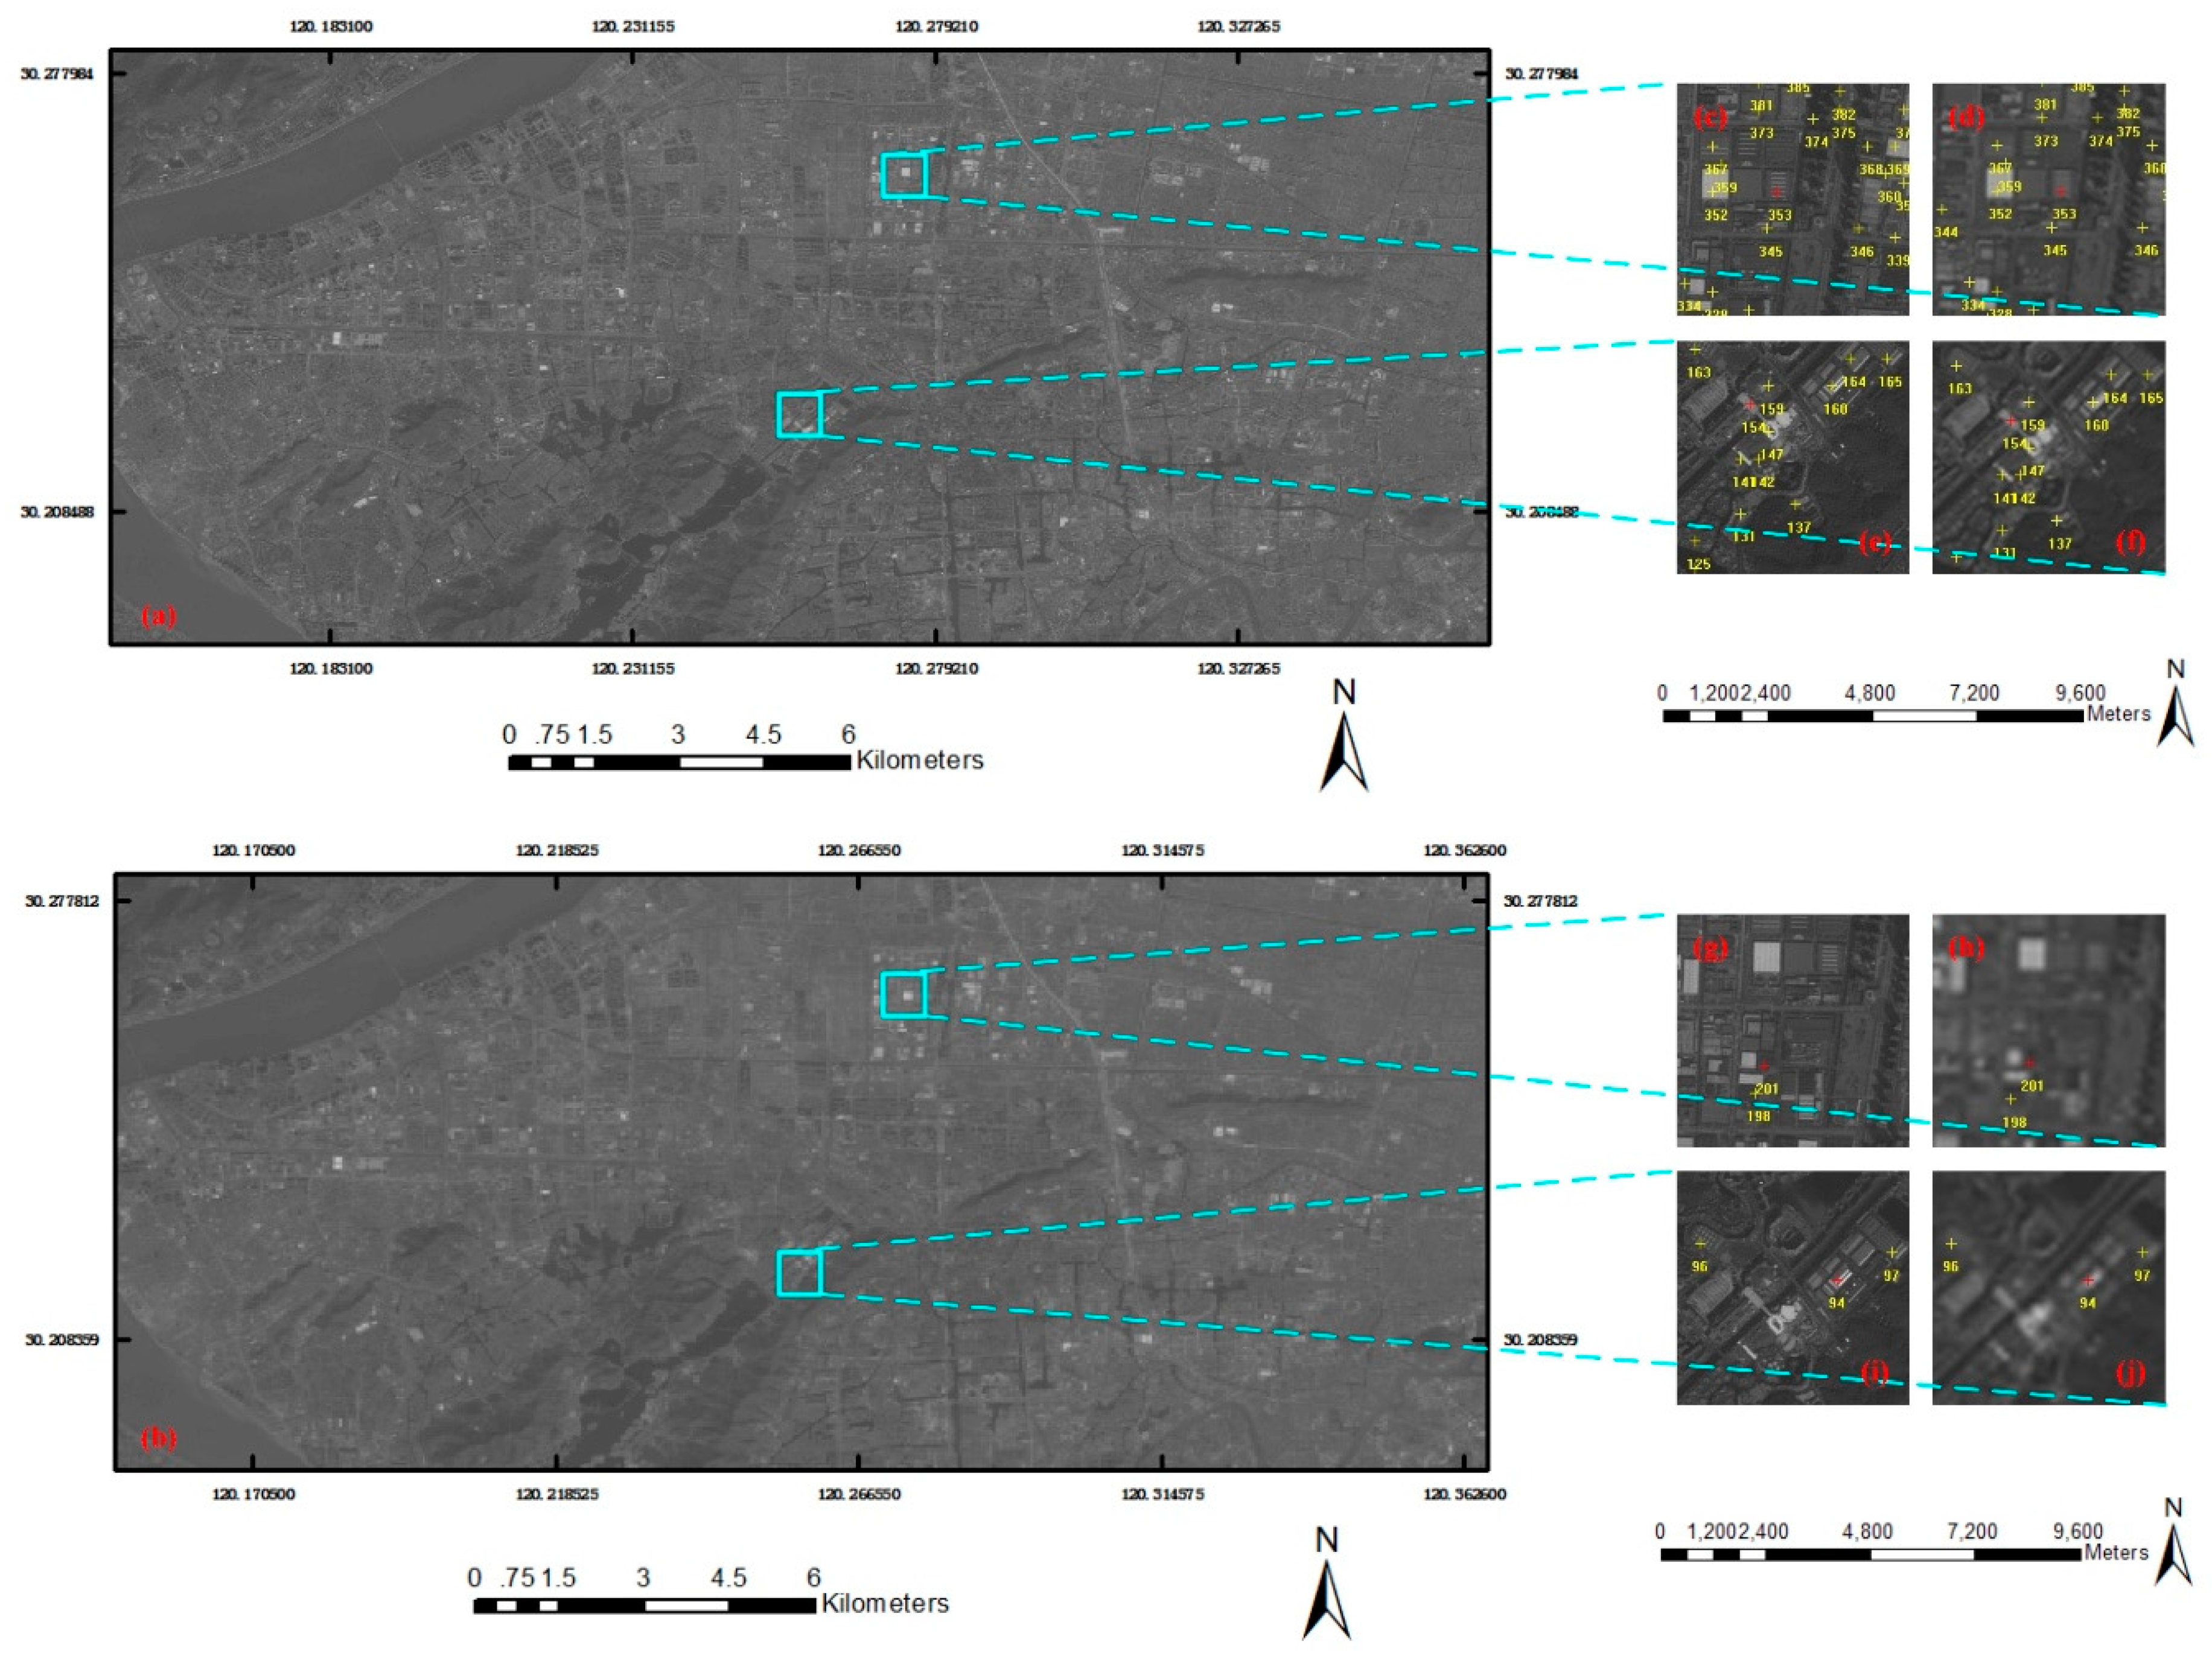
After resampling, the size of the overlap area in the images of Datasets 2 and 3 was approximately 10,741 by 6202 pixels. Each image block (1–16) detected a pair of translation parameters. The data was then matched through NCC. The grid size used in our approach to extract the Harris feature points was 100 × 100 pixels, the template window size was 13 × 13 pixels, the search window size was 55 × 55 pixels, and the threshold of the correlation coefficient was 0.9. Figure 6 shows some of the matched conjugate points.

Figure 6.
Results of image matching between ZY-1-02C and ETM+. (a,c,e,g,i) show the Digital Orthophoto Maps (DOM) of enhanced thematic mapper (ETM+), while (b,d,f,h) show the Level 1 image of ZY-1-02C.
3.3.3. Error Elimination
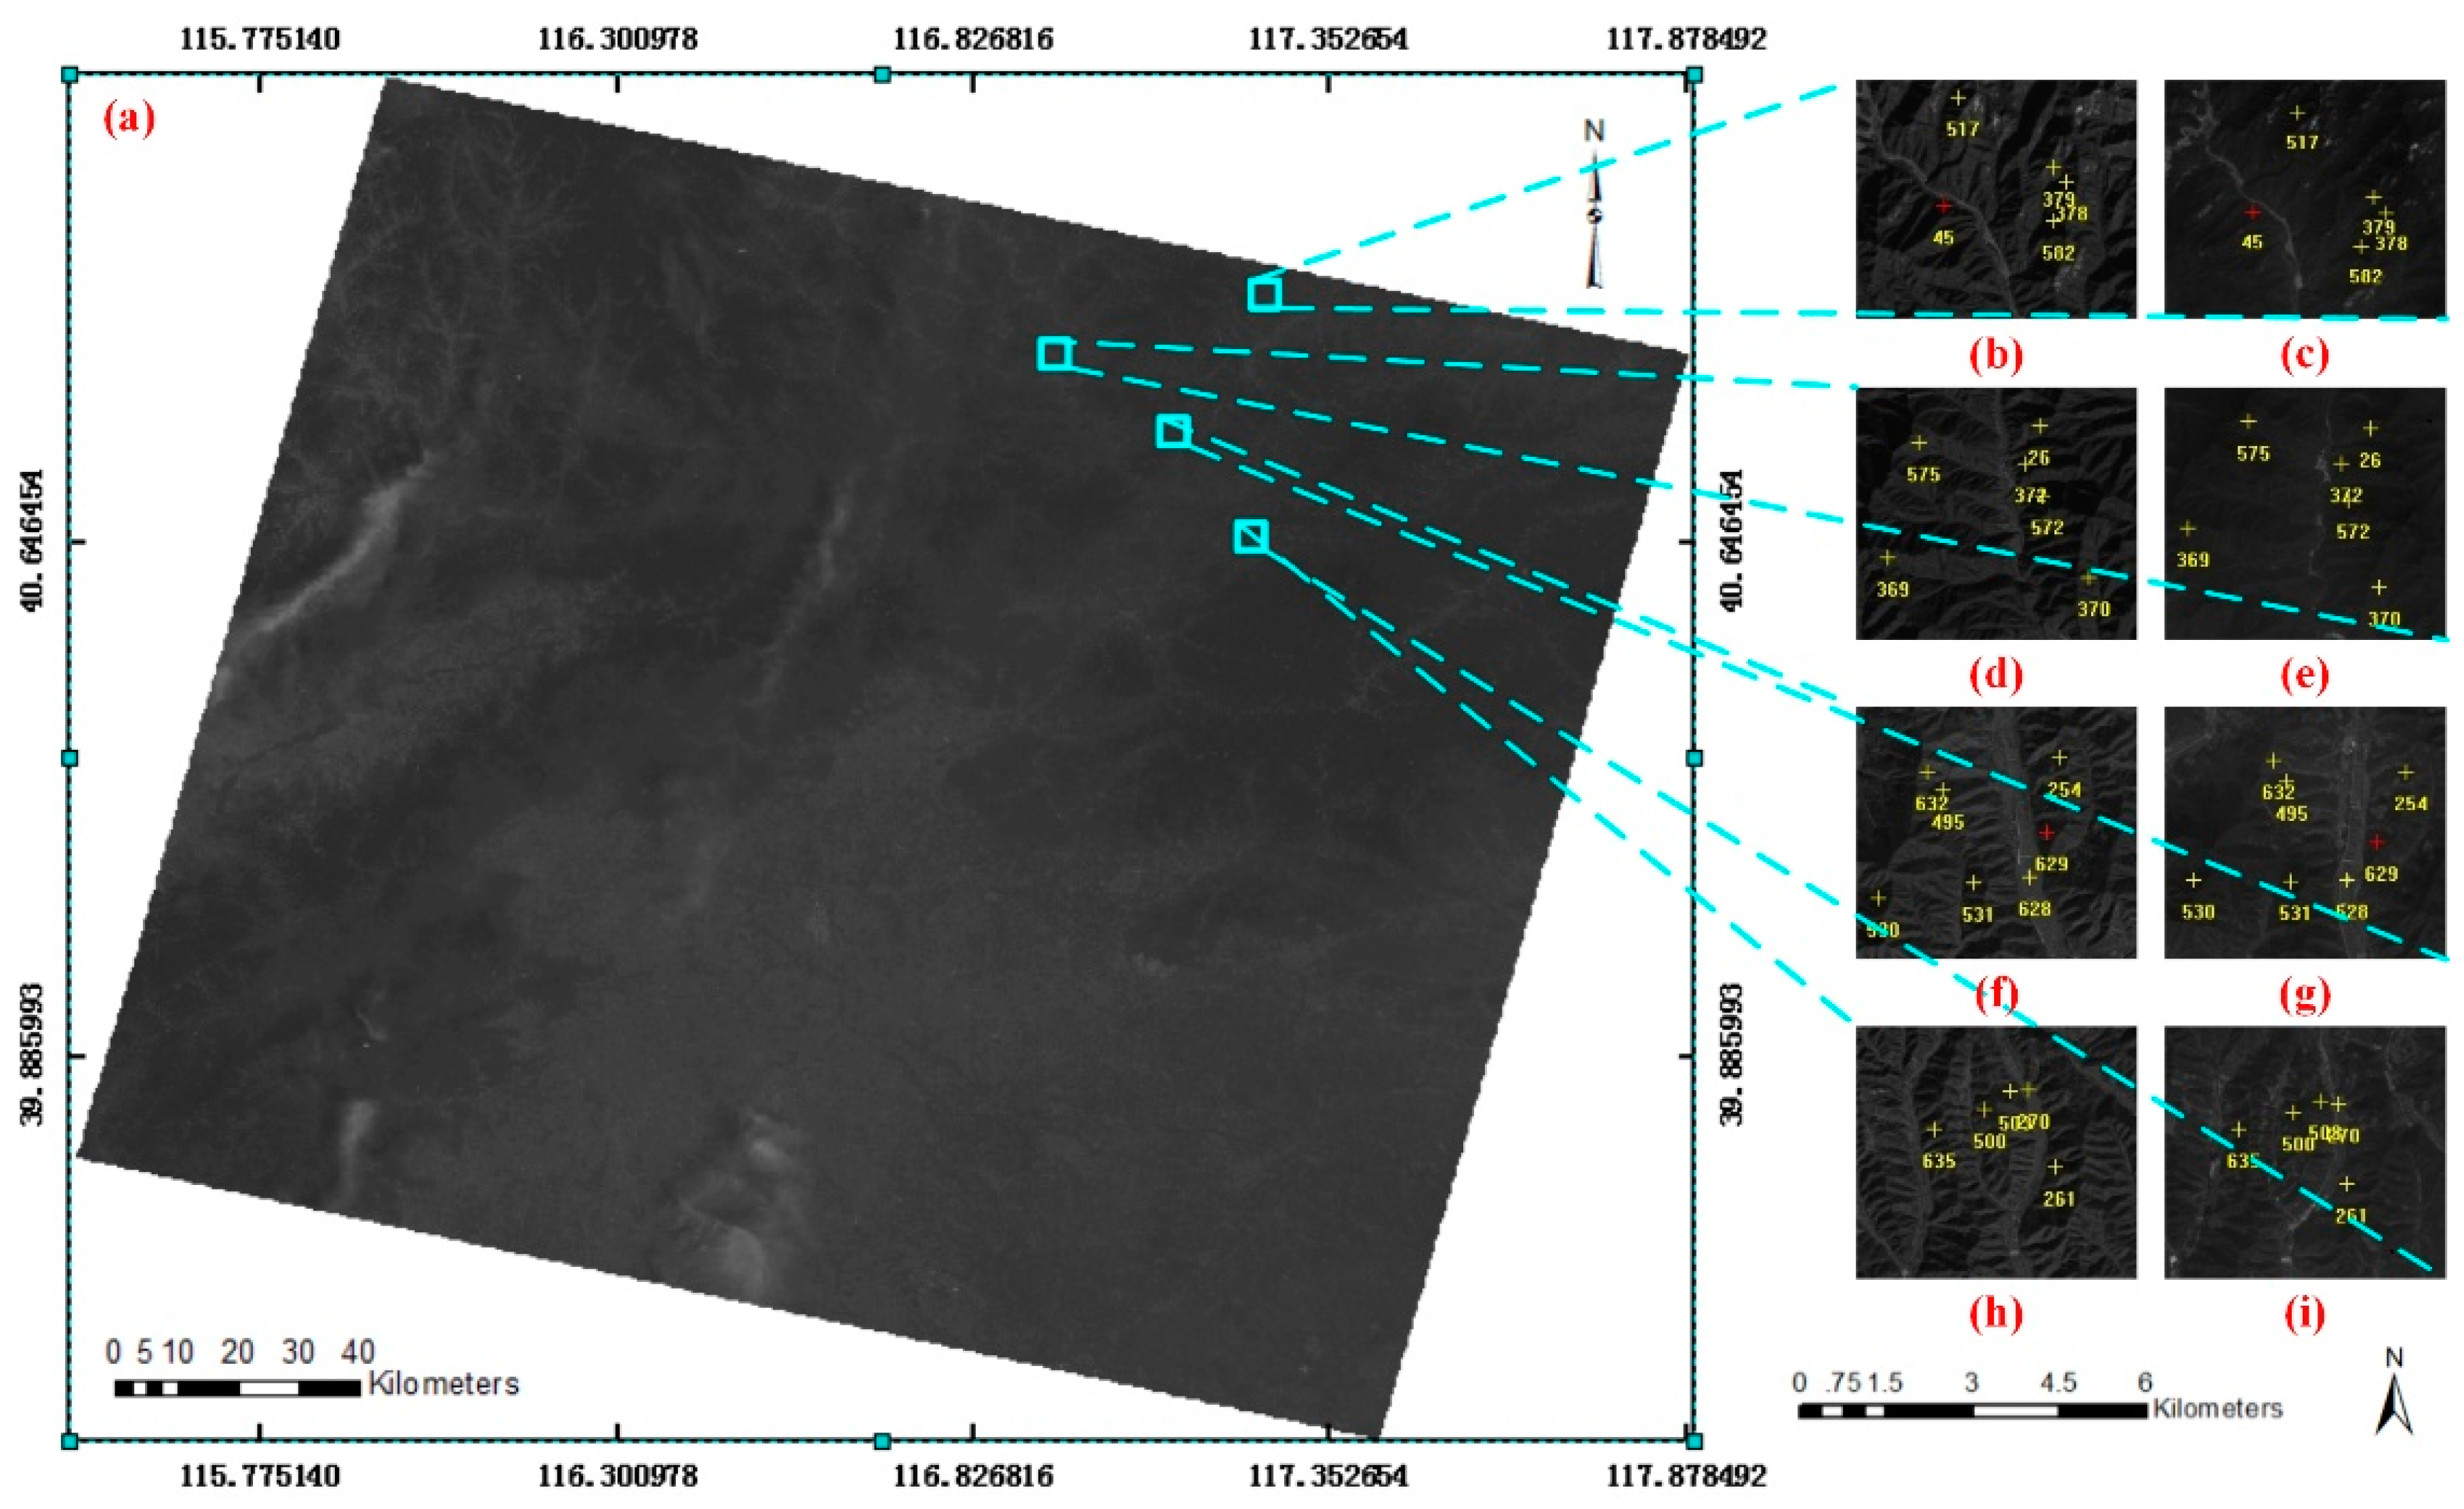
A total of 5458 Harris feature points were extracted, and 2324 pairs of points were successfully matched in the image matching. For error elimination, all the matched points were manually checked. Thirty-two pairs of points were excluded as false matches; however, the algorithm of error elimination through LSV determined that 54 pairs of points were error matches, of which 32 pairs were real errors and 22 pairs were not. Although the algorithm has some incorrect judging problems, as some correct matches were judged as errors, it was generally effective in automatic error elimination. Figure 7 shows three sample error matches of the experiment, and Table 5 summarizes the statistics of these error matches.
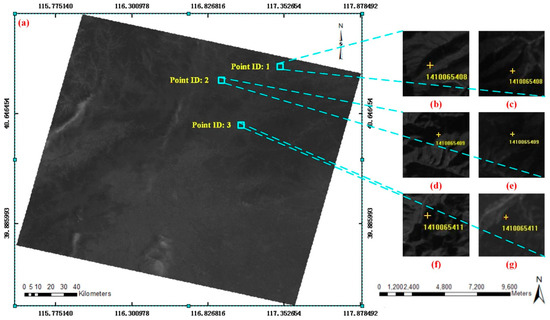
Figure 7.
Results of error matching. (a,c,e,g) show DOMs of ETM+, while (b,d,f) show ZY-1-02C images.
Table 5.
Statistics of the error matches.
3.3.4. Accuracy Analysis of Image Matching
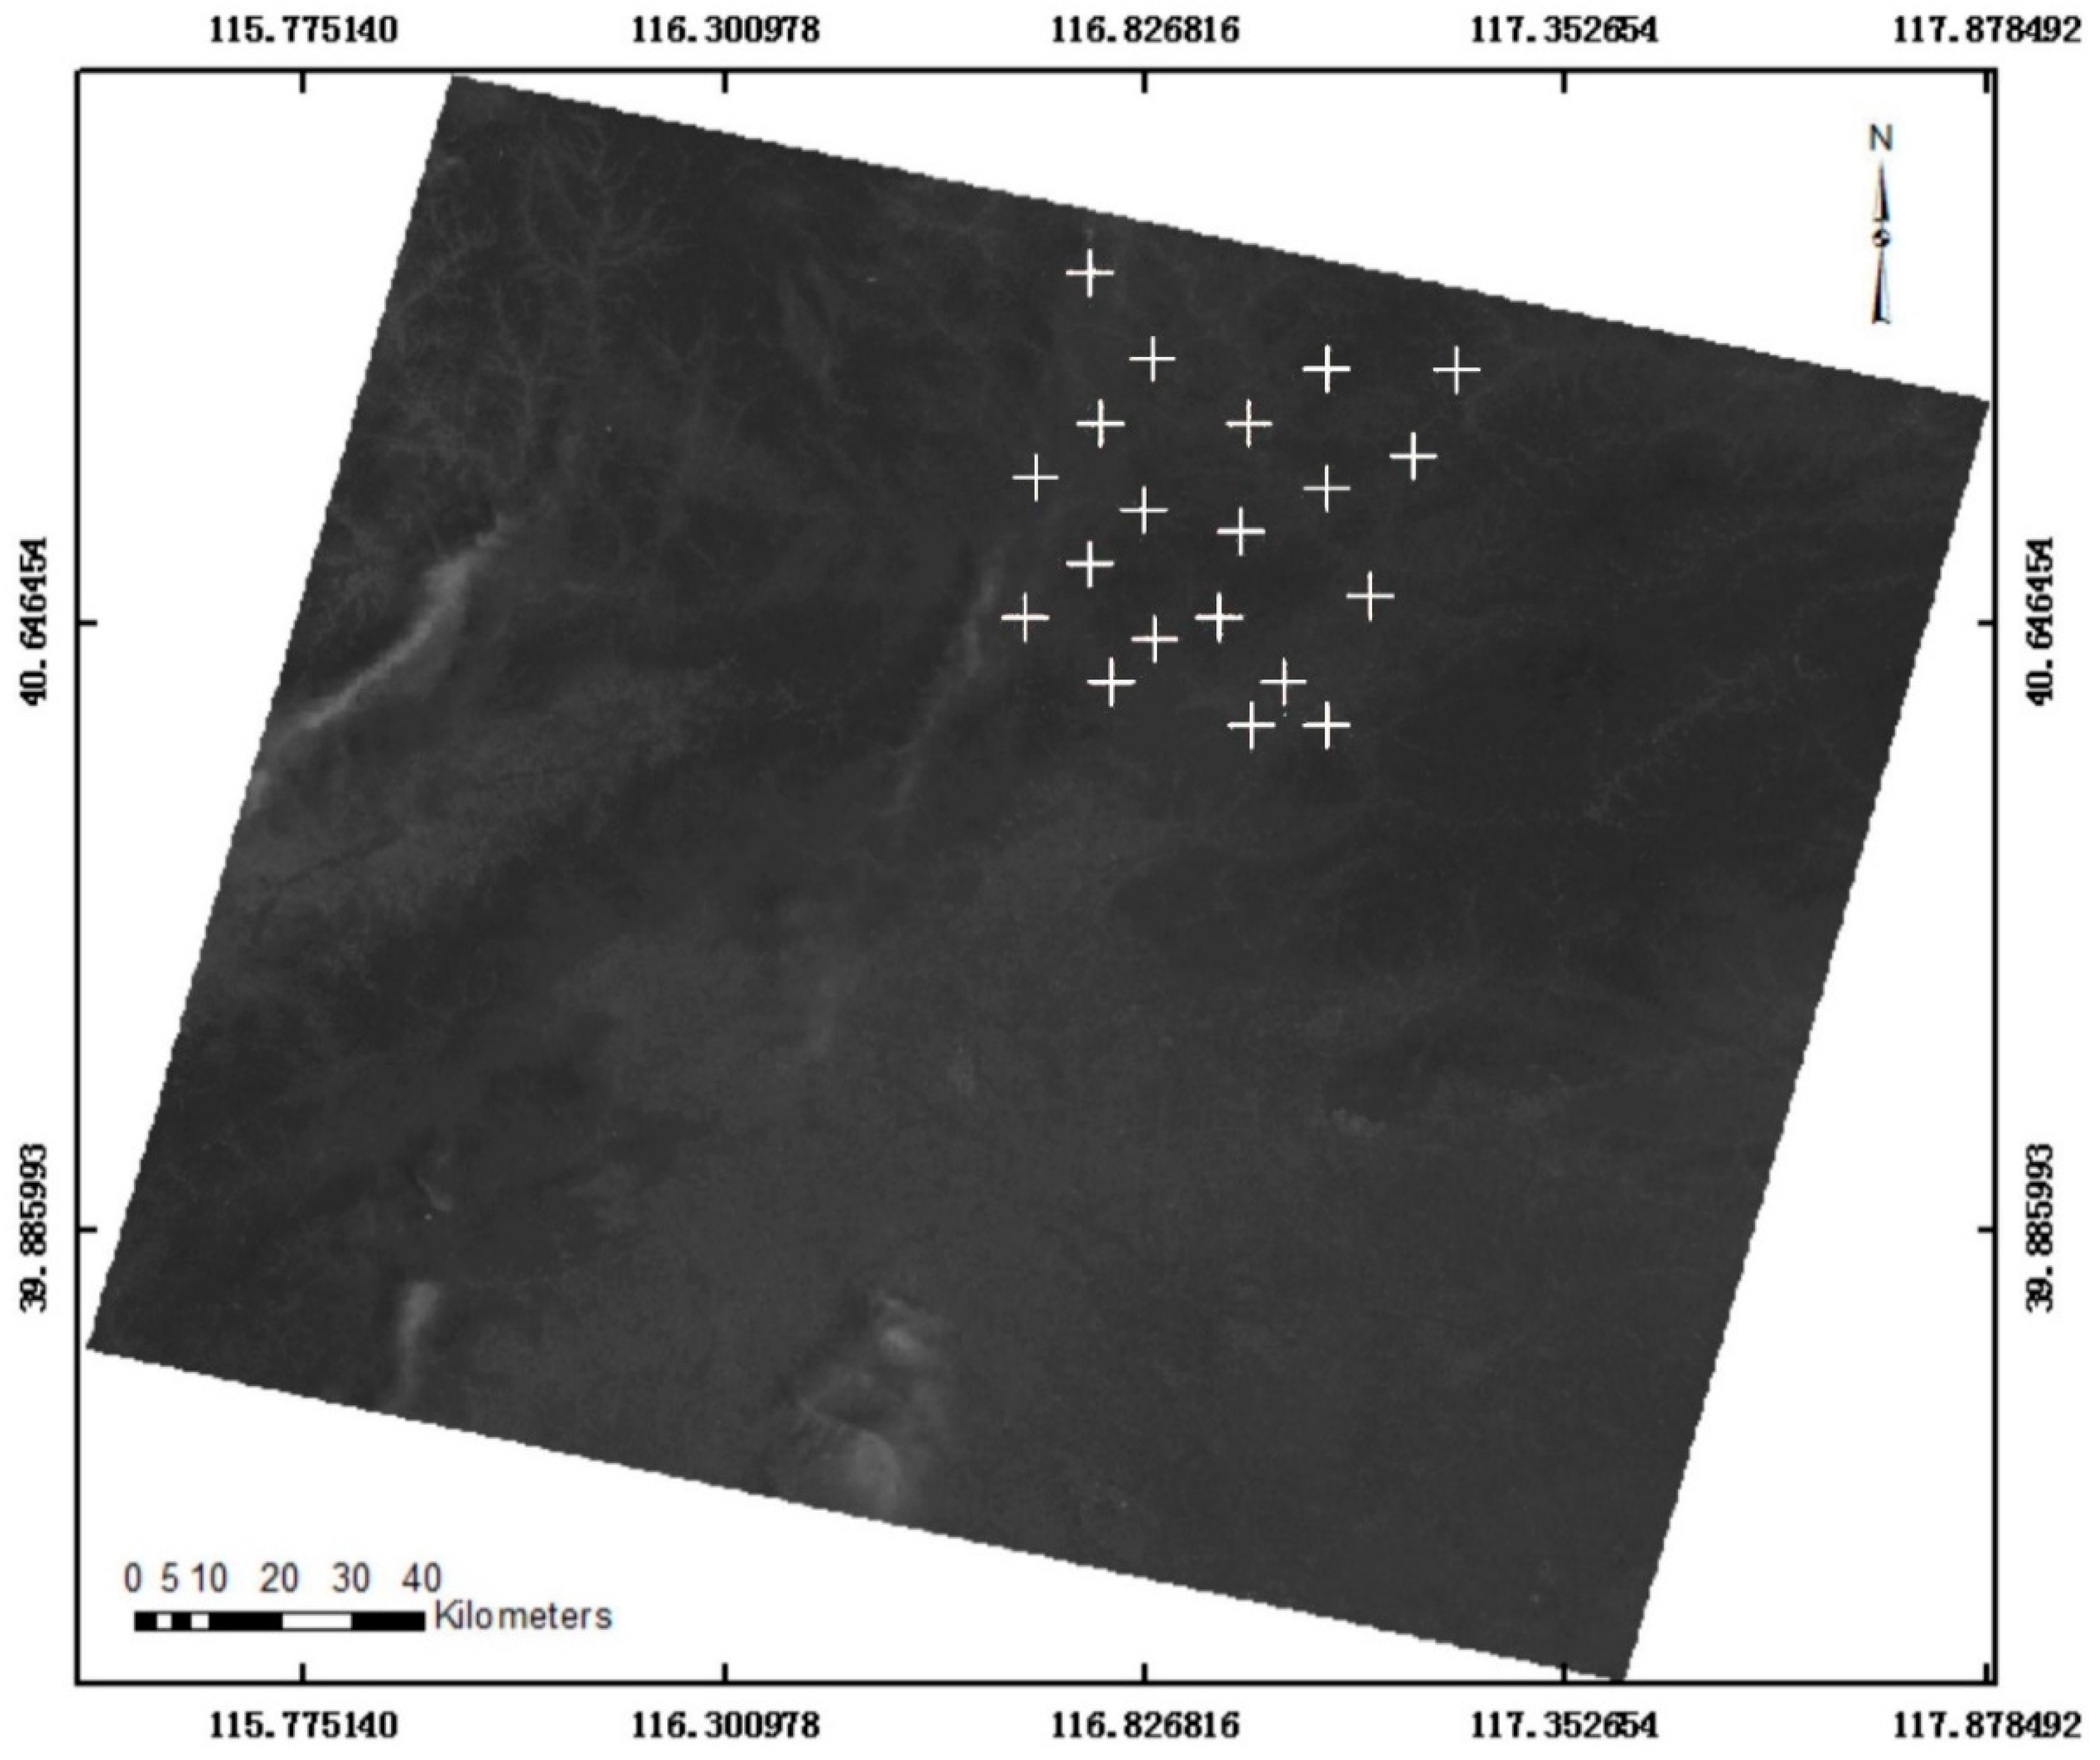
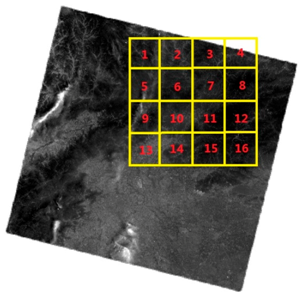
The RPC of the ZY-1-02C images was modified using the matched points with the DOM of ETM+. To clarify the necessity for image matching, 20 checkpoints that were evenly distributed on the reference image were manually measured. The coordinate differences of the checkpoints between the input and modified images, which were calculated by RPCs, were analyzed. Figure 8 shows the checkpoints in the images.

Figure 8.
Checkpoint distribution on the DOM of ETM+.
The coordinates of both image points were then used to calculate the differences, i.e., and , as follows:
where is the coordinate of the checkpoint in the modified image, and is the coordinate of the checkpoint in the original image.
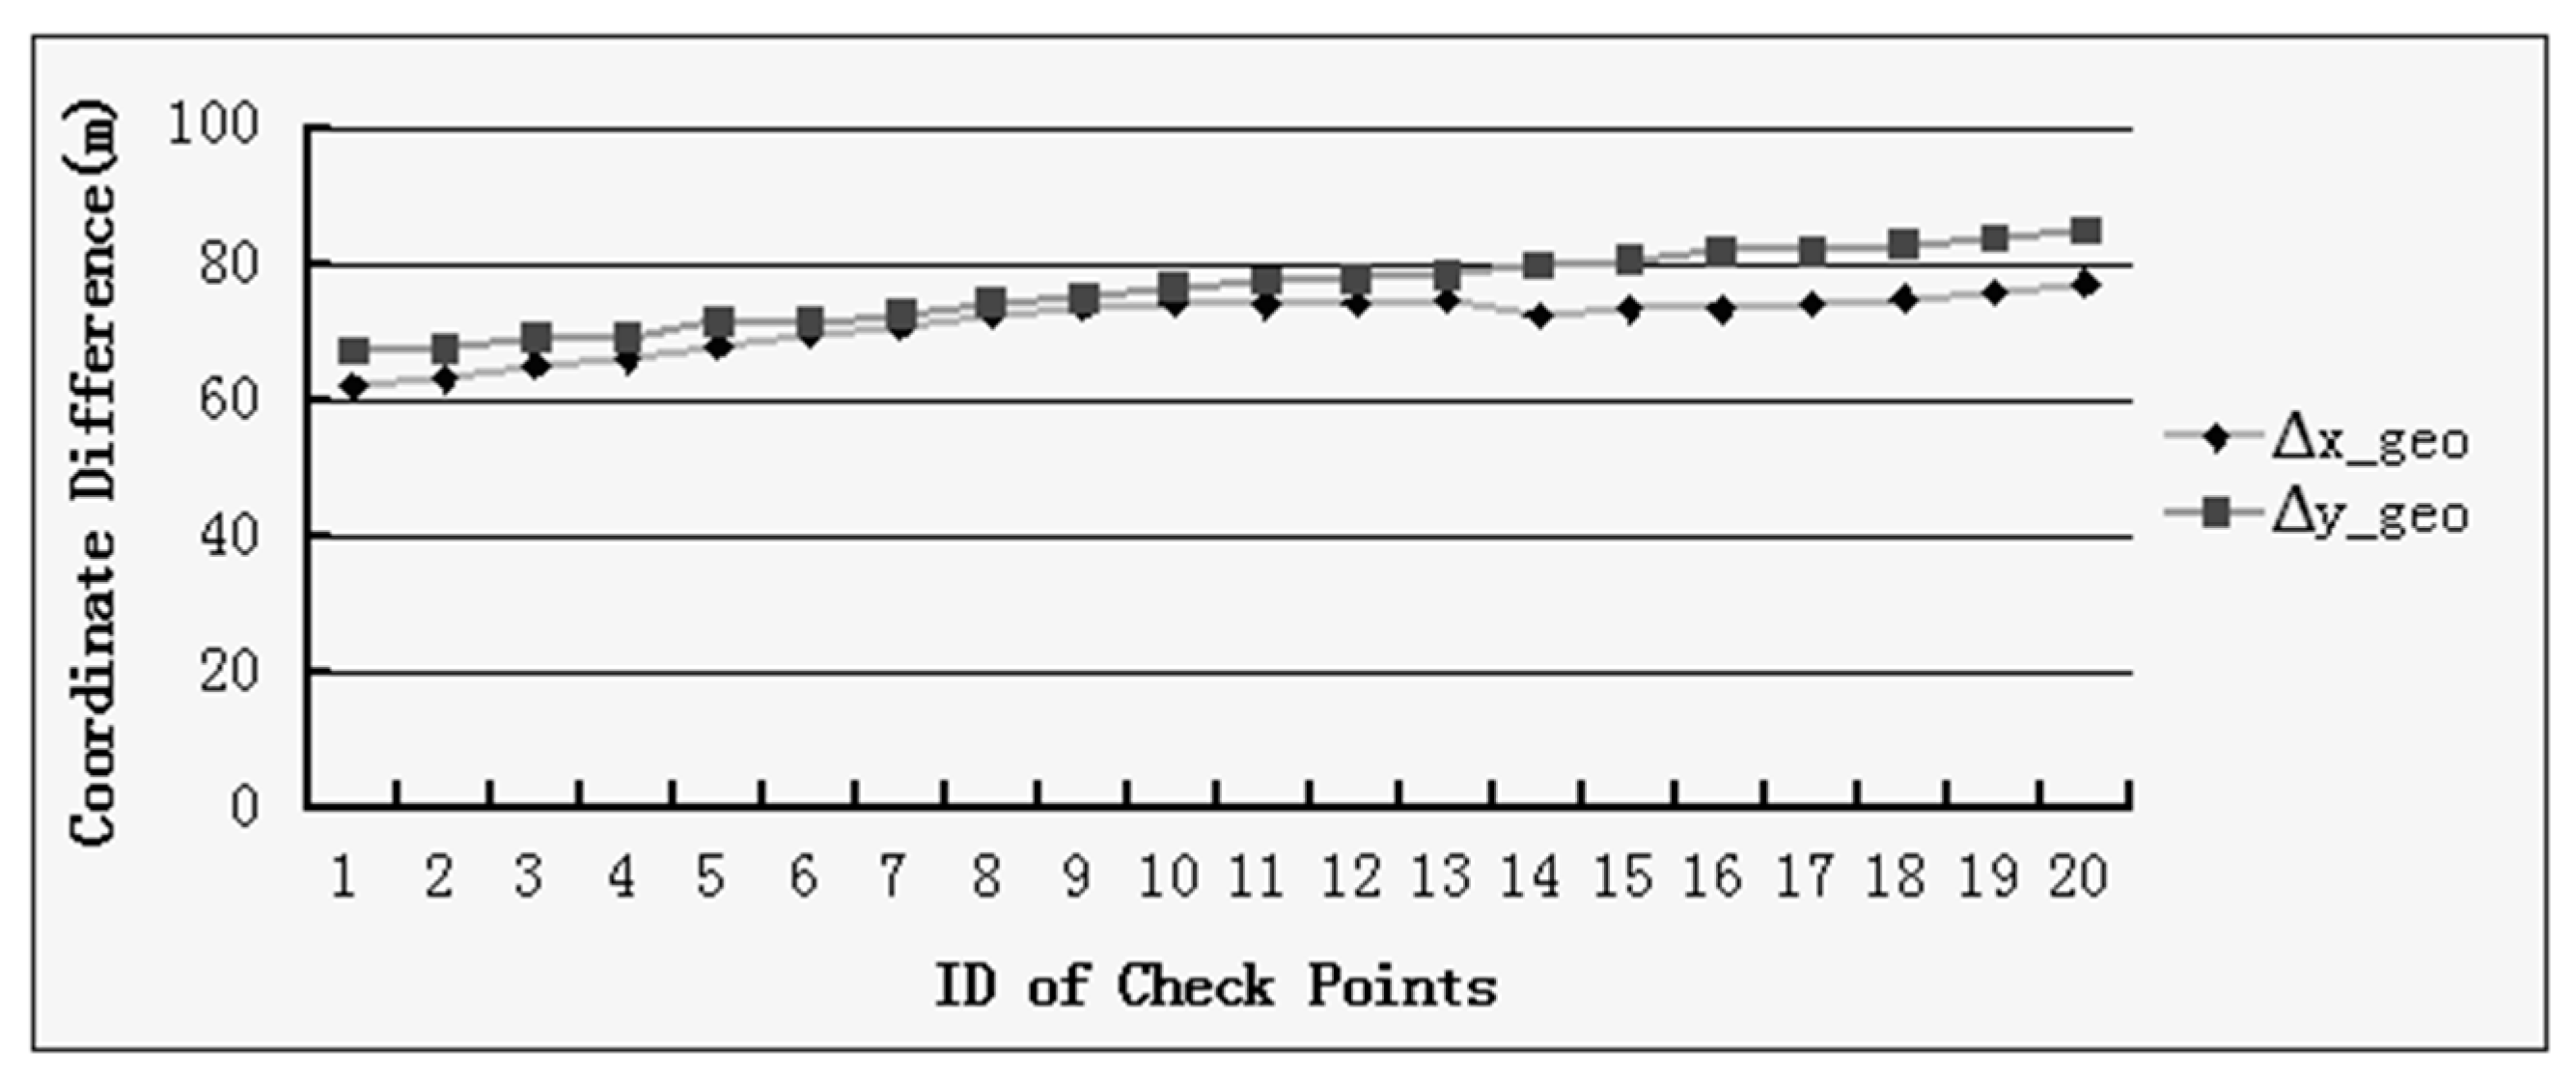
Figure 9 shows the comparative results of the checkpoints. The revised image exceeds the original image in positioning precision by 100 m, in general, but differs from specific points. The refinement of point position after matching is significant compared to the original image.

Figure 9.
Comparative results of the checkpoints between the original and modified ZY-1-02C image.
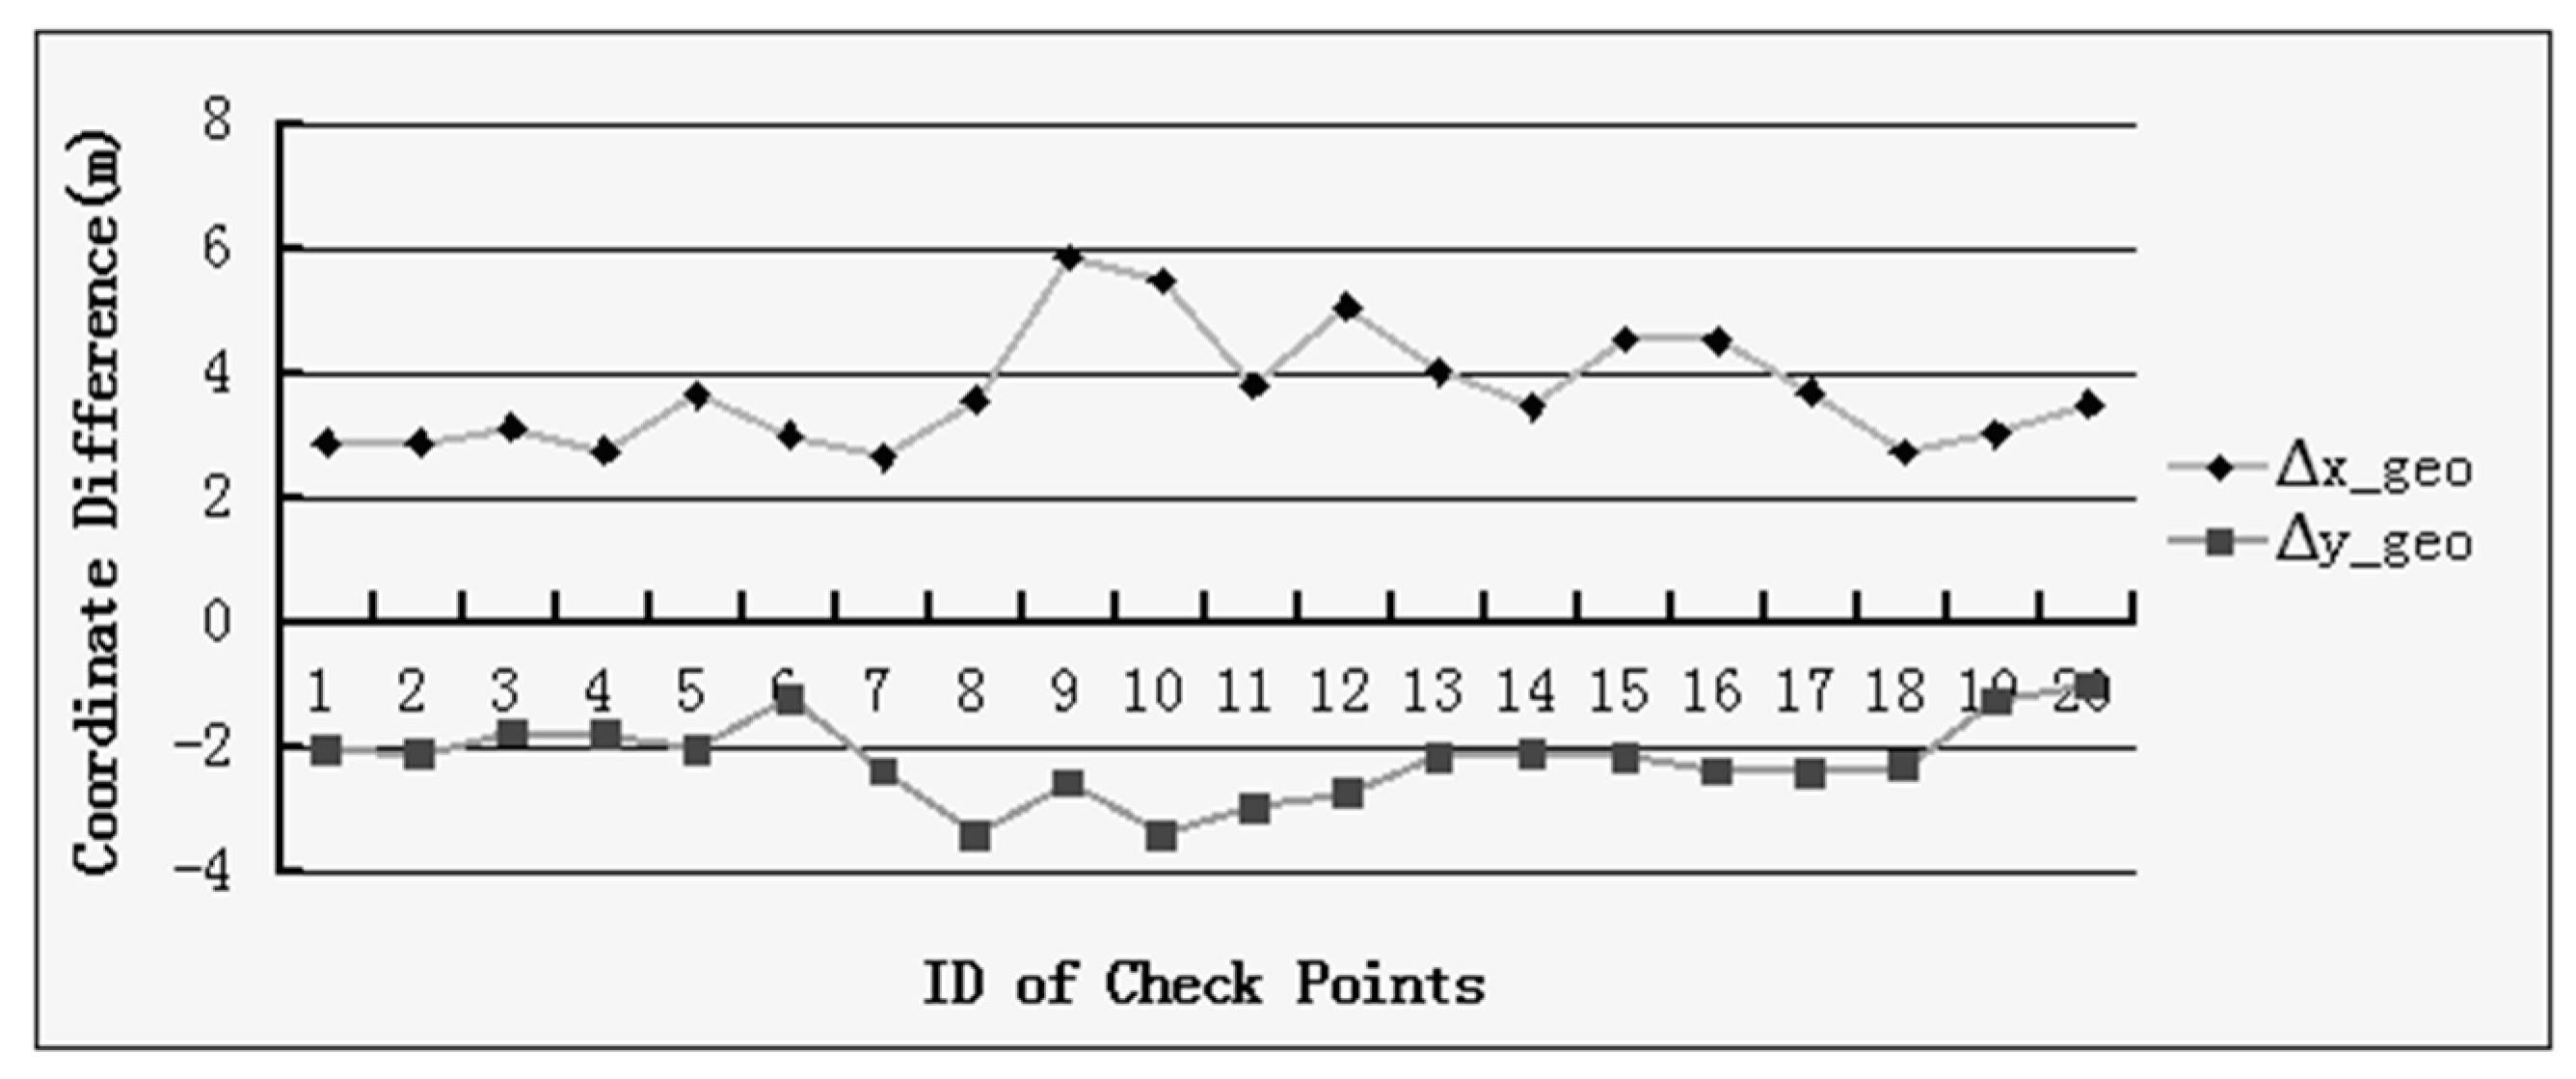
Directly clarifying the geo-referencing accuracy of ZY-1-02C Level 1 images and the DOM of ETM+ was difficult because of the topographic variations. Thus, after the processing, the RPCs of these ZY-1-02C images were modified by using matching models. To clarify the geo-referencing accuracy of the modified RPC, ZY-1-02C imagery must generate the DOMs by SRTM 90. Then, checkpoints were used to confirm the geo-referencing accuracy between ZY-1-02C and ETM+. Figure 10 shows the comparative results of the checkpoints on the DOMs of both ZY-1-02C and ETM+. The maximum value was less than three pixels, which indicates that the matching accuracy is typically eight meters in object space. Given the differences in terrain elevation, variances were bound to exist between different checkpoints.

Figure 10.
Comparative results of the checkpoints between modified ZY-1-02C images and the DOM of ETM+.
4. Comparison with Other Methods
Experiments were conducted using a personal computer with the following basic parameters: the CPU was Intel® Core™ i3, M380 @ 2.53 GHz. RAM: 4 GB. The operating system was Windows 7, 32-bit, and the software compiler was Visual C++ 6.0.
A comparison of SIFT, A-SIFT, and SURF algorithms is shown in Table 6. Dataset 2, with a size of 12,000 × 12,000 pixels, and Dataset 3 with a size of 15,321 × 14,921 pixels, were used for image matching. When an affine relationship in images exists in SIFT and SURF, in situations where rotation, scale, and translation exist simultaneously in images to be matched, the stability and accuracy of these methods decrease. A-SIFT performs better under this condition; however, it has the longest processing time. Our method showed the best performance in the experiment. The mismatched points were partly caused by the variation in ground objects and by wrong matching. The algorithm for matching gross error elimination proposed in this paper detected and eliminated mismatched point pairs effectively.
Table 6.
Comparison of computational cost and matching results.
5. Discussion
An AMSIM method with high precision and efficiency was proposed and applied to a case study on ZY-1-02C and ETM+ images. The advantageous characteristics of the proposed method include relatively independent initial matching value prediction models and an effective method to eliminate gross errors.
5.1. Image Matching and Error Elimination
Related studies have presented two representative problems to realize an AMSIM case. One problem is solving the correlation among rotation, scale, and translation in image matching. For multi-source images, the transformation between images is too complex for reliable image matching to be implemented. Numerous approaches, such as SIFT, SURF, and A-SIFT, have been used to perform multi-source image matching. However, they not only consume excessive memory and time but also are unreliable; these are the technological bottlenecks for fully automatic image processing.
A rough estimation of the transformation between images was achieved via geographic information and OPC-based matching. The most important finding was that the geographic information of images could be used to search for tie points. Tie points were obtained in Datasets 2 and 3 to calculate A and k (Table 4). The transformation parameters between the images that were calculated in this way were not very accurate, which we attribute to large topographic variations, image resampling, and processing noise. Given that the viewpoints changed drastically between ZY-1-02C and the DOM of ETM+, the relief parameters were available for the initial matching value prediction. After OPC-based matching, the search region was narrowed. The experimental results proved that the method can solve the problem of transformation between images. Thus, numerous evenly distributed corresponding points could be rapidly obtained and efficiently based on NCC and LSM. The results shown in Figure 5 imply that sufficient conjugate points were obtained. In Section 3.3.4, the matching accuracy was proven to be improved with this image matching strategy. The first experiment also showed that high accuracy matching between ZY-1-02C and ETM+ could only be obtained when the resolutions of the two images were 5 and 15 m.
The other problem in image matching is error elimination. In most engineering practices, an image matching result contains gross errors. Conventional processing of gross errors is generally categorized into two types: automatic and complex iterative computation in block adjustment [41] and artificial error processing, which are obviously unsuitable for automation in photogrammetry. To solve the problem of automatic elimination of gross errors in image matching, a local statistical estimation, which differs from the approaches reported in most studies, was adopted in this study. Calculating the LSV of the judging points ensured that false matches were detected correctly from the matching results. In the second experiment, the false matches detected in Datasets 2 and 3 were evidently greater in number than the real errors because of the processing noise. Further, the false matches were eliminated in all the results. The high matching precision, which is shown in Figure 10, confirmed the accuracy and practicability of the proposed gross error elimination method.
Unlike related AMSIM approaches [7,42], this approach has two different designs for the matching method. Image resampling based on RPCs was first applied to data with uncertain resolution. Second, the matching strategy based on OPC aimed to solve the RPC that contained a positioning error. The main purpose of this study was to obtain a high level of global positioning accuracy for the ZY-1-02C images with the DOM of ETM+ images as georeferences. However, the proposed method also has limitations. Between the input and reference images, the DOM could not handle significant landscape changes or large resolution differences above a ratio of 1:6. Indeed, when satellite images exhibit small differences in positioning accuracy, NCC and LSM can be performed directly, and the corresponding points can be easily searched on the basis of the geographic information of the images.
5.2. Accuracies, Errors, and Uncertainties
In the first experiment, different resolution discrepancies, where the ratio of original image to down-sampled image was 1:3 and 1:6, were selected for the matching tests. Comparative analysis revealed that our method proves that images with a higher resolution difference are more difficult to match. In the second experiment, 20 checkpoint pairs were manually selected for image matching accuracy analysis. The original positioning precision, which was around 100 m, was enhanced to within eight meters by the image matching results. Our method is more precise and efficient than conventional SIFT, SURF, and A-SIFT.
The matching error in this study is mainly attributed to four factors. First, the error may be generated because of the different acquisition dates of the two images. Second, the error may be caused by bad results of error estimation. The estimation based on local statistics may be insufficient when the matching points contain numerous errors above 20%. Third, the error may be caused by image resampling. The bilinear interpolation adopted in our approach may also produce errors. Fourth, the differences in the levels of image rectification and the effects of projection error of the terrain may lead to mismatches.
In the proposed method, the matching accuracy is significantly determined by checkpoints. The maximum resolution discrepancy in our test datasets was approximately three times. The first experiment proved that such a discrepancy is uncertain if the proposed approach can ensure accuracy with high differences in resolution. We are also uncertain about the georeference accuracy of DOM of ETM+, which uses uncertain DEM for geometric correction.
6. Conclusions
The essence of image matching lies in the prediction model for the corresponding points and the elimination of matching gross errors. In contrast to related studies, we performed special processing to address both problems. The relatively independent calculation model parameters of rotation, scale, and translation can provide stable prediction results. Applying RPC to obtain the rotation and scale parameters led to satisfactory image positioning precision. The translation parameters generated by OPC exploit the stability of the overall correlation. While performing matching gross error elimination, the local facet vectors of points to be determined can be obtained statistically. Consequently, local properties and overall statistics were considered, thereby avoiding the problem of large-scale adjustment calculation failure due to the strong correlation of the observed values.
The proposed method can achieve precise matching even when the resolution of one image is three times higher than that of the other image, as shown in the first experiment. The accuracy and efficiency of this method was compared to those of SIFT, SURF, and A-SIFT; the proposed method fully met application requirements. Research data indicated that SIFT and SURF matching have more mismatched points and lower efficiency than our method. In contrast, the A-SIFT results are satisfactory; however, this method is time-consuming, which makes it unsuitable for automated processing. The matching results obtained by the proposed method enhanced the direct positioning precision from 100 m to under 8 m. Using the reference image for comparison, the position error of checkpoints in the x direction was between 2.7 and 6 m, whereas that in the y direction was between 1 and 3.5 m. The research results verified the effectiveness of our matching strategy. The proposed method has several limitations that require further investigation. First, the error elimination procedure through TIN could be simplified to enhance processing efficiency. Second, during image resampling, the model for calculating tie points has many drawbacks that might introduce excessive noise. Future studies will focus on solving these problems.
Acknowledgments
This work was supported in part by the National Natural Science Foundation of China under Project No. 41701531. It was also supported in part by the Natural Science Foundation of Jiangsu Province under Project No. BK20170782, and by the Open Research Fund of State Key Laboratory of Tianjin Key Laboratory of Intelligent Information Processing in Remote Sensing under grant No. 2016-ZW-KFJJ-01. We would also like to convey our heartfelt gratitude to the reviewers and members of the editorial team for their comments and contributions.
Author Contributions
Bo Wang, Jiefei Peng and Jianwei Bao conceived and designed the study. Bo Wang and Jiefei Peng performed the experiments and analyzed the corresponding results. Bo Wang, Jianwei Bao and Xiaojie Wu wrote the paper jointly.
Conflicts of Interest
The authors declare no conflict of interest.
References
- Rupert, M.; Thomas, K.; Mathias, S.; Peter, R. Automated Georeferencing of Optical Satellite Data with Integrated Sensor Model Improvement. Photogramm. Eng. Remote Sens. 2012, 78, 61–74. [Google Scholar]
- Zhang, Z.; Zhang, J.; Liao, M.; Zhang, L. Automatic Registration of Multi-Source Imagery Based on Global Image Matching. Photogramm. Eng. Remote Sens. 2000, 66, 625–629. [Google Scholar]
- Yu, L.; Zhang, D.; Eun-Jung, H. A Fast and Fully Automatic Registration Approach Based on Point Features for Multi-Source Remote-Sensing Images. Comput. Geosci. 2008, 34, 838–848. [Google Scholar] [CrossRef]
- Hirschmuller, H. Stereo Processing by Semiglobal Matching and Mutual Information. IEEE Trans. Pattern Anal. Mach. Intell. 2008, 30, 328–341. [Google Scholar]
- Behling, R.; Roessner, S.; Segl, K.; Kleinschmit, B.; Kaufmann, H. Robust automated image co-registration of optical multi-sensor time series data: Database generation for multi-temporal landslide detection. Remote Sens. 2014, 6, 2572–2600. [Google Scholar] [CrossRef]
- Yan, L.; Roy, D.P.; Zhang, H.; Li, J.; Huang, H. An automated approach for sub-pixel registration of Landsat-8 Operational Land Imager (OLI) and Sentinel-2 Multi Spectral Instrument (MSI) imagery. Remote Sens. 2016, 8, 520. [Google Scholar] [CrossRef]
- Chen, Q.; Wang, S.; Wang, B.; Sun, M. Automatic Registration Method for Fusion of ZY-1-02C Satellite Images. Remote Sens. 2013, 6, 157–179. [Google Scholar] [CrossRef]
- Wang, P.; Qu, Z.; Wang, P.; Ying, H.; Zhen, K. A Coarse-to-Fine Matching Algorithm for FLIR and Optical Satellite Image Matching. IEEE Geosci. Remote Sens. Lett. 2012, 9, 599–603. [Google Scholar] [CrossRef]
- Loeckx, D.; Slagmolen, P.; Maes, F.; Vandermeulen, D.; Suetens, P. Nonrigid Image Matching Using Conditional Mutual Information. IEEE Trans. Med. Imaging 2010, 29, 19–29. [Google Scholar] [CrossRef] [PubMed]
- Skakun, S.; Roger, J.C.; Vermote, E.F.; Masek, J.G.; Justice, C.O. Automatic sub-pixel co-registration of Landsat-8 Operational Land Imager and Sentinel-2A Multi-Spectral Instrument images using phase correlation and machine learning based mapping. Int. J. Digit. Earth 2017, 1–17. [Google Scholar] [CrossRef]
- Wong, A.; Clausi, D.A. ARRSI: Automatic Matching of Remote-Sensing Images. IEEE Trans. Geosci. Remote Sens. 2007, 45, 1483–1493. [Google Scholar] [CrossRef]
- Ma, J.; Chan, J.C.W.; Canters, F. Fully Automatic Subpixel Image Matching of Multiangle CHRIS/Proba Data. IEEE Trans. Geosci. Remote Sens. 2010, 48, 2829–2839. [Google Scholar]
- Bunting, P.; Labrosse, F.; Lucas, R. A Multi-Resolution Area-Based Technique for Automatic Multi-Modal Image Matching. Image Vis. Comput. 2010, 28, 1203–1219. [Google Scholar] [CrossRef]
- Harris, C.; Stephens, M. A Combined Corner and Edge Detector. In Proceedings of the 4th Alvey Vision Conference, Alvey, UK, 31 August–2 September 1988; pp. 147–151. [Google Scholar]
- Lowe, D.G. Distinctive Image Features from Scale-Invariant Keypoints. Int. J. Comput. Vis. 2004, 60, 91–110. [Google Scholar] [CrossRef]
- Mikolajczyk, K.; Schmid, C. A Performance Evaluation of Local Descriptors. IEEE Trans. Pattern Anal. Mach. Intell. 2005, 27, 1615–1630. [Google Scholar] [CrossRef] [PubMed]
- Bay, H.; Ess, A.; Tuytelaars, T.; Van Gool, L. Speeded-Up Robust Features (SURF). Comput. Vis. Imag. Underst. 2008, 110, 346–359. [Google Scholar] [CrossRef]
- Al-Ruzouq, R.I. Data Fusion of Multi-Source Imagery Based on Linear Features Matching. Int. J. Remote Sens. 2010, 31, 5011–5021. [Google Scholar] [CrossRef]
- Yang, Y.; Gao, X. Remote Sensing Image Matching Via Active Contour Model. AEU-int. J. Electron. Commun. 2009, 63, 227–234. [Google Scholar] [CrossRef]
- Huang, L.; Li, Z. Feature-Based Image Matching Using the Shape Context. Int. J. Remote Sens. 2010, 31, 2169–2177. [Google Scholar] [CrossRef]
- Wang, B.; Lu, Q.; Li, Y.; Li, F.; Bai, L.; Lu, G.; Lai, R. Image Matching Method for Multimodal Images. Appl. Opt. 2011, 21, 1861–1867. [Google Scholar]
- Sima, A.A.; Buckley, S.J. Optimizing SIFT for Matching of Short Wave Infrared and Visible Wavelength Images. Remote Sens. 2013, 5, 2037–2056. [Google Scholar] [CrossRef]
- Stone, H.S.; Orchard, E.; Chang, C. A Fast Direct Fourier-based algorithm for sub-pixel registration of image. IEEE Geosci. Remote Sens. Lett. 2001, 39, 2235–2243. [Google Scholar] [CrossRef]
- Foroosh, H.; Zerubia, J.B.; Berthod, M. Extension of Phase Correlation to Sub-pixel Registration. IEEE Trans. Image Processing 2002, 11, 188–200. [Google Scholar] [CrossRef] [PubMed]
- Balci, M.; Foroosh, H. Inferring Motion from the Rank Constraint of the Phase Matrix. In Proceedings of the IEEE International Conference on Acoustics, Speech, and Signal Processing, Philadelphia, PA, USA, 18–23 March 2005; Volume II, pp. 925–928. [Google Scholar]
- Liu, J.G.; Yan, H. Phase Correlation Pixel-to-Pixel Image Co-Registration Based on Optical Flow and Median Shift Propagation. Int. J. Remote Sens. 2008, 29, 5943–5956. [Google Scholar] [CrossRef]
- Gruen, A. Development and Status of Image Matching in Photogrammetry. Photogramm. Record. 2012, 27, 36–57. [Google Scholar] [CrossRef]
- Li, D.; Yuan, X. Error Processing and Reliability Theory; Wuhan University Press: Wuhan, China, 2002; pp. 240–255. [Google Scholar]
- Chunli, S.; Peng, H.; Chengyi, H.; Qi, P. The Expatiation of Delaunay Algorithms and a Promising Direction in Application. Sci. Surv. Mapp. 2004, 29, 68–71. [Google Scholar]
- Zhang, Y.; Wang, B.; Duan, Y. An Algorithm of Gross Error Elimination in Image Matching for Large Rotation Angle Images. Geomat. Inf. Sci. Wuhan Univ. 2013, 38, 1135–1138. [Google Scholar]
- Kang, Z.; Zlatanova, S. A New Point Matching Algorithm for Panoramic Reflectance Images. In Proceedings of the International Symposium on Multispectral Image Processing and Pattern Recognition, Wuhan, China, 15–17 November 2007. [Google Scholar]
- Kang, Z.; Li, J.; Zhang, L.; Zhao, Q.; Zlatanova, S. Automatic Registration of Terrestrial Laser Scanning Point Clouds Using Panoramic Reflectance Images. Sensors 2009, 9, 2621–2646. [Google Scholar] [CrossRef] [PubMed]
- Warren, B.C.; Thomas, K.M.; Stith, T.G.; David, P.T. An improved strategy for regression of biophysical variables and Landsat ETM+ data. Remote Sens. Environ. 2003, 84, 561–571. [Google Scholar]
- Ali, E.A.; Khidir, S.O.E.; Babikir, I.A.A.; Abdelrahman, E.M. Landsat ETM+7 Digital Image Processing Techniques for Lithological and Structural Lineament Enhancement: Case Study Around Abidiya Area, Sudan. Open Remote Sens. J. 2012, 5, 83–89. [Google Scholar] [CrossRef]
- Zhang, Y.; Wang, B.; Yu, J. Technologies and System for Automatic Generation of Advanced Geo-spatial Products with Chinese Satellite Imagery. In Proceedings of the 18th Chinese Photogrammetry and Remote Sensing, Wuhan, China, 28–30 October 2012. [Google Scholar]
- Fraser, C.S.; Hanley, H.B. Bias compensation in rational functions for IKONOS satellite imagery. Photogramm. Eng. Remote Sens. 2003, 69, 53–57. [Google Scholar] [CrossRef]
- Jabari, S.; Zhang, Y. RPC-Based coregistration of VHR imagery for urban change detection. Photogramm. Eng. Remote Sens. 2016, 82, 521–534. [Google Scholar]
- Zhang, Y.; Xiong, J.; Hao, L. Photogrammetric Processing of Low-Altitude Images Acquired by Unpiloted Aerial Vehicles. Photogramm. Rec. 2011, 26, 190–211. [Google Scholar] [CrossRef]
- Förstner, W.; Gülch, E. A Fast Operator for Detection and Precise Location of Distinct Points, Corners and Centres of Circular Features. In Proceedings of the ISPRS Intercommission Conference on Fast Processing of Photogrammetric Data, Interlaken, Switzerland, 2–4 June 1987. [Google Scholar]
- Ackermann, F. Digital Image Correlation: Performance and Potential Application in Photogrammetry. Photogramm. Rec. 1984, 11, 429–439. [Google Scholar] [CrossRef]
- Li, D.; Yuan, X. Error Processing and Reliability Theory; The Publishing House of Wuhan University: Wuhan, China, 2002. [Google Scholar]
- Morel, J.; Yu, G. ASIFT: A New Framework folr Fully Affine Invariant Image Comparison. J. Imaging Sci. 2009, 2, 438–469. [Google Scholar] [CrossRef]

© 2017 by the authors. Licensee MDPI, Basel, Switzerland. This article is an open access article distributed under the terms and conditions of the Creative Commons Attribution (CC BY) license (http://creativecommons.org/licenses/by/4.0/).