1. Introduction
It is known that the artificial and natural aging of writing inks printed on paper is an important forensic, criminalistics, and social problem. The most pressing issue in this area is establishing the actual age of a document or its parts since the most common way of document forgery is adding and writing extra inscriptions, signatures, and fake dates with ballpoint, gel, and technical pens. In a variety of cases, in order to hide the fact of falsification, documents are heated or exposed to artificial or natural light sources. Thus, the disclosure of such falsification is an important legal and social task [
1,
2].
All writing inks consist of a dye component or a mixture of dyes, as well as a binding substance known as a vehicle composed of several solvents and additives responsible for the physicochemical properties of inks (including lubricants, corrosion inhibitors, emulsifying agents, buffers, surfactants, and various other components) [
2,
3,
4]. All ingredients in the ink mixture can yield important analytical information to the forensic document examiner. Therefore, it is better to use analytical techniques that can identify the variety of chemicals from which writing inks are composed [
4]. The following dyes are most commonly used as a part of blue writing ink: victoria blue (VB), rhodamine B and 6G, the methyl violet group of dyes (pararosaniline with four, five or six methyl groups), crystal violet (CV), methyl violet (MV), tetramethyl-pararosaniline (TPR) and copper phthalocyanine, which has been used in ink dye manufacturing since 1954 [
5]. Initially, oleic, castor, and mineral (petroleum) oils were used as solvents. Glycols have been predominantly used as solvents since 1950. In turn, the most widespread solvents currently used are glycerol, tri-, tetra-, pentaethylene glycols, fenoxyetanol, phenoxyetoxy ethanol, benzyl alcohol, 2-pyrrolidone and butylene glycol [
2,
6].
The investigation of the aging processes of ink is a challenging task because one has to take into account that each compound begins to decompose after an ink is deposited on paper through different mechanisms. Thus, a variety of processes occurs simultaneously when writing inks are printed on paper. Writing inks dry due to solvent evaporation; they get dull due to dye degradation and solidify due to resin polymerization. From this perspective, the degradation of dye as a process, which is the most resistant to external influence, attracts the most interest. The mechanisms of the temporal degradation of dyes are described in detail elsewhere [
7,
8,
9,
10,
11].
In order to analyze the events that occur during the degradation of writing ink, one should minimize changes in the document in question caused by inappropriate ink sampling [
12]. As a result, non-invasive methods of analysis are preferable for the forensic examination of documents. In this regard, spectral methods are the most effective ones; however, most of them have significant limits. Methods of attenuated total reflectance Fourier transform infrared spectroscopy (ART-FTIR) are also often used in this regard. However, the FTIR technique requires prior time-consuming sample preparation when used for the analysis of writing inks. Moreover, there are some difficulties related to the presence of strong absorption bands caused by paper overlapping with the absorption bands of an ink [
13]. The most promising approach for investigation of dye degradation processes at this time is the Raman spectroscopy method. Raman spectroscopy is a unique tool for the explicit analysis of any material [
14]. The main advantage of Raman spectroscopy is its non-destructive and non-invasive effect on a sample, which allows a back-to-back analysis to be conducted if necessary. In addition, this method is a fast and efficient way to conclusively identify both organic and inorganic substances, which indicates its high chemical selectivity [
15]; moreover, the samples analyzed by Raman spectroscopy do not require preliminary preparation. Also, Raman spectroscopy enables very small samples (<1 μm) to be analyzed with a high spatial (≤1 μm) and spectral (<1 cm
−1) resolution [
14]. In turn, low laser radiation power (~4 mW) is sufficient to obtain Raman spectra, bringing the risks of potential laser-induced degradation to a minimum [
15]. Nevertheless, there is at least one shortcoming of this method: a fluorescence signal yielded by a sample, which interferes with the recording of high quality spectra. The fluorescence of some organic compounds may arise due to the exposure of the sample to laser irradiation. This phenomenon results in intrinsic wide band radiation that may be significantly more intense than Raman scattering. Fluorescence problems may be avoided if a longer wavelength of radiation is used [
15]. However, it is necessary to remember that the intensity of Raman scattering is proportional to the fourth power of the excitation frequency intensity. As a result, excitation by long-wave irradiation yields a Raman signal, which is considerably less intense than one obtained using short-wave excitation [
14].
The development of forensic methods requires the implementation of new approaches. The current study proposes a modified methodological approach for data analysis, which in many cases gives an opportunity to conduct experiments in the absence of a large database of an expert entity, increasing its efficiency, reducing labor consumption, and allowing us to focus on the study of the spectral properties of dyes free from the influence of, not only a dye, but also other components of writing inks. For that reason, a detailed investigation into the mutual influence of the volatile and dye components of writing inks was performed. In turn, for convenience and better understanding, in the proposed methodology, we have to appeal to some previously reported results [
16]. The methodological distinction of this from similar studies [
1,
2,
13,
17,
18] was in considering the fact that the peak intensity in Raman spectrum also depends on the concentration of the studied compound within the focal spot of the laser beam, which was impossible to control in our case. Thus, in order to eliminate the influence of the concentration factor, we used the ratio of intensities instead of absolute intensity values. Furthermore, in [
16] we found that the time dependency of Raman peak ratios has a complicated nature: it consists of three fragments of monotonous change in spectral properties and two extrema, making it impossible to use this dependency for the estimation of the age of writing ink without further analysis of its nature [
16].
The choice of peaks used in the corresponding dependencies was determined as follows: the first peak corresponds to vibrations of the peripheral bond, which is most susceptible to change over time. The second peak corresponds to vibrations of the most stable bond (e.g., vibrations of carbon in the chromophore). The peak ratios chosen for each type of writing ink are shown in
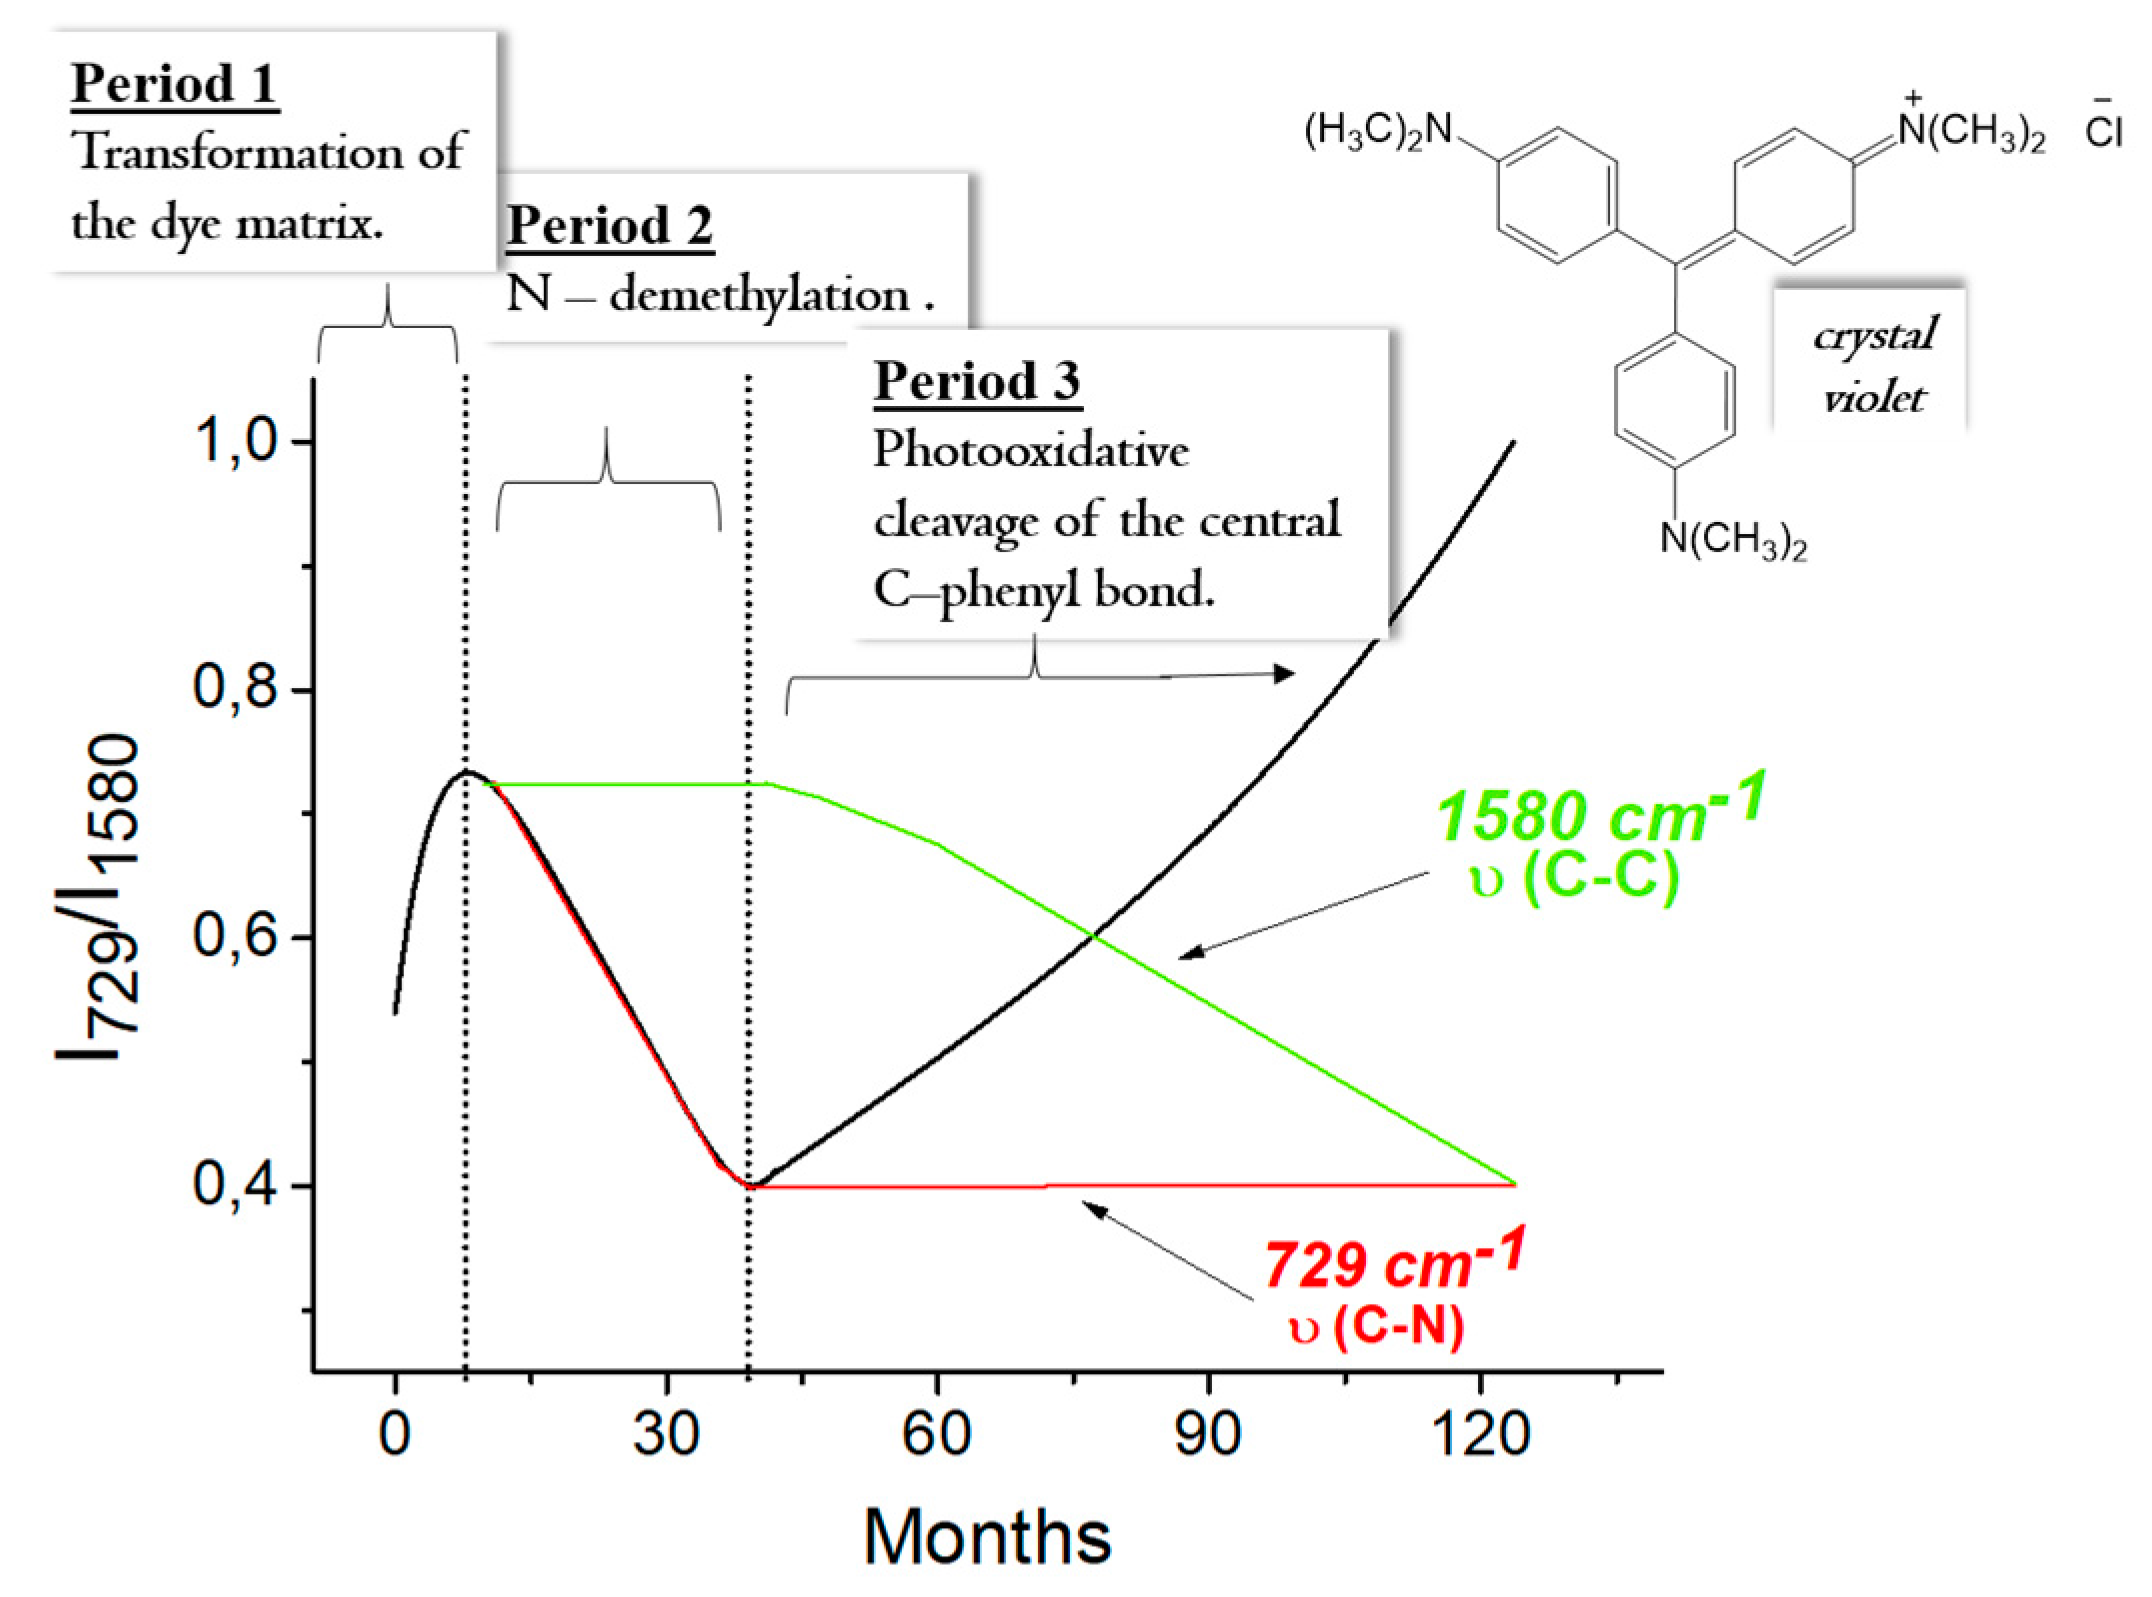
Table 1. The establishment of the dates when writing inks were drawn on paper can be illustrated by the type B inks, for which triarylmethane dyes are used. There are two possible mechanisms of degradation of this type of writing ink. The first mechanism is
N-demethylation, in which the methyl group of a dye is sequentially replaced by hydrogen when exposed to light [
19]. In the second mechanism the degradation occurs due to attack of a dye molecule by singlet oxygen [
20,
21]. In order to build the aforementioned dependencies, Raman peaks centered at 729 cm
−1 corresponding to C–N vibrations and at 1580 cm
−1 corresponding to complex C–C vibrations have been chosen. These vibrations are differently sensitive to degradation. The obtained curve can be divided into three monotonic intervals (
Figure 1). These intervals display dynamics of the dominant processes. The first interval (Period 1) corresponds to the transformation of the dye matrix (volatile components evaporate, resin hardens). This period can be analyzed by gas chromatography [
8,
22,
23,
24]. In the second interval (Period 2),
N-demethylation occurs. Finally, the third interval (Period 3) is responsible for the photo-oxidative cleavage of the central C-phenyl bond. Thus, the resulting curve is a combination of the processes described above dominating in a certain interval, which causes the complicated shape of this curve. This provides certain limitations in establishing the dates when writing inks were drawn on paper. As a result, this analysis can be reliably conducted only when there is confidence that an ink was drawn on paper earlier or later than the minimum shown in
Figure 1 or when there are reliable samples for comparison.
Finally, it is also should be pointed out that the main goal of the previously published work [
16] was to evaluate the capability of Raman spectroscopy to study the processes of the temporal degradation of dyes, and it did not contain any methodological developments. In particular, it was pointed out that the overlapping of the Raman peaks of solvent and dye may have an interfering influence on such studies. Moreover, within the framework of that work, it was not possible to perform a detailed characterization of all such overlaps and also accurately determine the time interval at which these overlaps are critical for Raman studies. Meanwhile, the practical application of the obtained results is completely dependent on these data. In turn, one of the goals of the current work is to fill this gap. This promotes the jump from theory to practice, resulting in the formation of a new methodological scheme of analysis. It is known that, as a rule, any forensic expertise, including the estimation of the dates of inscriptions placed on paper, requires the existence and permanent maintenance of comparative databases containing information on writing inks of different brand names placed on known types of paper at a known date and stored at known conditions [
25]. However, such databases are not always available. Therefore, alternatively, in some cases the experimental results obtained using the proposed methodological scheme could be quite useful. Based on direct measurements, these results provide the approximate estimation of the date of handwritten inscriptions placed on paper without using comparative databases.
In addition, it is well known that any writing ink is composed of dye and volatile and binding substances. So far, we studied the influence only dyes on the aging of writing ink [
16]. However, in order to use the previously proposed approach as an analytical tool, one needs to take into account the influence of other writing ink components on the aforementioned process. In this work, we are trying to consider all these factors in combination and to develop the proper methodology for the estimation of the age of writing ink printed on paper using Raman spectroscopy.
2. Material and Methods
In the current project, a series of writing inks of different brands (twenty models and types, including Pilot, Erich Krause, Corvina, Parker, Stabilo Point, Dupen, Pentel, Paper Mate, Piano Techno, Dobell, Bic Cristal, Flair, etc. [
16]) was studied. All writing inks were printed on paper as 2 to 3 cm strokes and were subsequently investigated using the methods of spectroscopy and chromatography.
The Raman spectra were recorded using a Senterra Raman spectrometer manufactured by Bruker OPTIK GmbH (Ettlingen, Germany) and equipped with an Olympus confocal microscope attachment (Tokyo, Japan), a fiber optic sensor to register the spectra of samples in the external cell holder, and three lasers operating at 488, 532, and 785 nm. The registered time was 10 s (16 iterations), in order to obtain maximum peak intensity, the Raman spectra were measured between 440 and 1735 cm−1. All recorded Raman spectra were baseline corrected (two iterations) and smoothed (25 iterations).
The electronic absorption spectra were measured using a two-beam scanning spectrophotometer Lambda 1050 (PerkinElmer, Inc., Buckinghamshire, UK) equipped with a double monochromator and a 150 mm InGaAs integrating sphere. Measurements were conducted between 250 and 850 nm with a spectral resolution of 2 nm. In order to perform spectrophotometric studies, paper fragments (3 × 10 mm) were stroked by writing inks and dye solutions in Dimethyl Formamide (DMF).
Gas chromatography analysis was carried out using a ‘Chromatec–Crystal 5000.2’ chromatograph (Yoshkar-Ola, Russia) equipped with a solid sample dispenser and a flame ionization detector. Writing ink samples underwent vaporization in a solid sample dispenser for1 min.
The heating of the writing ink samples was provided by a SM 30/120-HH TS SM Climat (Saint Petersburg, Russia) with a working temperature range from 30 to 120 °С (temperature precision ±2.0 °С and temperature uniformity in volume ±3.0 °С).
3. Results and Discussion
According to previously obtained results [
16], the studied writing inks can be divided into three types (A, B, and C) depending on the dye type used in these inks. The Raman spectra of blue phthalocyanine pigment and alcohol-soluble blue dye have similar sets of peaks, which are virtually identical since they both are based on copper phthalocyanine molecules (
Figure 2,
Table 2). The only difference is that the dye is substituted by phthalocyanine and contains 4-hexyl-sulfonamide groups, which makes it soluble in water and the majority of organic solvents, whereas blue phthalocyanine pigment is insoluble in them. As a result, in Raman spectrum of dye, the 680 cm
−1 peak is absent. Moreover, the intensities of the peaks at 570, 780, 834, and 1142 cm
−1 are significantly less than inthe pigment spectrum (due to contribution of C–C–H oscillations in benzene rings decreases as a result of the appearance of the substituents). Along with that, in dye spectrum, a peak at 1266 cm
−1 corresponding to S=O vibrations appears. Low intensity peaks at 648 and 1400 cm
−1 may also be associated with the presence of sulfonamide groups.
The A
1g, B
1g, B
2g, and E
g modes are active in Raman spectrum, where A
1g, B
1g, and B
2g are vibrations in the molecular plane and E
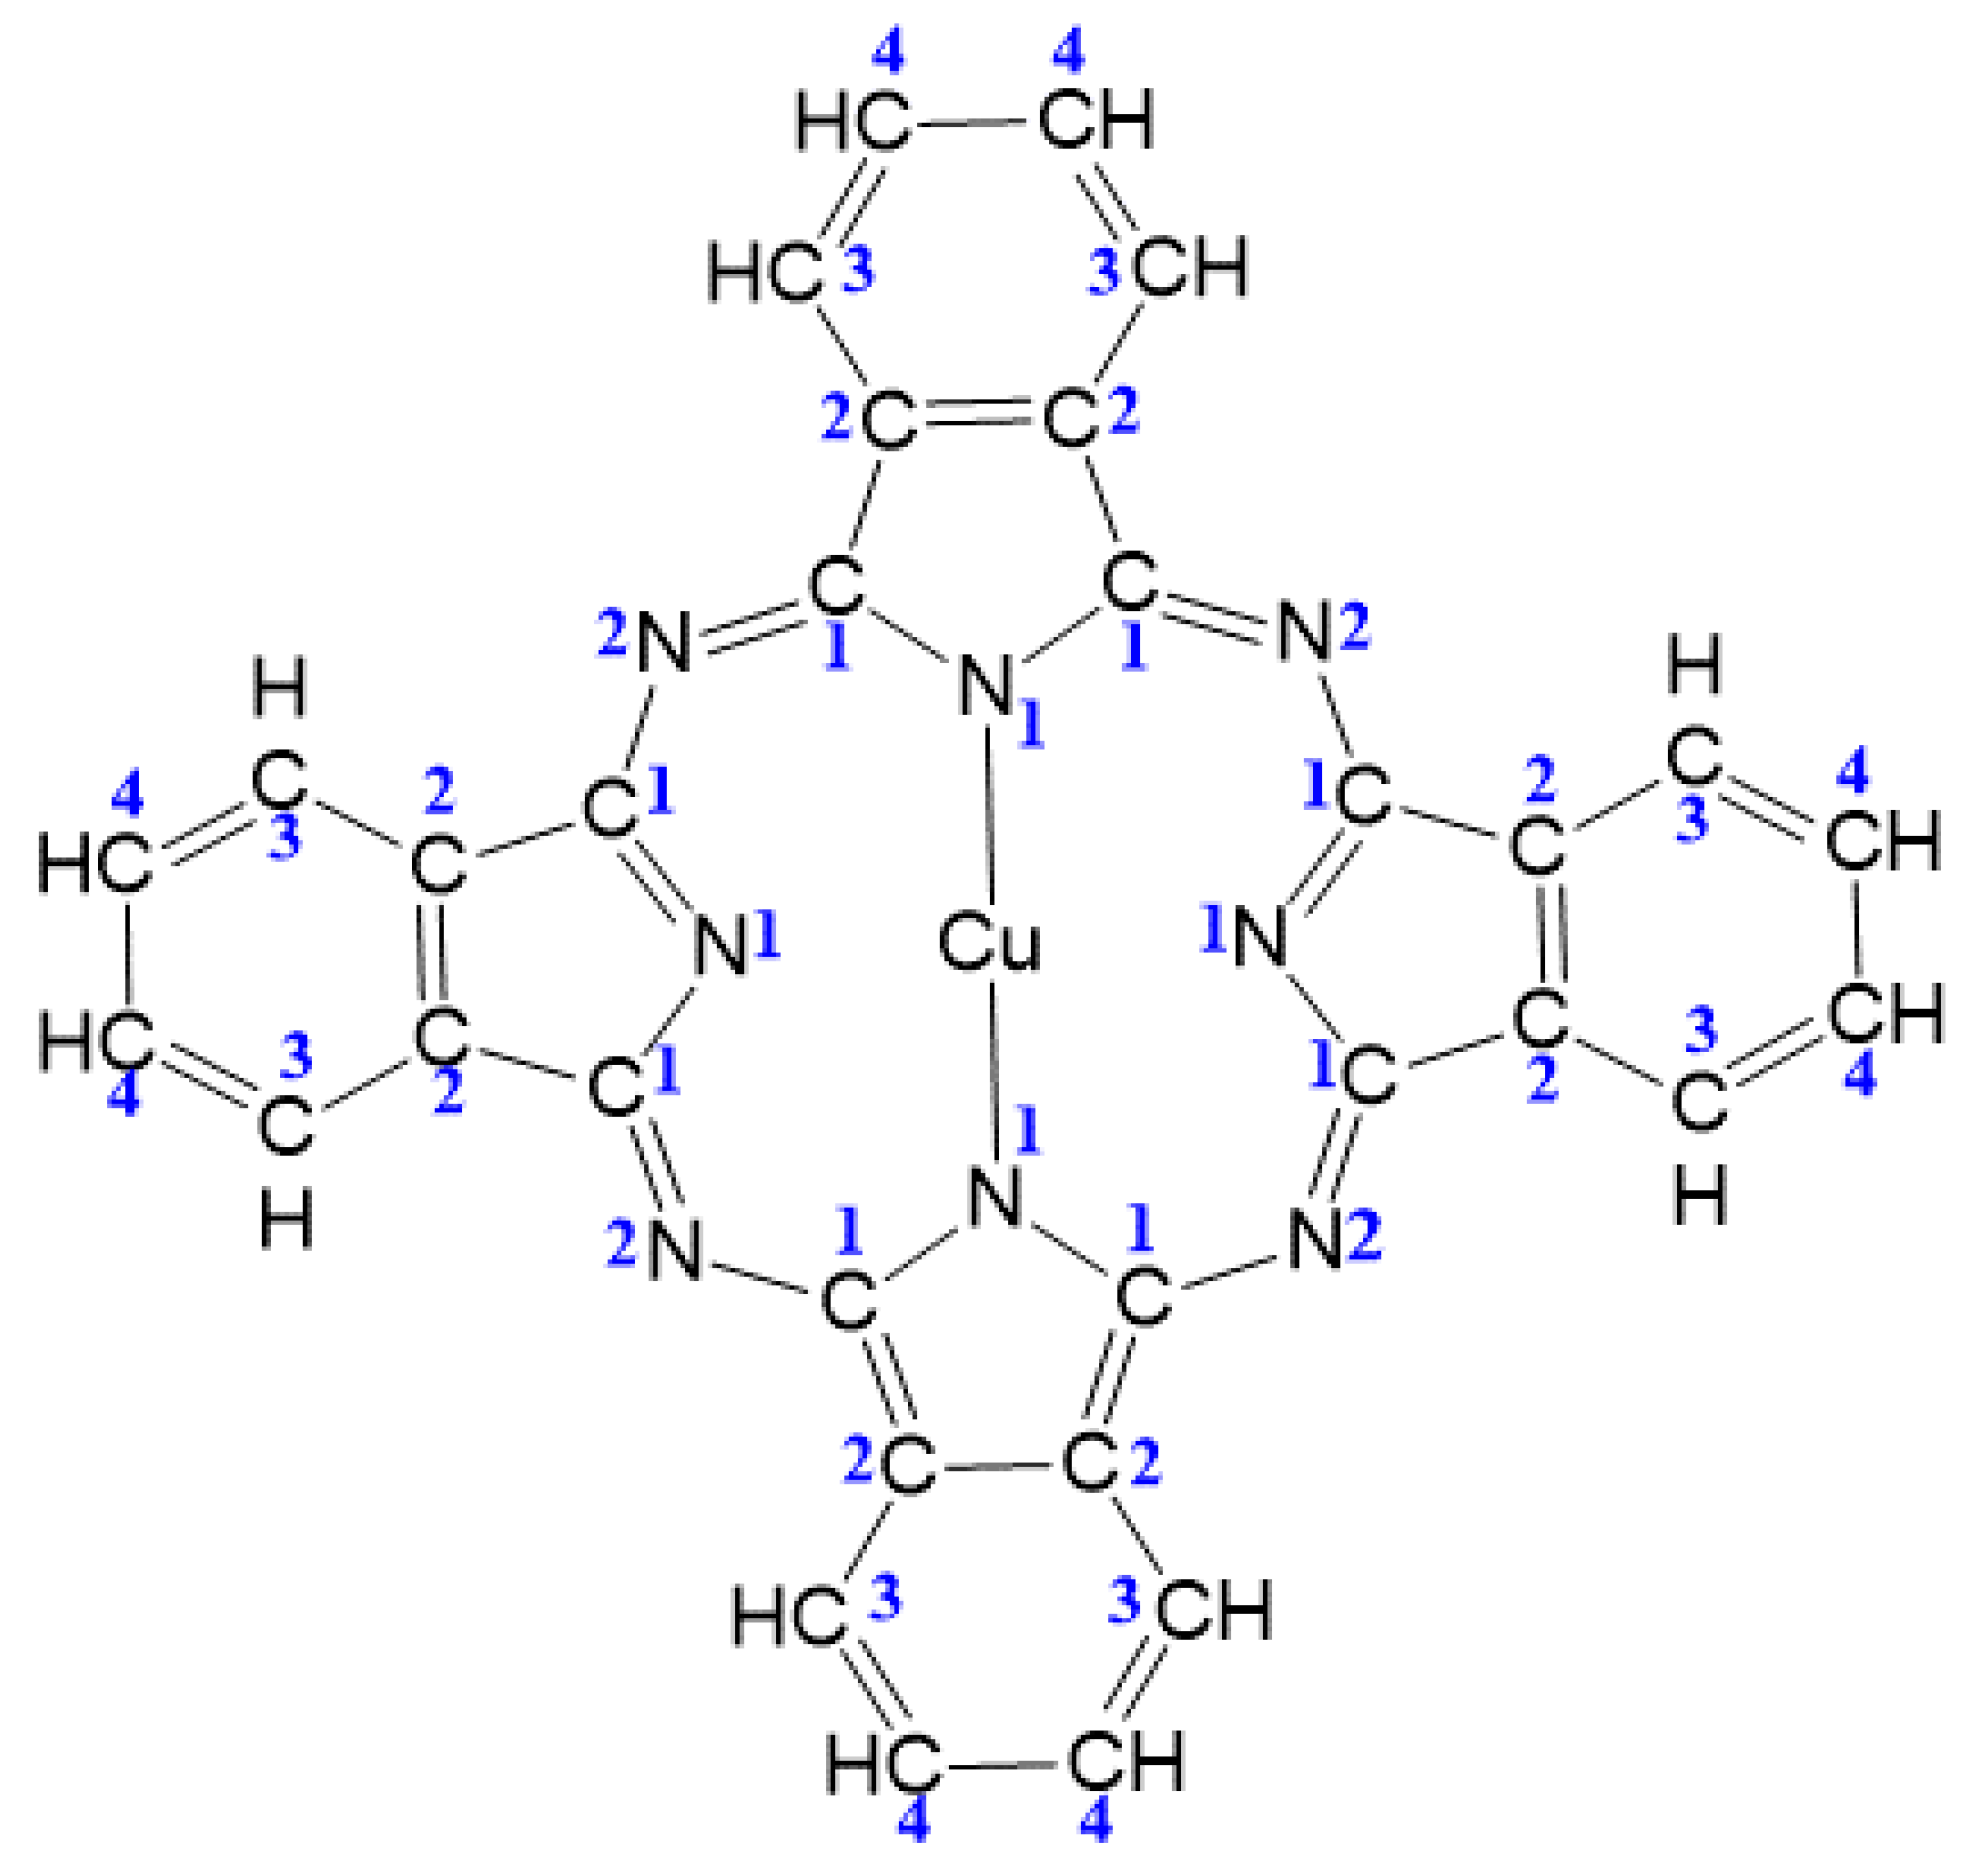
g corresponds to out-of-plane vibrations. In type B
1g vibrations, the displacement of atoms in phthalocyanine molecules occurs symmetrically relative to the C
2 second order axis that passes through the central copper atom, N
α, and benzene rings. The displacement of atoms in B
2g vibrations is symmetrical relative to the C
2 axis that passes through the atoms of copper and N
β (
Figure 3) [
26,
27,
28]. In the red region of the visible spectrum (600 to 800 nm), there is a K line for all phthalocyanines, which is responsible for the color of a compound. The resonance effect at which B
1g and B
2g symmetry vibrations are more active is achieved when the Raman spectrum is recorded at 785-nm (near the absorption maximum) excitation. It is important to note that, despite the predominance of B
1g and B
2g symmetry vibrations, A
1g symmetry vibrations will also be present. However, due to the Herzberg-Teller mechanism they will be considerably less intense because phthalocyanine molecule has two π→π* transitions, which are both located at almost the same absorption maxima in the visible range [
29]. The Raman experiments showed [
16] that the type B writing inks contain the following dyes from thetriarylmethane group: methyl violet, crystal violet, oil violet 5BN, acid bright blue, acid blue 1 and victoria blue B. The structures of these dyes are illustrated in
Table 3. The interpretation of the obtained Raman spectra (
Figure 4) using the data from the literature is presented in
Table 4 [
30,
31,
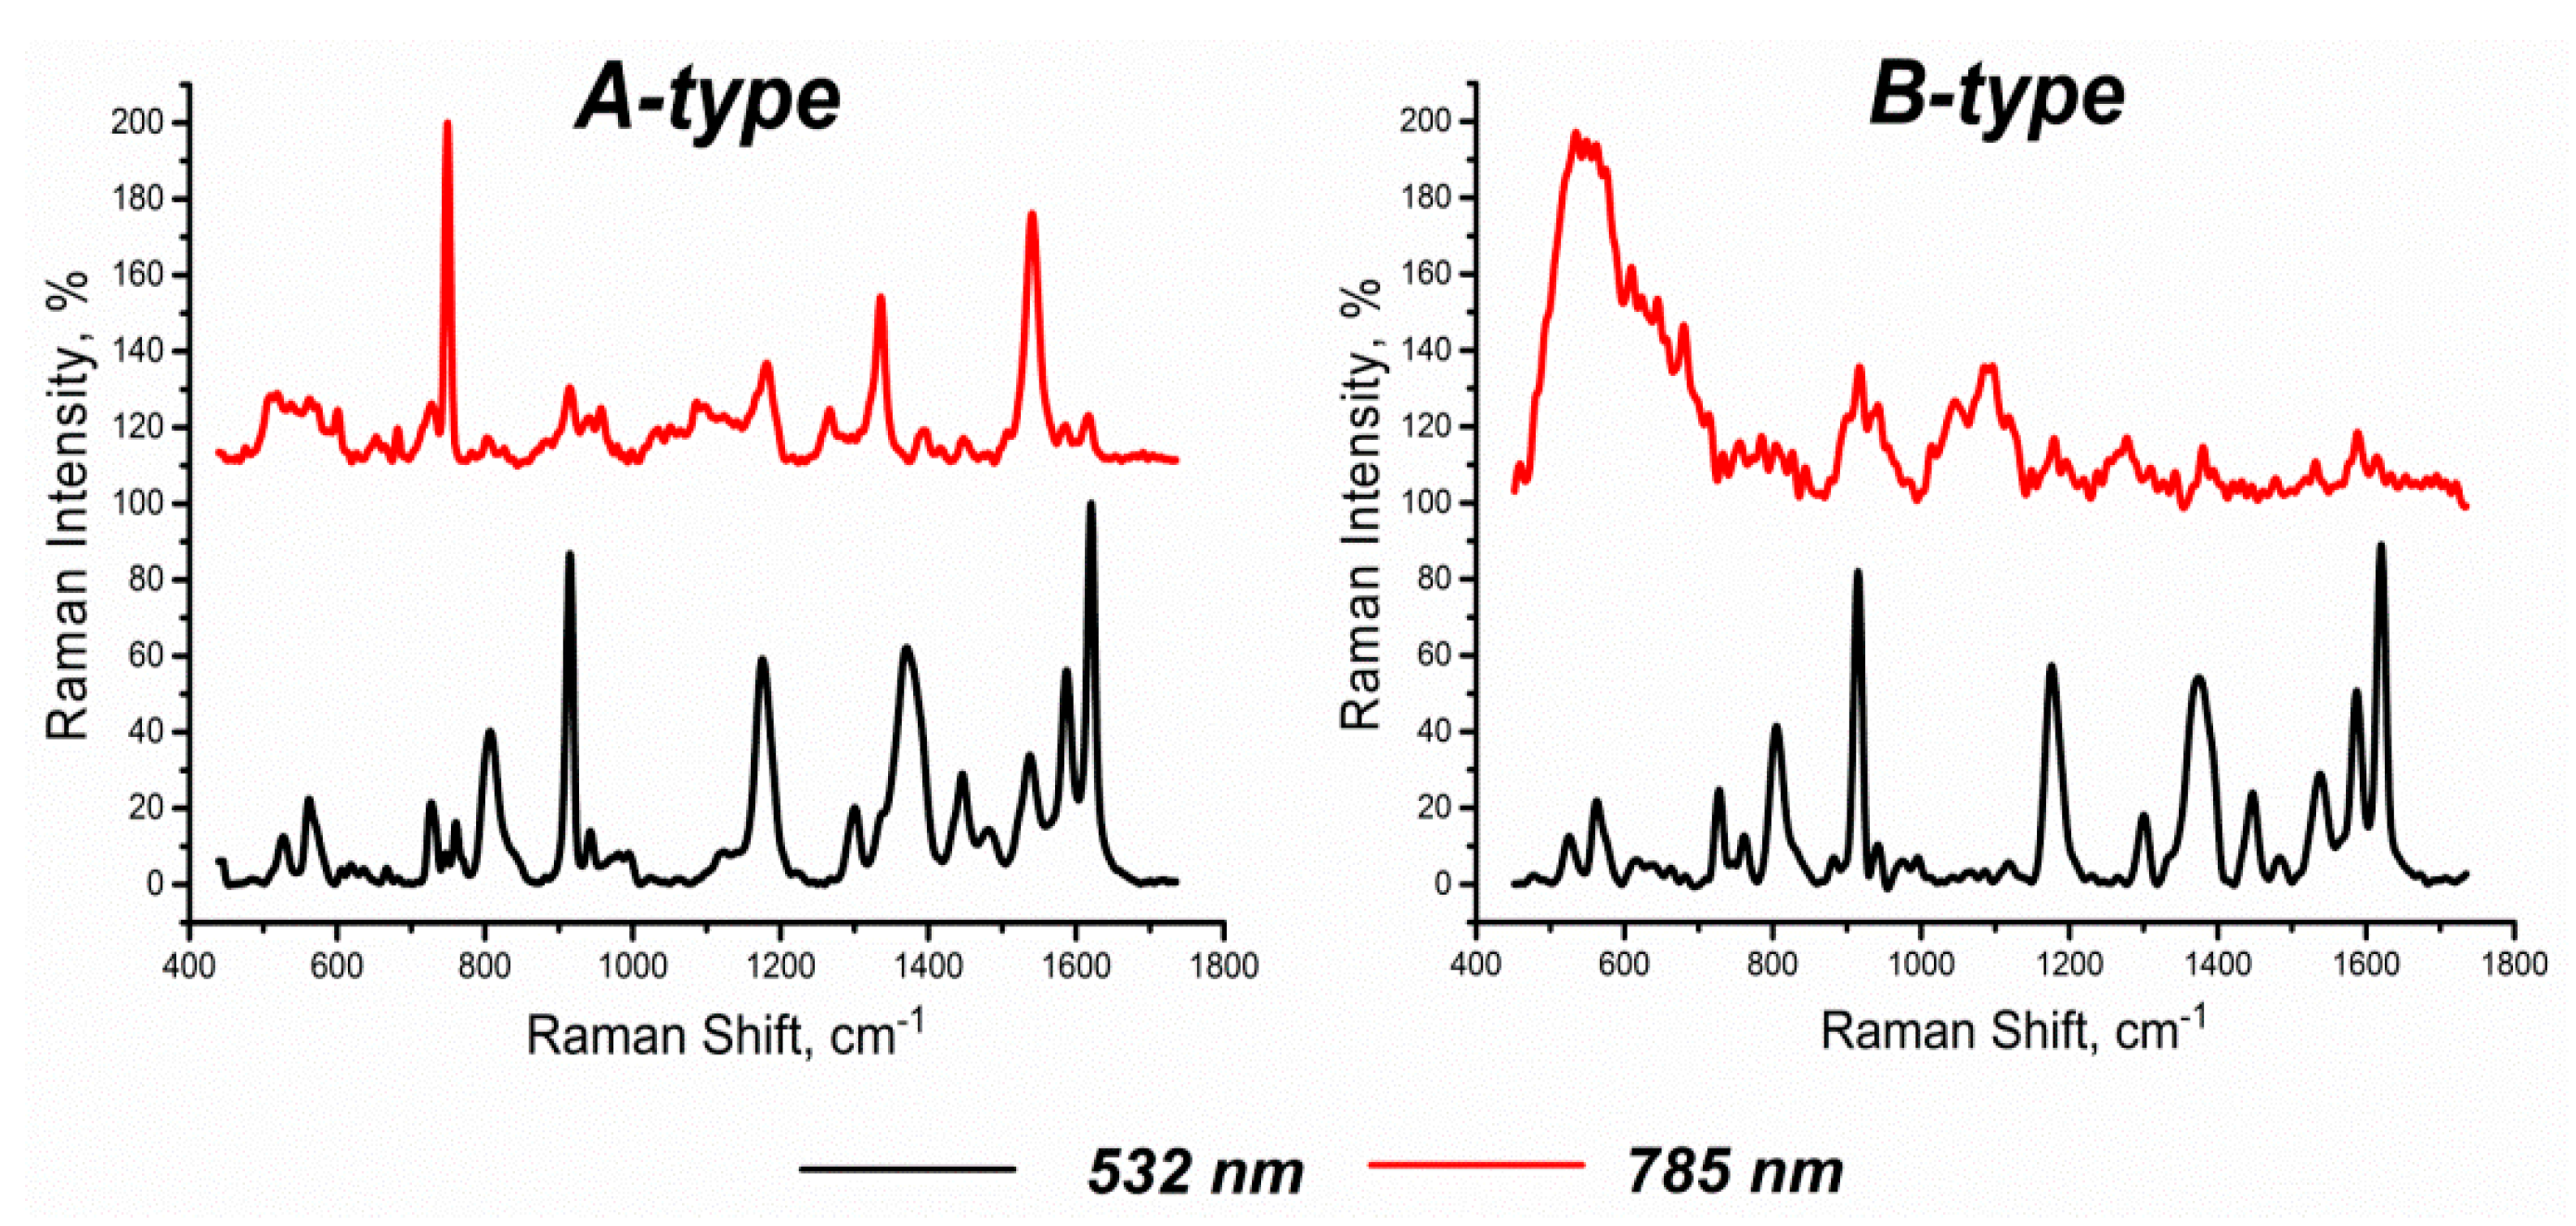
32]. Moreover, the Raman spectra corresponding to the B type recorded at 532 nm are resonant since this wavelength corresponds to the maximum of absorption band of dyes related to this ink type. In turn, these absorption bands correspond to π→π* transitions of the aromatic ring of a dye, due to which the symmetrical vibrations of fuchsonimine are more active [
7]. Furthermore, one should also remember that the Raman spectra of writing inks containing both phthalocyanine dyes and dyes of thetriarylmethane group (typical for type A) will differ significantly at different wavelengths, which is also due to the contribution of resonance effects. As it was mentioned previously, vibrations corresponding to a macrocyclic conjugated π-system, which contains atoms of nitrogen and carbon attributed to a central ring, and vibrations corresponding to fuchsonimine in triarylmethane dyes are the most intense in Raman spectra recorded at 785- and 532-nm excitations, respectively (
Figure 5).
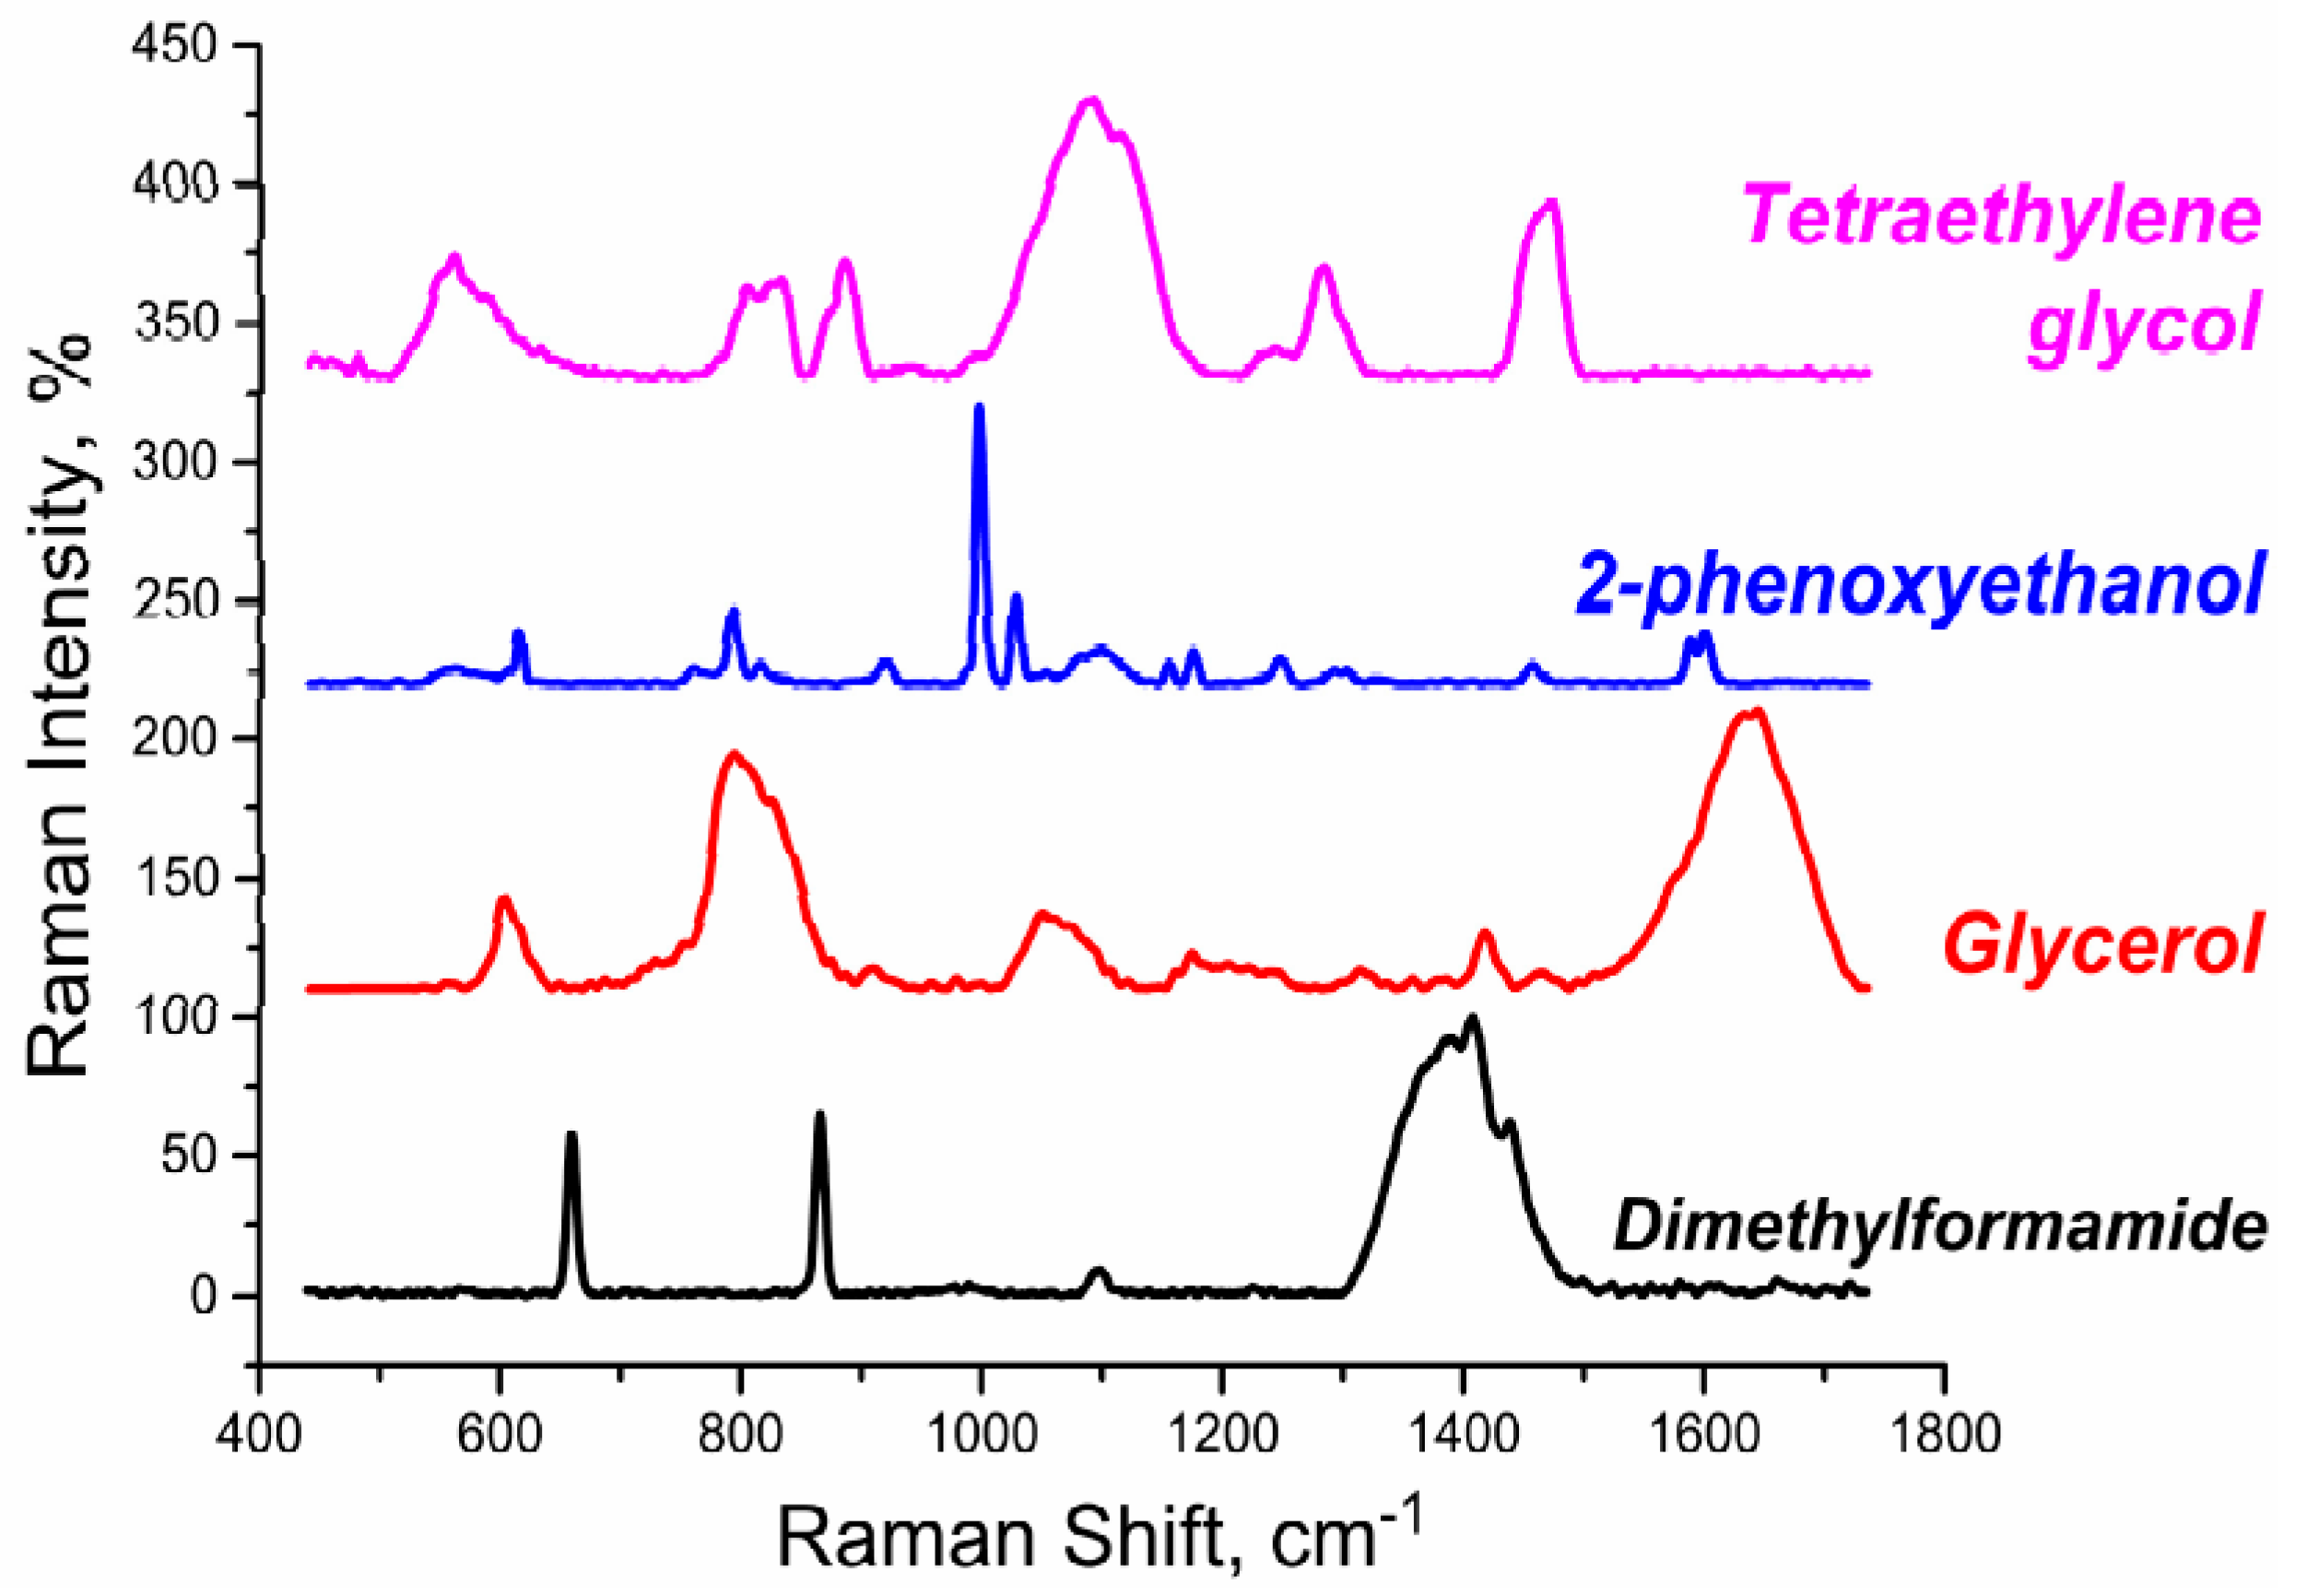
The results presented above were compared with the Raman peaks of other components of writing inks in order to analyze the overlapping peaks in the Raman spectra. For that purpose, the Raman spectra of pure solvents were measured (
Figure 6); as result, the solvent peaks were compared with the peaks of writing ink dyes of different types (
Table 5 [
30,
31,
32]). In
Table 4, the frequencies referring to peaks, which were chosen to plot the time dependencies of peak intensity ratios [
16], are highlighted in blue. In turn, the peaks marked in bold are the ones that are caused by the presence of solvent in the composition of the writing ink as well as by DMF, which is frequently used for sample preparation.
Table 5 shows that many solvent peaks are overlapping, corresponding to writing ink dyes that include those characteristic peaks, which were used for time dependencies [
16], i.e., the adequate application of spectral dependencies is only possible after the evaporation of volatile components or their removal by other methods. The previously published results demonstrate such an opportunity [
16]. Indeed, as it was shown in [
16], the Raman spectrum of writing ink dye is not significantly changed upon heating and subsequent cooling. Taking this into account, the possibility of the removal of volatile components by controlled heating using chromatographic methods was considered. However, this approach always requires an evaluation of the quantity of the extracted or evaporated material using another method. The most common methodology used for this purpose is the analysis of micro-fragmentsof handwritten inscription based on densitometry or spectrophotometry [
22,
23,
24].
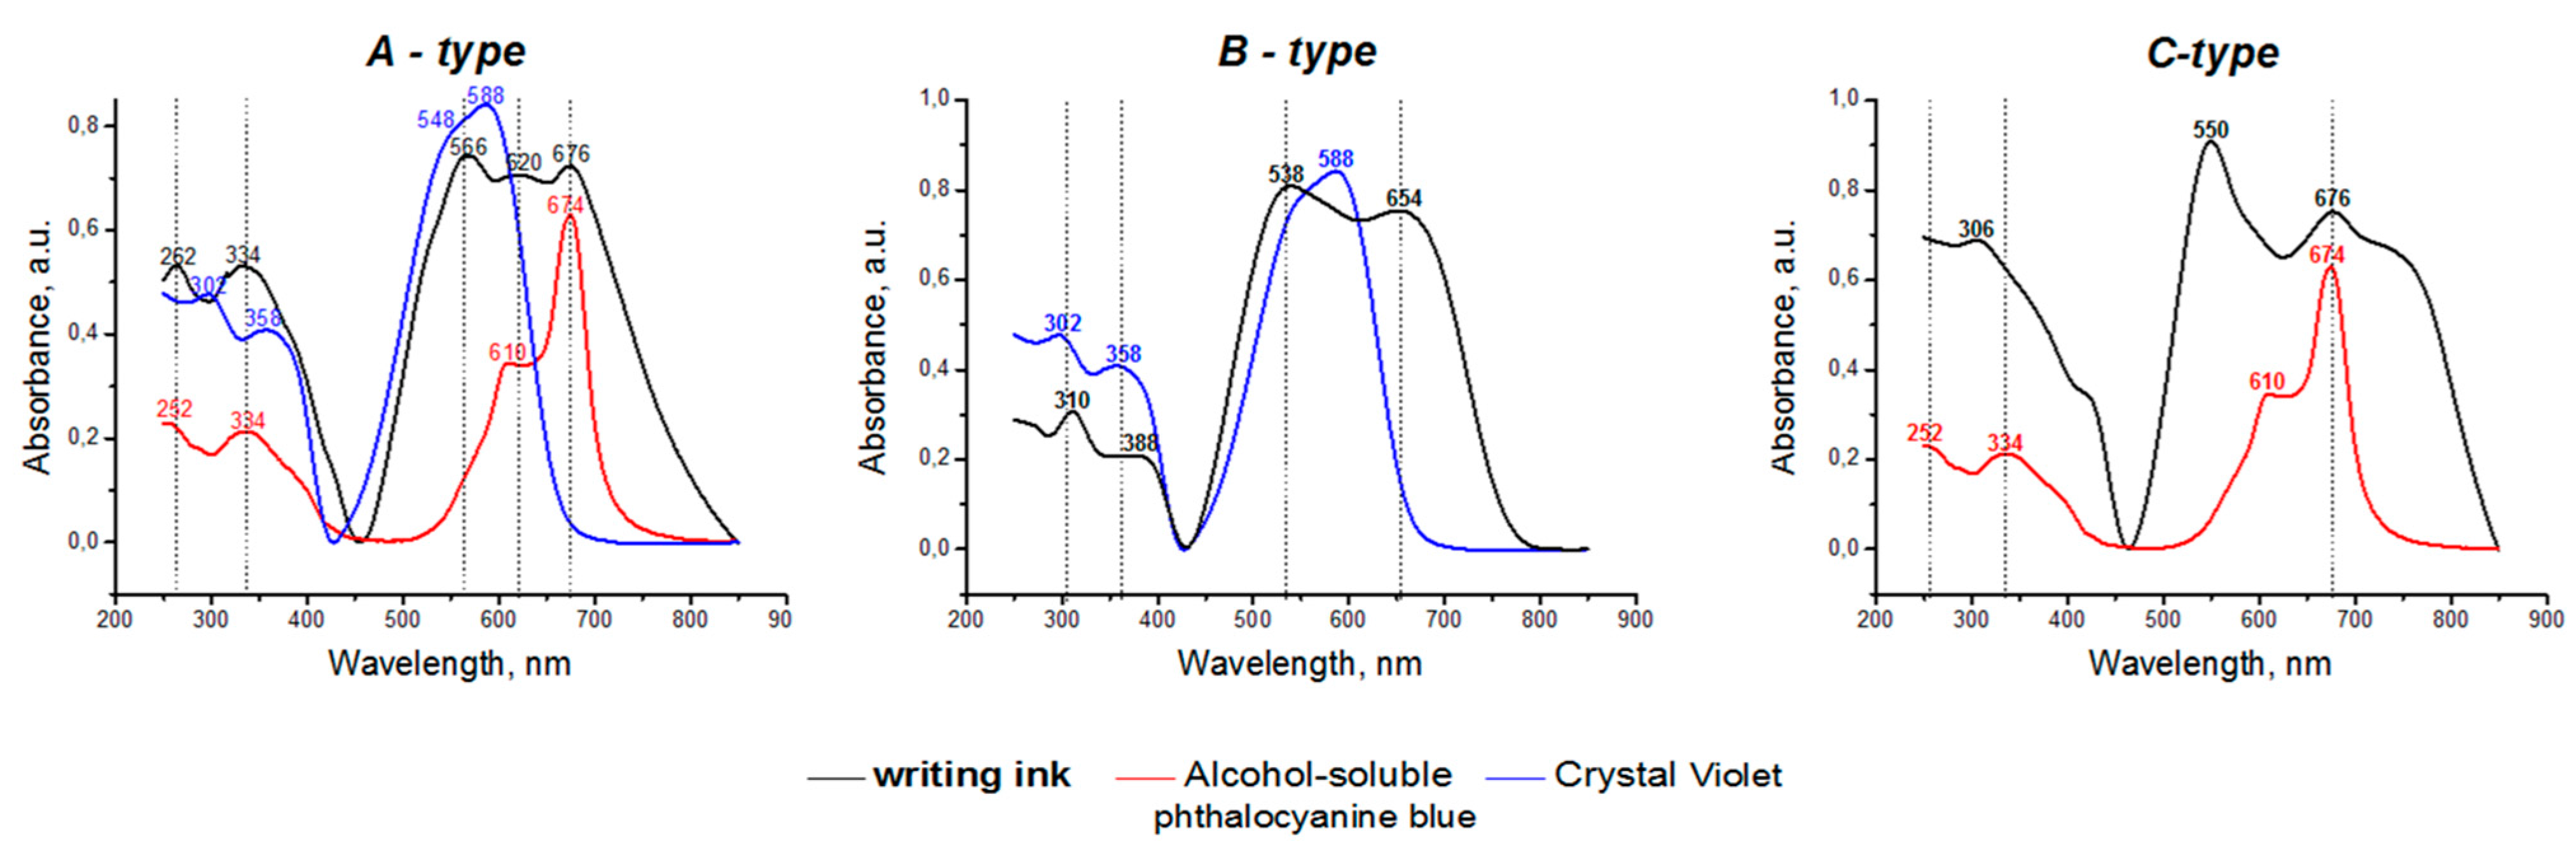
Figure 7 demonstrates comparison of the absorption spectra of writing inks and corresponding individual dyes. The writing ink of type A includes both alcohol-soluble phthalocyanine dye and dyes of the triarylmethane group, whereas their absorption bands are centered at 676 and 620 nm, as well as at 566 nm, respectively. Despite several distinctions in the shapes of the absorption bands, the positions of the absorption maxima of writing inks are to a greater extent governed by the spectral properties of the dye rather than by the spectral properties of other components. Thus, chromatographic studies were performed in combination with spectrophotometric ones. In this regard, the chromatographic peak intensities were normalized to the optical density value of the dye extract in DMF.
In order to establish the time intervals of processes connected to the presence of solvents as binding components in writing inks, evaporation in particular, gas chromatographic experiments were carried out undernormal storage conditions and temperature treatment. The obtained results were compared in order to find the optimal conditions for the elimination of volatile components from writing inks. The evaporation dynamics of volatile components were studied in the writing inks listed in
Table 6. All samples underwent different regimes of temperature exposure in order to study the influence of temperature on the spectral characteristics of writing inks (
Table 7). In addition, the relation of the heating effect withthe effect of storage time at normal conditions was evaluated in order to estimate the rate of chromatographic degradation of the writing inks with respect to spectral degradation. Thus it was found that, upon increasing the temperature, the rate of tetraethylene glycol evaporation also increases. It took about 56 h of heating at 90 degrees in order to completely evaporate the solvent.
It is curious that this dependency is exhibited significantly less for glycerol, despite the fact that this solvent is considered to be the most convenient component for chromatographic analysis. Typically, the majority of solvent evaporates after 1.5 months under normal conditions. Glycerol is a more viscous solvent, and, despite the fact that its boiling temperature is lower than that of tetraethylene glycol, the evaporation process may last longer. This interferes with the reliable comparison of storage time at normal conditions and at high-temperature evaporation. The obtained experimental results are consistent with similar studies on writing inks using gas chromatography, supporting the idea that the capability of handwriting dating based on volatile components is limited and the implementation of spectral methods for dye analysis is required.
The comparison of Raman peaks of dyes as well as data on the thermal degradation of volatile components and dyes [
16] show that the field of application of Raman spectroscopy can be expanded and that this technique can be used not only for analysis in forensic science (the identification of writing ink dyes and the determination of the sequence of the placing of inscriptions, drawings, and stamps on paper [
1,
2,
13,
17,
18]), but also for the estimation of age of the material placed on the paper beyond the period of chromatography capabilities.
Thus, within the scope of the current work, we found that the time dependencies of heating for pure dye have a linear character with a small slope angle [
16]. In all cases, when a period of writing ink storage on open air exceeds 1 to 1.5 years [
22,
23,
24], it can be analyzed using Raman spectroscopy without preliminary sample preparation. If this period is insignificantly smaller, the removal of volatile component traces may be implemented by controlled isothermal sample heating at 60 to 90 degrees, with heating time determined according to
Table 7. According to the gas chromatography results, one can conclude that the influence of other components of a writing ink, solvents in particular, on its spectral characteristics is mainly exhibited during the initial period after drawing on paper (up to six to 12 months). Returning to [
16], monotonously increasing the character or characteristic peak ratio dependency on heating time in the initial period may be explained by influence of the solvent evaporation process. For example, the presence of tetraethylene glycol in writing ink accounts for its spectral contribution to the Raman peak at 1266 cm
−1. If the age of inscription is significantly less (up to one year), then there is no merit in applying Raman spectroscopy since spectral contribution of volatile components is significant and time period in question is quite small. In this case, the error margin of such dating has no advantages over a chromatographic method that has extensive bibliography and application experience [
22,
23,
24]. Another observation found in the results is that there is no need to simply repeat the mistakes committed by many researchers who constantly try to find one and only method, which would be absolutely perfect to study the aging of writing inks. It is apparent that, to solve such an analytical problem, several methods should be applied side by side, and, after comparing the obtained results, one should try to get the needed outcome. Also, it is quite important to properly attribute all particular analytical signals to their corresponding processes and only after that to conduct the more complex analysis.
Finally, according to the overall results obtained, it is possible to propose a new methodological scheme for the estimation of the date of handwritten inscriptions placed on paper using both chromatography and Raman spectroscopy. In general, this scheme can be described as follows. At the first step, the chromatographic measurements are carried out in order to identify the presence or absence of significant amounts of volatile components in the investigated materials. If the chromatographic analysis shows the presence of significant amounts of volatile components, the age of the inscription can be approximately estimated according to
Table 7 or the literature available in abundance elsewhere [
8,
22,
23,
24]. In the case of a small amount of volatile components, the samples are investigated using Raman spectroscopy techniques. In this step, the recorded Raman spectra are analyzed in the following way:
Raman peaks centered at 1340 and 1266 cm−1 are attributed to the paper samples containing alcohol- and water-soluble phthalocyanine dyes.
Raman peaks centered at 730 and 1580 cm−1 are attributed to the paper samples containing triarylmethane dyes.
Raman peaks centered at 1340 and 680 cm−1 are attributed to the paper samples containing phthalocyanine pigment.
The calculation of ratios of the characteristic Raman peaks of the investigated samples (
Table 1).
The estimation of the date when the writing ink was placed on the paper using a calibration curve that was previously obtained (
Figure 1 and [
16]).
It should be mentioned that the correctness of the estimated dates was checked by testing the samples provided against the independent databases of three expert organizations. These tests showed that more than 85% of the investigated samples have an agreement in date estimation with the samples provided by the expert organizations (the age of the tested inscriptions was varied from 36 to 120 months). Also, it should be emphasized that the proposed method demonstrates the most successful results in comparison with alternative approaches.


