Abstract
An efficient and environmental-friendly extraction method has been developed for extraction of ursolic acid (UA) from Hedyotis diffusa by using subcritical water extraction (SWE). The experiments were carried out at different particle sizes (20–100 mesh), extraction temperature (120–200 °C), extraction time (10–50 min), solvent/solid ratio (20–40 mL/g), and extraction pressure (0.6–3.0 MPa). Response surface methodology (RSM) was employed to optimize SWE conditions, and the maximum UA yield was 6.45 mg/g material. Optimal conditions are as follows: Particle size of 80 mesh, extraction temperature at 157 °C and a solvent/solid ratio of 30 mL/g. The model of experimental response was proved to predict the experimental results very well and demonstrated that UA yield was mainly depended on solvent/solid ratio, followed by particle size and temperature. The purified extract was analyzed by electrospray ionization time-of-flight mass spectrometry (ESI-TOF-MS). The acquired precursor ion was m/z 455.3532, which is consistent with calculated value of UA. Furthermore, different extraction methods, including maceration extraction, heat reflux extraction, ultrasonic extraction, microwave-assisted extraction, and SWE were comparatively analyzed, which indicated that SWE was a time-saving, cost-saving and environment-friendly extraction technology for extraction of UA from Hedyotis diffusa.
1. Introduction
Hedyotis diffusa Willd. (synonym Oldenlandia diffusa Willd., family Rubiaceae) is a well-known Chinese herbal medicine widely used in combination with other herbal medicines to treat various types of cancer [1]. The plant contains a variety of active components, including triterpene acids, flavonoids, anthraquinones and steroids [2]. Ursolic acid (UA) is a pentacyclic triterpene acid existing abundantly in H. diffusa [3]. Ursolic acid and its derivatives have been reported to have a number of bioactivities, including anti-inflammatory, hepatoprotective, anti-tumor, anti-viral, anti-HIV, anti-microbial, antimalarial, anti-diabetic, gastroprotective, and anti-hyperlipidemic effects [4,5,6,7,8].
Several research papers have discussed the extraction of UA in some natural materials using organic solvents, such as acetone [9], ethanol [10,11], methanol, acetonitrile and ethyl acetate [12]. Many extraction methods, all conventional, such as Soxhlet extraction [13], maceration [14], reflux extraction [15] and modern, e.g., ultrasonic-assisted extraction (UAE) [16], accelerated solvent extraction (ASE) and microwave-assisted extraction (MAE) [9] have been used to extract triterpenes and their derivatives from plant material. However, conventional organic solvent extractions have an energy-consuming nature, low extraction selectivity, lengthy extraction procedures, and cause environmental problems. Nowadays, the desire to reduce the use of the organic solvents in food and medicine processing has led to new extraction methods including supercritical fluid extraction and subcritical water extraction (SWE).
In subcritical water extraction (SWE), water is pressurized to a temperature and pressure under its critical level conditions with dielectric constant changed, which has become an effective means for the isolation of bioactive and nutritional compounds from plants and food materials [17]. The advantages of SWE include the low energy consumption, simplified operation, high efficiency, friendly environment system and potential of scaling up to the industrial level. Recently, SWE has been used to extract phenolic compounds [18,19], lipids [20], polysaccharides [21], proteins and amino acids [22,23]. In general, extraction of an active ingredient using SWE from plant sources is influenced by multiple parameters such as extraction temperature, extraction time, extraction pressure and ratio of liquid to material, and their effects may be either independent or interactive. Response surface methodology (RSM) has been described to be an effective statistical technique for solving multivariate problems and optimizing several responses in many types of experiments because it can simultaneously consider several factors at many different levels and corresponding interactions among these factors using a small number of observations [24].
In the present work, we report the optimization of the subcritical water extraction of ursolic acid from H. diffusa using response surface methodology (RSM) experimental design. High performance liquid chromatography (HPLC) is used to quantify UA in H. diffusa extracts, and the purified extract was analyzed by electrospray ionization time-of-flight mass spectrometry (ESI-TOF-MS). Furthermore, the result of the proposed method was compared with other extraction methods, such as maceration extraction, heat reflux extraction, ultrasonic extraction and microwave-assisted extraction.
2. Materials and Methods
2.1. Materials and Reagents
Whole H. diffusa plants were purchased from an herbal supplier (Tianyuan Agricultural and Forestry Products Co., Ltd., Chizhou, China). The air-dried whole H. diffusa were pulverized by a knife mill, and were sieved to different sizes of 20, 40, 60, 80, 100 mesh by mesh screen. All powder samples were subsequently packed into plastic bags and stored in desiccators at room temperature for later extraction. The reference standard of ursolic acid (HPLC purity > 97%) was purchased from Preferred Biological Technology Co., Ltd., Chengdu, China. HPLC-grade solvents for HPLC analysis, such as methanol, were obtained from J & K Chemical Co., Ltd., (Beijing, China). Ethanol (>99.7% purity), sulphuric acid (98%), and all other chemicals were analytical reagent grade.
2.2. Subcritical Water Extraction
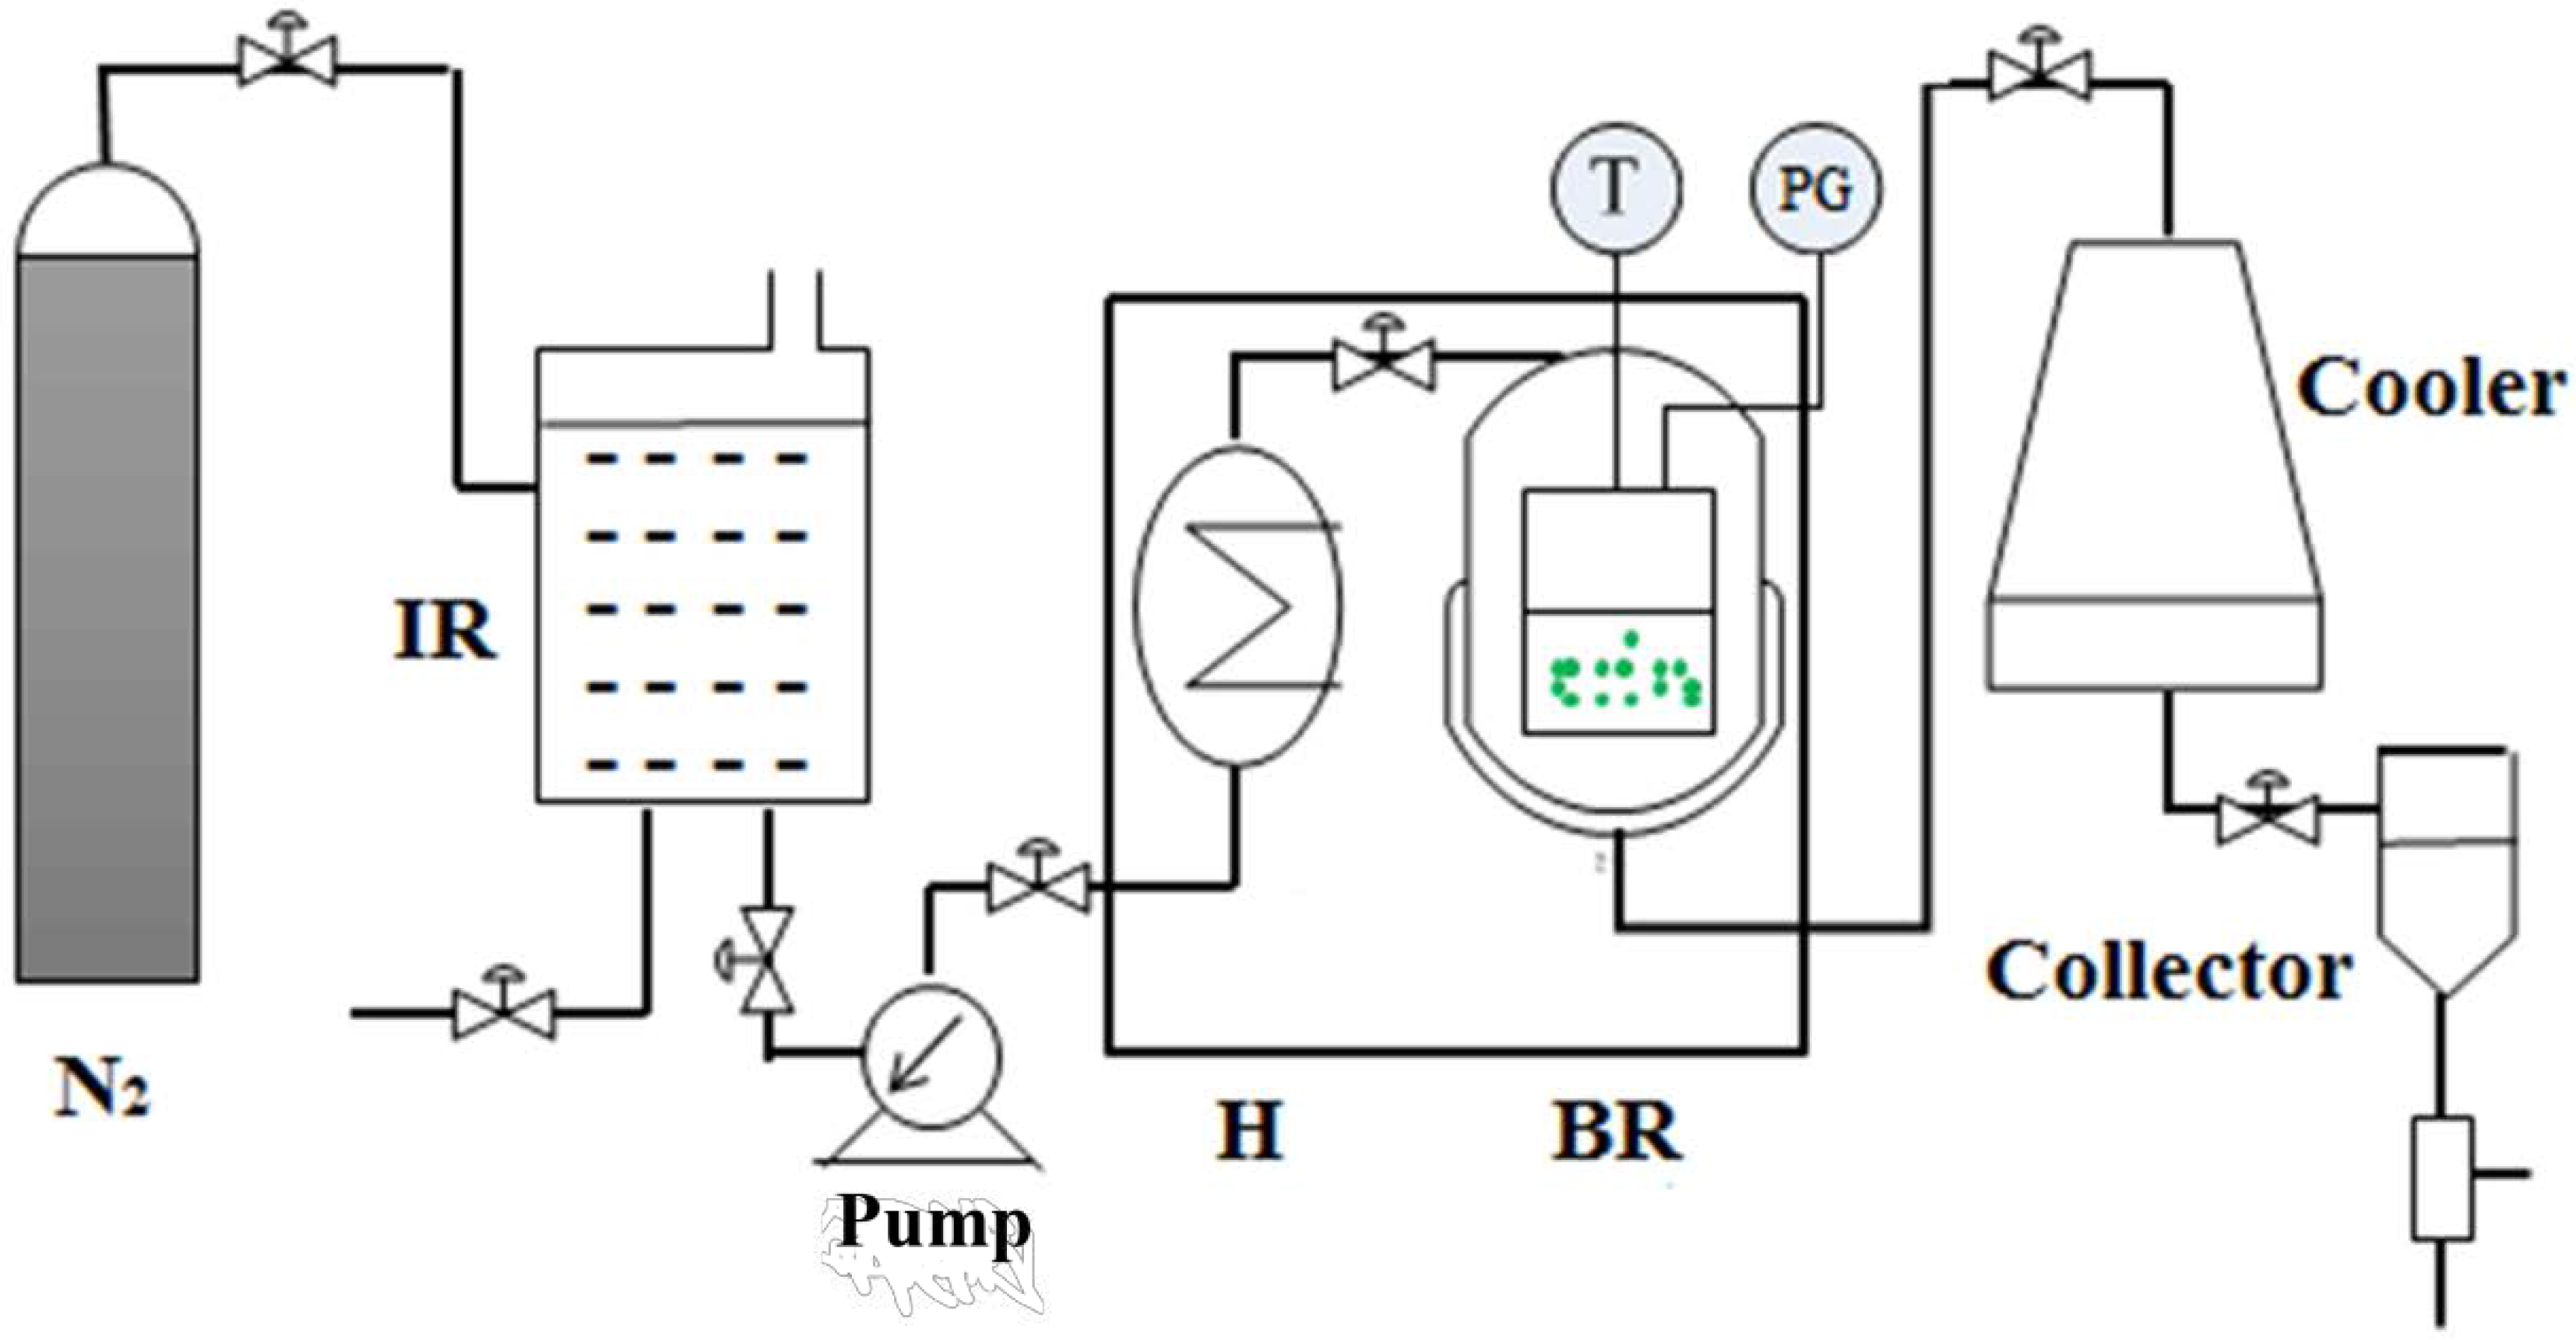
SWE was carried out using a batch reactor, constructed by Beijing Shentaiweiye Equipment Co., Ltd. (Model TGYF-A, Beijing, China). The detailed SWE was showed in Figure S1. The schematic diagram of SWE was presented in Figure 1. The setup consists of three main parts: N2 gas cylinder, batch reactor and collector. The reactor was made of stainless steel, with a volume of 100 mL. In all trials, the material (1 g) and ultrapure water (20~40 mL) were added into the reactor and closed tightly. The reactor headspace air evacuated and refilled with pure N2 gas. A thermocouple (Beijing Shentaiweiye Equipment Co., Ltd., Beijing, China) and a pressure gauge (Beijing Shentaiweiye Equipment Co., Ltd., Beijing, China) were used to measure the temperature and pressure inside the reactor. The extraction time was recorded when the interior temperature of the reactor reached the target level. Once the extraction was finished, the reactor was quenched with the cooler. Finally, the liquid product mixture was collected from the reactor.
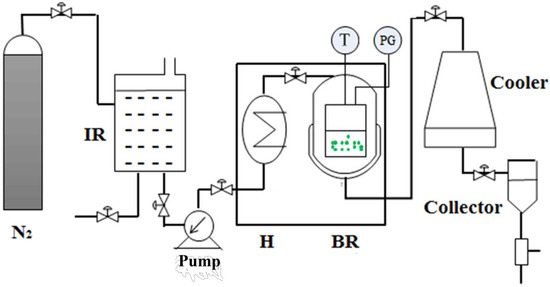
Figure 1.
Schematic diagram of subcritical water extraction apparatus. IR: impounding reservoir; PG: pressure gauge; H: preheater; BR: batch reactor; T: thermocouple.
2.3. Ursolic Acid (UA) Purification
After subcritical water extraction, the mixtures were centrifuged at 4000 rpm for 10 min to remove the insoluble materials. The supernatants were concentrated by rotary evaporation and then the resulting residue was purified with alkali-dissolution and the acid-precipitation method. Using sulphuric acid and sodium hydroxide, the pH value of extracted solution was adjusted repeatedly for purity of UA. The resulting precipitation was dissolved by ethanol, and the solution was passed through a 0.22 μm membrane filter (Jinteng Experimental Equipment Inc., Tianjin, China) prior to HPLC analysis. The extraction yield of UA can be calculated using Equation (1):
2.4. High Performance Liquid Chromatography (HPLC) and Electrospray Ionization Time-of-Flight Mass Spectrometry (ESI-TOF-MS) Analyses
An HPLC method was developed for the detection and quantification of UA in extracts, which was performed on an Agilent 1200 HPLC system with a Venusil MP C18 column (4.6 mm × 250 mm, 5 μm, Bonna-Agela Technologies, Tianjin, China). The mobile phase consisted of methanol: 0.1% aqueous phosphoric acid (88:12 v/v). The flow rate was 1 mL/min, the separation temperature was 25 °C, UV detection was carried out at 210 nm, and injection volume was set up in 10 μL. Calibration curves for standard UA were used to calculate the extraction yield that was expressed in units of mg/g material. Identification of target compounds was based on retention time and chromatographic behavior compared to the standard UA.
Mass spectrometric (MS) analysis was performed on a Liquid Chromatography Mass Spectrometry (Shimadzu, Kyoto, Japan) with an ESI source in order to further identify ursolic acid. The MS conditions for detection were as follows: Negative ion mode; detector voltage, 1.58 kV; curved desolvation line temperature, 200 °C; heat block temperature, 200 °C; 1.5 L/min of nebulizing gas (N2) flow rate; 1.5 × 10⁻² Pa of IT area vacuum; 1.6 × 10⁻⁴ Pa of TOF area vacuum; 149 kPa of drying gas pressure. The spectra were recorded from m/z 100 to 600 and the data for the negative ion mode were acquired for [M−H] − at m/z 455.3631 for UA.
2.5. Single Factor Experimental Design
Single factor experiments were designed to study the effect of particle size, extraction temperature, extraction time, solvent/solid ratio and extraction pressure on the extraction yield of UA. During the optimization of experimental factors, one factor was changed while the other factors were kept constant in each experiment [25], and all the experiments were repeated three times.
2.6. Experimental Design of Response Surface Methodology (RSM)
RSM is a useful tool for analyzing the relationships between measured responses (dependent variables) and factors (independent variables), allowing for minimization of experimentation and leading to correlations that can be used for optimization purposes.
Based on the preliminary single factor results, RSM was used to investigate and optimize the SWE conditions for UA from H. diffusa. Particle size (X1), extraction temperature (X2) and solvent/solid ratio (X3) were preferred for independent variables, and UA yield (Y) was taken as the response of the designed experiments. The Box–Behnken Design (BBD) with three variables and three levels was constructed. The BBD consists of 17 trials, compared to Central Composite Design (CCD), requires fewer experiments to elucidate the three factors [26]. The process variables and experimental data are presented in Table 1. Based on experimental date from BBD, regression analysis was carried out, and the second-order polynomial model performed as follows:
where Y is the predicted response; β0, βi, βii, and βij, are, respectively, the constant term, the linear coefficient, quadratic coefficient and interaction coefficient; and Xi and Xj are the different independent variables.

Table 1.
Box–Behnken design with independent variables and response values.
2.7. Comparison of Different Extraction Methods
In the present paper, some methods such as: Maceration extraction (ME), heat reflux extraction (HRE), ultrasonic extraction (UE) and microwave-assisted extraction (MAE), were compared with SWE for their extraction efficiency of UA from H. diffusa.
2.7.1. Maceration Extraction (ME)
A sample (1 g, 80 mesh) was macerated using 10 mL of ethanol (v/v) at room temperature and was then shaken for 12 h. The extracts passed through a 0.22 μm membrane filter for HPLC analysis.
2.7.2. Heat Reflux Extraction (HRE)
A sample (1 g, 80 mesh) was mixed with 20 mL of ethanol into a round-bottom flask by heat reflux extraction, performed in a water bath for 1 h at 78 °C. The extract was filtered through a 0.22 μm membrane filter for HPLC analysis.
2.7.3. Ultrasonic Extraction (UE)
An ultrasonic extractor (SY-1000E, Beijing Hongxianglong Biotechnology Developing Co., Ltd., Beijing, China) was performed for the UE experiments. Titanium alloy was used for the ultrasound probe transducer (TI-900-15), and the diameter was 15 mm. Dried material (1 g, 80 mesh) was placed into a conical flask, into which 15 mL of ethanol was added. The mixture was extracted for 20 min under a sonic frequency of 20 KHz at 60 °C. Finally, the extract was filtered through a 0.22 μm membrane filter for HPLC analysis.
2.7.4. Microwave-Assisted Extraction (MAE)
MAE was carried out using microwave reactor (Multiwave 3000, Anton Paar, Graz, Austria). A sample (1 g, 80 mesh) was added into the extraction vessel and extracted with 20 mL of ethanol for 15 min under a constant microwave irradiation power of 400 W at 50 °C. The obtained extract was filtered through a 0.22 μm membrane filter for HPLC analysis.
2.8. Statistical Analysis
All experiments were carried out in triplicate. Results were expressed as mean ± standard deviation of replicate extraction. The analysis of variance (ANOVA) was used to analyze the significant terms in the models. The optimal extraction was estimated through regression analysis and three-dimensional response surface plots by using the Design Expert 8.0.5b Trial (State-Ease, Inc., Minneapolis, MN, USA).
3. Results and Discussion
3.1. Single Factor Experimental Analysis
In this study, five key parameters effect on SWE including particle size (mesh), extraction temperature (°C), extraction time (min), solvent/solid ratio (mL/g) and extraction pressure (MPa) were picked out for investigation.
3.1.1. Effect of Particle Size on the Extraction Yield of UA
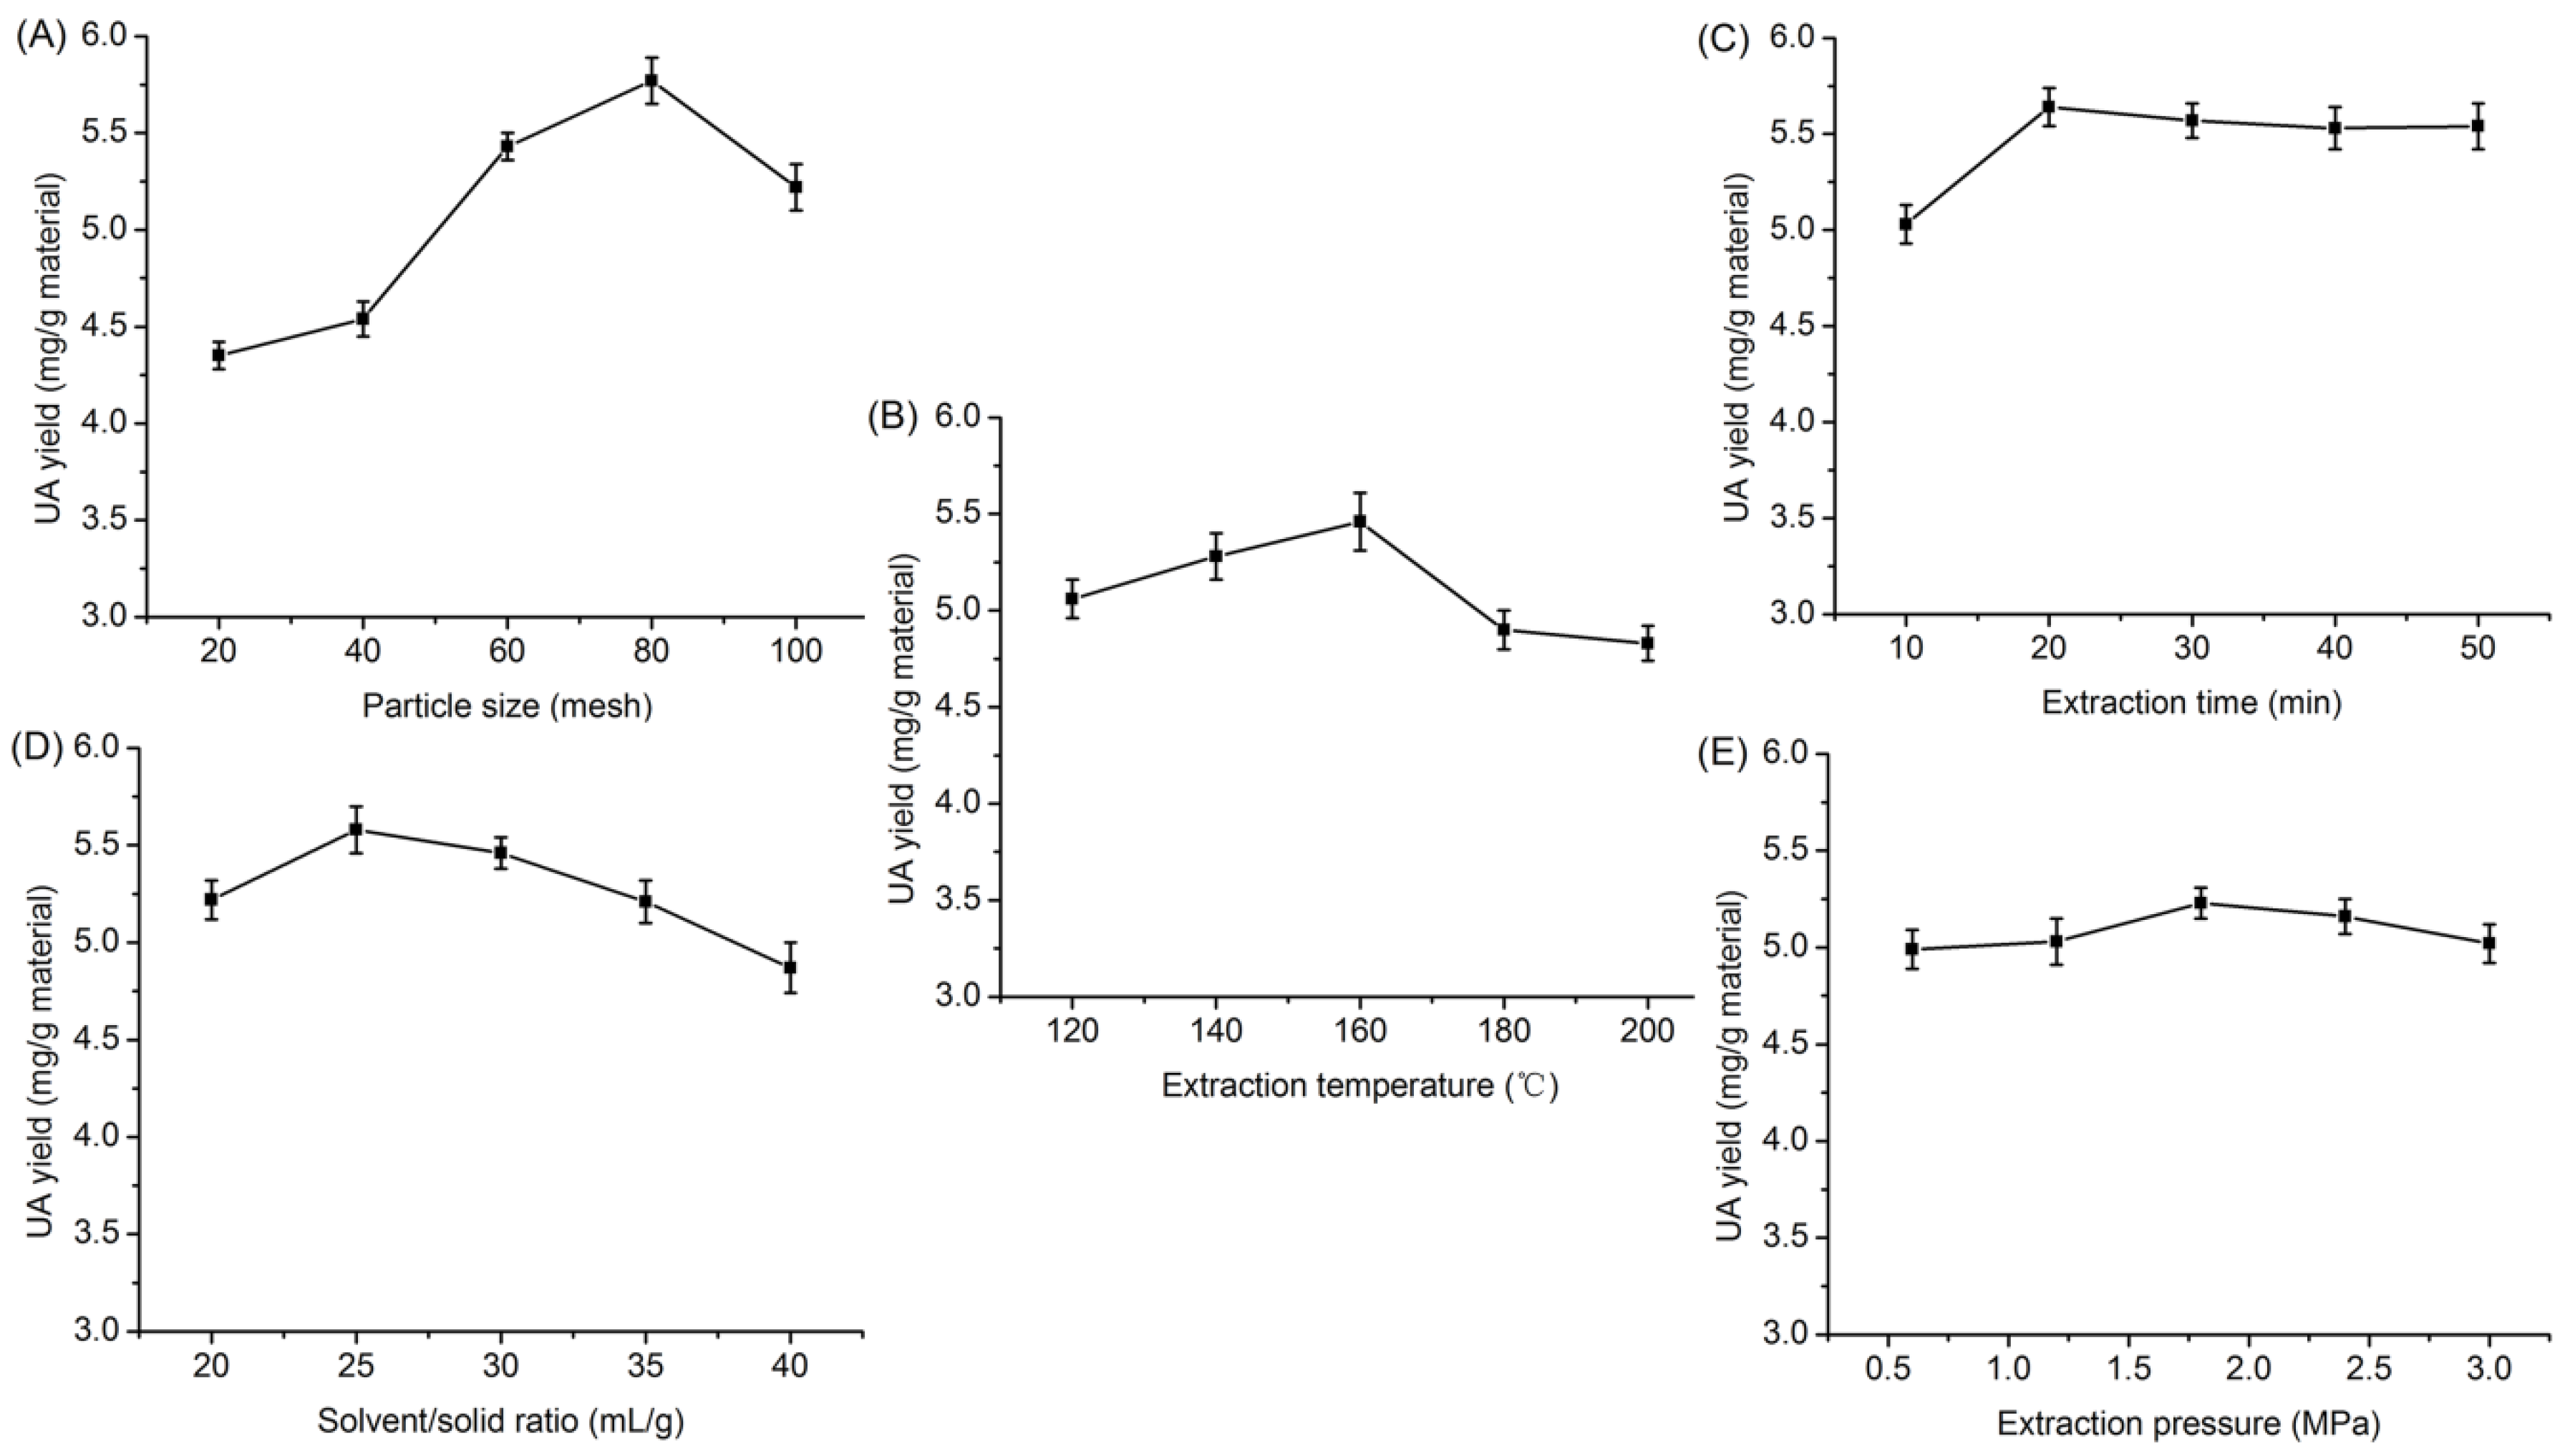
It is known that particle size affects the efficiency of extraction of target compounds from raw material. In Figure 2A, experiments were conducted at five different particle sizes (20, 40, 60, 80 and 100 mesh) of H. diffusa with an extraction temperature of 120 °C, an extraction time of 20 min, a solvent/solid ratio of 30 and extraction pressure at 1.8 MPa. The UA yield increased evidently with decreasing particle size between 20 and 80 mesh. According to Fick’s second law, grinding raw materials to a certain extent could increase interfacial area, which can improve the efficiency of the extraction. The UA yield decreased slightly as the particle size decreased from 80 to 100 mesh. Very small particles may remain at the surface of solvent during extraction, reducing the extraction yield [27]. Thus, the most suitable particle size must be found for extraction of UA from H. diffusa.
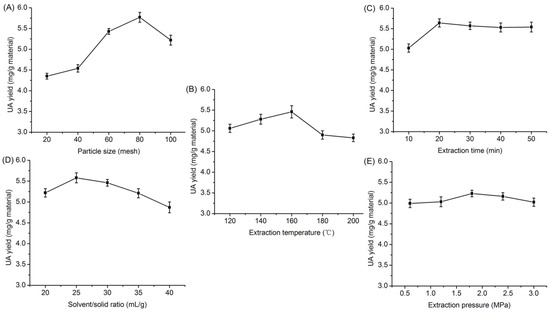
Figure 2.
Effects of different parameters on extreaction yield of ursolic acid ((A): particle size; (B): extraction temperature; (C): extraction time; (D): solvent/solid ratio; (E): extraction pressure).
3.1.2. Effect of Extraction Temperature on the Extraction Yield of UA
To study the effect of extraction temperature on UA yield, an extraction process was carried out under different extraction temperatures from 120 to 200 °C, while using particle size, time, solvent/solid ratio and pressure of 80 mesh, 20 min, 30 mL/g and 1.8 MPa, respectively. As illustrated in Figure 2B, the yield of UA increased remarkably as the extraction temperature increased from 120 to 160 °C and approached a peak at 160 °C. The extraction temperature is the most dominating parameter in SWE, and it has great influence on the extraction rate, extraction yield and the selectivity [28,29]. With the increase of temperature, there is a marked and systematic decrease in permittivity, an increase in the diffusion rate and a decrease in the viscosity and surface tension. Consequently, non-polar targets require less polar medium induced by elevated temperature. However, above 160 °C, the yield of UA decreased. This may be affected due to chemical degradation or losses by thermal decomposition [30]. On the other hand, high temperature may enhance the extraction of impurities. Therefore, temperature is an important parameter to be optimized in order to reduce energy costs, and extraction temperature range of 140–180 °C was considered to be optimal in the present experiment.
3.1.3. Effect of Extraction Time on the Extraction Yield of UA
The effect of extraction time on the UA yield was explored from 10 to 50 min, with other extraction fixed as follows: 80 mesh, extraction temperature of 160 °C, solvent/solid ratio at 30 mL/g, and extraction pressure at 1.8 Mpa. A short extraction time is beneficial to reduce the costs for industrial applications. As shown in Figure 2C, the maximum UA yield was reached at 5.64 mg during a 20 min extraction interval, from which point yield began to decrease slightly. These results can be explained by the increasing extraction time leading to the increasing of material cell disruption and the speeding up of both the release and diffusion of UA into water. On the other hand, excessively lengthening extraction time will cause product decomposition [31]. Hence, 20 min was a suitable time for the extraction of UA from H. diffusa.
3.1.4. Effect of Solvent/Solid Ratio on the Extraction Yield of UA
The solvent/solid ratio also has a critical impact on extraction yield. Solvent/solid ratio was varied from 20 to 40 mL/g (other variables: 80 mesh, extraction temperature at 160 °C, extraction time at 20 min, and extraction pressure at 1.8 Mpa). A high solid to solvent ratio could promote an increasing concentration gradient, resulting in an increase of diffusion rate that allows greater extraction of solids by solvent [32]. In addition, the chance of bio-active components coming into contact with extracting solvent expanded with an increased amount of extraction solvent, leading to higher leaching out rates [33]. This phenomenon was observed in this study as shown in Figure 2D, where UA yield increased significantly to a solvent/ solid ratio of 25:1 mL/g and then leveled off gradually. This might be explained by the research that active component yields will not continue to increase once equilibrium is reached [34]. Therefore, the ratio of solvent to solid was selected from 20 to 30 mL/g.
3.1.5. Effect of Extraction Pressure on the Extraction Yield of UA
We investigated the effect of extraction pressure at 80 mesh, extraction temperature of 160 °C, extraction time of 20 min, and solvent/solid ratio of 25 mL/g. As detailed in Figure 2E, increased extraction pressure had no obvious effect on UA yield. Results showed that UA yield is not significantly (p > 0.05) affected by extraction pressure. In the subcritical water extraction process, the main effect of the pressure is to keep the solvent in the liquid state. An extraction pressure of 1.8 MPa was sufficient for obtaining high UA yield according to the purpose of saving energy.
According to the single factor results, particle size, extraction temperature and solvent/solid ratio were more significant on the UA. Thus, these three parameters were preferred for optimizing the subcritical water extraction of UA from H. diffusa.
3.2. Fitting the Model
Table 1 lists UA yields under different conditions, in which BBD was carried out using three independent variables and three levels. The UA yields ranged from 4.29 mg/g in run 15 (100 mesh, 140 °C, 25 mL/g) to 6.08 mg/g in run 3 (80 mesh, 140 °C, 30 mL/g). With analysis of variance (ANOVA), the second-order polynomial model was applied to calculate the predicted response as follows:
Y = 5.94 − 0.35X1 − 0.12X2 + 0.37X3 + 0.17X1X2 + 0.068X1X3 − 0.008235X2X3 − 0.73X12 − 0.49X22 + 0.072X32.
The negative coefficients for two independent variables (X1, X2) and one interaction between two variables (X2X3) indicated an unfavorable effect on UA yield, while positive coefficients (X3, X1X2, and X1X3) indicated a favorable effect on UA yield. Thus, Equation (3) demonstrated that UA yield was mainly dependent on solvent/solid ratio, followed by particle size and temperature.
The effects of the variables as linear, quadratic and interaction coefficients on the response was tested for significance by analysis of variance (ANOVA), and are shown in Table 2. The statistical significance of the model equations were evaluated by the F-test and p-value. The high F-Value of 230.22 and small p-value suggested that the model was significant. The goodness of fit of regression model was carried out by a determination coefficient (R2) and adjusted determination coefficient (R2adj). The high values of both coefficients (R2 = 0.9553, R2adj = 0.9923) were reasonably close to 1, indicating a high degree of correlation between the experimental and predicted values. Moreover, the model’s goodness-of-fit and suitability were checked by lack of fit. The F-Value and p-value of the lack of fit were 5.76 and 0.0619, respectively, which further validated the model. Therefore, the model could be used for the prediction of extracting UA using subcritical water technology.

Table 2.
Analysis of variance (ANOVA) of the quadratic model and lack of fit.
3.3. Optimization of Subcritical Water Extraction
The main objective of this work is to study SWE of H. diffusa maximizing UA yield in extracts. The F-Value and p-value are used to check the significance of each coefficient. The larger F-Value and smaller p-value indicates greater significance of the coefficient. According to Table 2, it can be seen that the UA yield was significantly influenced by three linear (X1, X2 and X3) and two quadratic (X1X2) parameters, and two interaction (X12, X22) parameters (p < 0.01).
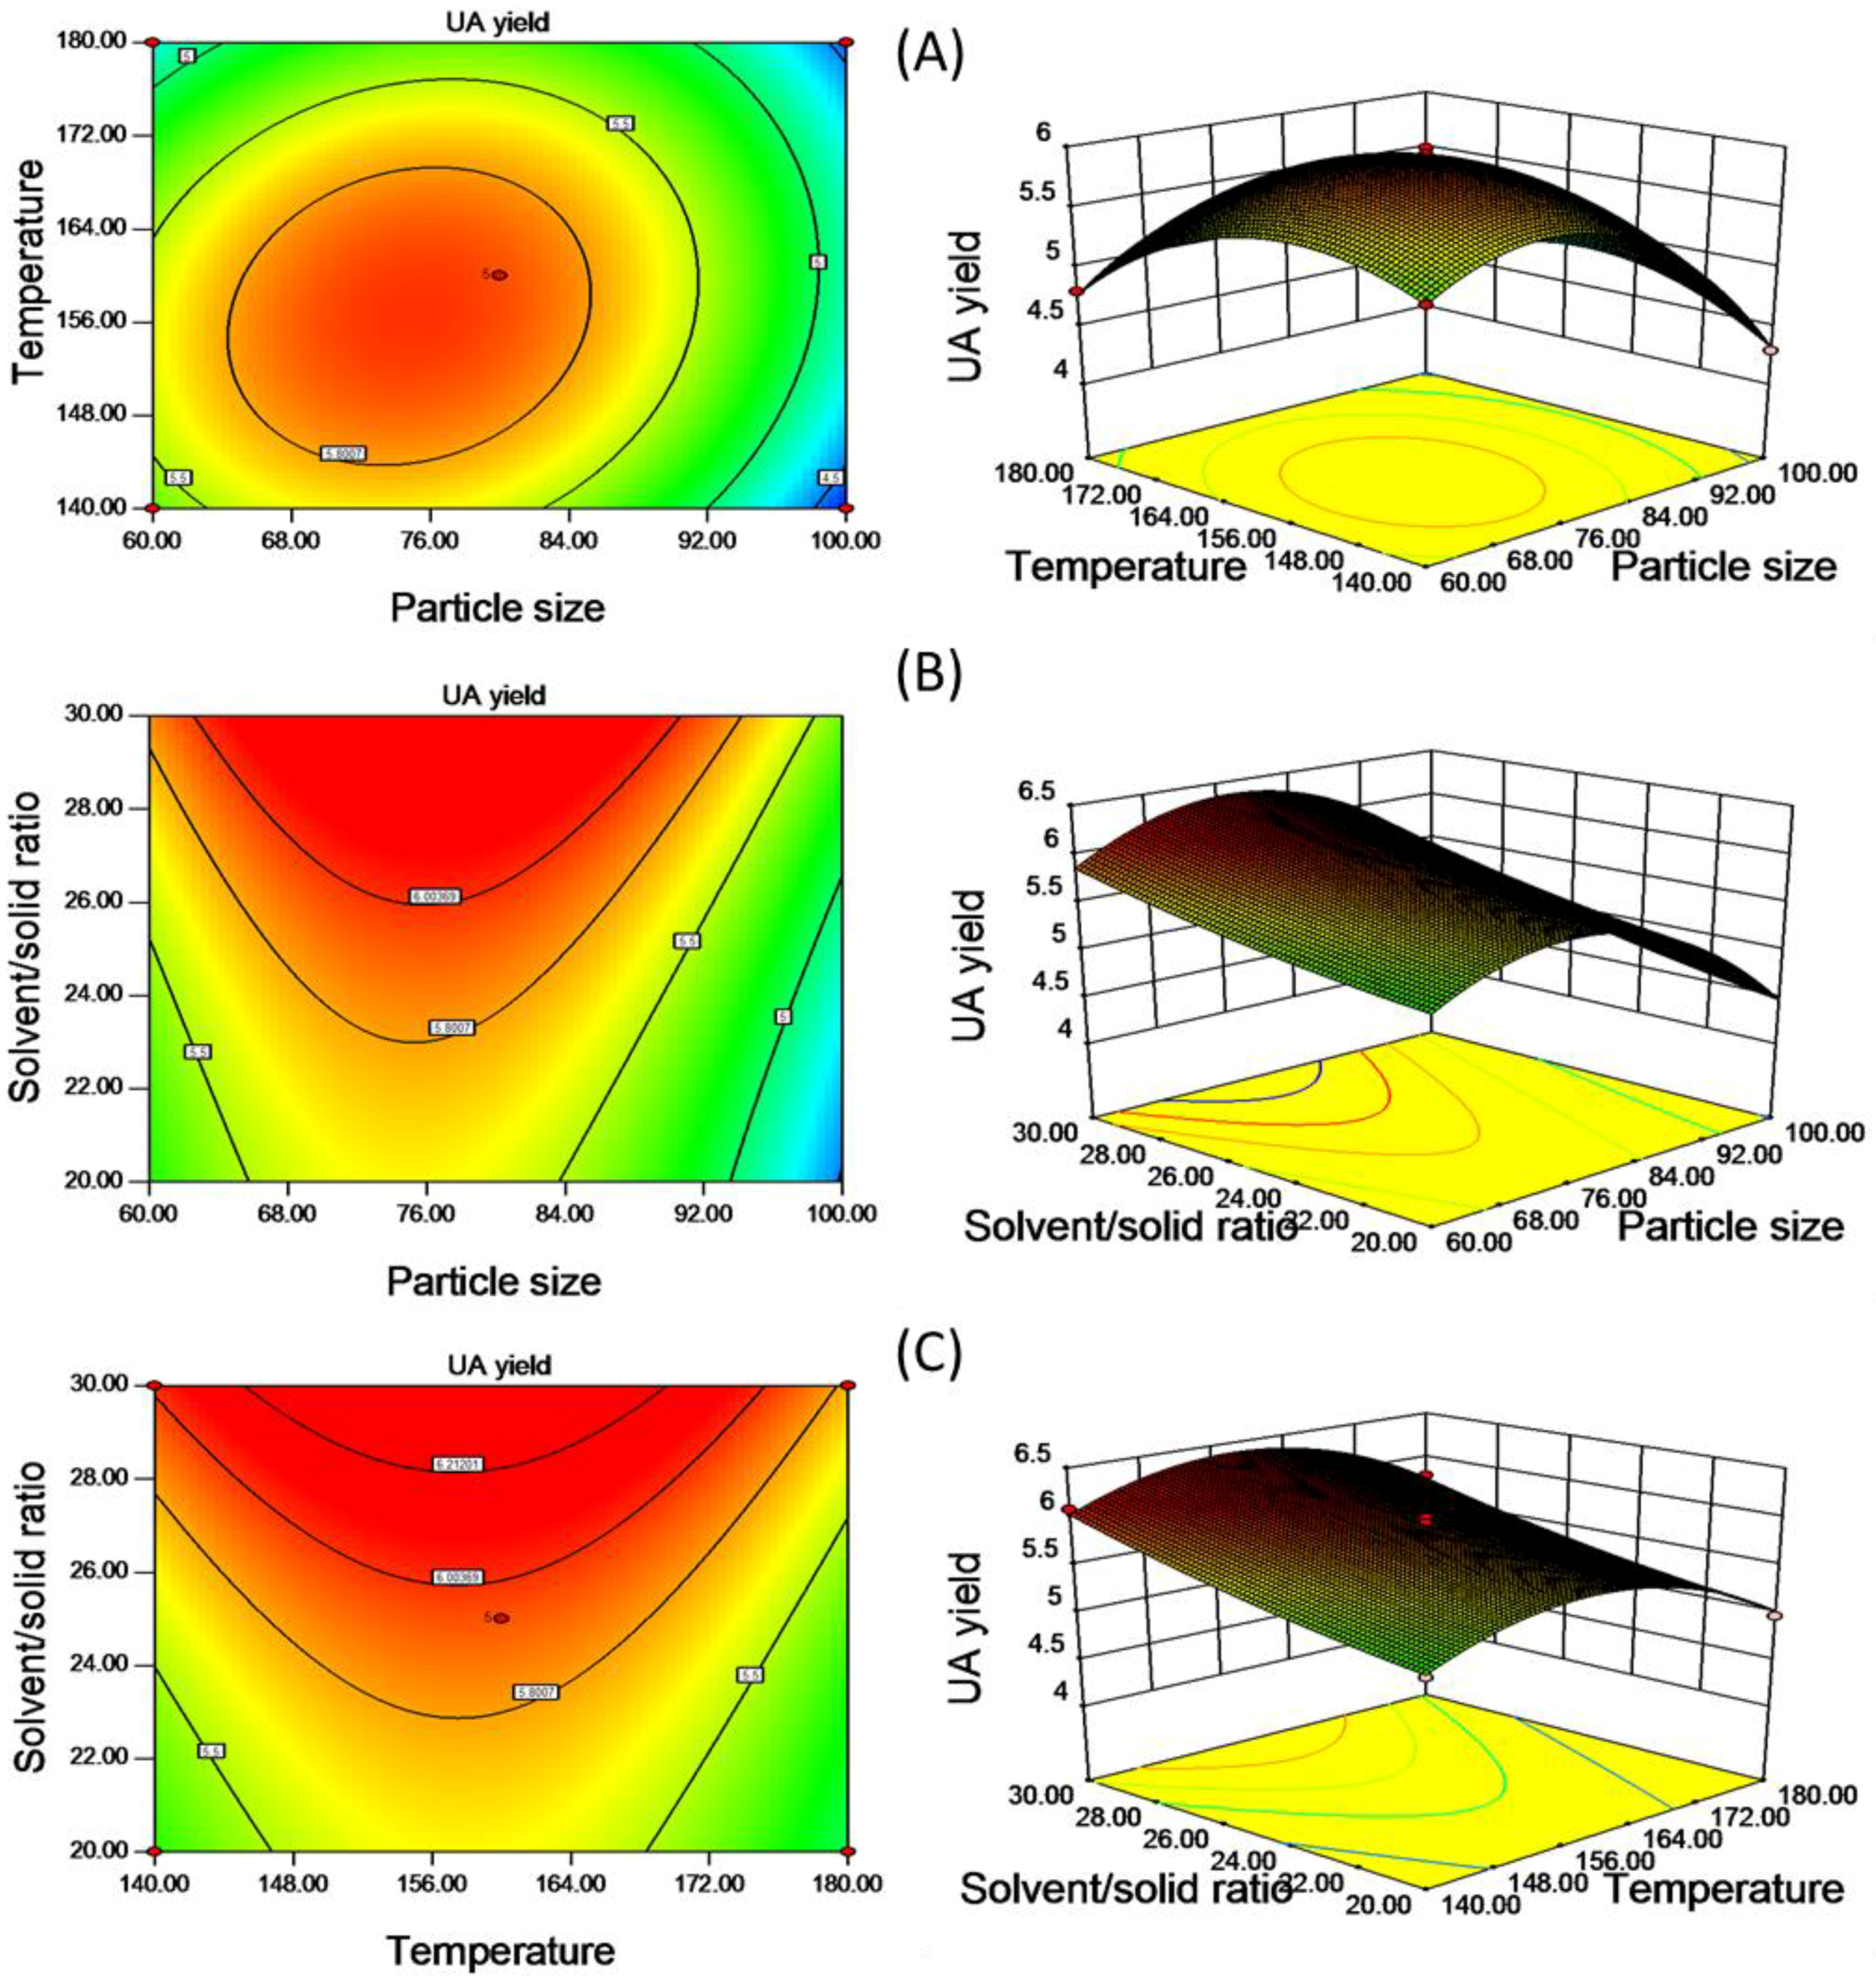
The effects of variables and their interactions on the UA yield were illustrated by the two-dimensional contour plots and the three-dimensional response surface plots. Figure 3 describes regression Equation (3) by means of a graphic approach, which provides a method to visualize the relationships between UA yield and any two independent variables, while the third is fixed at its zero level. The maximum predicted response was located on the peak of the 3D response surface, the corresponding point for which is defined by the smallest ellipse in the contour diagram of the 2D contour plot [35]. Figure 3A is the response surface and contour plot showing the effect of particle size and temperature on the UA yield at the fixed value of solvent/solid ratio. It can be seen that the UA yield increased rapidly with the increase of particle size and temperature and reached a maximum value, followed by a decline, with their further increase. From Figure 3B,C, when particle size and temperature are fixed at level 0, the highest extraction yield was observed with an increase of liquid to material ratio.
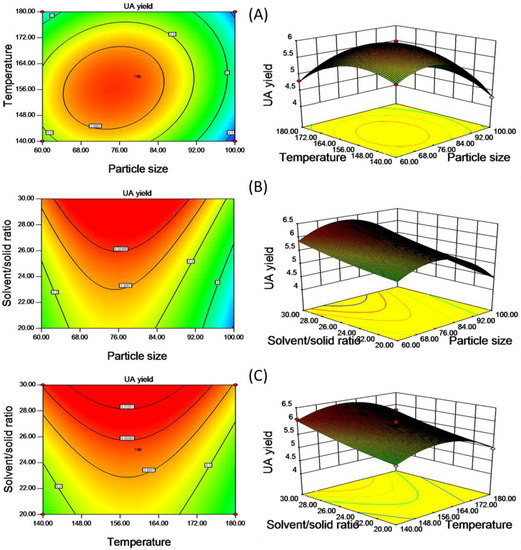
Figure 3.
The 2D contour plots and the 3D response surface plots of UA yield (mg/g material) affected by the varying particle size and temperature (A); the varying particle size and solvent/solid ratio (B); the varying temperature and solvent/solid ratio (C).
The prediction optimization values were calculated using Equation (3). The optimal extraction conditions given by the model were as follows: Particle size of 76 mesh, temperature of 157 °C and solvent/solid of 30 mL/g. Under these conditions, the model gave predicted values of extraction yield being 6.43 mg/g. The validation experiment was performed under the above optimized extraction conditions with modification particle size of 80 mesh, where UA yield reached 6.45 mg/g, slightly higher than the value given by the model. The good correlation between these results confirmed that the response model was suitable for reflecting the expected optimization.
To further understand the nature of fitting, a normal probability plot can be applied to the residuals, which can show the difference between the predicted and experimental values [36]. The normal percentage probability and studentized residual plot are shown in Figure 4A. The data points indicate that neither response transformation was required nor was there any apparent problem with normality [37]. Thus, the analytical hypothesis is affirmed. To ascertain the most satisfactory fit of the developed models, residuals versus experimental runs for analyses of experimental data were made [38], as shown in Figure 4B. It is particularly helpful to determine whether the order of observations influences the results or not [39]. Our results confirm that all data points lay within acceptable limits. Figure 4C shows the relationship between the actual and predicted values of UA yield, whose relationship indicates that the developed model was adequate, due to the small residual and the fact that the residual relates closely to the diagonal line.

Figure 4.
The normal probility plot of residuals (A); plot of internally studentized residuals versus experimental runs (B) and plot of predicted and actual values (C).
3.4. Comparison SWE with Other Extraction Methods
The comparison among different extraction methods has been shown in Table 3. SWE of H. diffusa presented the greatest extraction yield (5.94 ± 0.03a mg/g) followed by UE (5.37 ± 0.26b mg/g), HRE (4.66 ± 0.1c mg/g), MAE (4.45 ± 0.25c mg/g) and ME (3.49 ± 0.2d mg/g) by one-way analysis of variance of the UA yields. UE and MAE have an advantage over SWE in terms of time consumption. However, volatile organic solvent consumption in extraction processes is huge. Furthermore, water in contrast to ethanol as the solvent is cost effective and also superior in terms of flammability and availability. The most important advantages of SWE over traditional extraction methods are shorter extraction time, lower costs of the extracting agent and an environmentally compatible technique because subcritical water at high temperature can modify the dielectric constant of water and accelerate the extraction process. Therefore, it is concluded that SWE is a satisfactory method for extraction of UA from H. diffusa. The moderately high temperature of the SWE process needed to increase the solubility of UA in water may be pinpointed as the only shortcoming of this extraction.

Table 3.
Comparison of extraction methods for their solvent type, solvent consumption, time-consumption and extraction efficiency.
3.5. HPLC and ESI-TOF-MS Analyses
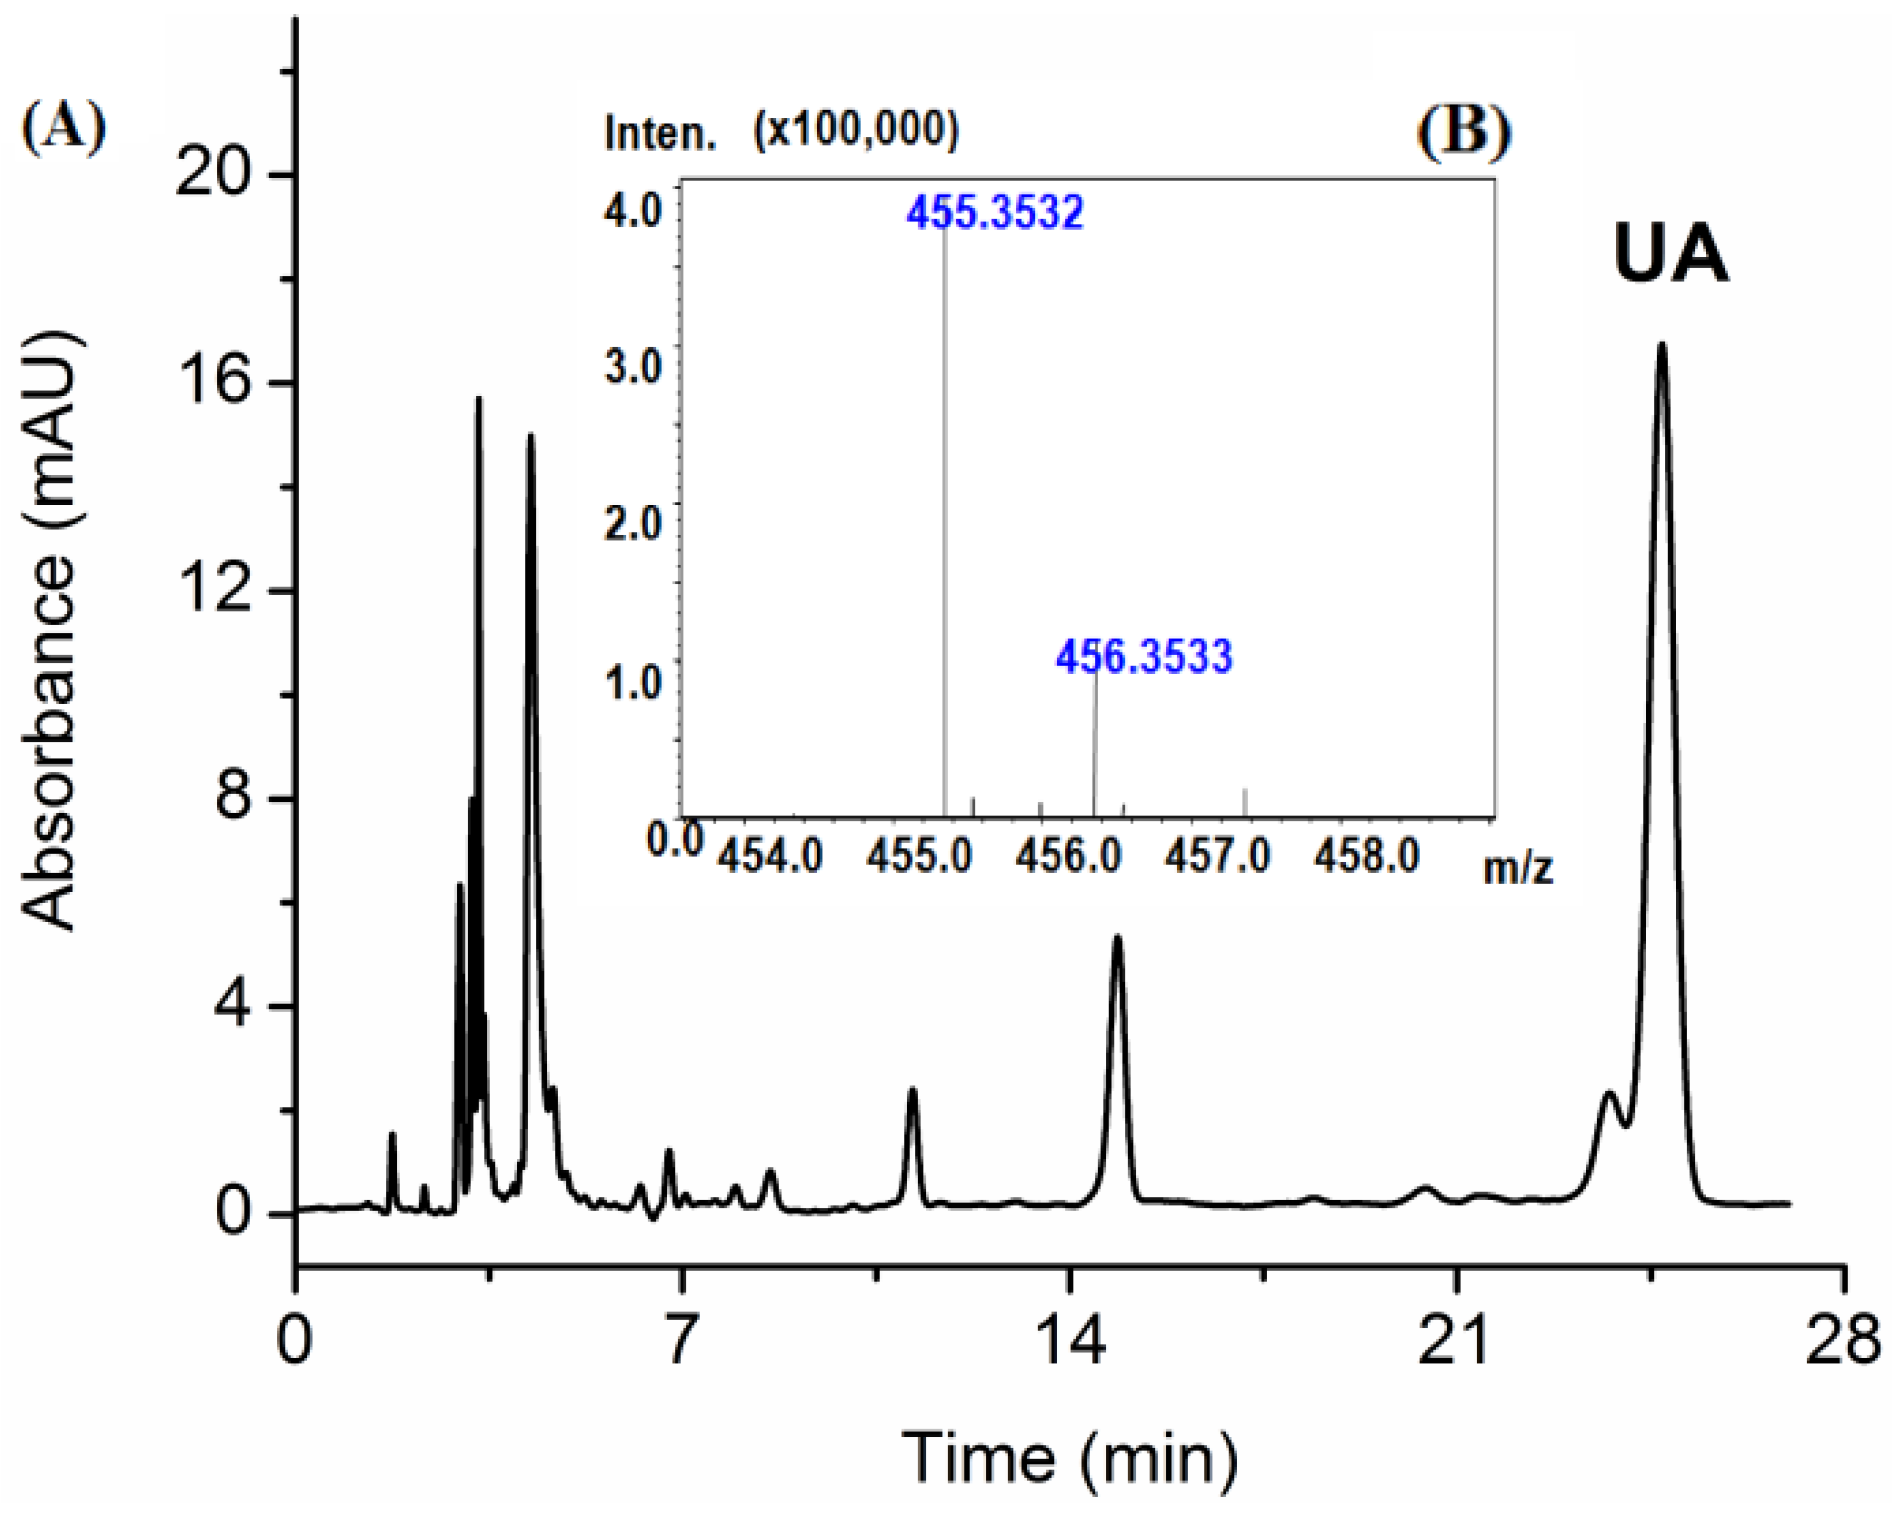
Applying HPLC, the concentrations of UA in extract samples were determined. The standard curve for measuring UA content used was: y = 7224.4x + 23.182 (R2 = 0.9999). In the range of 10–600 μg/mL, the HPLC method revealed a good linear calibration fit. Quantification was achieved by comparing the chromatographic peak areas for the extracted samples with those of reference standards. As showed in Figure 5A, the analysis yielded profiles with a retention time of 24.677 ± 0.04 min for UA. After separation and concentration, the crude extracts were preliminarily purified by using alkalization and acidification, and the result showed that the purity of UA can reach up to 55.56%.
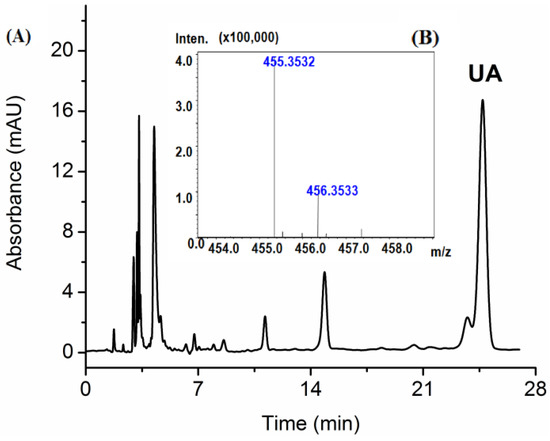
Figure 5.
The high performance liquid chromatography (HPLC) chromatograms of the Hedyotis diffusa extract obtained using subcritical water extraction (A) and mass spectra of ursolic acid (B).
In order to further identify the UA, the purified extract was analyzed using ESI-TOF-MS analysis. Since ursolic acid contains a carboxyl group, the possibility of using positive or negative ionization mode was evaluated [40]. Under selected ESI-TOF-MS conditions, the acquired m/z value was 455.3532 (Figure 5B), which is consistent with the calculated mass for UA [M−H]− C30H48O3 of 455.3631.
4. Conclusions
In this study, an advisable extraction method, SWE was developed to extract UA from H. diffusa. Based on the single factor experiments, RSM was successfully implemented for the optimization of UA yield. The optimum extraction yield of 6.45 mg/g was obtained at a particle size of 80 mesh, extraction temperature of 157 °C, and solvent/solid ratio of 30 mL/g. The experimental model revealed that UA yield was mainly dependent on solvent/solid ratio. Moreover, the results indicated that SWE process conditions do not require a high pressure to obtain optimum UA extraction yield.
Compared to other extraction methods (maceration extraction, heat reflux extraction, ultrasonic extraction and microwave-assisted), the SWE method has received many advantages such as an environmental-friendly process, a reduction in time, the lowering of cost consumption and low impurity extracts without consumption of organic solvents. The proposed method has broad application prospects in the extraction of triterpenoids from plants.
Supplementary Materials
The following are available online at www.mdpi.com/2076-3417/7/2/187/s1.
Acknowledgments
The authors wish to thank the State Forestry Administration 948 Project of China (No. 2014-4-35), the Fundamental Research Funds for the Central Universities (No. BLX2013006), the Beijing Natural Science Foundation of China (Grant No. 2142024), the National Natural Science Foundation of China (No. 21576029; 21406013), and the Chinese Central Level Public Welfare Scientific Research Institutes Foundation for Basic Research and Development (562016Y-4492; 562016Y-4687) for the support of this study.
Author Contributions
Jiandu Lei and Jing Liu proposed the idea for this research work; Shangzhen Xiao designed and performed the experiments; Xingjun Xi, Fei Tang, Juan Dai and Luying Wang contributed to analyzing the data; and Shangzhen Xiao wrote the paper. All authors have read and approved the final manuscript.
Conflicts of Interest
The authors declare no conflict of interest.
References
- Dong, Q.; Ling, B.; Gao, B.; Maley, J.; Sammynaiken, R.; Yang, J. Hedyotis diffusa water extract diminished the cytotoxic effects of chemotherapy drugs against human breast cancer MCF7 cells. Nat. Prod. Commun. 2014, 9, 699–700. [Google Scholar] [PubMed]
- Xu, G.H.; Kim, Y.H.; Chi, S.W.; Choo, S.J.; Ryoo, I.J.; Ahn, J.S.; Yoo, I.D. Evaluation of human neutrophil elastase inhibitory effect of iridoid glycosides from Hedyotis diffusa. Bioorg. Med. Chem. Lett. 2010, 20, 513–515. [Google Scholar] [CrossRef] [PubMed]
- Kim, J. Neuroprotective constituents from Hedyotis diffusa. J. Nat. Prod. 2001, 64, 75–78. [Google Scholar] [CrossRef] [PubMed]
- Bishayee, A.; Ahmed, S.; Brankov, N.; Perloff, M. Triterpenoids as potential agents for the chemoprevention and therapy of breast cancer. Front Biosci. 2011, 16, 980–996. [Google Scholar] [CrossRef]
- Yan, S.L.; Huang, C.Y.; Wu, S.T.; Yin, M.C. Oleanolic acid and ursolic acid induce apoptosis in four human liver cancer cell lines. Toxicol. In Vitro 2010, 24, 842–848. [Google Scholar] [CrossRef] [PubMed]
- Zhang, Y.; Kong, C.; Wang, H.; Wang, L.; Xu, C.; Sun, Y. Phosphorylation of Bcl-2 and activation of caspase-3 via the c-jun N-terminal kinase pathway in ursolic acid-induced DU145 cells apoptosis. Biochimie 2009, 91, 1173–1179. [Google Scholar] [CrossRef] [PubMed]
- Kashyap, D.; Tuli, H.S.; Sharma, A.K. Ursolic acid (UA): A metabolite with promising therapeutic potential. Life Sci. 2016, 146, 201–213. [Google Scholar] [CrossRef] [PubMed]
- Huang, T.; Wu, P.; Cheng, A.; Qin, J.; Zhang, K.; Zhao, S. A hydrophilic conjugate approach toward the design and synthesis of ursolic acid derivatives as potential antidiabetic agent. RSC Adv. 2015, 5, 44234–44246. [Google Scholar] [CrossRef]
- Wójciak-Kosior, M.; Sowa, I.; Kocjan, R.; Nowak, R. Effect of different extraction techniques on quantification of oleanolic and ursolic acid in Lamii albi flos. Ind. Crops Prod. 2013, 44, 373–377. [Google Scholar] [CrossRef]
- Fu, Q.; Zhang, L.; Cheng, N.; Jia, M.; Zhang, Y. Extraction optimization of oleanolic and ursolic acids from pomegranate (Punica granatum L.) flowers. Food Bioprod. Process. 2014, 92, 321–327. [Google Scholar] [CrossRef]
- Bernatoniene, J.; Cizauskaite, U.; Ivanauskas, L.; Jakstas, V.; Kalveniene, Z.; Kopustinskiene, D.M. Novel approaches to optimize extraction processes of ursolic, oleanolic and rosmarinic acids from rosmarinus officinalis leaves. Ind. Crops Prod. 2016, 84, 72–79. [Google Scholar] [CrossRef]
- Vetal, M.D.; Lade, V.G.; Rathod, V.K. Extraction of ursolic acid from ocimum sanctum leaves: Kinetics and modeling. Food Bioprod. Process. 2012, 90, 793–798. [Google Scholar] [CrossRef]
- Domingues, R.M.A.; Sousa, G.D.A.; Silva, C.M.; Freire, C.S.R.; Silvestre, A.J.D.; Neto, C.P. High value triterpenic compounds from the outer barks of several eucalyptus species cultivated in Brazil and in Portugal. Ind. Crops Prod. 2011, 33, 158–164. [Google Scholar] [CrossRef]
- Banerjee, A.; Sane, R.T.; Mangaonkar, K.; Shailajan, S.; Deshpande, A.; Gundi, G. Quantitation of oleanolic acid in Oldenlandia corymbosa L. Whole-plant powder by high-performance thin-layer chromatography. JPC J. Planar Chromatogr. Mod. TLC 2006, 19, 68–72. [Google Scholar] [CrossRef]
- Baranauskaitė, J.; Jakštas, V.; Ivanauskas, L.; Kopustinskienė, D.M.; Drakšienė, G.; Masteikova, R.; Bernatonienė, J. Optimization of carvacrol, rosmarinic, oleanolic and ursolic acid extraction from oregano herbs (Origanum onites L., Origanum vulgare spp. Hirtum and Origanum vulgare L.). Nat. Prod. Res. 2015, 30, 1–3. [Google Scholar]
- Wu, H.; Li, G.; Liu, S.; Di, L.; Chen, G.; Na, H.; Suo, Y.; You, J. Simultaneous determination of six triterpenic acids in some chinese medicinal herbs using ultrasound-assisted dispersive liquid–liquid microextraction and high-performance liquid chromatography with fluorescence detection. J. Pharm. Biomed. Anal. 2014, 107, 98–107. [Google Scholar] [CrossRef] [PubMed]
- Teo, C.C.; Tan, S.N.; Yong, J.W.H.; Hew, C.S.; Ong, E.S. Pressurized hot water extraction (PHWE). J. Chromatogr. A 2010, 1217, 2484–2494. [Google Scholar] [CrossRef] [PubMed]
- Kanmaz, E.Ö. Subcritical water extraction of phenolic compounds from flaxseed meal sticks using accelerated solvent extractor (ASE). Eur. Food Res. Technol. 2014, 238, 85–91. [Google Scholar] [CrossRef]
- Xu, H.; Wang, W.; Jiang, J.; Fang, Y.; Gao, Y. Subcritical water extraction and antioxidant activity evaluation with on-line HPLC-ABTS + assay of phenolic compounds from marigold (Tagetes erecta L.) flower residues. J. Food Sci. Technol. 2015, 52, 3803–3811. [Google Scholar] [CrossRef] [PubMed]
- Reddy, H.K.; Muppaneni, T.; Sun, Y.; Li, Y.; Ponnusamy, S.; Patil, P.D.; Dailey, P.; Schaub, T.; Holguin, F.O.; Dungan, B. Subcritical water extraction of lipids from wet algae for biodiesel production. Fuel 2014, 133, 73–81. [Google Scholar] [CrossRef]
- Yang, L.; Qu, H.; Mao, G.; Zhao, T.; Li, F.; Zhu, B.; Zhang, B.; Wu, X. Optimization of subcritical water extraction of polysaccharides from Grifola frondosa using response surface methodology. Pharmacogn. Mag. 2013, 9, 120–129. [Google Scholar] [PubMed]
- Ndlela, S.C.; Moura, J.M.L.N.D.; Olson, N.K.; Johnson, L.A. Aqueous extraction of oil and protein from soybeans with subcritical water. J. Am. Oil Chem. Soc. 2012, 89, 1145–1153. [Google Scholar] [CrossRef]
- Sereewatthanawut, I.; Prapintip, S.; Watchiraruji, K.; Goto, M.; Sasaki, M.; Shotipruk, A. Extraction of protein and amino acids from deoiled rice bran by subcritical water hydrolysis. Bioresour. Technol. 2008, 99, 555–561. [Google Scholar] [CrossRef] [PubMed]
- Chen, C.S.; Chen, J.J.; Wu, T.P.; Chang, C.Y. Optimising the frying temperature of gluten balls using response surface methodology. J. Sci. Food Agric. 1998, 77, 64–70. [Google Scholar] [CrossRef]
- Tao, F.; Hu, J.; Fu, L.; Zhang, L. Optimization of enzymolysis-ultrasonic assisted extraction of polysaccharides from Momordica charabtia L. By response surface methodology. Carbohydr. Polym. 2015, 115, 701–706. [Google Scholar]
- Wang, J.; Wang, H.P.; Wang, X.; Cui, H.; Lu, F. Statistical analysis of process parameters to eliminate hot cracking of fiber laser welded aluminum alloy. Opt. Laser Technol. 2015, 66, 15–21. [Google Scholar] [CrossRef]
- Yang, Y.C.; Wei, M.C.; Huang, T.C.; Lee, S.Z.; Lin, S.S. Comparison of modified ultrasound-assisted and traditional extraction methods for the extraction of baicalin and baicalein from Radix scutellariae. Ind. Crops Prod. 2013, 45, 182–190. [Google Scholar] [CrossRef]
- Thiruvenkadam, S.; Izhar, S.; Yoshida, H.; Danquah, M.K.; Harun, R. Process application of subcritical water extraction (SWE) for algal bio-products and biofuels production. Appl. Energy 2015, 154, 815–828. [Google Scholar] [CrossRef]
- Plaza, M.; Santoyo, S.; Jaime, L.; Avalo, B.; Cifuentes, A.; Reglero, G.; Reina, G.B.; Señoráns, F.J.; Ibáñez, E. Comprehensive characterization of the functional activities of pressurized liquid and ultrasound-assisted extracts from Chlorella vulgaris. LWT Food Sci. Technol. 2012, 46, 245–253. [Google Scholar] [CrossRef]
- Yim, H.S.; Chye, F.Y.; Koo, S.M.; Matanjun, P.; How, S.E.; Ho, C.W. Optimization of extraction time and temperature for antioxidant activity of edible wild mushroom, Pleurotus porrigens. Food Bioprod. Process. 2012, 90, 235–242. [Google Scholar] [CrossRef]
- Rangsriwong, P.; Rangkadilok, N.; Satayavivad, J.; Goto, M.; Shotipruk, A. Subcritical water extraction of polyphenolic compounds from Terminalia chebula Retz. fruits. Sep. Purif. Technol. 2009, 66, 51–56. [Google Scholar] [CrossRef]
- Cacace, J.E.; Mazza, G. Mass transfer process during extraction of phenolic compounds from milled berries. J. Food Eng. 2003, 59, 379–389. [Google Scholar] [CrossRef]
- Zhang, S.Q.; Bi, H.M.; Liu, C.J. Extraction of bio-active components from Rhodiola sachalinensis under ultrahigh hydrostatic pressure. Sep. Purif. Technol. 2007, 57, 277–282. [Google Scholar] [CrossRef]
- Herodež, Š.S.; Hadolin, M.; Škerget, M.; Knez, Ž. Solvent extraction study of antioxidants from balm (Melissa officinalis L.) leaves. Food Chem. 2003, 80, 275–282. [Google Scholar] [CrossRef]
- Li, G.; Zhang, X.; You, J.; Song, C.; Sun, Z.; Lian, X.; Suo, Y. Highly sensitive and selective pre-column derivatization high-performance liquid chromatography approach for rapid determination of triterpenes oleanolic and ursolic acids and application to Swertia species: Optimization of triterpenic acids extraction and pre-column derivatization using response surface methodology. Anal. Chim. Acta 2011, 688, 208–218. [Google Scholar] [PubMed]
- Gu, T.; Chen, Z.; Jiang, X.; Zhou, L.; Liao, Y.; Duan, M.; Wang, H.; Pu, Q. Synthesis and inhibition of N-alkyl-2-(4-hydroxybut-2-ynyl) pyridinium bromide for mild steel in acid solution: Box–behnken design optimization and mechanism probe. Corros. Sci. 2014, 90, 118–132. [Google Scholar] [CrossRef]
- Kirmizakis, P.; Tsamoutsoglou, C.; Kayan, B.; Kalderis, D. Subcritical water treatment of landfill leachate: Application of response surface methodology. J. Environ. Manag. 2014, 146, 9–15. [Google Scholar] [CrossRef] [PubMed]
- Xu, Y.; Zhang, L.; Yang, Y.; Song, X.; Yu, Z. Optimization of ultrasound-assisted compound enzymatic extraction and characterization of polysaccharides from blackcurrant. Carbohydr. Polym. 2015, 117, 895–902. [Google Scholar] [CrossRef] [PubMed]
- Vora, C.; Patadia, R.; Mittal, K.; Mashru, R. Risk based approach for design and optimization of stomach specific delivery of rifampicin. Int. J. Pharm. 2013, 455, 169–181. [Google Scholar] [CrossRef] [PubMed]
- Liao, Q.; Yang, W.; Jia, Y.; Chen, X.; Gao, Q.; Bi, K. LC-MS determination and pharmacokinetic studies of ursolic acid in rat plasma after administration of the traditional chinese medicinal preparation Lu-Ying extract. Yakugaku Zasshi 2005, 125, 509–515. [Google Scholar] [CrossRef] [PubMed]
© 2017 by the authors. Licensee MDPI, Basel, Switzerland. This article is an open access article distributed under the terms and conditions of the Creative Commons Attribution (CC BY) license ( http://creativecommons.org/licenses/by/4.0/).

