1. Introduction
Myocardial infarction (MI), commonly known as a heart attack, is caused by an interruption of the blood supply to a part of the heart with cardiovascular disorder [
1]. If left untreated, the ischemia or resulting restriction in the blood supply may cause damage to the myocardium or cardiomyocyte apoptosis, thus leading to heart failure. According to the latest statistics from the American Heart Association [
2], MI and other cardiovascular diseases are the leading causes of death worldwide.
The heart is primarily composed of the myocardium and coronary arteries. Supplied with oxygen- and nutrient-rich blood through the coronary arteries, the myocardium continuously contracts and relaxes, to pump blood throughout the body. The myocardium has an extremely limited regeneration potential [
3,
4], and so, after MI, the ischemic myocardium ceases to function properly, due to the loss or death of cardiomyocytes, i.e., the cells of which it is comprised.
Cardiomyoplasty is a therapy used in MI repair, in which cardiomyoblasts or other types of stem cells are directly injected into the injured heart, serving as renewable cellular sources which aid in the repair of the damaged myocardium [
5,
6]. To compensate for damaged or dead cardiomyocytes in the MI area, the transplantation of various types of stem cells or exogenous cardiomyocytes has been studied. Among them, cardiomyocytes [
7,
8], embryonic stem cells [
9,
10], and bone marrow-derived mesenchymal stem cells [
11] have been investigated, but the ideal cell type for MI repair is far from certain [
12]. Muscle-derived stem cells (MDSCs) are a promising type of cell for MI repair because they have the ability to trans-differentiate into cardiomyocytes when co-cultured with cardiomyocytes [
13], resist oxidative stress-induced apoptosis [
14], reduce scar formation [
14,
15], and improve cardiac function [
16,
17] after transplantation.
Although cardiomyoplasty is promising for MI repair, low cell viability after transplantation, and then gradually decreasing cell survival after long-term cultivation, are issues that remain to be addressed. Encapsulating the cells to be transplanted into MI hearts in synthesized hydrogels may be an effective way to improve the cell survival rate.
Scaffolds or engineered constructs are important for tissue engineering [
18], especially those with bioactive growth factors as a delivery system, which are of great importance for cardiovascular tissue engineering [
19]. The co-release of growth factors of VEGF (vascular endothelial growth factor), bFGF (basic fibroblast growth factor), and PDGF (platelet derived growth factor) from engineered constructs for cardiac repair after MI is promising [
20], but many conditions, such as the release rate, need to be regulated.
Hydrogels are cross-linked networks of polymers, such as fibrin and alginate, with a high water content between polymer chains [
21,
22]. When used for cell encapsulation, hydrogels provide a hydrated tissue-like environment for cell attachment and protection, thereby improving cell viability. Hydrogels can provide biochemical cues and structural support, along with the possible recruitment of endogenous stem cells [
23]. Cellular growth and functions are critically affected by both the cell compatibility of materials [
24], and the pore sizes in the hydrogel structure [
25], which lead to varying cell viabilities. Combining injectable microspheres with a hydrogel is an alternative approach [
26]; however, research into cell therapies integrating microspheres and hydrogels has been limited [
27].
Among various injectable hydrogels, alginate cross-linked in the presence of calcium ions has been drawing considerable attention for use in MI repair and can lead to enhanced cell viability and proliferation, as well as an improved contractile function [
28,
29]. Alginate, a biodegradable and biocompatible polysaccharide commonly found in algae, was employed in this study, due to its successful use as a hydrogel for tissue engineering [
30,
31]. However, one inherent disadvantage of alginate is the lack of cell-surface receptors for cell attachment, resulting from the negatively charged polymer. Considering this, we also used gelatin to encourage cell adhesion, as it is the main component of the extracellular matrix (ECM) and can promote cell attachment and migration [
32,
33].
This research mainly focuses on optimizing (i) cell viability during the injection process and (ii) the live/dead cell ratio after a period of cultivation by optimizing the composition of alginate hydrogels encapsulating living MDSCs for potential MI repair.
2. Materials and Methods
The preparation of materials for the experiments presented in this paper was carried out according to protocols approved by the University of Saskatchewan Ethics and Integrity in Animal Research Committee (Saskatoon, Canada) and the Harbin Institute of Technology’s Animal Care (Harbin, China) and Use Committee.
2.1. Gelatin Extraction from Rat Tails
The gelatin used as a component of both hydrogels was obtained from the tails of Sprague Dawley (SD) rats, following the same procedure as was presented in our previous work [
34]. Briefly, three male SD rats (400 g) were anaesthetized and collagen from their tails was extracted stick-by-stick, via forceps. The collagen was dissolved in 0.5% glacial acetic acid (50 mL) at 4 °C for 72 h. Then, the mixture (solution) of collagen and glacial acetic acid was sterilized by membrane filtration (0.28 μm) and finally freeze-dried to form a powder.
The concentration of gelatin in this study was determined by measuring the mass/volume ratio of the mass of collagen that dissolved completely in the glacial acetic acid, to the volume of the solution. The gelatin powder was dissolved in sterile phosphate buffer solution (PBS) to a concentration of 40%, for synthesizing the hydrogels in this study.
2.2. Cell Cultivation
Using the same technique employed for 3D cell cultivation as in our previous work [
29], MDSCs were cultured in the two types of hydrogels described in
Section 2.3 and
Section 2.4. Briefly, MDSCs were mixed evenly with alginate and then cross-linked with gelatin to form hydrogels. After the crosslinking process, the cells were encapsulated in the hydrogels and then were cultured in Dulbecco’s Modified Eagle Medium (DMEM, 10% horse serum added), which was refreshed daily.
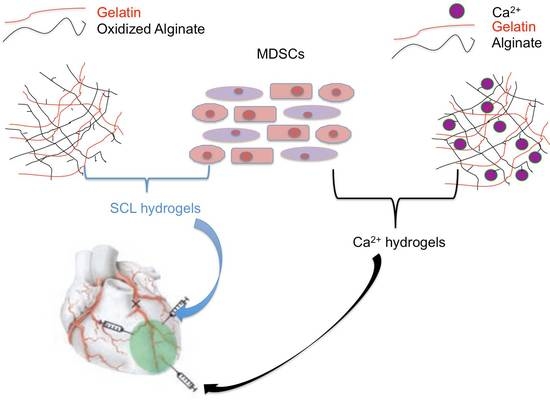
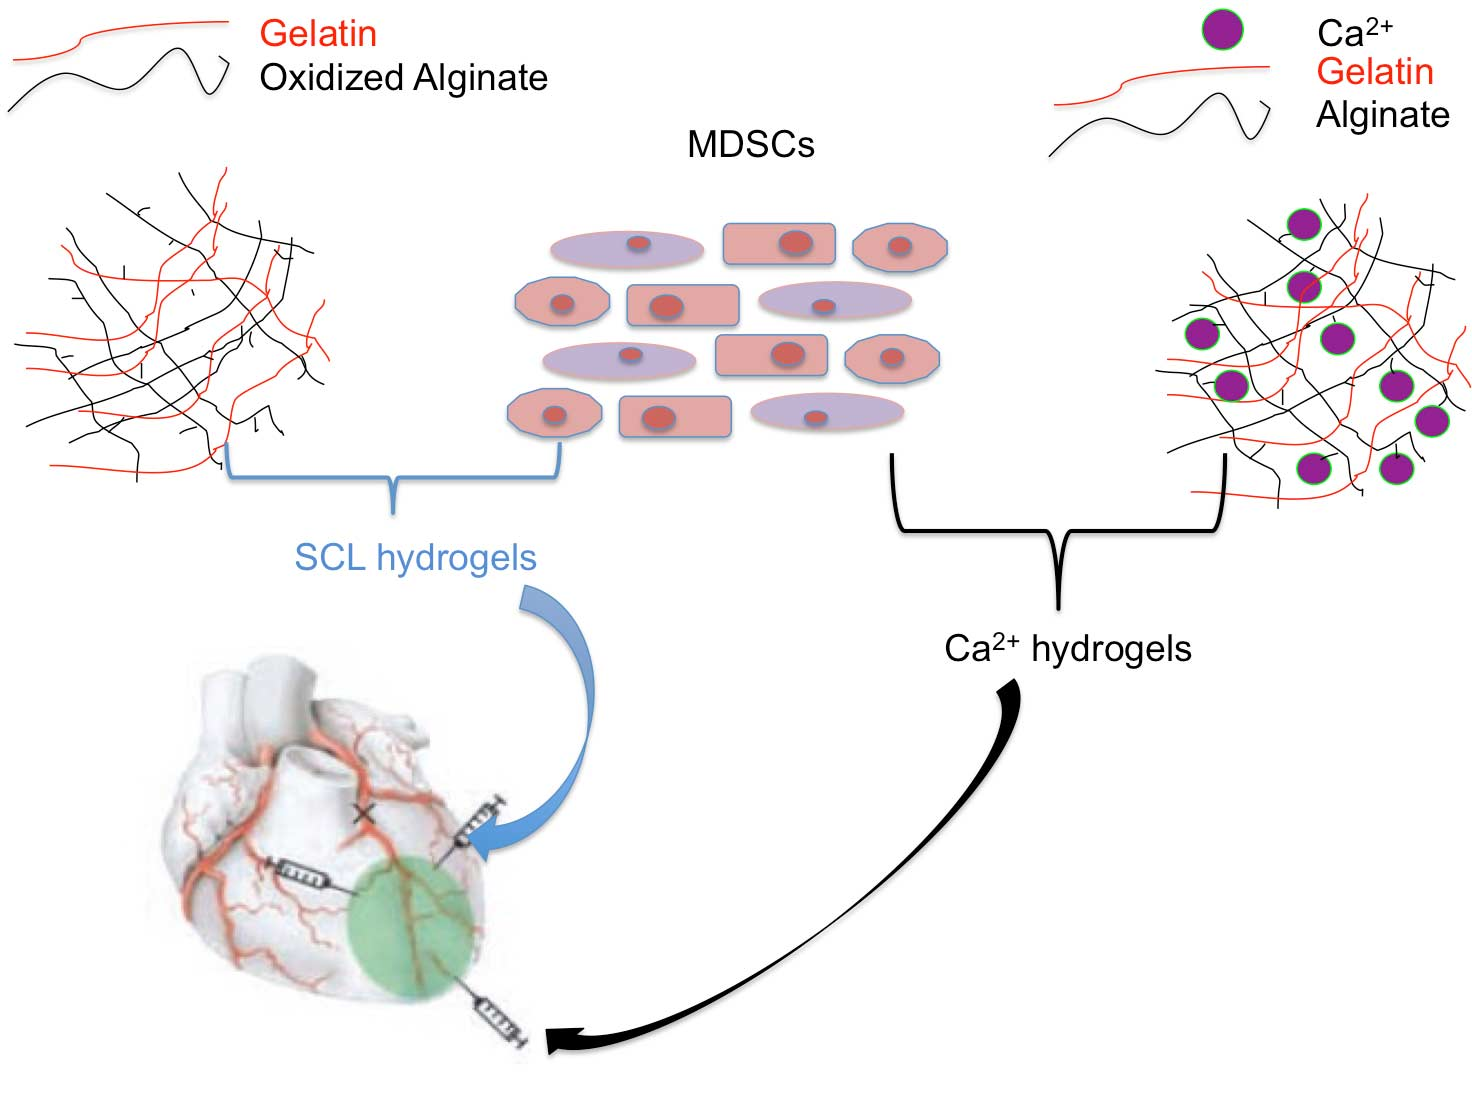
2.3. SCL Hydrogel Synthesis
SCL hydrogels were synthesized with partially oxidized sodium alginate cross-linking with gelatin, following our previously published procedures [
35]. Four hydrogel formulations, namely SCL 0.8%, SCL 1.1%, SCL 1.5%, and SCL 2%, based on their respective sodium alginate concentrations, comprised four experimental groups.
For each experimental group, sodium alginate (low viscosity, Sigma, St. Louis, MO, USA) was oxidized by sodium periodate at a concentration ratio of 2:1 for 8 h at 4 °C in the dark. The oxidation degree was measured via the mass of the remaining sodium peroxide. Briefly the oxidization process was described as following: Sodium chloride (0.5 g) and 100% ethanol (10 mL) were added to the oxidized alginate solutions, until sediments formed. The sediments were then dissolved in deionized water (10 mL) and dialyzed for 72 h with a semipermeable membrane (40 KDa, Sigma) at 4 °C; thereafter, they were freeze dried into powder and dissolved in sterile PBS to a concentration of 60%, and were then mixed with MDSCs to a density of 0.5 × 10⁵/mL. Sodium alginate solutions containing MDSCs were mixed with gelatin at a 1:1 volume ratio and then printed through a 0.26 mm needle into hydrogels (beads). These hydrogel-encapsulated cells were cultured in DMEM (refreshed daily) in a cell culture incubator for two months.
2.4. Ca2+ Hydrogel Synthesis
Ca2+ hydrogels were synthesized via the physical crosslinking between calcium ions and alginate, that is based on the attraction between positive and negative charges. Four hydrogel formulations, namely Ca2+ 0.8%, Ca2+ 1.1%, Ca2+ 1.5%, and Ca2+ 2%, based on their respective concentrations of alginate, were prepared and represented four experimental groups.
For each experimental group, MDSCs (0.5 × 10
5/mL) were mixed with sodium alginate solution and then with gelatin, at a 1:1 volume ratio. The mixture was dispensed through a 0.26 mm needle into 100 mM calcium chloride solution (1% tween-20 added), in a tissue culture dish. Hydrogels (beads) encapsulating cells were formed at the moment the mixture entered the calcium chloride solution. The calcium chloride was then removed and the hydrogels were quickly rinsed with PBS. Cells were then cultured in the same environment as outlined in
Section 2.3, for two months.
2.5. SEM Examination of Hydrogel Morphology
The structure of the hydrogel-encapsulated MDSCs for each experimental group was examined via scanning electron microscopy (SEM, Quanta 200, FEI, Hillsboro, OR, USA). First, the hydrogels were fixed in a solution containing 2% glutaraldehyde and 3% formaldehyde in cacodylate buffer (0.1 M cacodylate, 0.09 M sucrose, 0.01 M MgCl2, and 0.01 M MgCl2, pH 6.9), for 1 h. They were then dehydrated with a graded series of acetone (10%, 30%, 50%, 70%, 90%, and 100%) on ice, with each lasting 15 min, followed by critical point drying with liquid CO2. Last, the hydrogels were each cut into two hemispheres and attached to a conductive adhesive, then sputter coated with a gold film to a thickness of 10 nm for observation via SEM (Quanta 200, FEI, Hillsboro, OR, USA).
2.6. Mechanical Strength Measurement
The mechanical strength of both types of hydrogels was analyzed via rheometry, conducted at a sweeping frequency ranging from 0.1 to 10 Hz. Hydrogels of a larger size were synthesized with the same technique described in
Section 2.3 and
Section 2.4, via a pipette (1000 μL) in a six-well culture dish. The hydrogels can form a lamella that fills up one whole well of the dish. Lamellas formed from each group were examined on a rheometer (Bohlin Gemini 2000, Malvern, UK), with a CP40 cone.
2.7. Hydrogel Degradation
Hydrogels were synthesized with an original weight of 0.8 g (SCL hydrogels) and 0.5 g (Ca2+ hydrogels) in each group (n = 6), and were then exposed to 0.5% collagenase type II (5 mL) at body temperature, for 48 h. The hydrogels were then freeze-dried into powder for the weight measurement. This process was repeated until all of the hydrogels had degraded (i.e., disappeared completely).
2.8. MTT Assay for Cell Proliferation
The MDSCs encapsulated in all groups of both types of hydrogels were released by dissolution in 3% sodium citrate, after 2 h, 24 h, and two months of cell cultivation. Then, the survival rate of these cells was measured by a MTT assay with the cell proliferation kit I (Sigma), immediately after the cells were released from the hydrogels. Briefly, cells from each group were coated with MTT (3-(4,5-dimethylthiazol-2-yl)-2,5-diphenyltetrazolium bromide staining) for 4 h in 96-well culture dish plates, until sediments formed; the control group was DMEM coated with MTT. The three same wells for used for each group and each test was repeated six times. Then, with MTT dissolvent was kept for another 4 h in the cell culture incubator. The optical density (OD) of the resulting solution was determining using an ultraviolet spectrophotometer.
2.9. Immunofluorescence for Live/Dead Cells
MDSCs were released from the hydrogels of each experimental group via the method described in
Section 2.8, after 2 h, 24 h, and two months of cultivation. They were then stained with calcein (green) for 20 min and PI (red) for 5 min, to label live and dead cells, respectively. MDSCs were also stained with DAPI, to mark the cell nuclei. The immunofluorescence in each layer of the hydrogels was examined using confocal microscopy (FV3000, Olympus, Tokyo, Japan).
3. Results and Discussion
3.1. Morphology
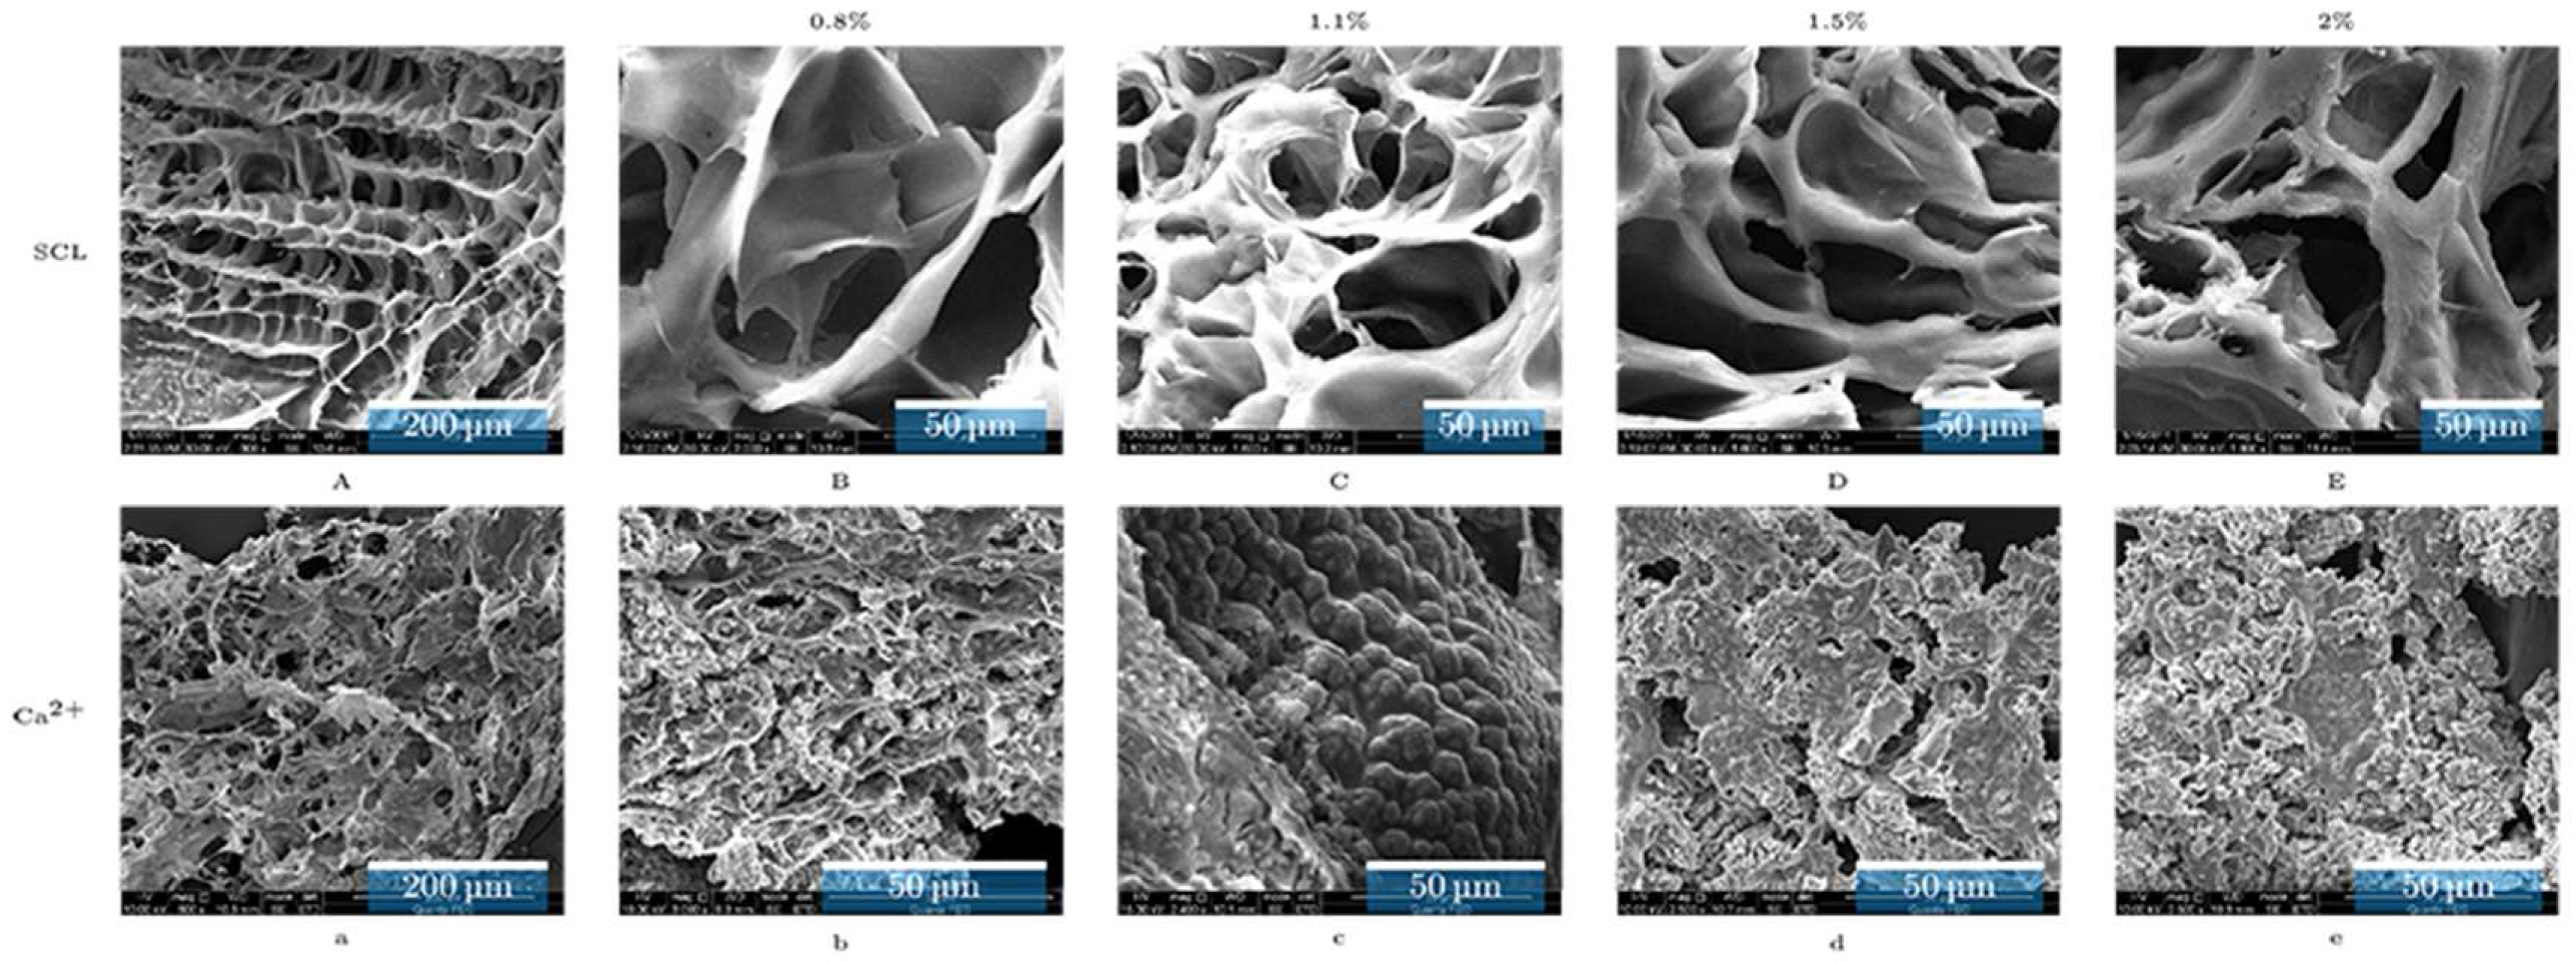
The morphology via SEM is shown in
Figure 1, illustrating the texture and inner structure of the SCL and Ca
2+ hydrogels of all groups. Specifically, it shows the morphology of hydrogels without cells: 1A for the SCL hydrogel and 1a for the Ca
2+ hydrogel; and the morphology of hydrogels with cells: 1B, 1C, 1D, and 1E SCL hydrogels, and 1b, 1c, 1d, and 1e for Ca
2+ hydrogels, where the alginate concentrations are 0.8%, 1.1%, 1.5%, and 2%, respectively.
The SEM images show no major differences in the inner structure of both SCL hydrogels and Ca2+ hydrogels, but reveal minor differences between the two types of hydrogels in terms of pore size and degree of compactness. Specifically, when studying the software image J, for the SCL and Ca2+ hydrogels, the average areas of pore size were found to be 124 µm2 and 7.1 µm2, respectively, which indicates that the pore size of the SCL hydrogels is significantly larger than that of the Ca2+ hydrogels; and the average number of pores in each type of hydrogel per 125 µm2 area was six and 89, respectively, indicating the large number of pores in Ca2+ hydrogels. When considering the pore density, calculated as the overall area of pores (pore size multiplied by pores amount per 125 µm2) of each type of hydrogel, it was found to be slightly higher for the SCL hydrogels (744 µm2) than for the Ca2+ hydrogels (632 µm2). The overall structure of the SCL hydrogels is a connective network, which contains fewer pores, but of a larger size, than the Ca2+ hydrogels; while the Ca2+ hydrogels reveal a more compact network structure.
With respect to the ability of the two types of hydrogels to entrap cells, the SEM images show that the Ca2+ hydrogels, with their larger number of pores, appear better able to encapsulate cells than the SCL hydrogels. Indeed, it was noted during the experimental process that large piles of cells were easier to find in the Ca2+ hydrogels than in the SCL hydrogels. We attribute this to cells in the Ca2+ hydrogels being able to survive and regenerate, due to proper growth signals secreted from adjacent groups of cells; cells in Ca2+ hydrogels can build connections with each other more easily, due to the shorter distance between them.
3.2. Mechanical Strength
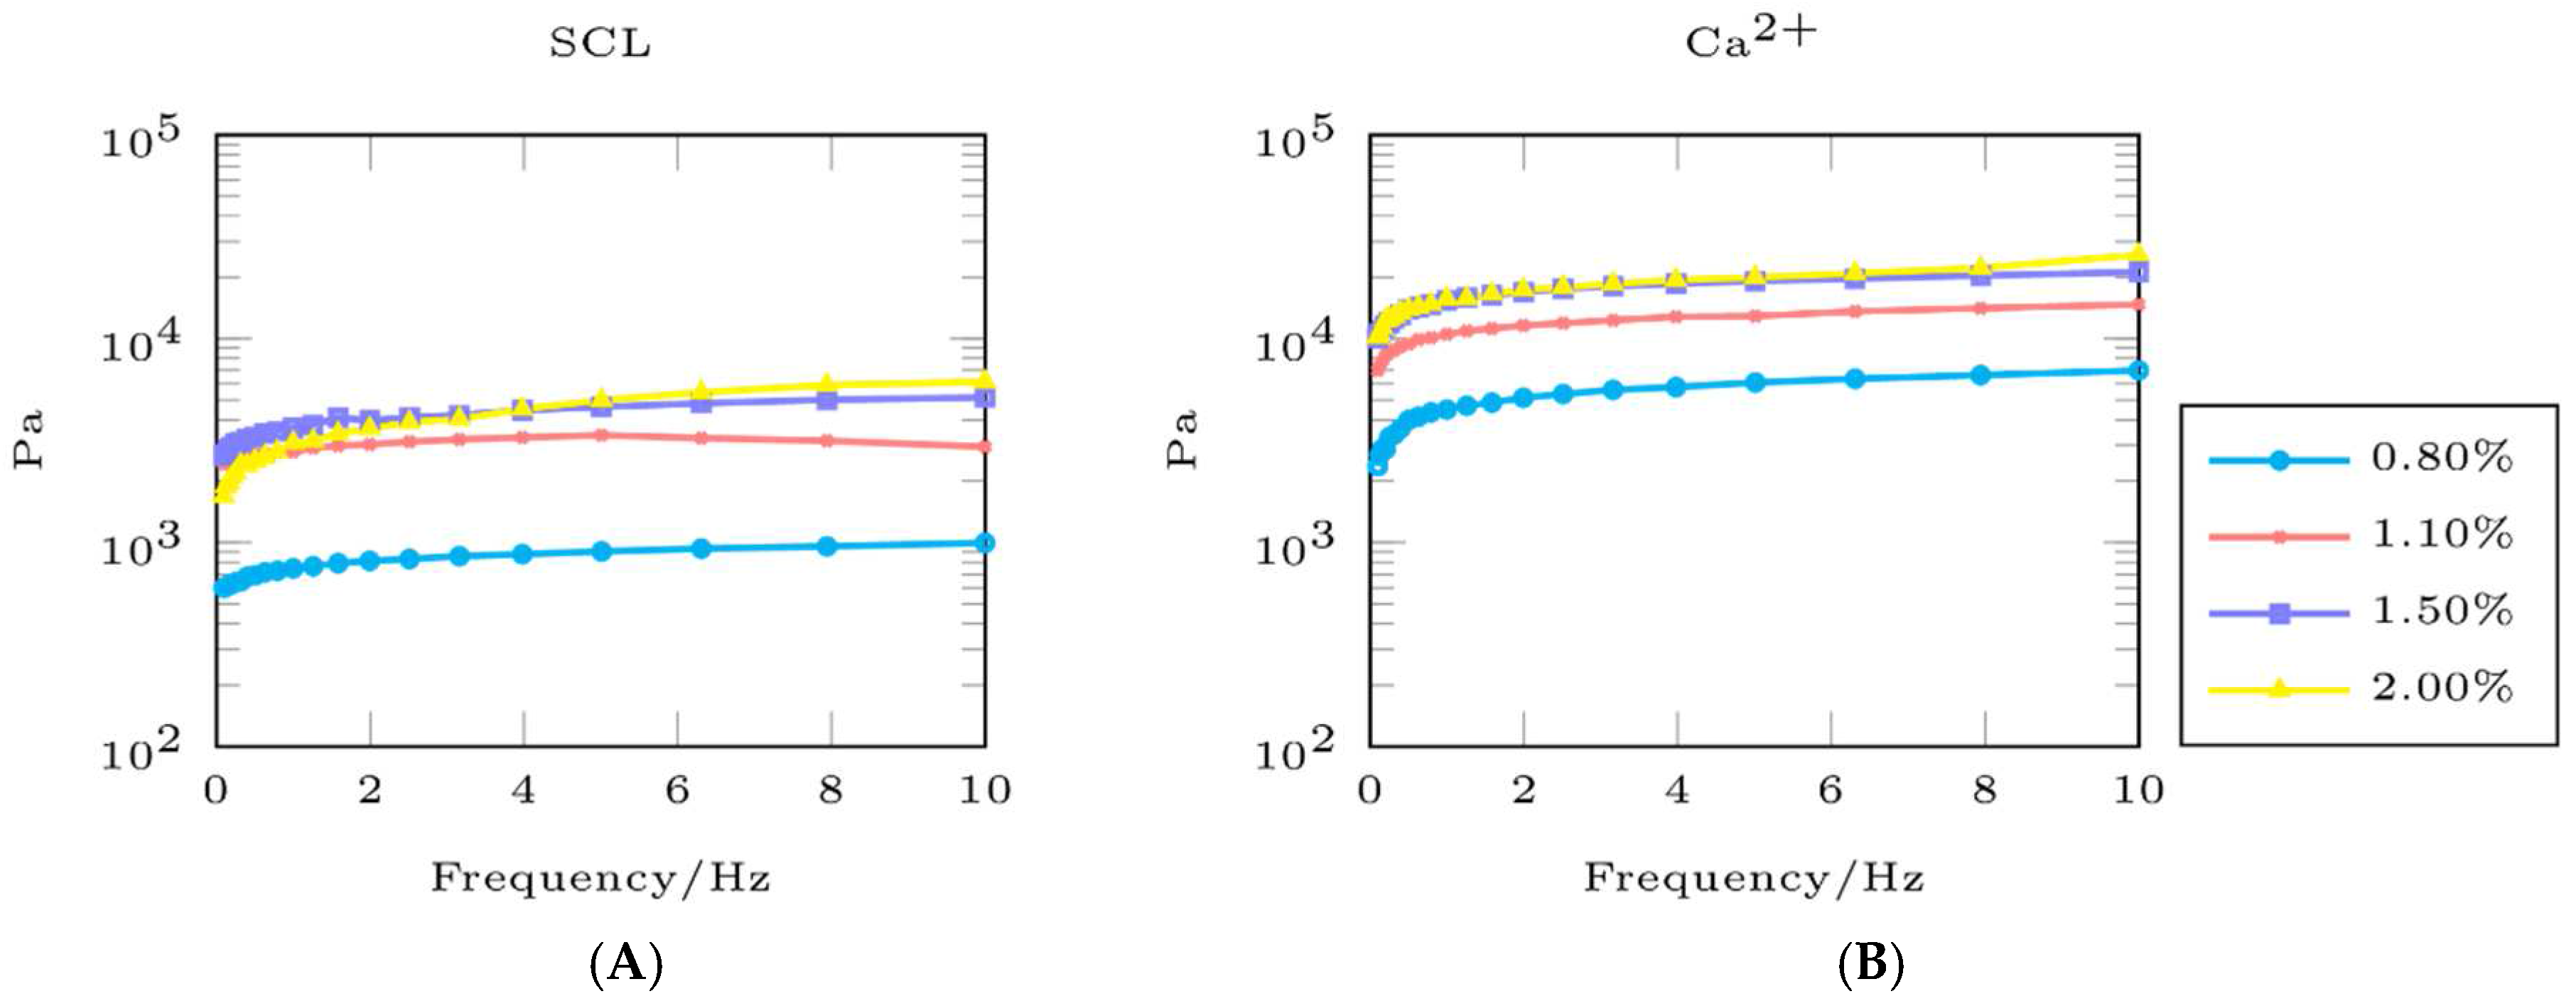
Four trendlines indicating the mechanical strength of the SCL hydrogels and Ca
2+ hydrogels are shown in
Figure 2A,B, respectively.
Figure 2A illustrates that the 2% SCL hydrogel had the highest mechanical strength (0.57 × 10
4 Pa), followed by slightly lower strength in the 1.5% SCL hydrogel (0.53 × 10
4 Pa), the considerably lower strength in the 1.1% SCL hydrogel (0.28 × 10
4 Pa), and the lowest strength in the 0.8% SCL hydrogel (0.76 × 10
3 Pa).
Figure 2B shows that Ca
2+ hydrogels follow a similar trend in mechanical strength; the 2% Ca
2+ hydrogel had the highest strength (0.23 × 10
5 Pa), followed by the 1.5%, 1.1%, and 0.8% Ca
2+ hydrogels (at 0.216 × 10
5, 0.14 × 10
5, and 0.68 × 10
4 Pa, respectively). The mechanical strength results indicate that Ca
2+ hydrogels are stronger than SCL hydrogels; the weakest Ca
2+ hydrogel (0.8%) had a similar strength to the strongest SCL hydrogel (2%).
3.3. Degradation
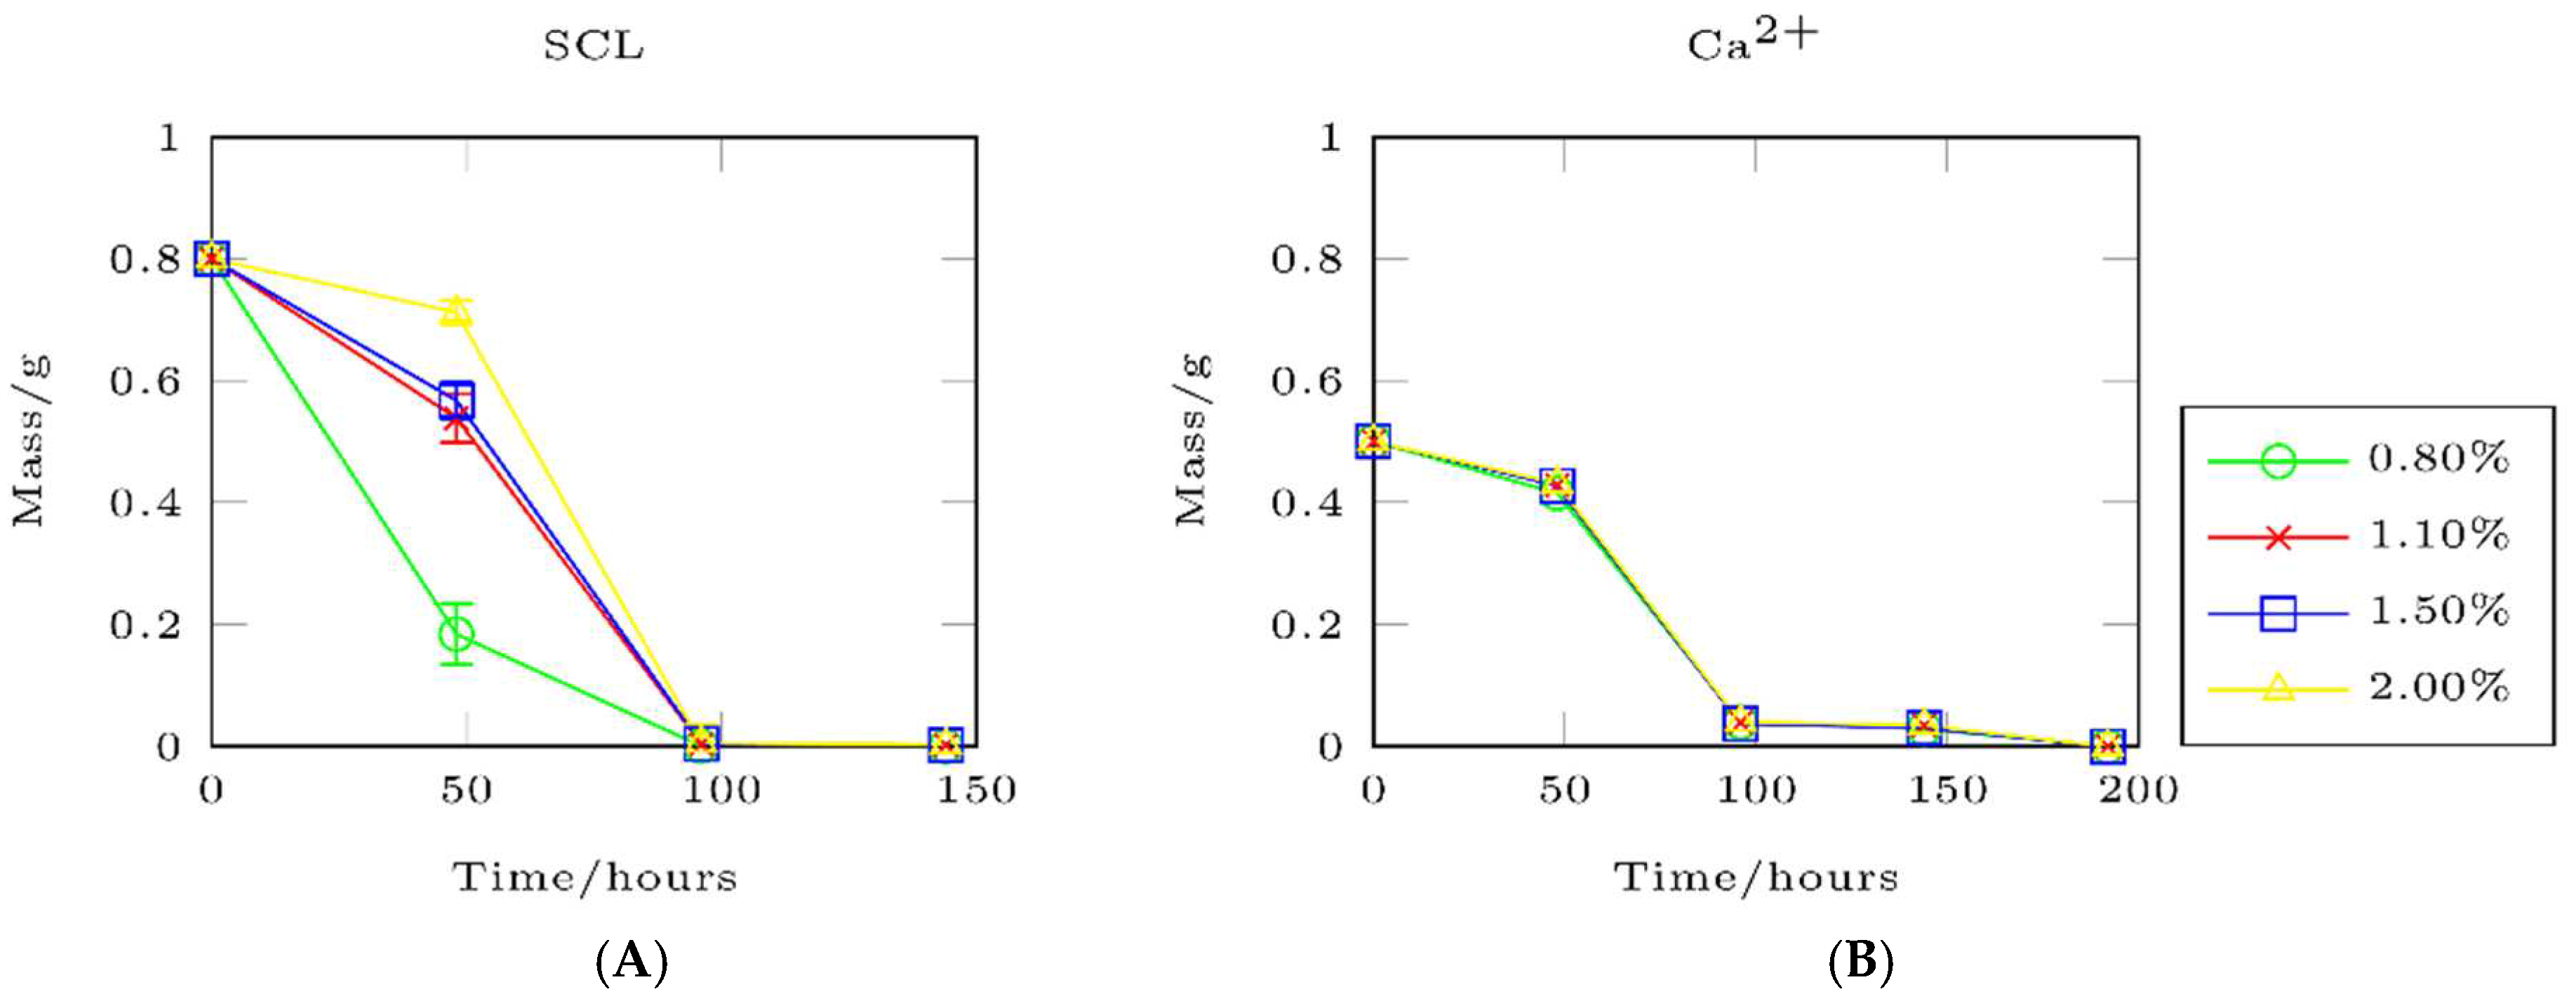
The rate at which the hydrogels degraded (in terms of weight change) in the mimic in vivo environment, is shown in
Figure 3A,B. The degradation of the SCL hydrogel groups varied (
Figure 3A). Specifically, in the first 96 h, the 0.8% SCL hydrogel degraded the fastest, the 2% SCL hydrogel degraded the slowest, and the 1.1% and 1.5% SCL hydrogels had similar degradation rates, that were slightly slower than the 2% SCL hydrogel. Thereafter, the hydrogels in all four groups disappeared, indicating complete degradation. In contrast, all four Ca
2+ hydrogels demonstrated similar trends and degradation rates in the presence of the enzyme (collagenase type II), until they disappeared completely. This indicates that their degradation is solely a function of time and is not affected by the concentration of alginate.
The varying degradation rates across the SCL hydrogel groups is likely due to their different mechanical strengths. The hydrogels with the lowest mechanical strength degraded the fastest, whereas the hydrogels with a higher mechanical strength degraded more slowly. In contrast, all Ca2+ hydrogels degraded more slowly than the SCL hydrogels, due to their collectively higher mechanical strengths. This suggests that all of the Ca2+ hydrogels were strong enough to resist the action of the enzyme, as reflected in the rather slow rate of degradation; thus, the only factor affecting the degradation rate was time. The 2% SCL hydrogels, the strongest of the SCL hydrogels, demonstrated the slowest degradation rate, and only a slight weight loss in the first 48 h after exposure to the enzyme.
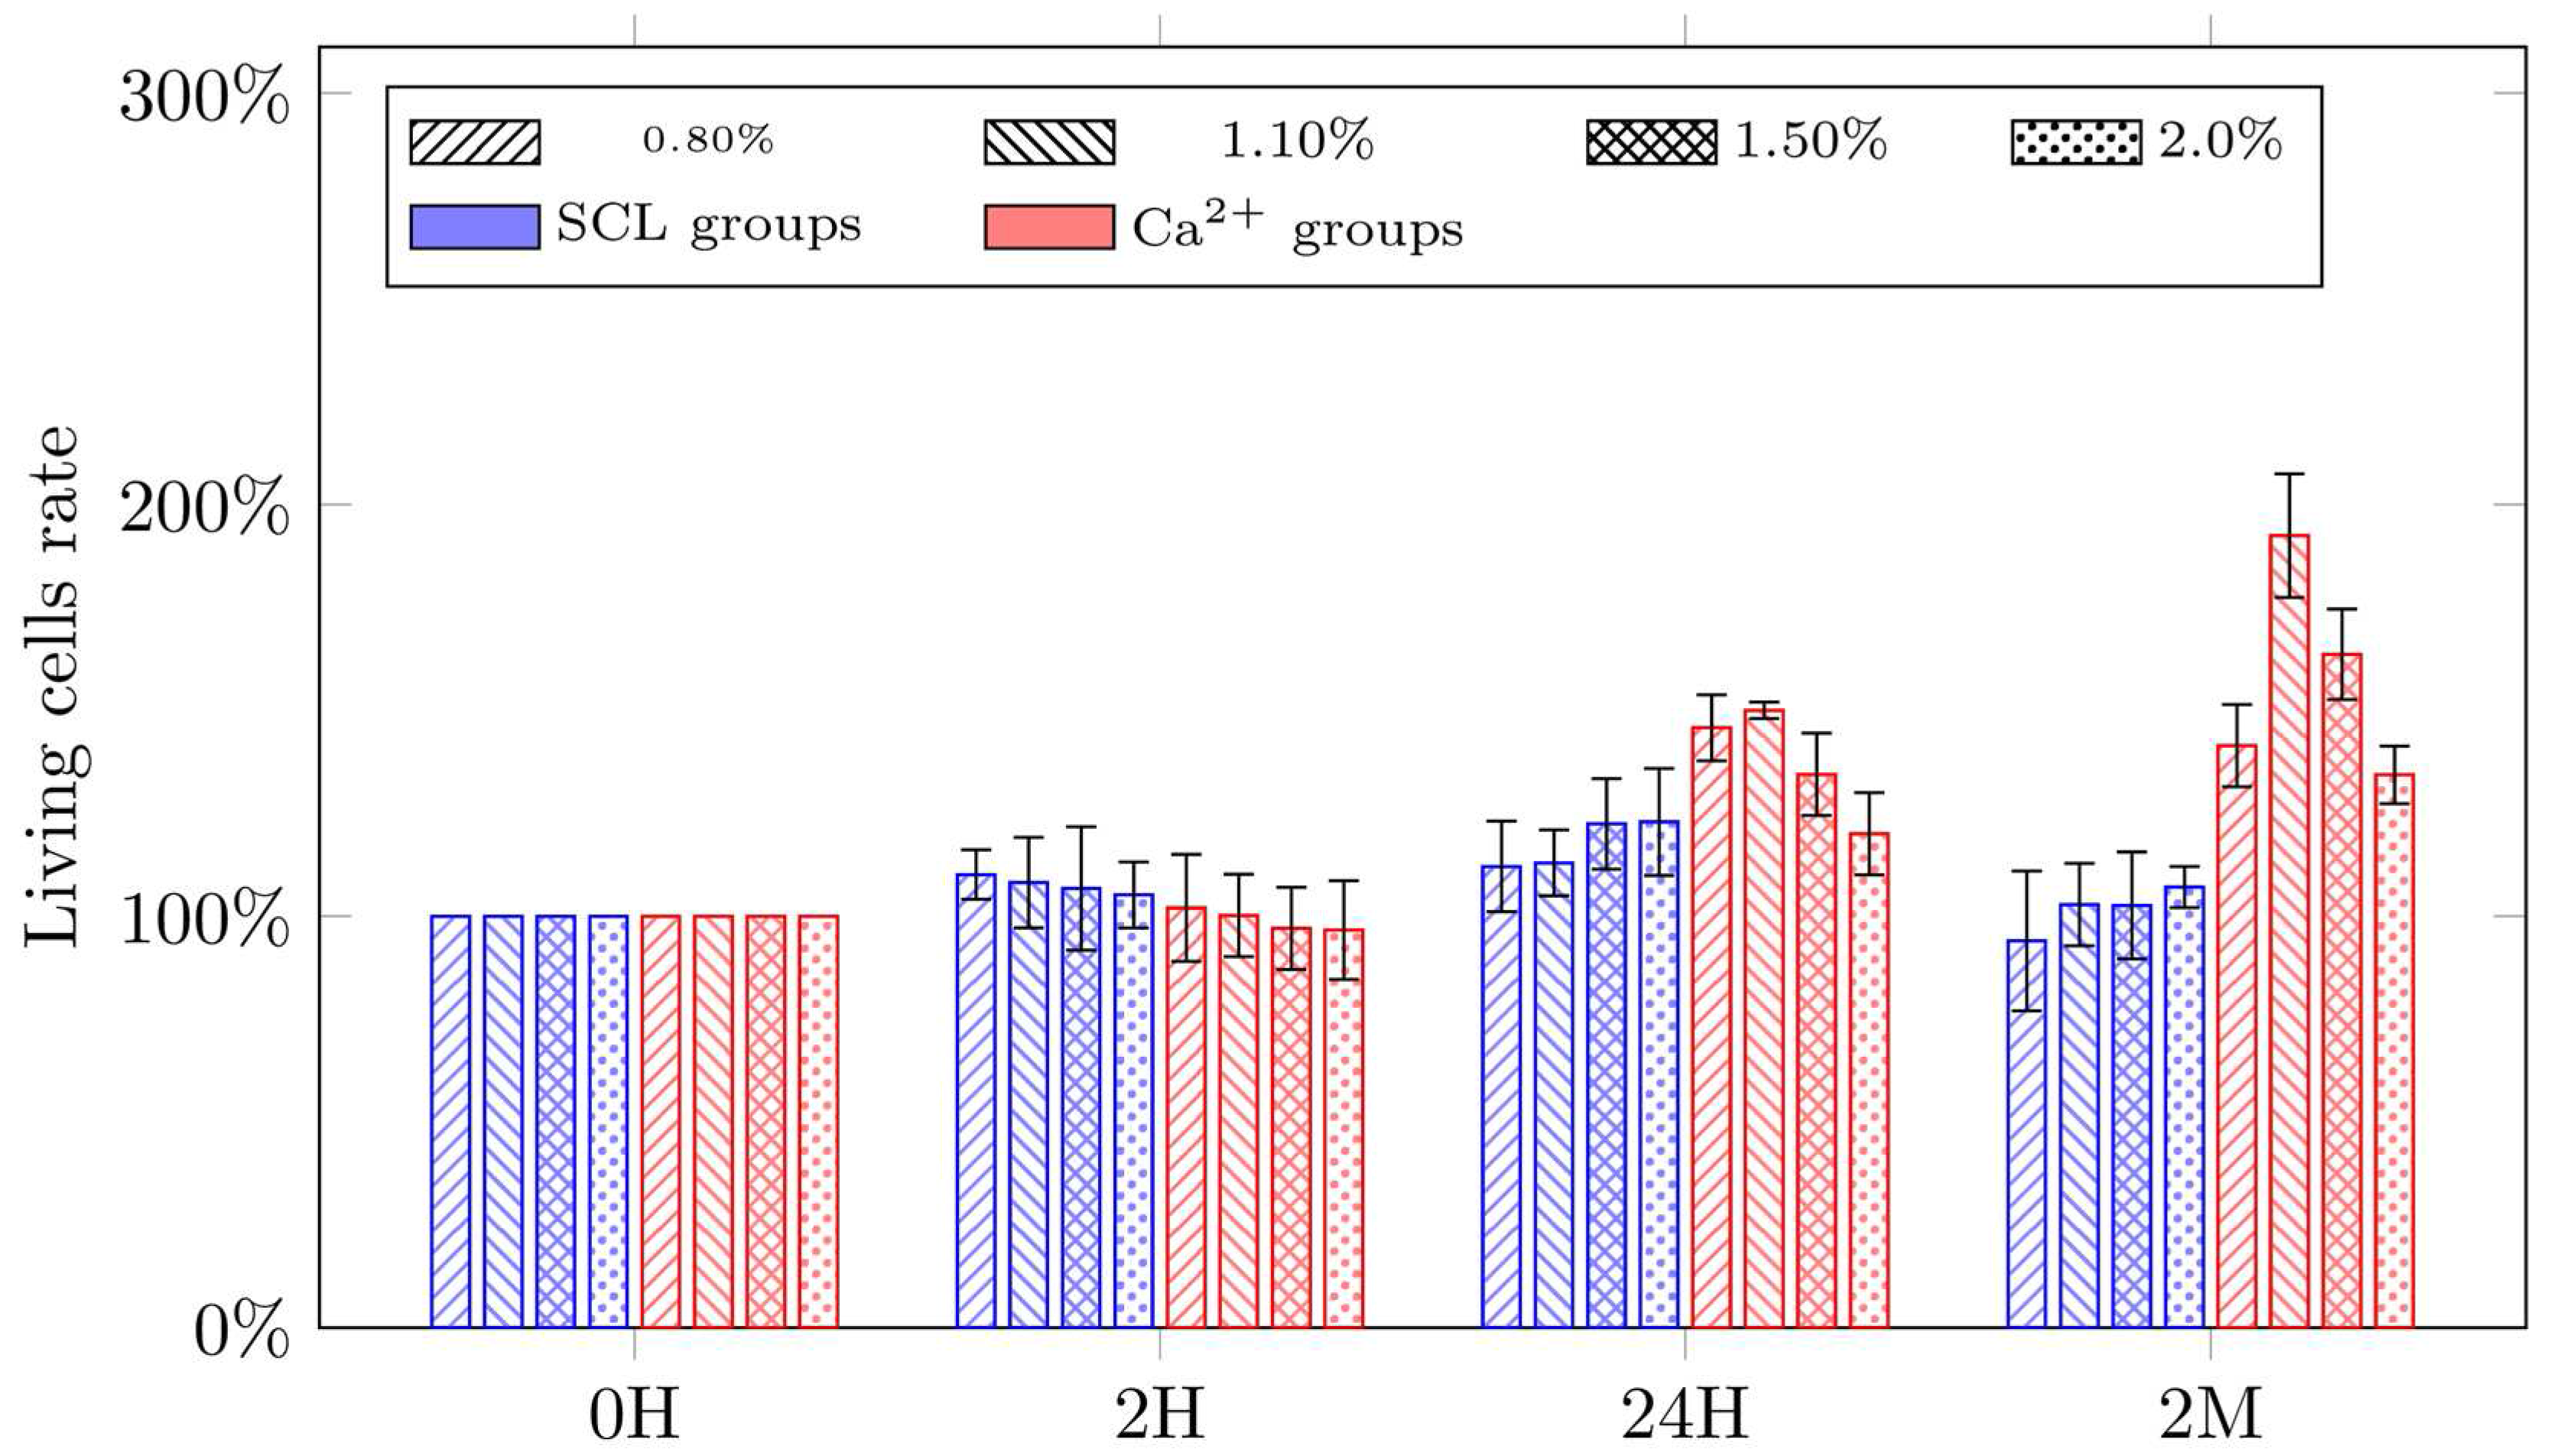
3.4. MTT
The cell survival rates at 0 h, 2 h, 24 h, and two months after encapsulation in the hydrogels are presented in
Figure 4. Specifically, the cell viability right after the injection process was measured and set as the baseline for the comparison with those measured at different time periods, which is shown as a percentage thereof.
For the SCL hydrogels, data from 2 h after encapsulation show that cell viability decreases with an increasing alginate concentration. Specifically, the 2% SCL hydrogels had the lowest cell viability and the 0.8% SCL hydrogels had the highest. This suggests that cell viability during the injection process varies with hydrogel viscosity, with more cells surviving in the lower viscosity hydrogels. After 24 h, living cell rates in all of the groups increased, compared to those at 2 h, particularly the 1.5% and 2% SCL hydrogels, which had a higher cell viability than the other two groups. The increased number of living cells indicates that cells proliferated after being encapsulated in the hydrogels, and the low cell viability in lower viscosity hydrogels indicates that the cells survived better in the higher viscosity hydrogels. After two months, cell numbers decreased compared to those at 2 h and 24 h, and 0.8% SCL hydrogels had the lowest living cells rate out of all of the groups. This indicates that living cell rates decreased with the degradation of hydrogels, due to a lack of protection.
For the Ca2+ hydrogels, cell viability was not significantly different across the four groups after 2 h, and all viability rates were less than those for the SCL hydrogels. This indicates a lower retention rate of living cells in Ca2+ hydrogels, which have a higher viscosity than the SCL hydrogels, during the cell encapsulation process. After 24 h, the cell viability sharply increased compared to the baseline, especially for the 1.1% Ca2+ hydrogel, which had the highest cell viability. As such, cells seem to prefer hydrogels with a higher mechanical strength, in order to survive and proliferate. After two months, cell viability rates in the Ca2+ hydrogels still demonstrated an increasing trend, when compared to both the baseline and 24 h values. In particular, the 1.1% Ca2+ hydrogel had the highest living cell rate among the four groups. This suggests that cells were effectively regenerated during extended cultivation in hydrogels and proliferated the most in the high mechanical strength 1.1% Ca2+ hydrogels. After two months, the living cell rates for all Ca2+ hydrogels were much higher than those for SCL hydrogels. This reflects the fact that Ca2+ hydrogels have a slower degradation process than SCL hydrogels and that cells are still protected in the hydrogels after two months. We speculate that, during these two months, the cells proliferated and interconnected to each other, forming a network structure similar to the ECM that provides protection for cells in in vivo conditions.
The mechanical properties of hydrogels are important factors affecting the cell viability, as discussed above. It should be noted that, in addition to the mechanical properties, many other factors, such as the presence of residual reagents, pore density, and apoptotic potential of gelatin fragments, may also contribute to the cell viability.
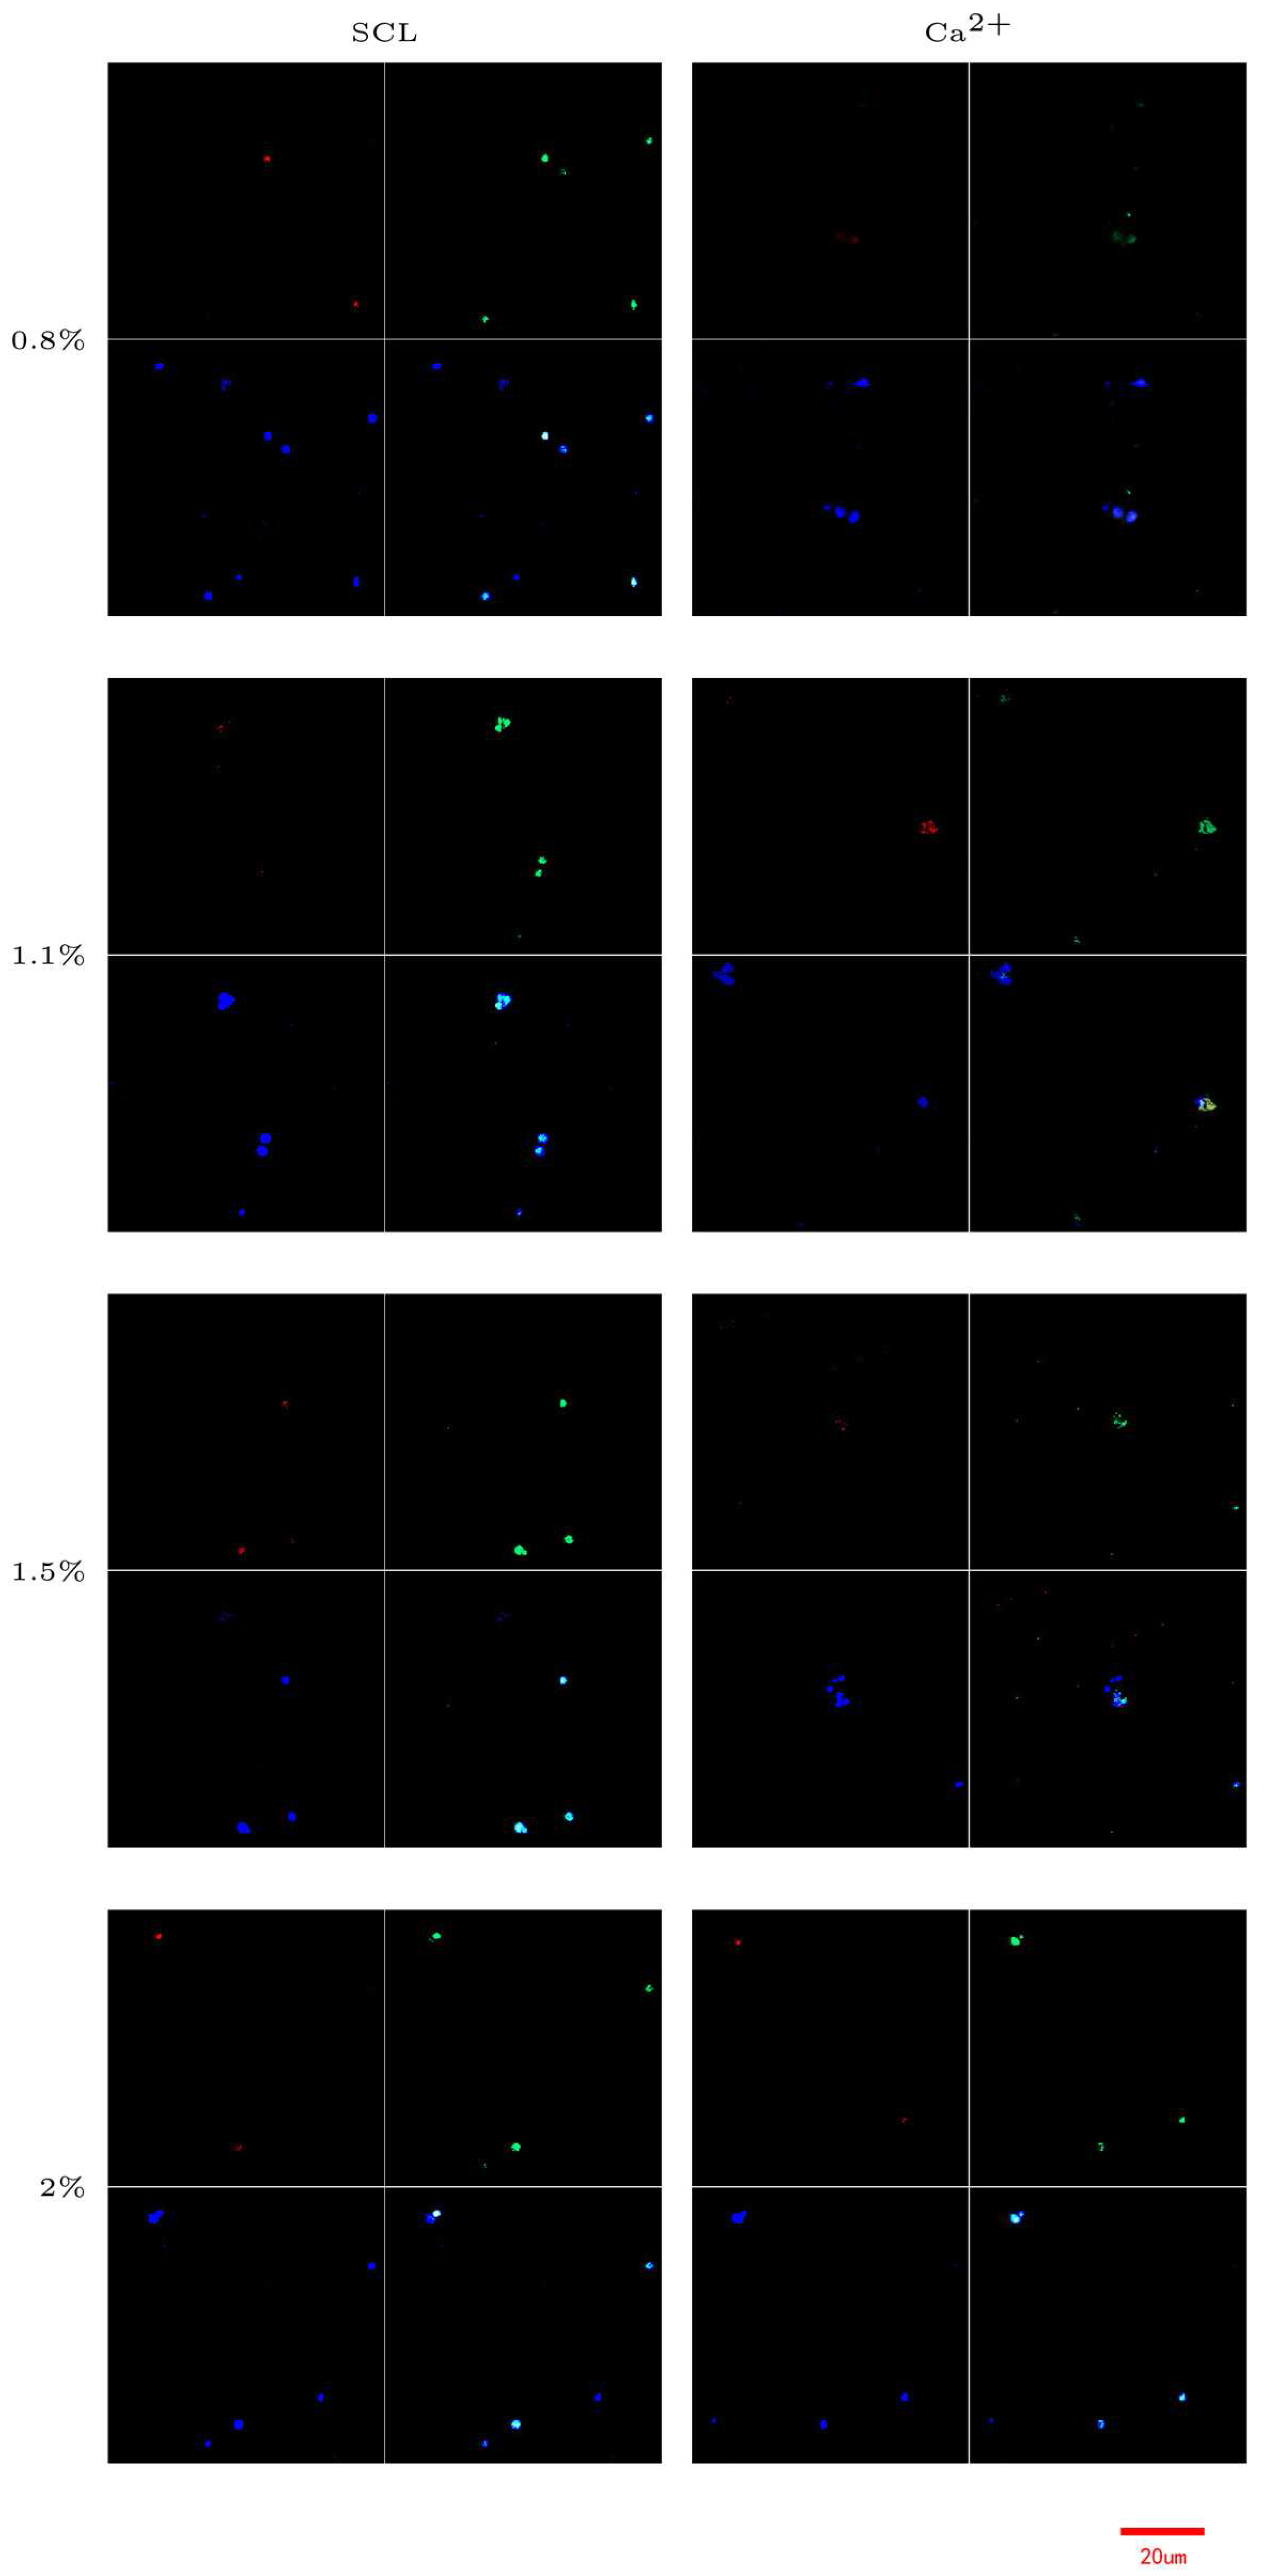
3.5. Immunofluorescence
The immunofluorescence of cells stained with PI (red)/calcein (green)/DAPI (blue), to indicate dead cells/live cells/cell nuclei via confocal microscopy, is shown in
Figure 5, for only one layer of cells in the hydrogels. Staining in other adjacent layers was too strong to be ignored, despite lower concentrations of stains being applied to minimize misleading color from adjacent layers during measurement. The number of green cells in the SCL hydrogels was, in general, less than in the Ca
2+ hydrogels, which indicates that the cell survival rate in the Ca
2+ hydrogels is higher than in the SCL hydrogels.
5. Conclusions
Injecting hydrogel-encapsulated cells shows promise for compensating for the loss of cardiomyocytes in MI repair. In this paper, we present a study on two types of alginate hydrogels, self-crosslinked and calcium-ion cross-linked hydrogels (or SCL and Ca2+ hydrogels), to encapsulate muscle-derived stem cells for potential MI repair. Our results illustrate that the cells can survive and proliferate in both hydrogels over the examined time period, from their injection to two-month cultivation. Our results also illustrate that cells have a better viability in SCL hydrogels than Ca2+ hydrogels right after injection and for the first 24 h after encapsulation. However, the cell survival rate is much higher in Ca2+ hydrogels than in SCL hydrogels after long-term (two month) cultivation.
Our efforts to select the best formation of hydrogel for optimizing cell survival, show that SCL hydrogels with 0.8% alginate and 20% gelatin achieve the best cell viability during the injection process. However, Ca2+ hydrogels with 1.1% alginate and 20% gelatin have the highest cell survival rate during long-term cultivation, which is promising for the high-level regeneration of cells for potential MI repair.


