1. Introduction
The Internet of Things (IoT) for the production operations is one of the hottest topics in Industrie 4.0 and Smart Manufacturing [
1]. The system architecture of the IoT consists of four layers, including the sensing layer, the network layer, the service layer, and the interface layer [
2]. The IoT provides important service for future advanced manufacturing which relies on the concept of connectivity. For connecting machines, devices, sensors, and people with each other in a factory, reliable and scalable communication networks used in the IoT are of great importance. There are several significant relevant research works in the area, such as those reported in References [
3,
4,
5]. Among the various technologies in the system architecture of the IoT, the narrow-band IoT (NB-IoT) and the small cell are considered very promising technologies.
The Third-Generation Partnership Project (3GPP) already standardized the NB-IoT, a new cellular radio technology that meets the requirements of the IoT, in 2016 [
6,
7]. The design goal of the NB-IoT is to achieve low-cost devices, high coverage, long battery lifetime, and massive capacity [
8,
9,
10,
11].
Industrial and academic research has anticipated the increasing use of small cells to provide the indoor data transmission required to meet the emerging communication and networking needs of future IoT applications [
12]. A small cell is a low-power and low-cost radio base station, which can provide suitable cellular coverage in factory environments [
13]. Therefore, the small cell is considered one of the key technologies for future IoT.
While performing the system planning and deployment of small cell base stations for the IoT applied in a factory, it is critical to understand the wireless channel characteristics in the indoor environment. Savazzi, Rampa, and Spagnolini proposed connectivity modeling and layout design methods to support a plant designer during wireless coverage prediction, virtual network deployment, and post-layout verification [
14]. Their proposed methods could predict the radio signal coverage in typical industrial environments. However, they only considered the IEEE 802.15.4 channel. Whether their work could be applied to an NB-IoT is still unknown.
This paper aims at channel parameter measurements of indoor Long Term Evolution (LTE) systems for the deployment of base stations to have good coverage and service reliability (SR). First, we built a software-defined radio (SDR)-based small cell experimental platform, which included a set of LTE evolved node B (eNB) and user equipment (UE). By using the SDR techniques, we could easily modify important system parameters by software programming. Based on this experimental platform, we performed indoor channel parameter measurements to determine the path loss (PL) exponent and the standard deviation of the received shadow fading signal. Finally, based on the experimental results, the precise formula of the PL model and the calculated fade margin (FM) for 90% SR were exploited to predict the coverage range of the small cell base station optimally deployed in the factory. The measured PL channel models were compared with the (International Telecommunication Union ) ITU PL channel model.
The major contributions of this paper are twofold:
An experimental method was designed to perform the wireless channel parameter measurements of indoor LTE systems for the IoT. This method could be applied to factorial environments.
Based on the experimental results, we provided the indoor channel model with modified parameter values. This facilitates the system planning and deployment of small cell base stations with 90% SR for the IoT.
The rest of this paper is organized as follows. The main principles of the path loss model and the coverage range with 90% SR that we adopt in this paper are presented in
Section 2. The experimental methods and evaluation results are provided in
Section 3 and
Section 4, respectively. Finally,
Section 5 concludes this paper.
2. Principles
In this section we describe the main principles that we adopt in this paper, including the path loss model and the coverage range model.
2.1. Path Loss Model
The path loss is defined as the ratio of the transmit power to the receive power. In a link budget, this refers to the largest transmit power that the transmitter can send and the smallest receive power at which the receiver can recover the original information. Then, the greatest path loss can be calculated from the measured largest transmit power and smallest receive power. A path loss model relates the path loss to the distance between the transmitter and the receiver. By combining the link budget with a suitable path loss model, we can estimate the coverage range of the base station.
Using the ITU-R indoor path loss model [
15], the path loss between a femtocell eNB and an UE separated by a distance
d(
m) in a given cell is:
where the carrier frequency
f (MHz) is set as 2350 MHz with 20 MHz bandwidth in the experiment.
N is the path loss exponent, where the nominal value in the indoor office is set to 3 [
15].
Lf(
n) is the penetration loss between the floors, where
n is the number of floors. The penetration loss is not considered in the simulations.
2.2. Coverage Range
The coverage radius is derived as [
16]:
where the parameter
is generated from the link budget equation and Equation (1).
Pt (dBm) is the transmit power; Pr,min (dBm) is the minimum receive power; FM (dB) is the fade margin; Lt (dB) is the transmitter loss; Gt (dBi) is the transmit antenna gain; Gr (dBi) is the receive antenna gain; and Lr (dB) is the receiver loss.
This paper considers the SR requirements of indoor small cell fading environments. The received signal strength
W at the UE is log-normally distributed. The coverage probability of
W being greater than the threshold
W0 from the eNB to a UE at a distance
d is:
where
R is the femtocell radius,
K −
W0 (dB) is the Fade Margin (FM) at
d =
R, which is used to guarantee the reliability at the cell edge, and
K is the average signal strength (dBm) at the cell edge.
The percentage of the UE in a cell of radius
R for
W greater than the receiver threshold
W0 is defined as the SR, which is given as [
16]:
where
and
is the standard deviation of the received signal strength in a given cell. In addition, the standard deviation in the indoor office environment is set to 10 dBm [
17]. Substituting the standard deviation and the path loss exponent into Equations (5)–(7) yields the FM for 90% SR.
3. Experimental Methods
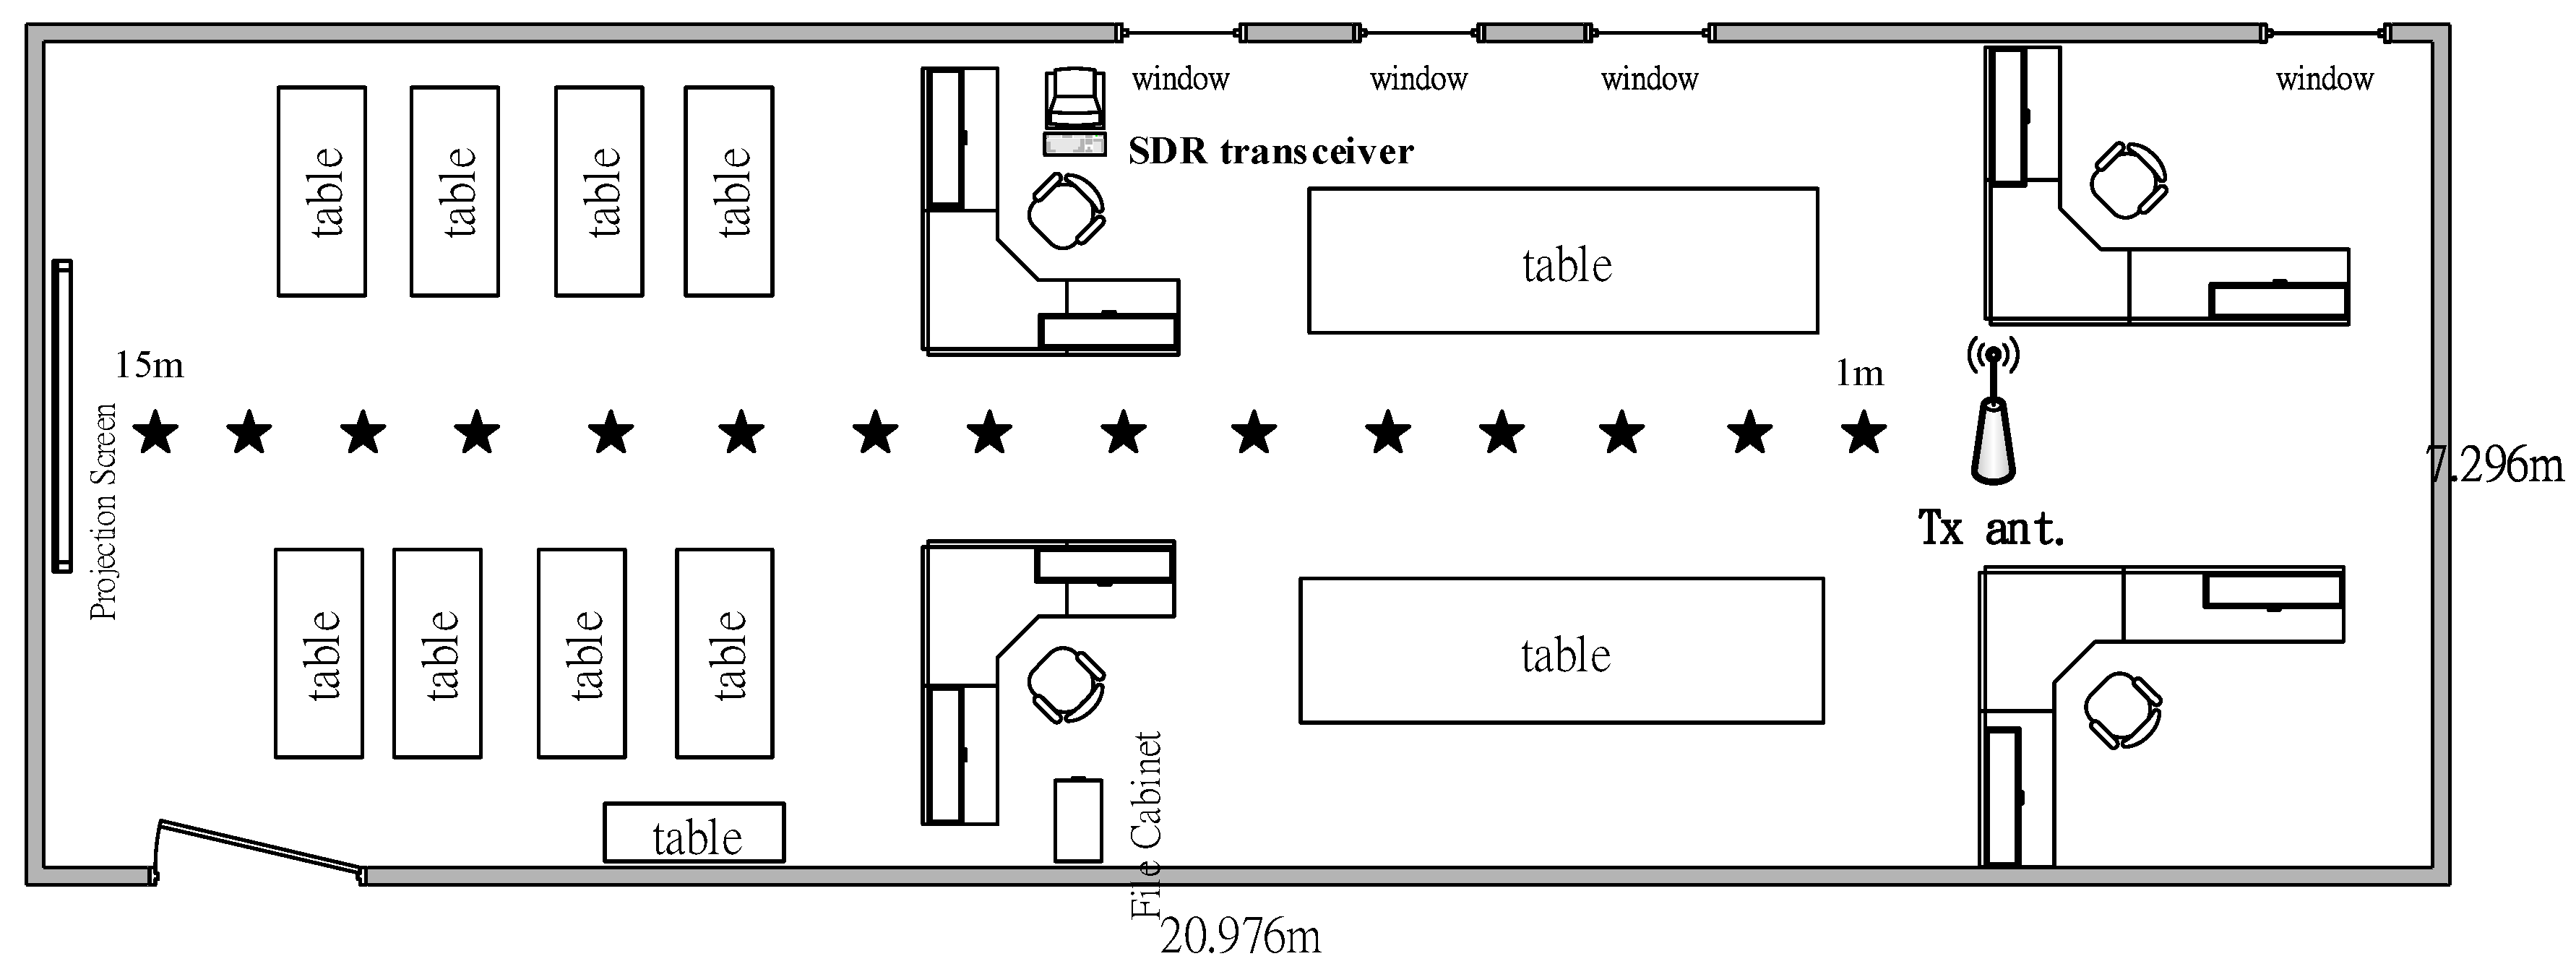
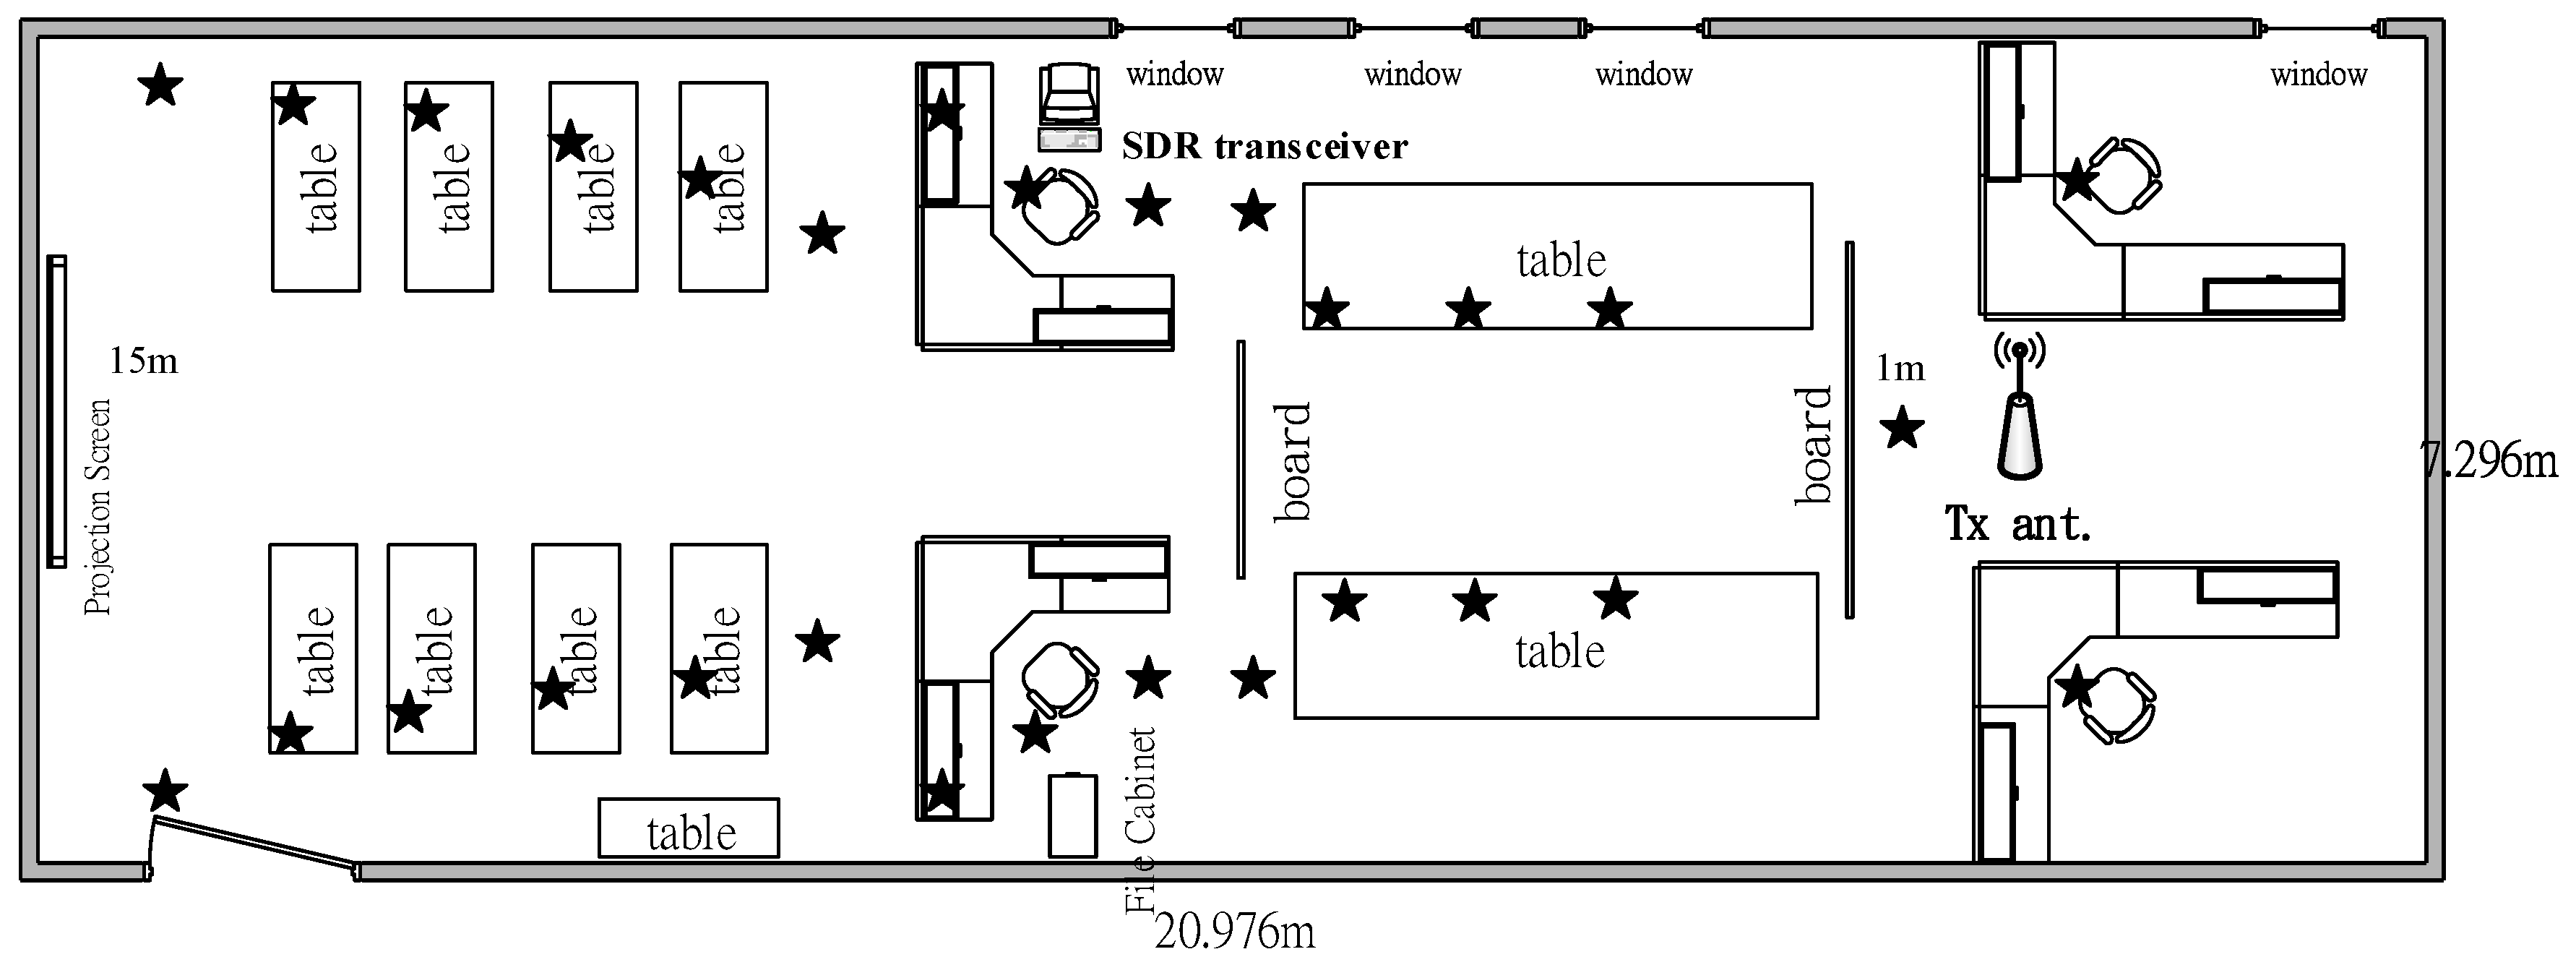
For the purpose of determining the path loss exponent and the coverage range of the received shadow fading signal in the factory environments, the down link power measurement of small cell eNB was performed in the laboratory. An SDR-based small cell experimental platform was built in the laboratory, which contained an eNB and UE. We use the NI (National Instruments Corporation, Austin, TX, USA) PXI platform as the main hardware, and the NI (National Instruments Corporation, Austin, TX, USA) LabVIEW Communications Design Suite and LTE Application Framework as the main software tools to build this SDR-based small cell experimental platform, so that the transmitted and the received signals follow the 3GPP LTE specifications. By using the SDR techniques, we could easily modify important system parameters, e.g., carrier frequency, bandwidth, and transmit power, by software. The carrier frequency of the transceiver was 2350 MHz, the system bandwidth was 20 MHz and the transmission mode was single input single output (SISO). The reference signal received powers (RSRPs) were measured at the scenarios of line of sight (LOS) and non-LOS (NLOS). The scenario of the laboratory is shown in
Figure 1 and
Figure 2, where the measurement positions are illustrated as the star symbols.
Table 1 shows the SDR transceiver parameters.
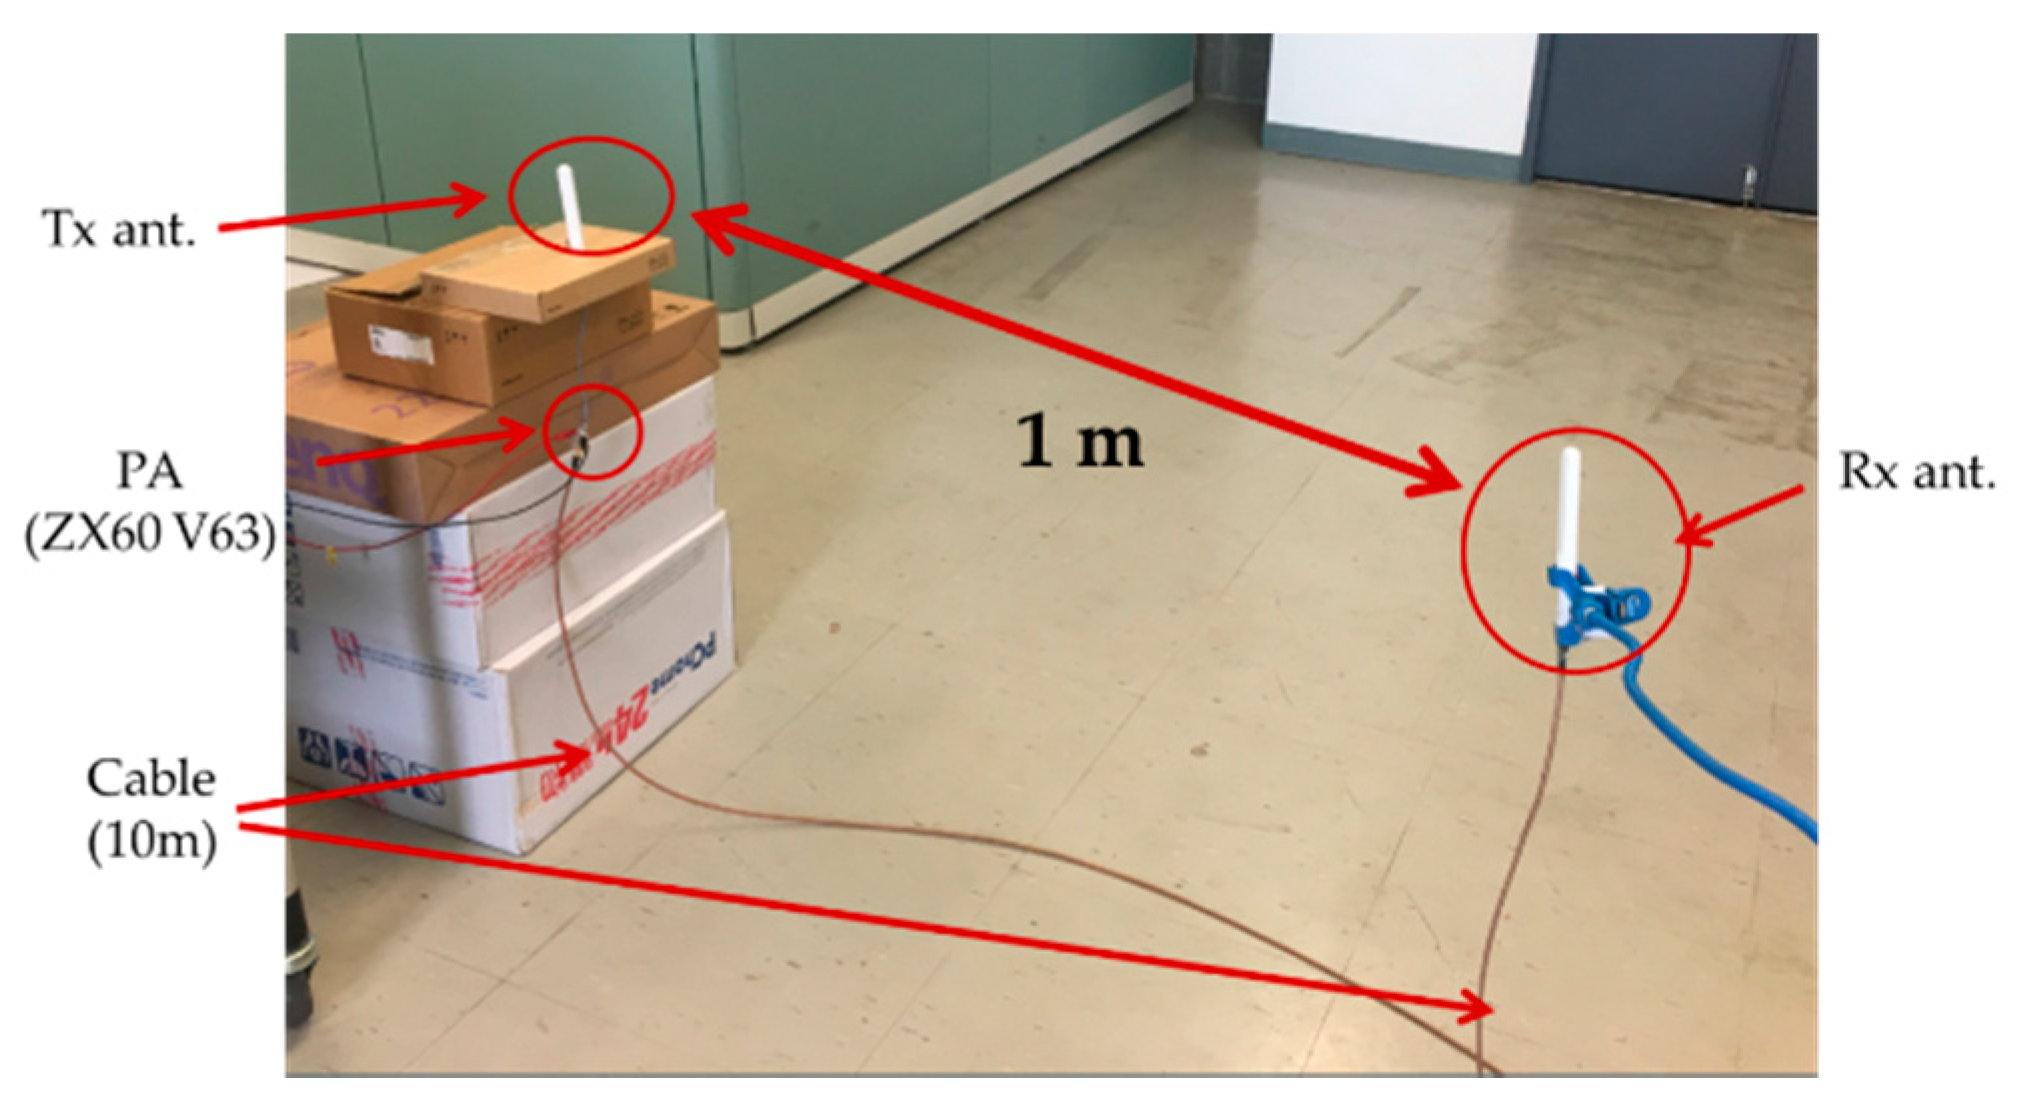
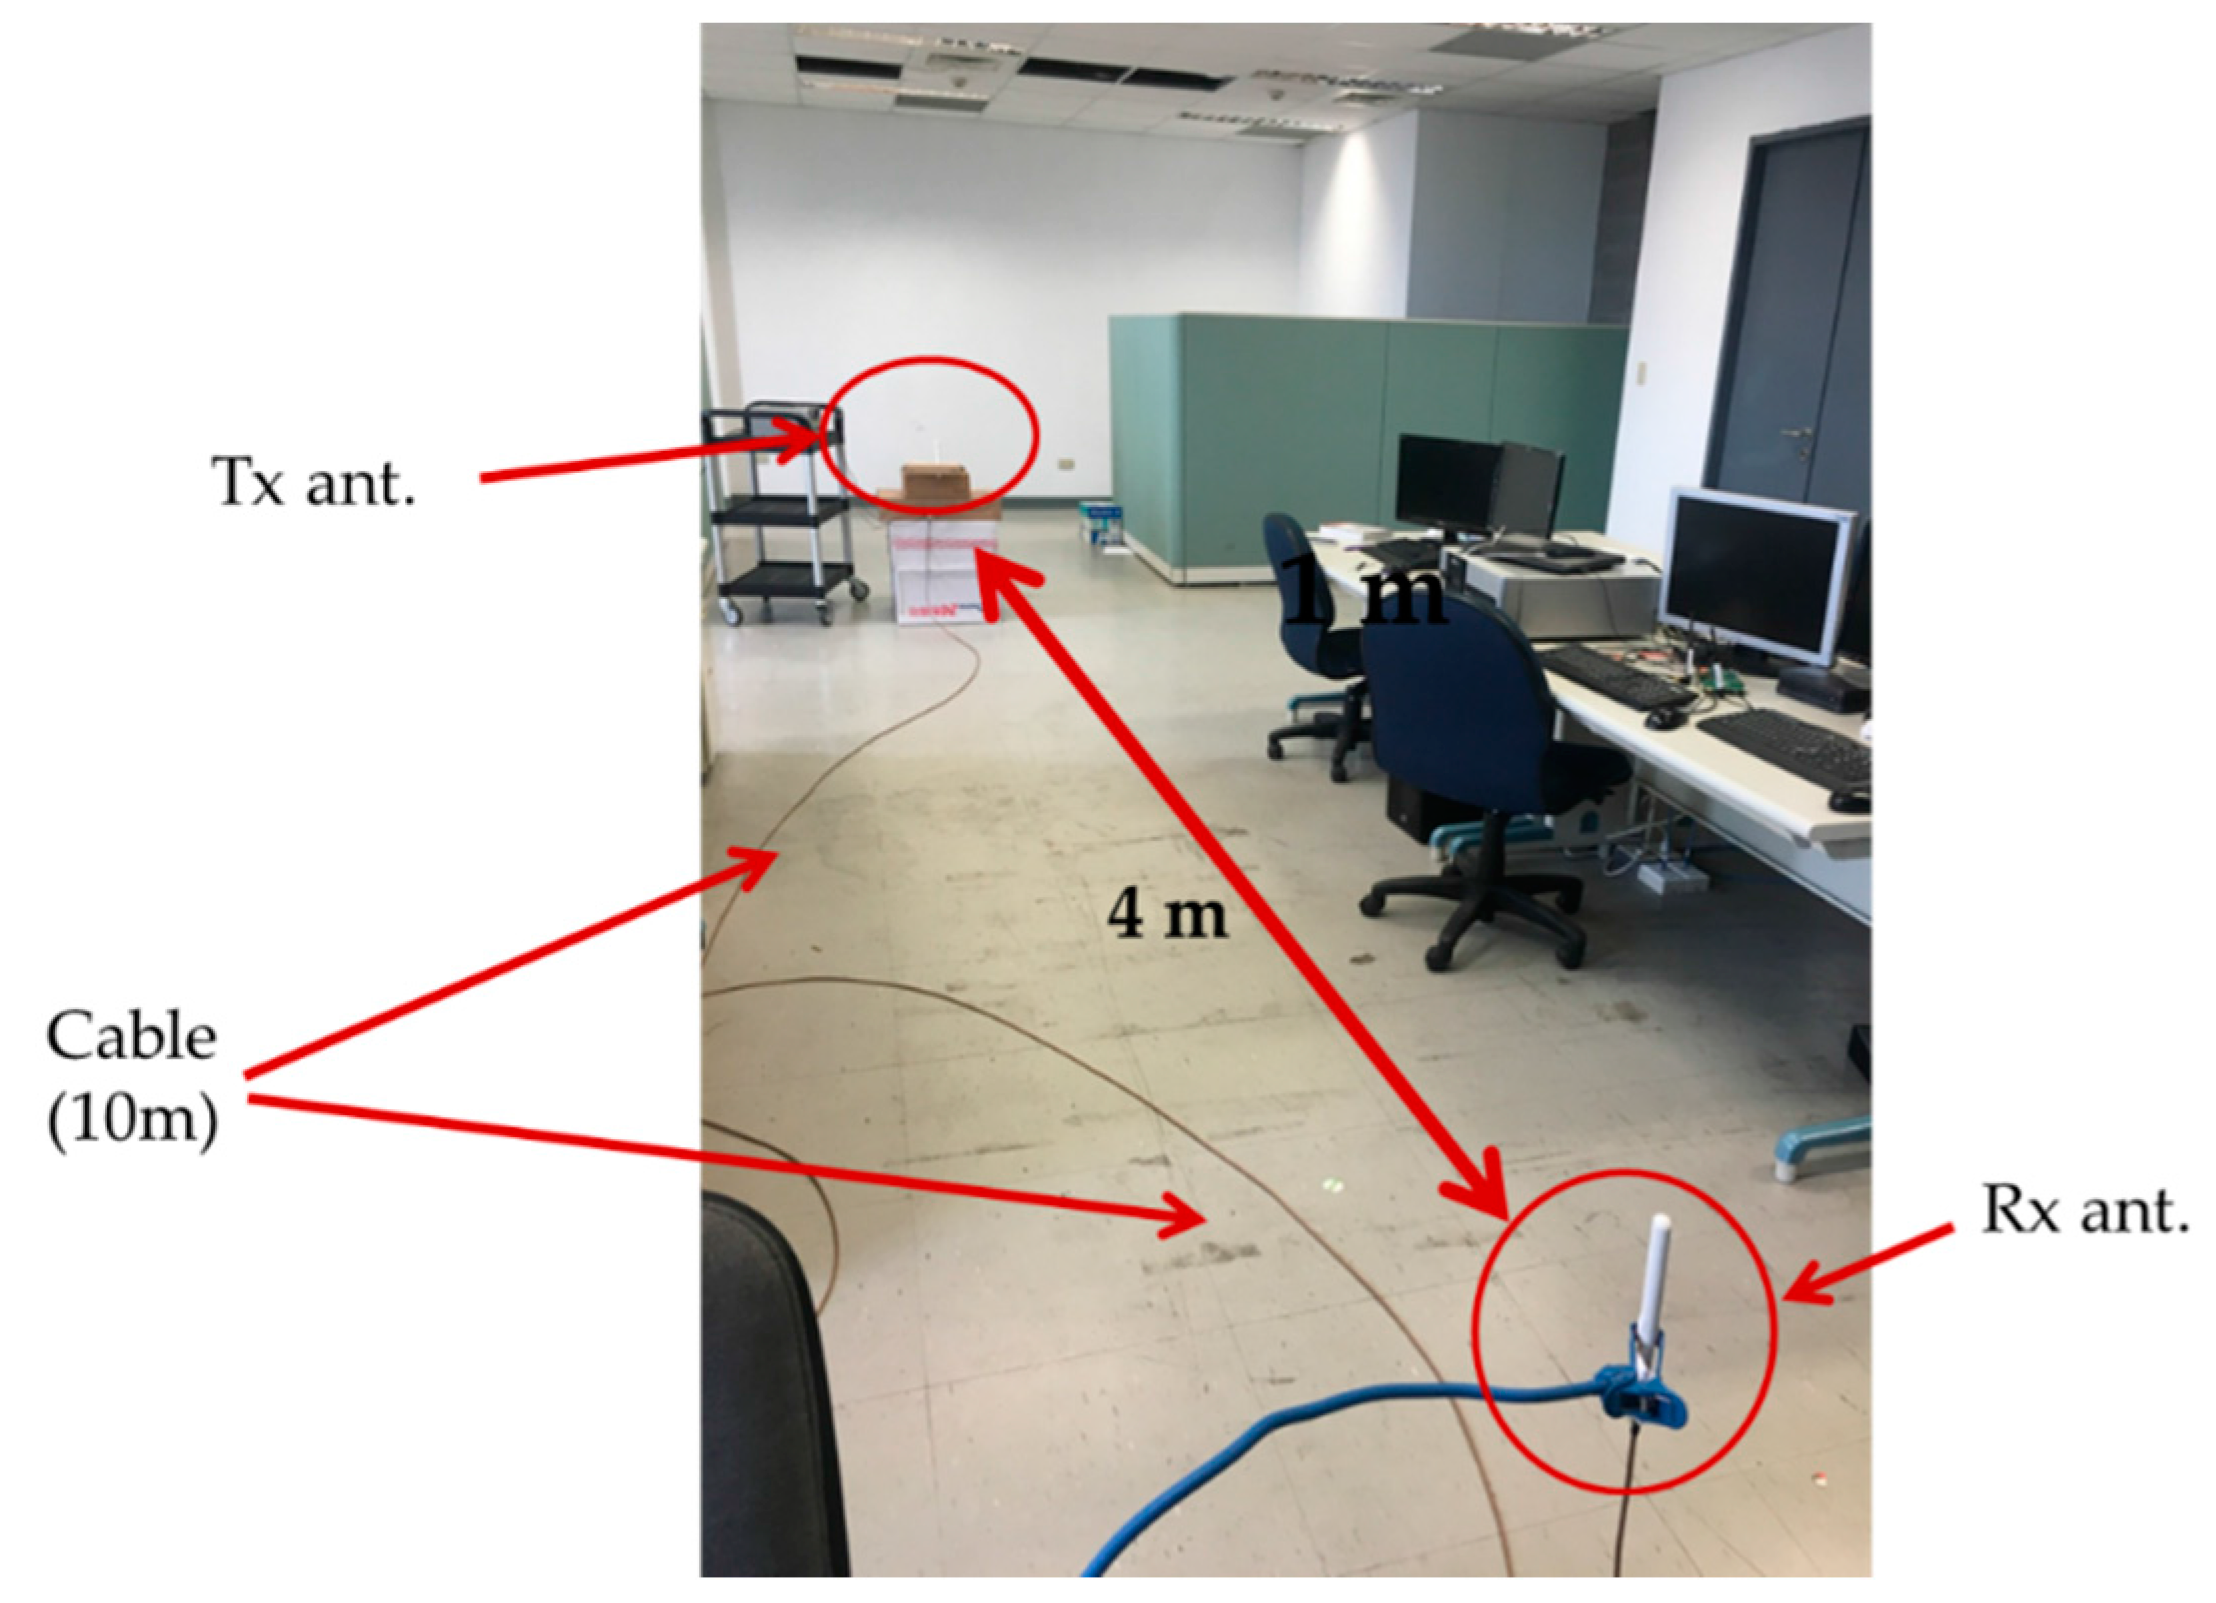
The output port of the eNB transmitter was connected to a single transmit antenna through a cable with 14.1 dB loss and a power amplifier (ZX60-V63+) with 18 dB gain. The signal was returned to the input port of the UE receiver through a single receive antenna, as
Figure 3 and
Figure 4 show.
The length and width of the laboratory were 20.98 m and 7.30 m, respectively. The height for both the transmit (Tx) antenna and the receive (Rx) antenna was set up at about 1 m. The measurement positions were distributed at a distance of 1 to 15 m from the eNB. 1000 RSRPs were measured at each measurement position. The UE measured RSRPs for different distances between the transmitter and receiver in the laboratory and calculated their path loss.
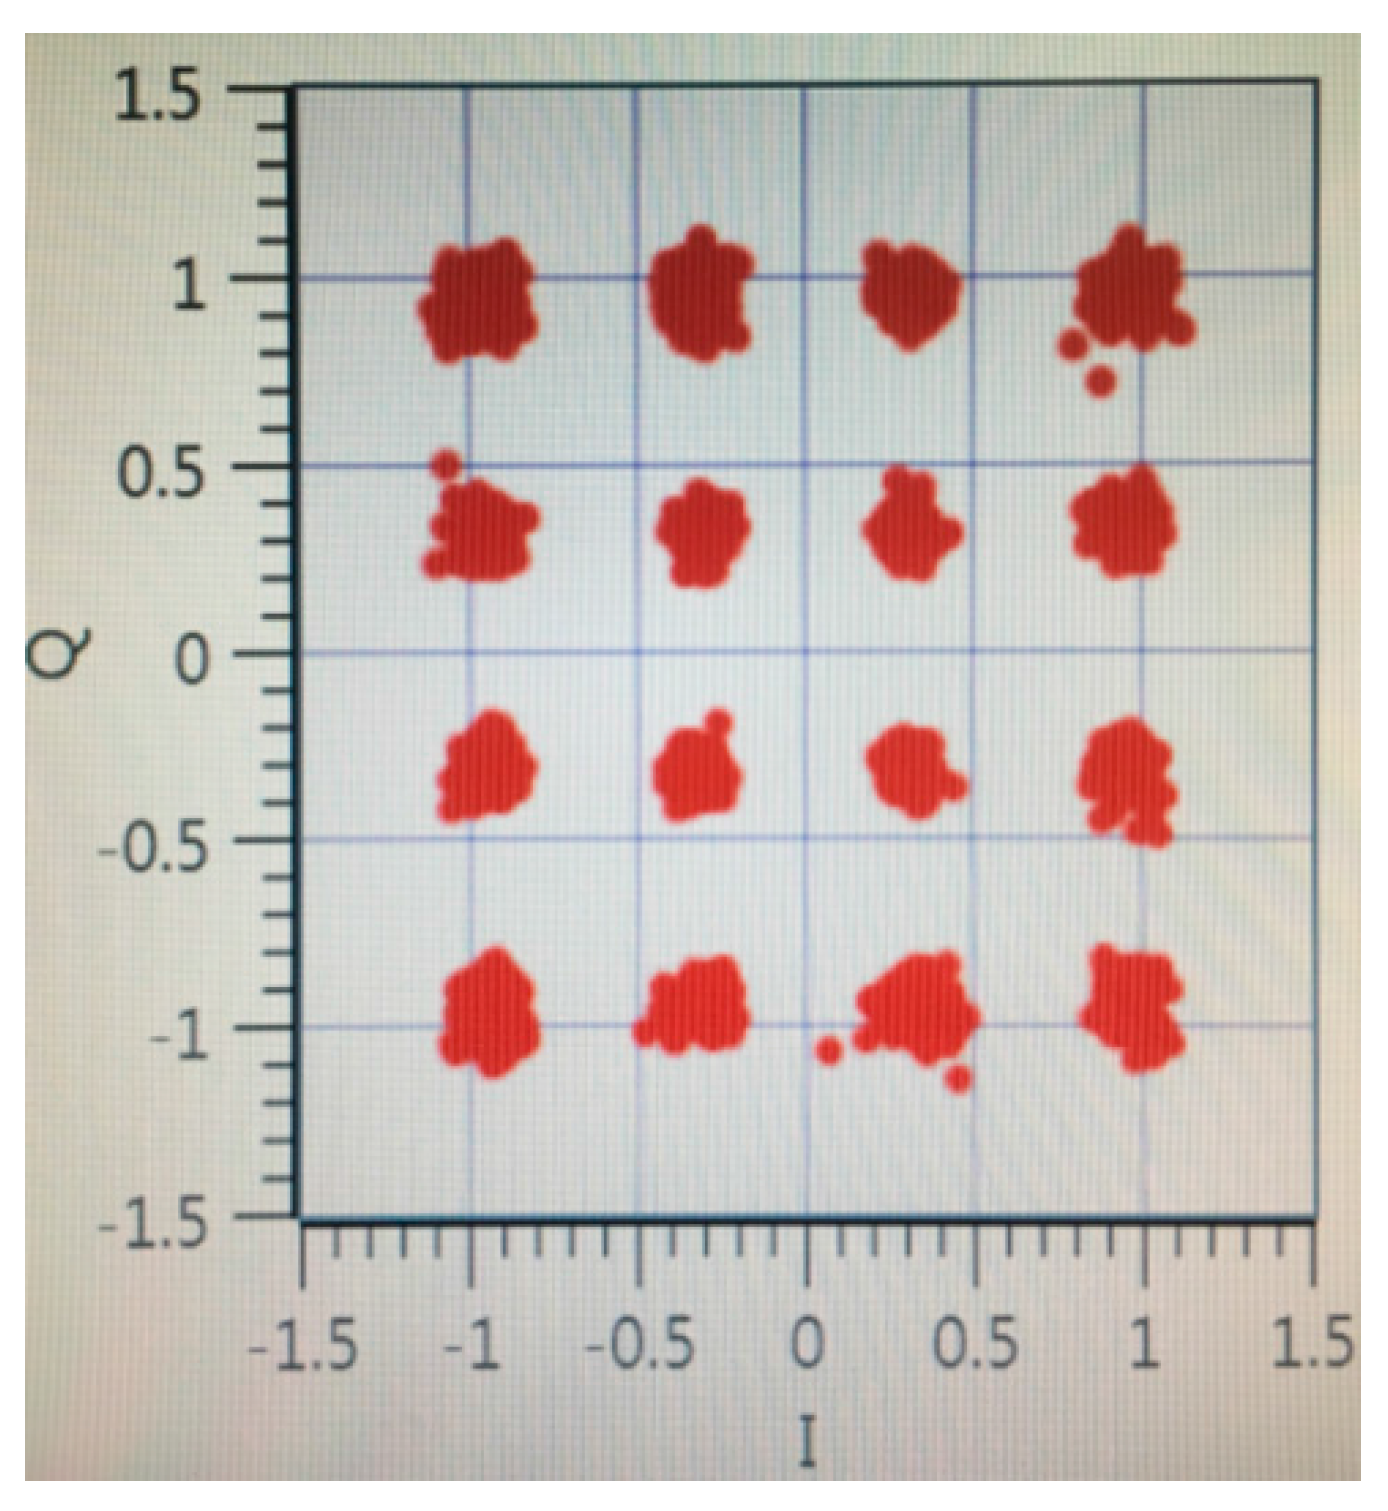
Figure 5 shows the 16 Quadrature Amplitude Modulation (QAM) constellation points to validate the correctness of the measurements.
4. Evaluation Results
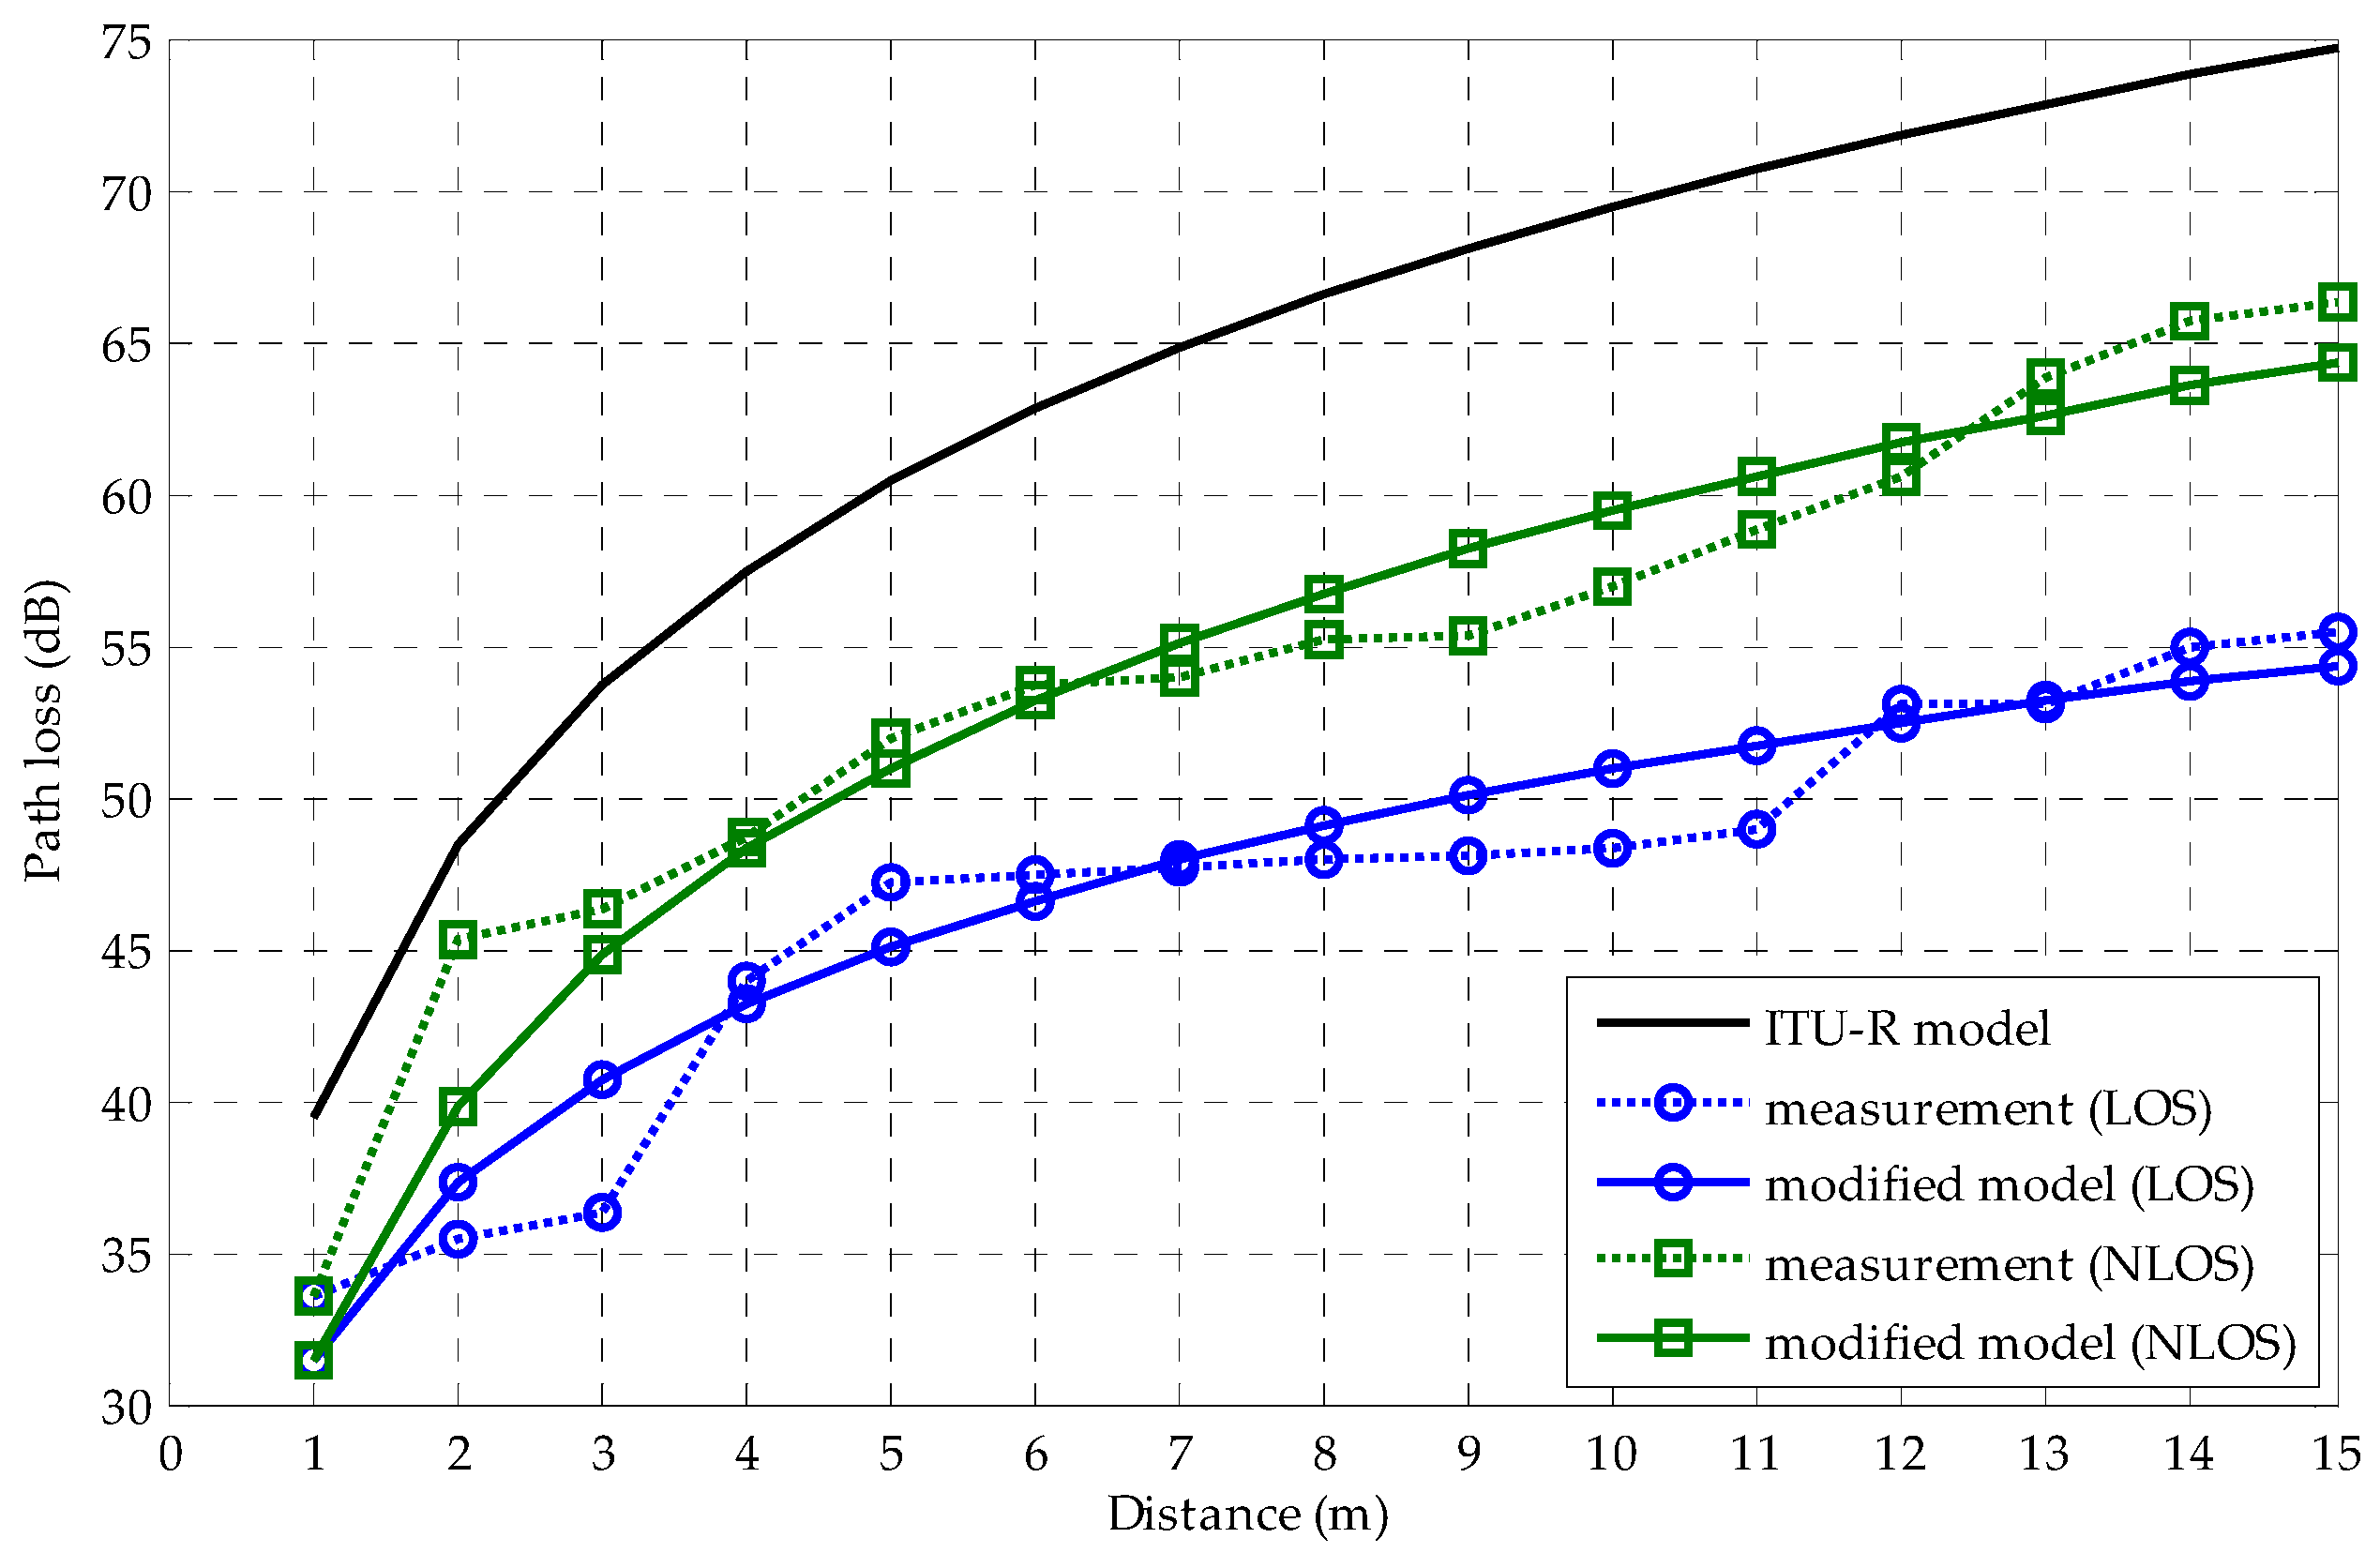
Figure 6 illustrates the modified path loss model obtained from the field trial in the laboratory, where the solid curve is the ITU-R indoor office path loss model; the circle dotted and solid curves are the average LOS path loss measurement and the modified LOS path loss model, respectively; and the square dotted and solid curves are the average NLOS path loss measurement and the modified NLOS path loss model, respectively. The modified LOS and NLOS path loss models are generated by using the linear least square method, fitting the solid curve to the scattered path loss measurements. As shown in
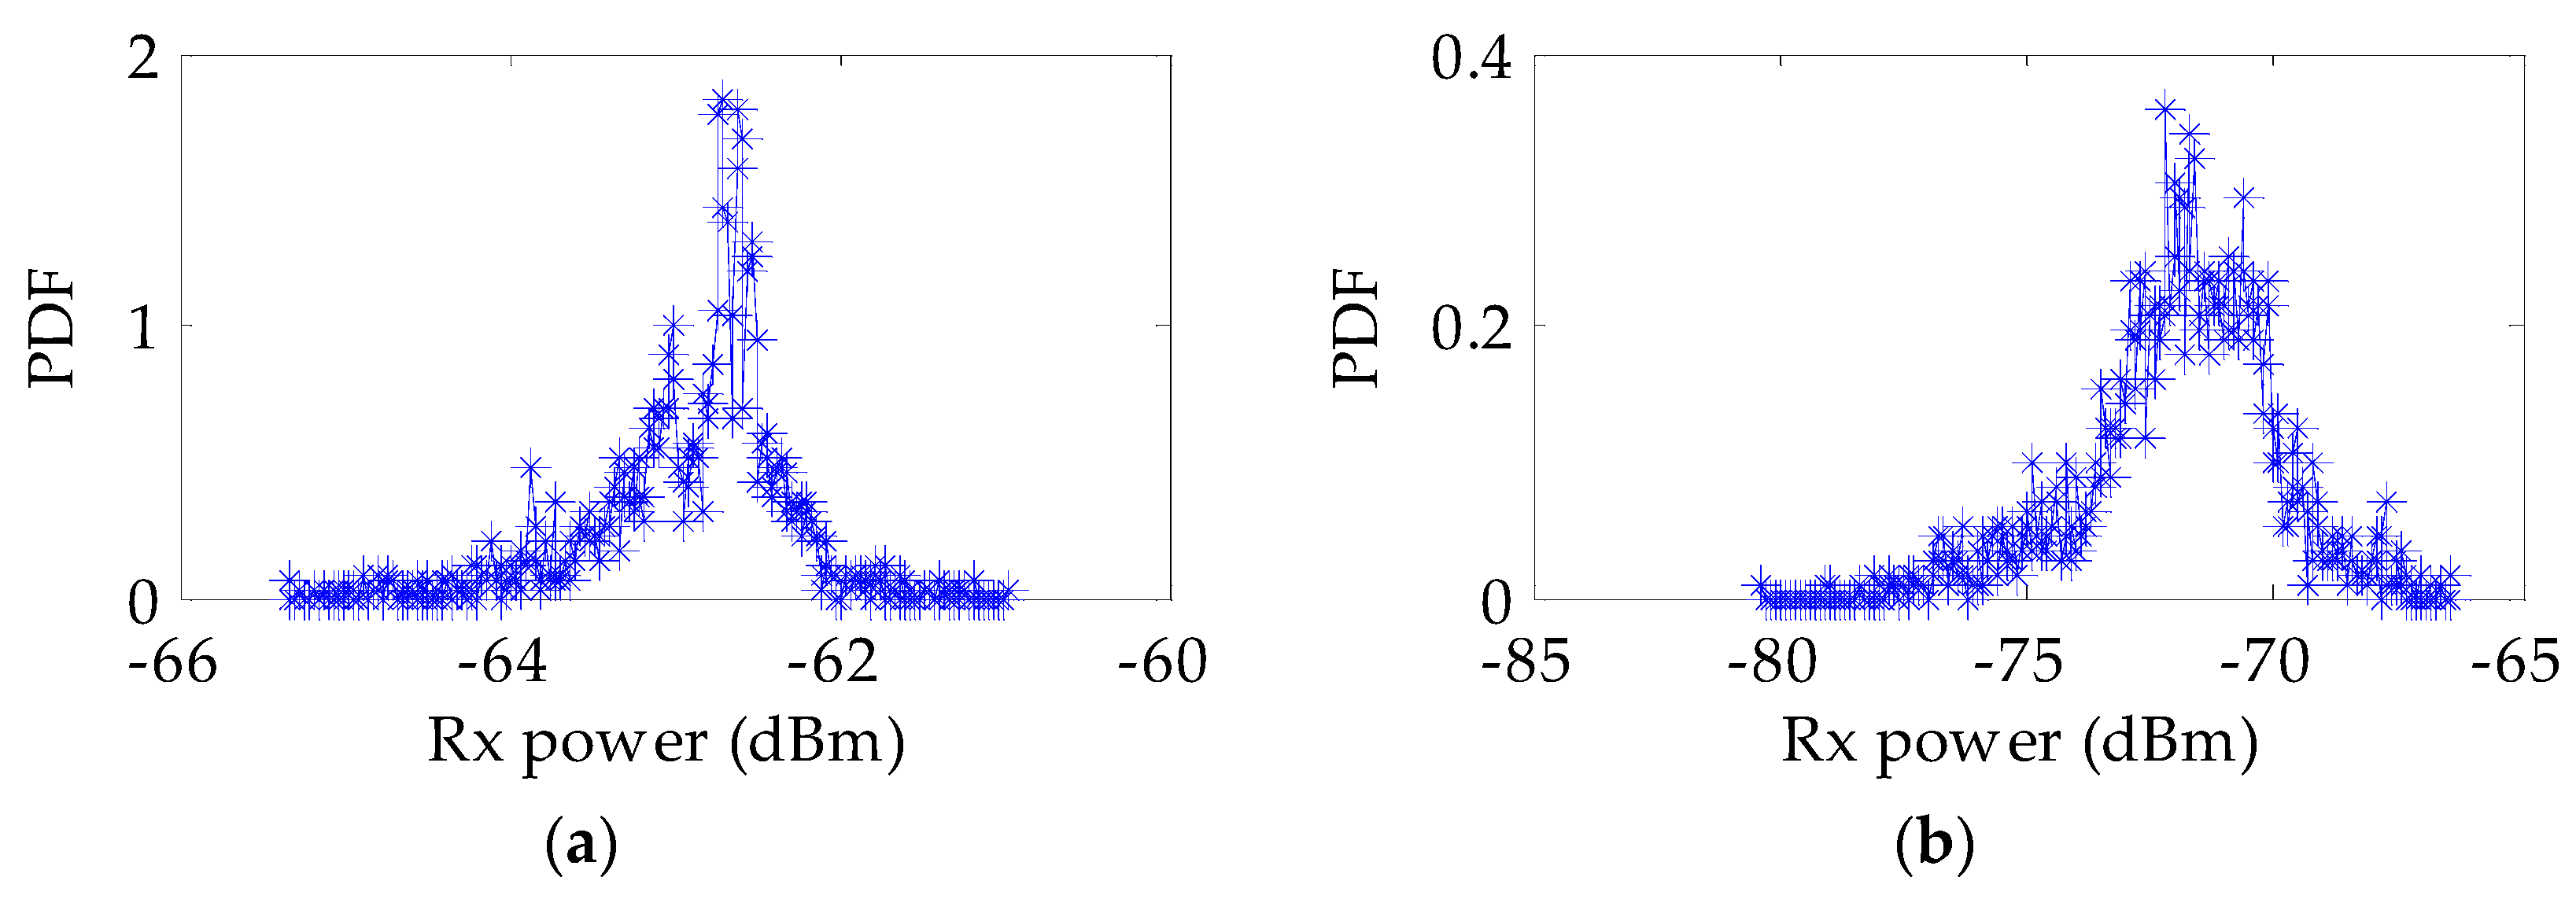
Figure 7a,b, the probability density functions (PDFs) of the receive power are verified to be lognormal distributed for both LOS testing and NLOS testing at a distance of 6 m. The mean and standard deviation for LOS testing are −62.88 dBm and 0.557 dBm, respectively; the mean and standard deviation for NLOS testing are −72.84 dBm and 2.1534 dBm, respectively. The standard deviations of the shadow fading at a distance of 0–15 m for the LOS and NLOS are listed in
Table 2 and
Table 3, respectively, which are obtained from the measured PDF.
Based on the measurement results, the formula of the LOS path loss model is given as:
where the average standard deviation of the received shadow fading signal and the path loss exponent are 0.93 dB and 1.95, respectively. Then, using the average standard deviation and path loss exponent, the FM for 90% SR [
15] is calculated to be about 0 dB.
Now, consider the NLOS results in
Figure 6. The square dotted and solid curves represent the NLOS average path loss measurement and the modified NLOS path loss model, respectively. Based on the measurement results, the formula of the ITU path loss model represented in Equation (1) is modified as:
where the average standard deviation of the received shadow fading signal and the path loss exponent are 2.748 dB and 2.8, respectively. In comparison with Reference [
15], it is noted that the path loss parameters of the measured path loss model are not the same as the ITU path loss model. Finally, using the average standard deviation and path loss exponent, the FM for 90% SR is calculated as 0.728 dB. Based on the previous results, the coverage range could be calculated by using the coverage range model described in
Section 2.2. The parameter represented in Equation (3) is modified as:
Figure 7 shows the probability density function (PDF) of Rx power for (a) LOS and (b) NLOS scenarios at a distance of 6 m. This figure validates the lognormality of the shadowing fading samples in our experiments.
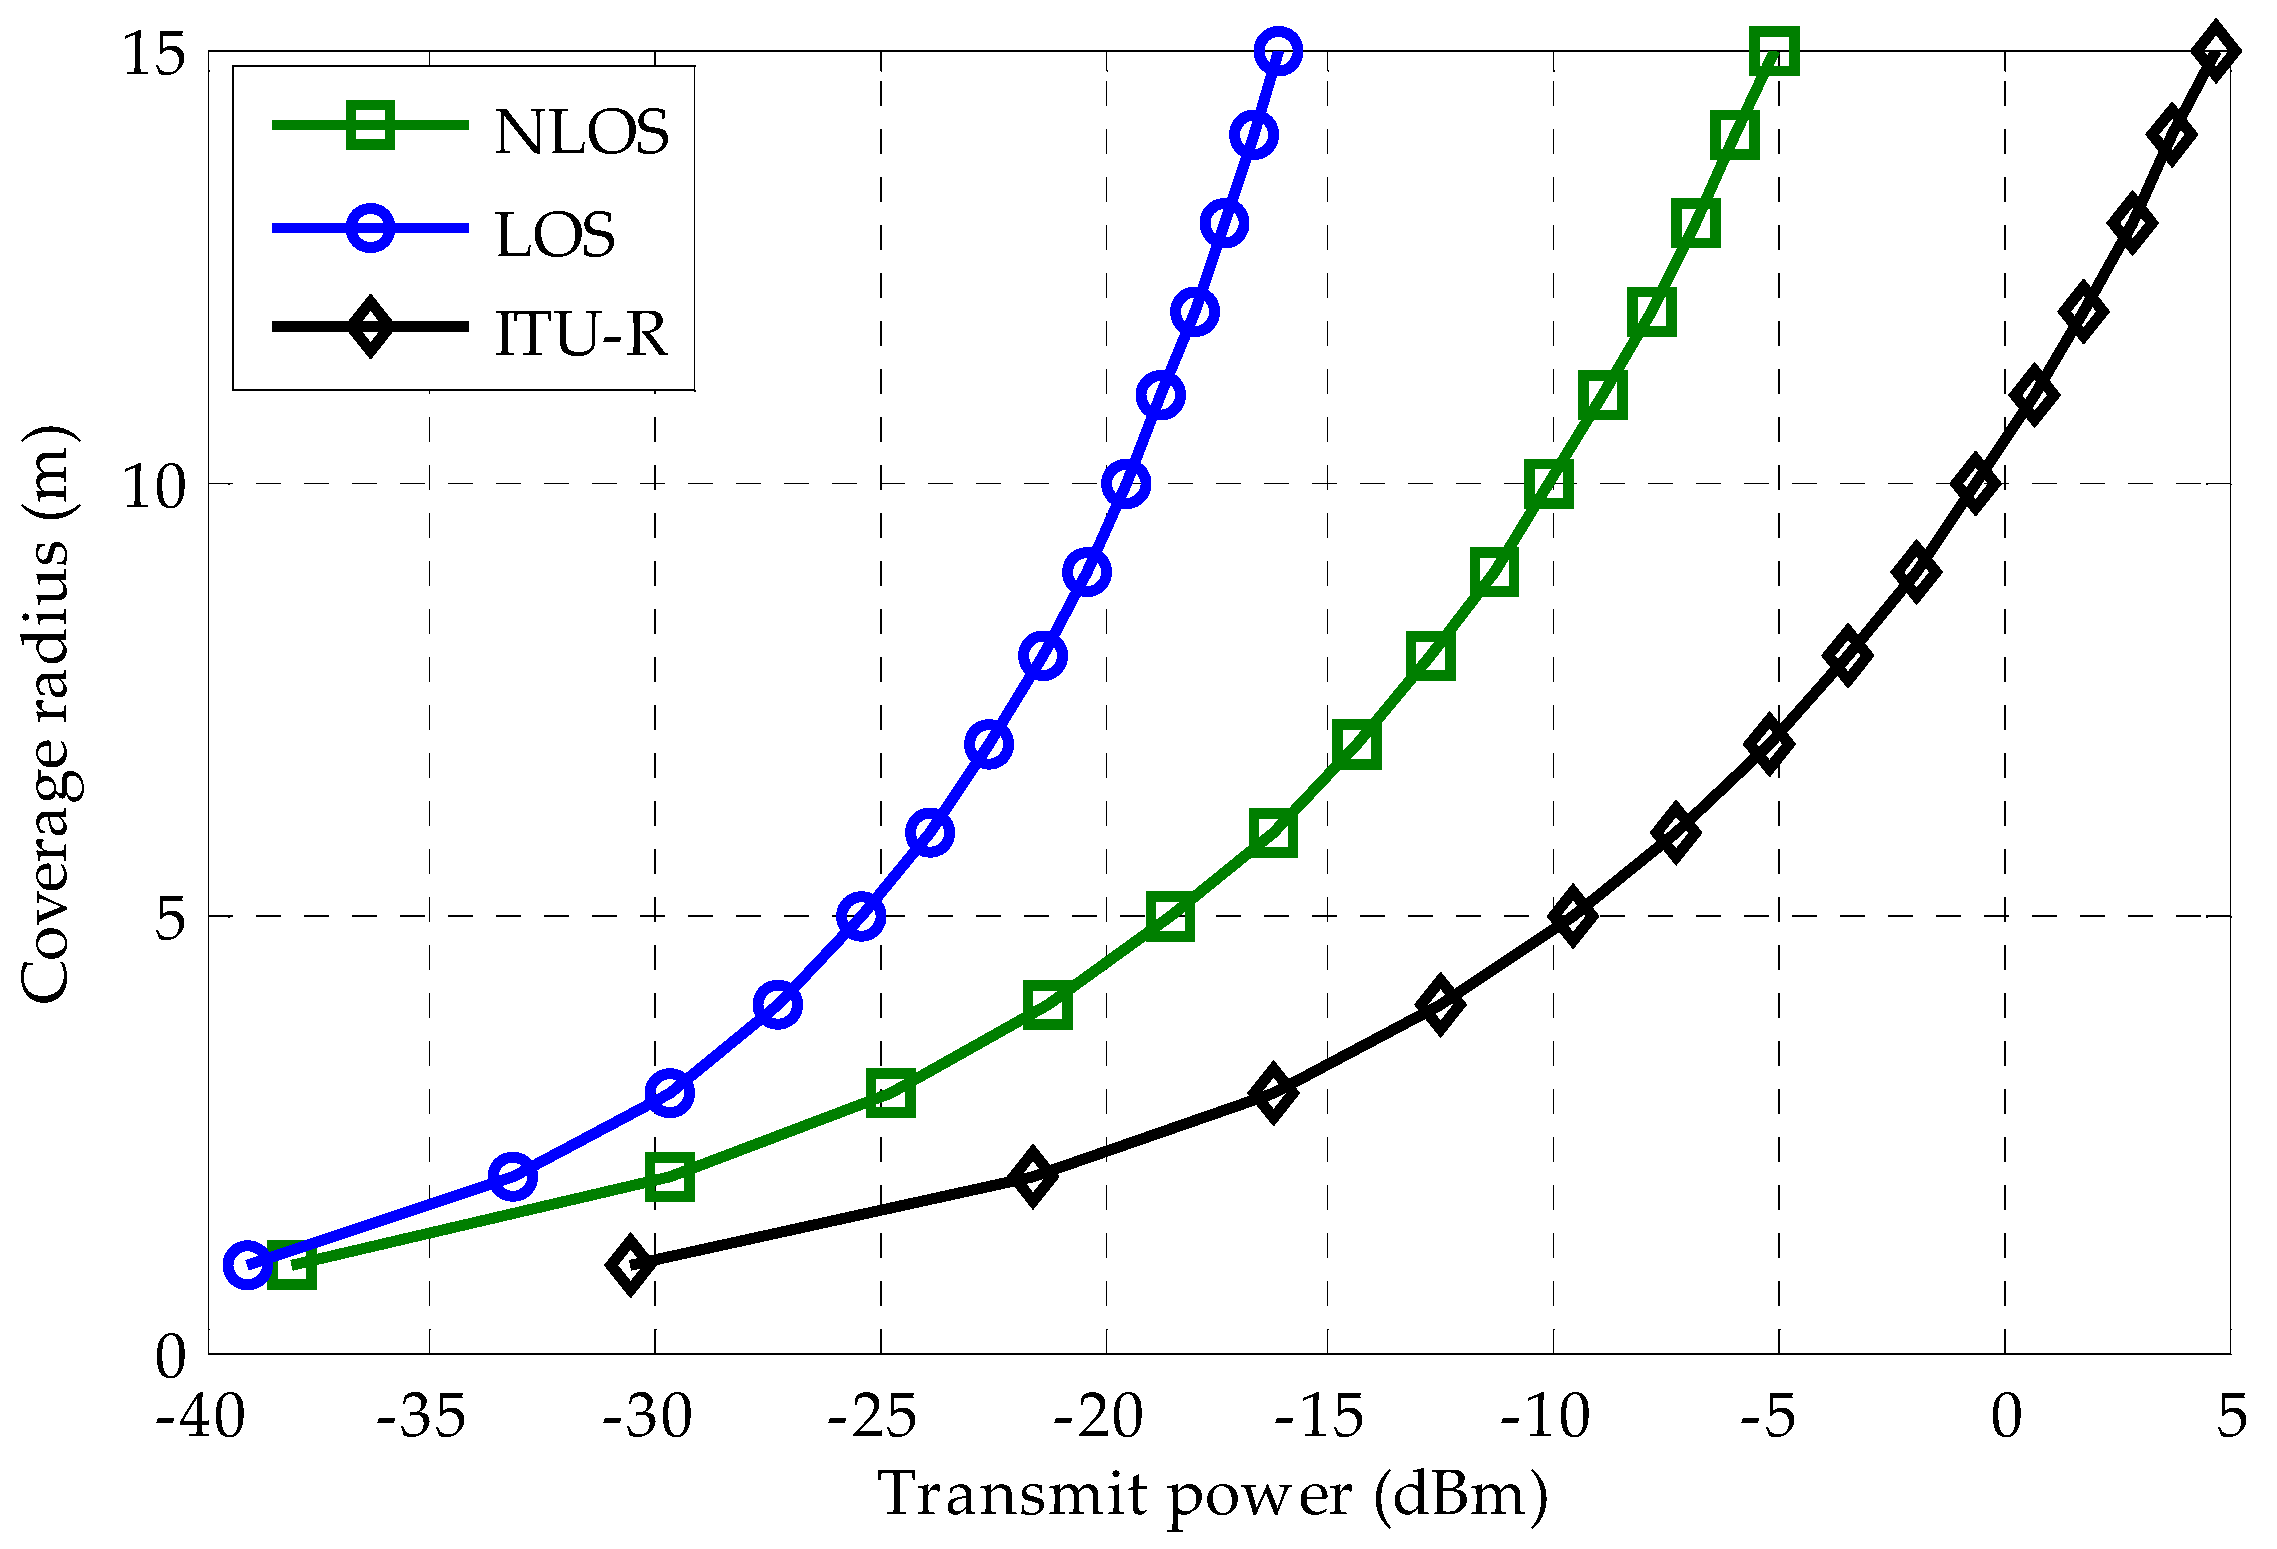
Figure 8 shows the coverage range of the eNB deployed in the laboratory. It is shown that the coverage range increases with the transmit power. Under the same transmit power, the coverage range of the NLOS testing is smaller than the LOS testing. At a coverage range of 10 m, the required transmit power of eNB for LOS testing, NLOS testing and ITU model are −19 dBm, −10 dBm and −1 dBm, respectively.


