1. Introduction
IR imaging based small moving target detection is one of the most significant techniques for military, astronautics and aeronautics applications [
1]. The performance of an infrared search and track (IRST) system highly relies on the precision of small target detection. A high-performance IR small target detection algorithm should remove the background clutters effectively and examine the real targets not only in a single frame, but also in consecutive frames. Moreover, motion trajectories need to be delineated, which makes it easier to monitor and capture the targets of interest. Although modern IR detectors possess the advantages of fast detection, cheap equipment and simple setup [
2], the specific imaging mechanism and detection condition still result in the following inherent properties of IR images which cause much inconvenience for target detection [
3,
4,
5]. On the one hand, IR imaging is based on IR radiation, so the target/background contrast may be weak if their radiometric quantities are similar. Furthermore, it is an inevitable fact that pixel size of the existing IR cameras cannot be small enough to generate high-resolution images, which means the images to be processed are always blurred. In addition, the target size becomes comparatively small (fewer than 20 × 20 pixels) on account of the long military observation distance.
To efficiently examine small moving targets and remove various sorts of background clutters in IR images simultaneously, numerous algorithms have been developed so far, including filter based methods, mathematical morphology based methods, wavelet based methods, and so on. Filter based methods, the representatives of which are max-mean/max-median filter [
6], high-pass filter [
7] as well as two-dimensional least mean square (TDLMS) filter [
8], utilize fixed templates to suppress clutters according to intensity difference. Although they can meet the requirement of real-time processing, the results are always inaccurate [
9,
10]. Mathematical morphology theory, like Hat transformation (including top-hat and bottom-hat transformation) [
11], is another embranchment in the field of small target detection. These kinds of methods are aimed at enhancing regions of interest via morphological operations, but usually fails when the target is dim or the clutter is heavy [
12,
13]. Wavelet based algorithms [
14] design a group of filters which are matched to a point spread function (PSF) at different scales by choosing a mother wavelet similar to PSF. Unfortunately, they are quite time-consuming and the false alarm rates are always high [
15].
Although much progress has been achieved in the past decades, there are some significant problems that remain to be worthy of further investigation: on the one hand, dark target whose IR radiation is lower than the surroundings is seldom covered in previous algorithms; furthermore, using motion features to eliminate false alarms created in the single frame and forming complete trajectories are still tough tasks.
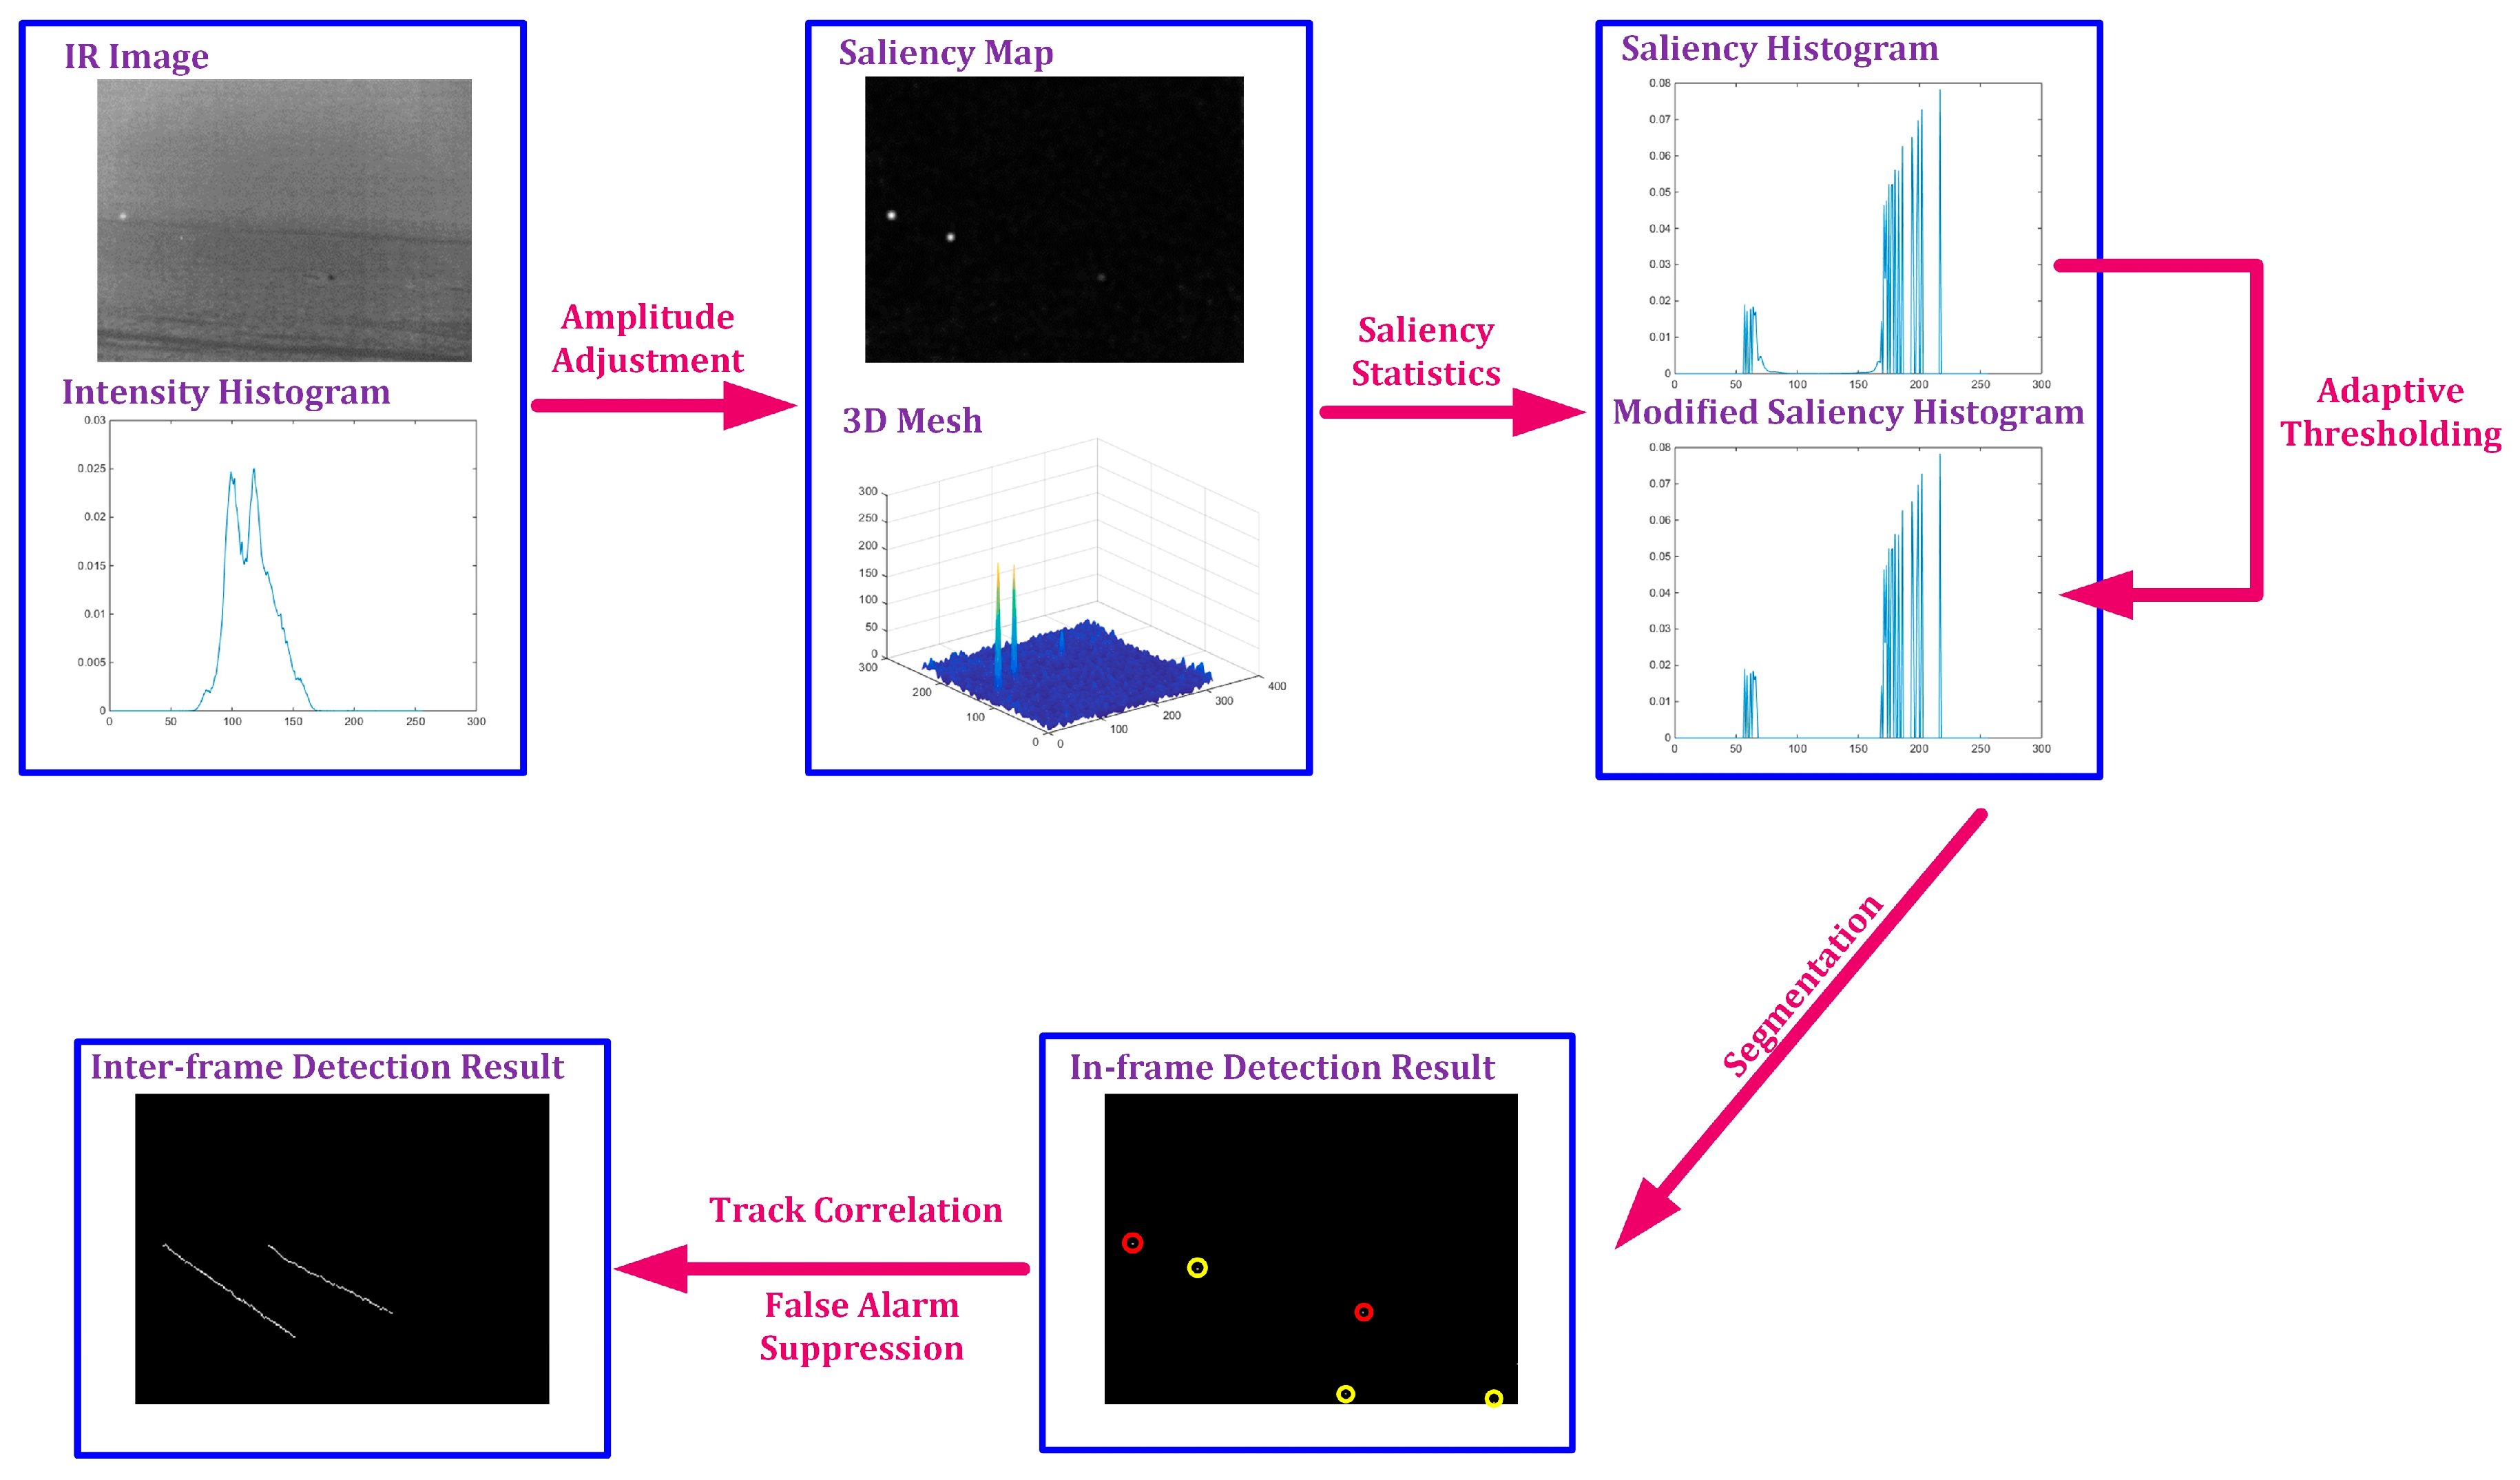
In this paper, we first present a new saliency histogram on the basis of a saliency map to distinguish visually salient regions from the background. Based on the fact that both bright and dark IR small targets have relatively different grayness with the background, proving IR small targets can be seen as salient regions in IR images, the gray levels correspond to targets would be assigned with large bin values in the saliency histogram. Then, an adaptive threshold is calculated via Otsu’s method [
16,
17,
18] to roughly extract IR targets according to the above-constructed histogram, and sub-pixel-accuracy centroid coordinates of all of the candidate target regions are obtained through a connected components labeling algorithm and an intensity-weighted criterion. For consecutive frames, we apply a uniformly accelerated motion model to make track correlations [
19] and form completed motion trails for each candidate point. Then, the real small moving targets can be picked out from all the correlated points by use of the potential geometrical invariability existing in the sequences.
Figure 1 gives an illustration of the framework of our method.
In conclusion, we argue that the main contribution of our work is to come up with an IR small moving target detection method that is suitable for both bright and dark targets and has a high detection accuracy under different conditions.
3. Inter-Frame Detection Based on Geometrical Invariability
3.1. Track Correlation
Within a short time, the motion of a small moving target can be described with a uniformly accelerated motion model [
25], which is applied to implement track correlation and form completed trajectories in our inter-frame detection.
Assume the space coordinates of all the candidate points in an arbitrary frame compose a set , where represents the frame number and n is the total number of candidate points in that frame. Here, we just take the m-th candidate point as an example to explain the process of track correlation.
First, the velocity
and acceleration
of
are written as
where
means the time interval. For two adjacent frames,
.
Next, based on the uniformly accelerated motion model, the estimated position
of
in the (
+ 1)-th frame is predicted as
where
denotes the displacement of background in the two adjacent frames. In this paper, we only consider the rotation and translation displacement caused by camera motion, and
is calculated by an automatic registration method introduced in Ref. [
26].
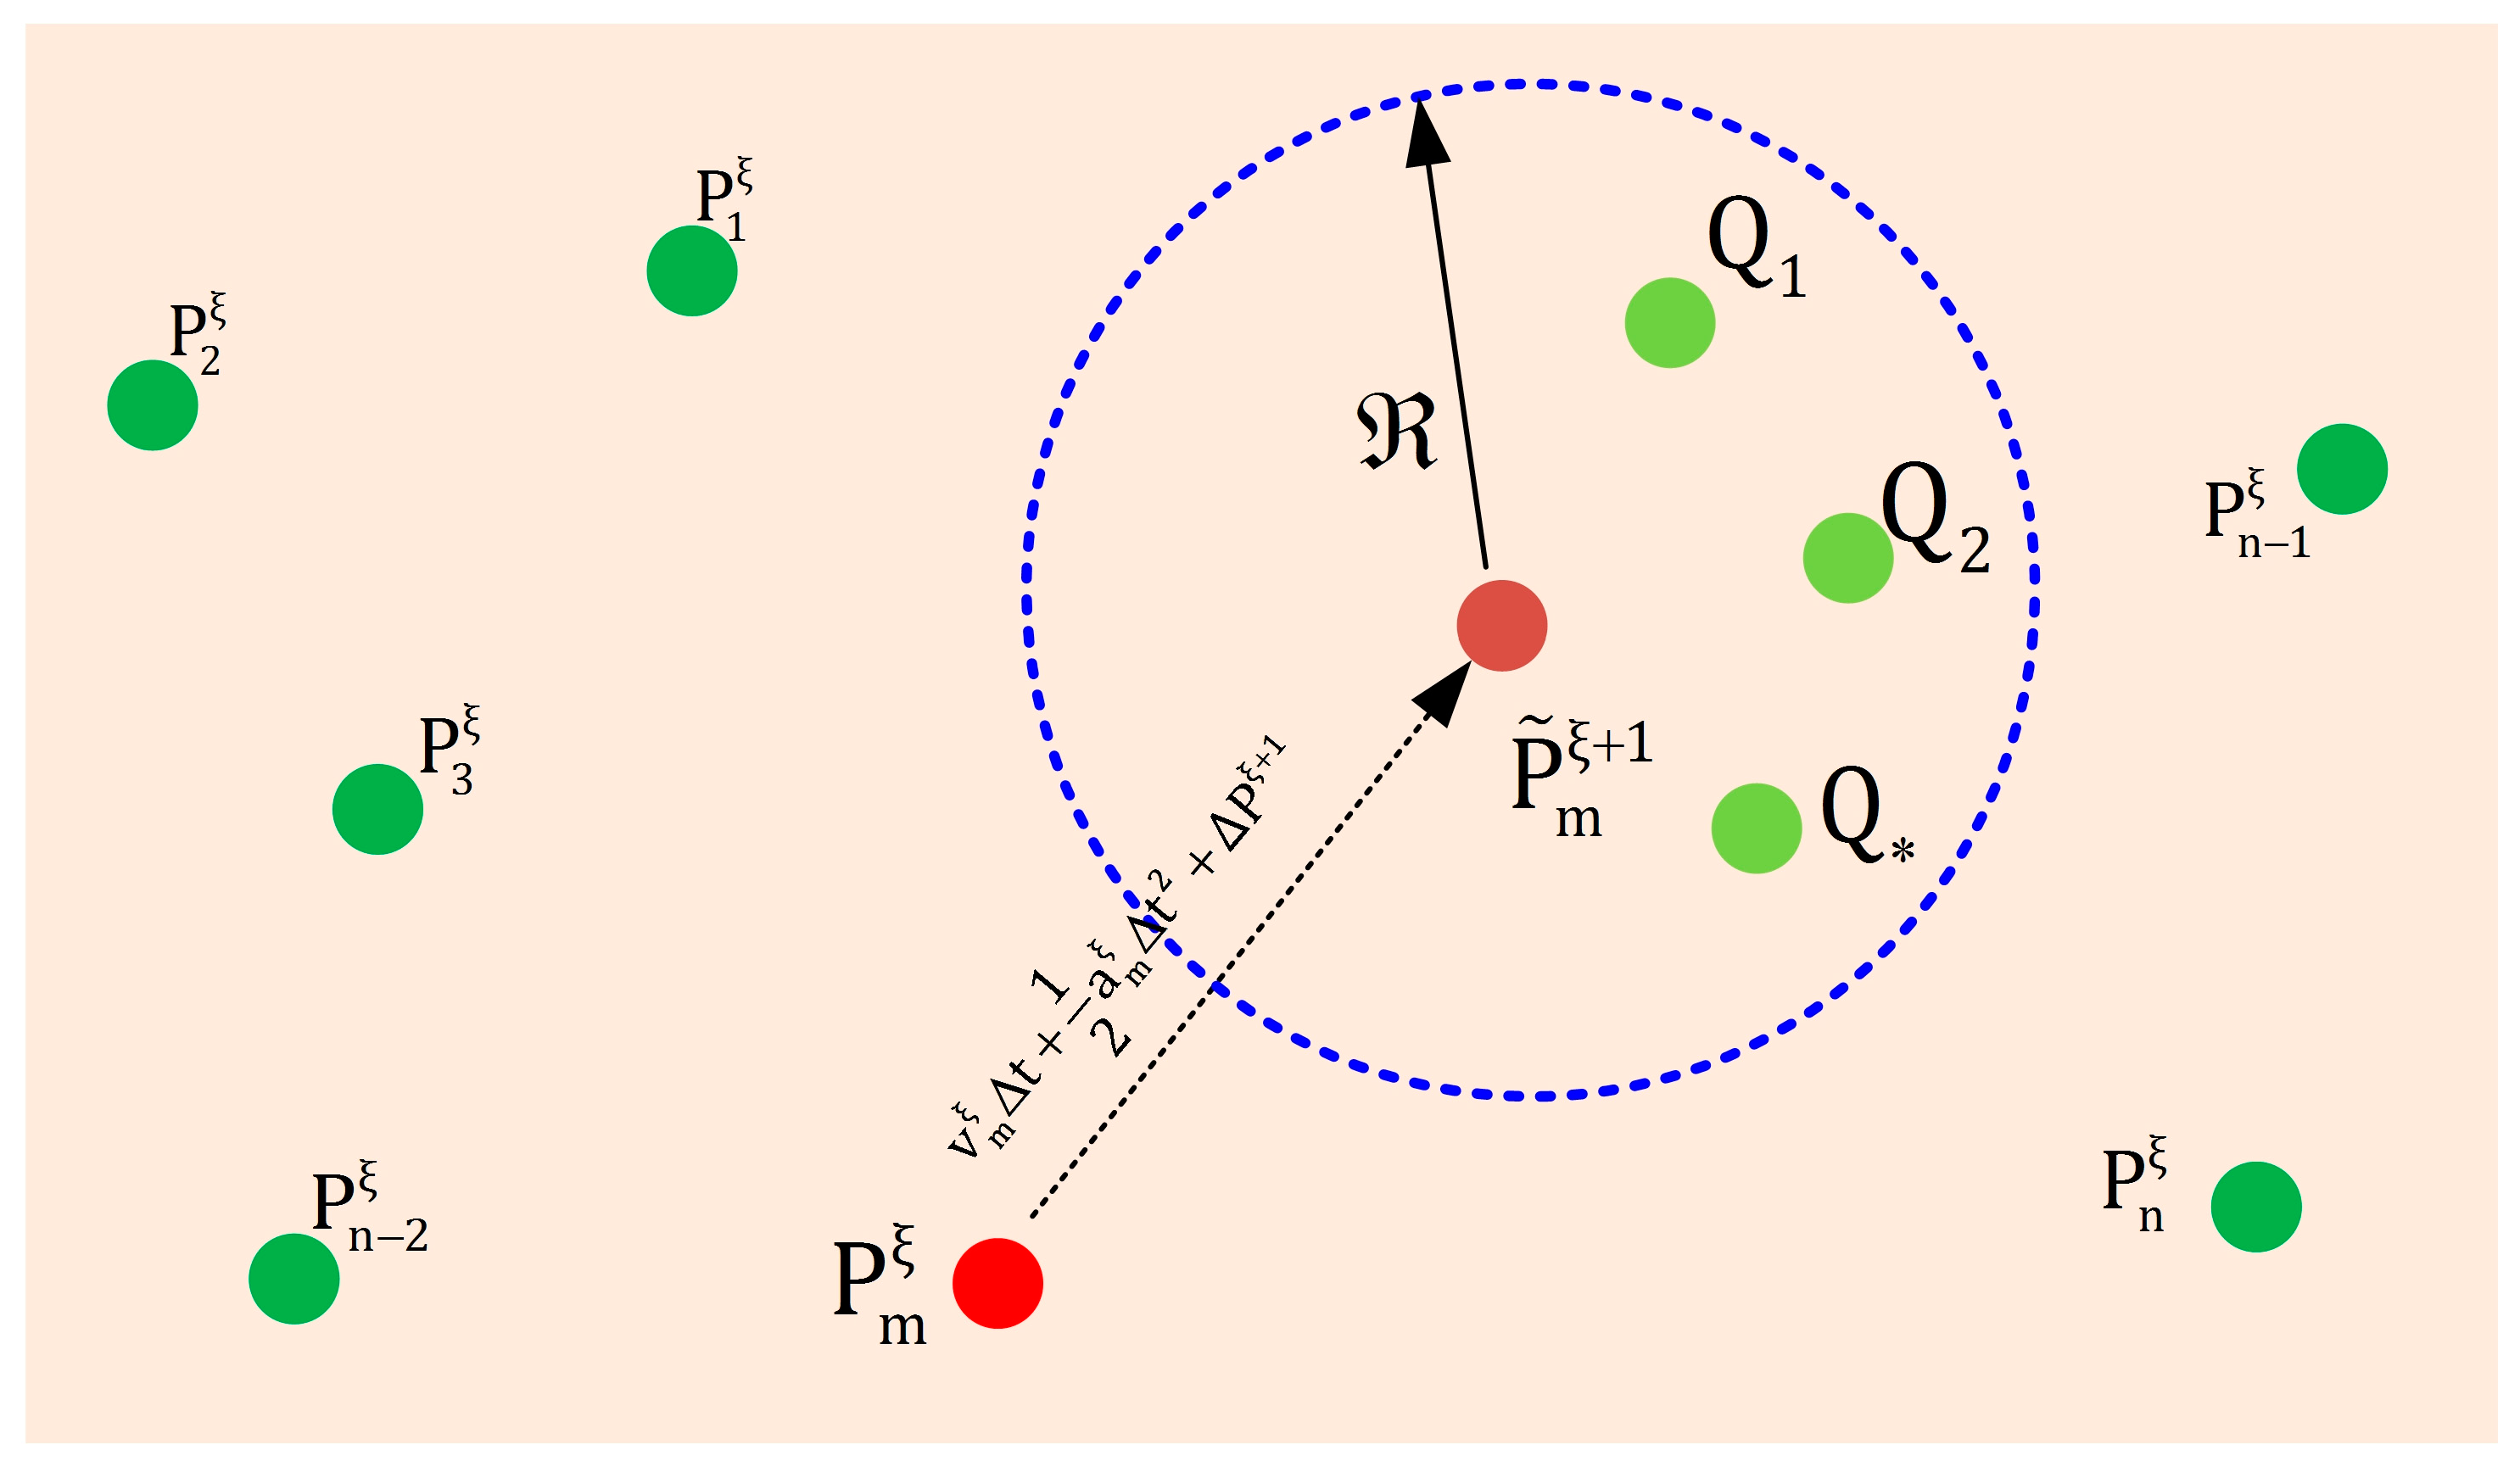
Furthermore, as is shown in
Figure 3, a circular gate whose radius is
(we take
empirically) is set at
. In the (
+ 1)-th frame, all of the candidate points (represented by the light green dots) located inside the gate make up of another set
where t is the quantity of candidate points inside the gate and the point
is the maximum bin value in the saliency histogram is selected as the correlated one for
(if there is more than one point located inside the gate). Thus, a complete trajectory of
can be established if the above-discussed track correlation is repeated in every frame.
3.2. False Alarm Suppression
The procedure of track correlation presented above is implemented for each candidate point detected in the first frame and lasts for L frames. However, a formed trajectory would be eliminated on the condition that we cannot find the next correlated point for it in the following frames continuously. In this paper, we uniformly set L = 20 and .
For each candidate point in the L-th frame, two maps can be constructed: points in the -th frame, where this candidate point is correlated successfully for the first time, being seen as dots, and the Euclidean distances between each other, being seen as edges, compose the first map; those of the L-th frame (these points should also exist in the -th frame) compose the second map.
Here, we demonstrate a fact that the distance between two background points remains constant regardless of the rotation and translation of background. An assumption is made that the rotation angle and the translation distance for the two maps defined above are
and
, and the rotation center is
. As a result, for the n-th point
in the first map and
in the second map, there is an equation existing obviously:
where
means the rotation matrix and
Based on Equations (15) and (16), the Euclidean distance between two background points,
and
in the second map, can be expressed as
where
stands for 2-norm. Under the circumstance that
and
are two background points, there are no other displacements for them except for the translation of background
. It is absolutely true that rotation cannot change the length of a vector, so Equation (17) can be further written as
In contrast, if
is a moving target point while
is a background point,
may have an extra displacement
caused by self-motion, which means Equation (18) needs to be modified as
Therefore, a conclusion can be summarized that the distance between two background points is constant, i.e., there is a geometrical invariability between background points. However, if there is at least a moving target point among them, the distance is changed. Motivated by this regulation, we propose a geometrical invariability based false alarm suppression method below. For the n-th candidate point in the second map, an index
denoting the difference of relative position is developed to judge whether
is a real moving target or a false alarm:
where N is the number of trajectories in the second map.
Lastly, the judge criterion is defined as follows:
where thr is a threshold and it is set as
. We take
uniformly in our method.
4. Experiments and Analyses
We briefly introduce the test sequences used in our simulations, and then make comparisons of the results of both in-frame detection and inter-frame detection with several state-of-the-art algorithms to prove the robustness and precision of our algorithm under different natural backgrounds.
4.1. Introduction of Datasets
Four IR video sequences, captured by mid-wave infrared (MWIR) refrigerant imagers at a frame rate of 25 fps, are selected as our datasets for analysis.
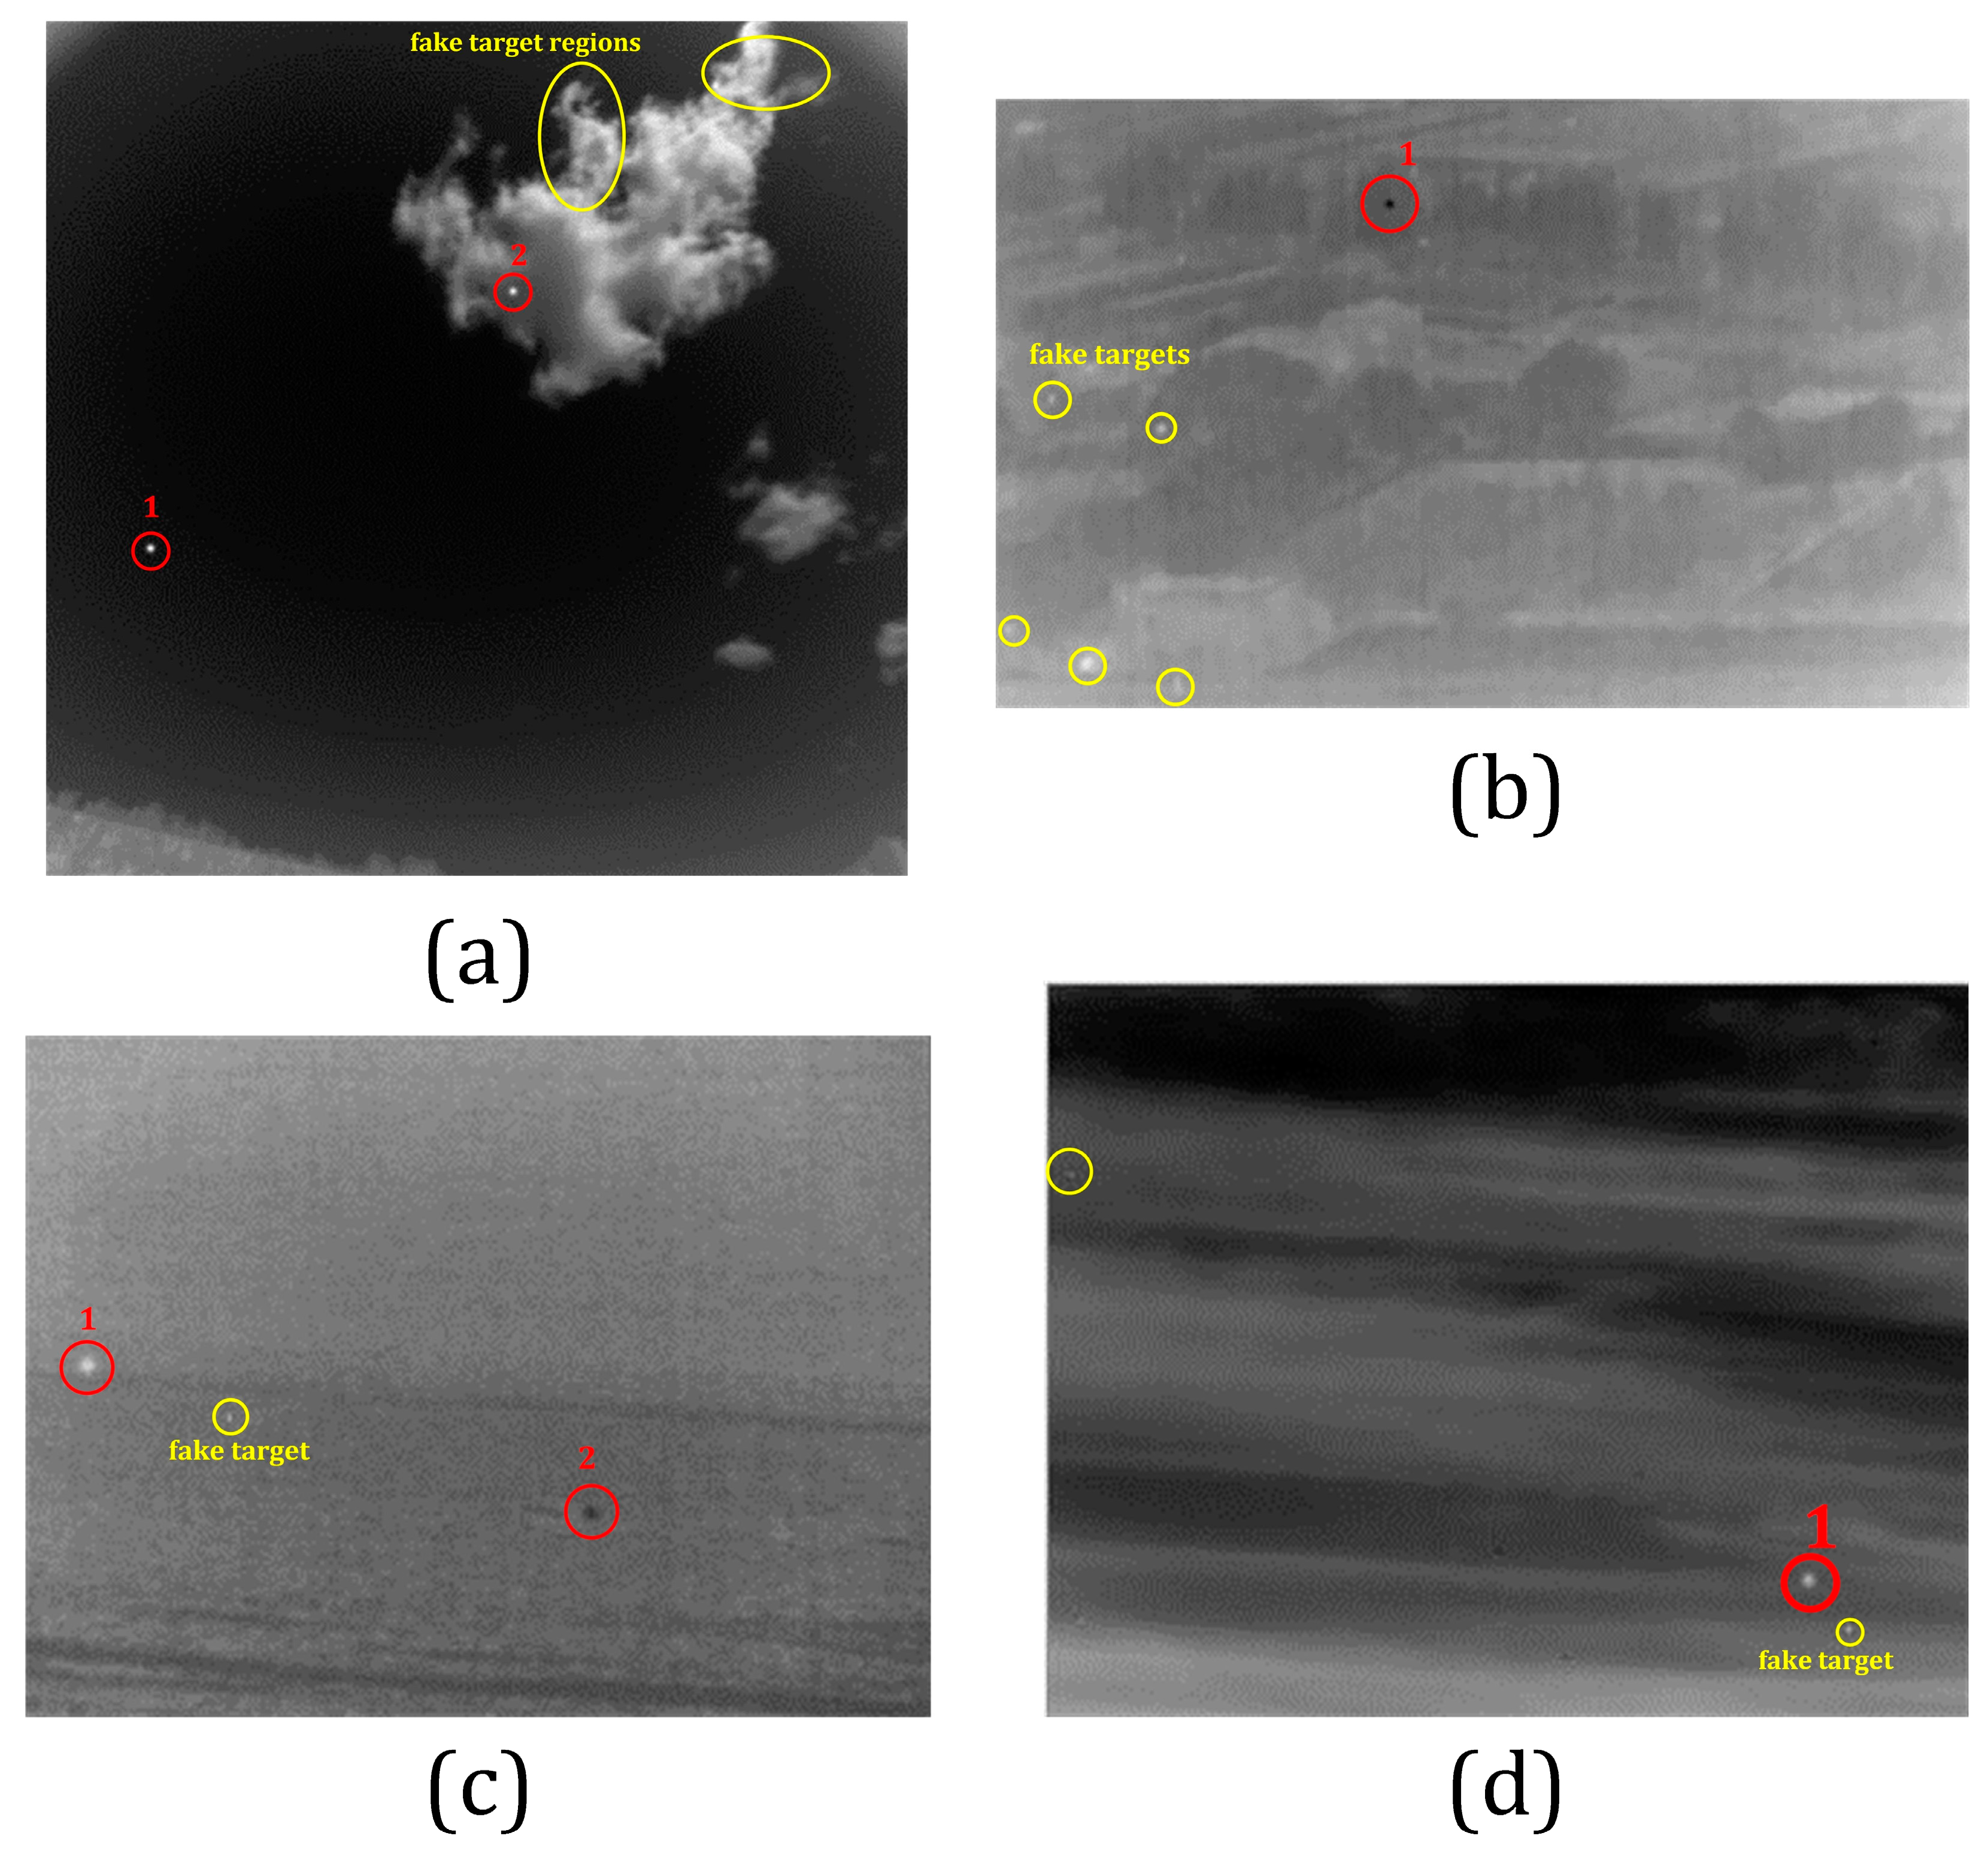
Table 1 shows the detailed information of these sequences and the corresponding first frames are displayed in
Figure 4, where real moving targets that need to be detected are marked with red circles, and the fake targets, as well as the regions that may possibly generate false alarms, are marked with yellow circles.
The sky background of Seq.1 is clear, but the cloud regions are of great inhomogeneity of intensity, which means interference of cloud edge is the main source of false alarms. Among these four groups, Seq.2 and Seq.3 contain dark IR small targets, improving the difficulty and complexity of detection to some extent. Those bright but still points existing around the hills and houses in Seq.2 are fake targets, and it is quite hard to distinguish these kinds of points in a single frame. The sea waves are also very challenging for small target detection because the edges of waves are difficult to be suppressed by filtering based algorithms, and the motion of waves also cause much difficulty for the inter-frame detection. In addition, a dead point caused by the detector itself always exists during the whole sequence, which is a tough task for us to address. Seq.4 has a moving background and the cloud layer is quite dense. In addition, there are a certain number of dead pixels due to the poor quality of imaging.
4.2. Experimental Results of In-Frame Detection
First of all, this section is organized to show the processing results by our algorithm and the four other conventional algorithms. Then, several metrics are applied to make a quantitative comparison.
We choose the four groups of IR images shown in
Figure 4 as the tested samples to perform the experiment. Meanwhile, four state-of-the-art algorithms: Max-Mean, Butterworth high-pass (BHP), Hat transformation (including Top-hat and Bottom-hat transformations) and two-dimensional least mean square (TDLMS) are selected to compare with our method. For Max-Mean, the raw IR image is filtered by a max-mean filter, and the filtered output is subtracted from the original image to enhance the IR small target. Furthermore, specific frequency components belonging to IR targets are extracted by setting a specific cut-off frequency of the Butterworth high-pass filter in the BHP method. Hat transformation denotes the pixel-wise difference between the raw image and the resulting image processed by morphological opening or closing operation. It should be noted that Top-hat transformation is designed for detecting bright targets while Bottom-hat transformation is designed for dark targets. As a result, Bottom-hat transformation is implemented in Seq.2 while Top-hat transformation is implemented in other sequences. Lastly, TDLMS detects small targets in the way of calculating the difference between the original image and the background estimation.
Figure 5,
Figure 6,
Figure 7 and
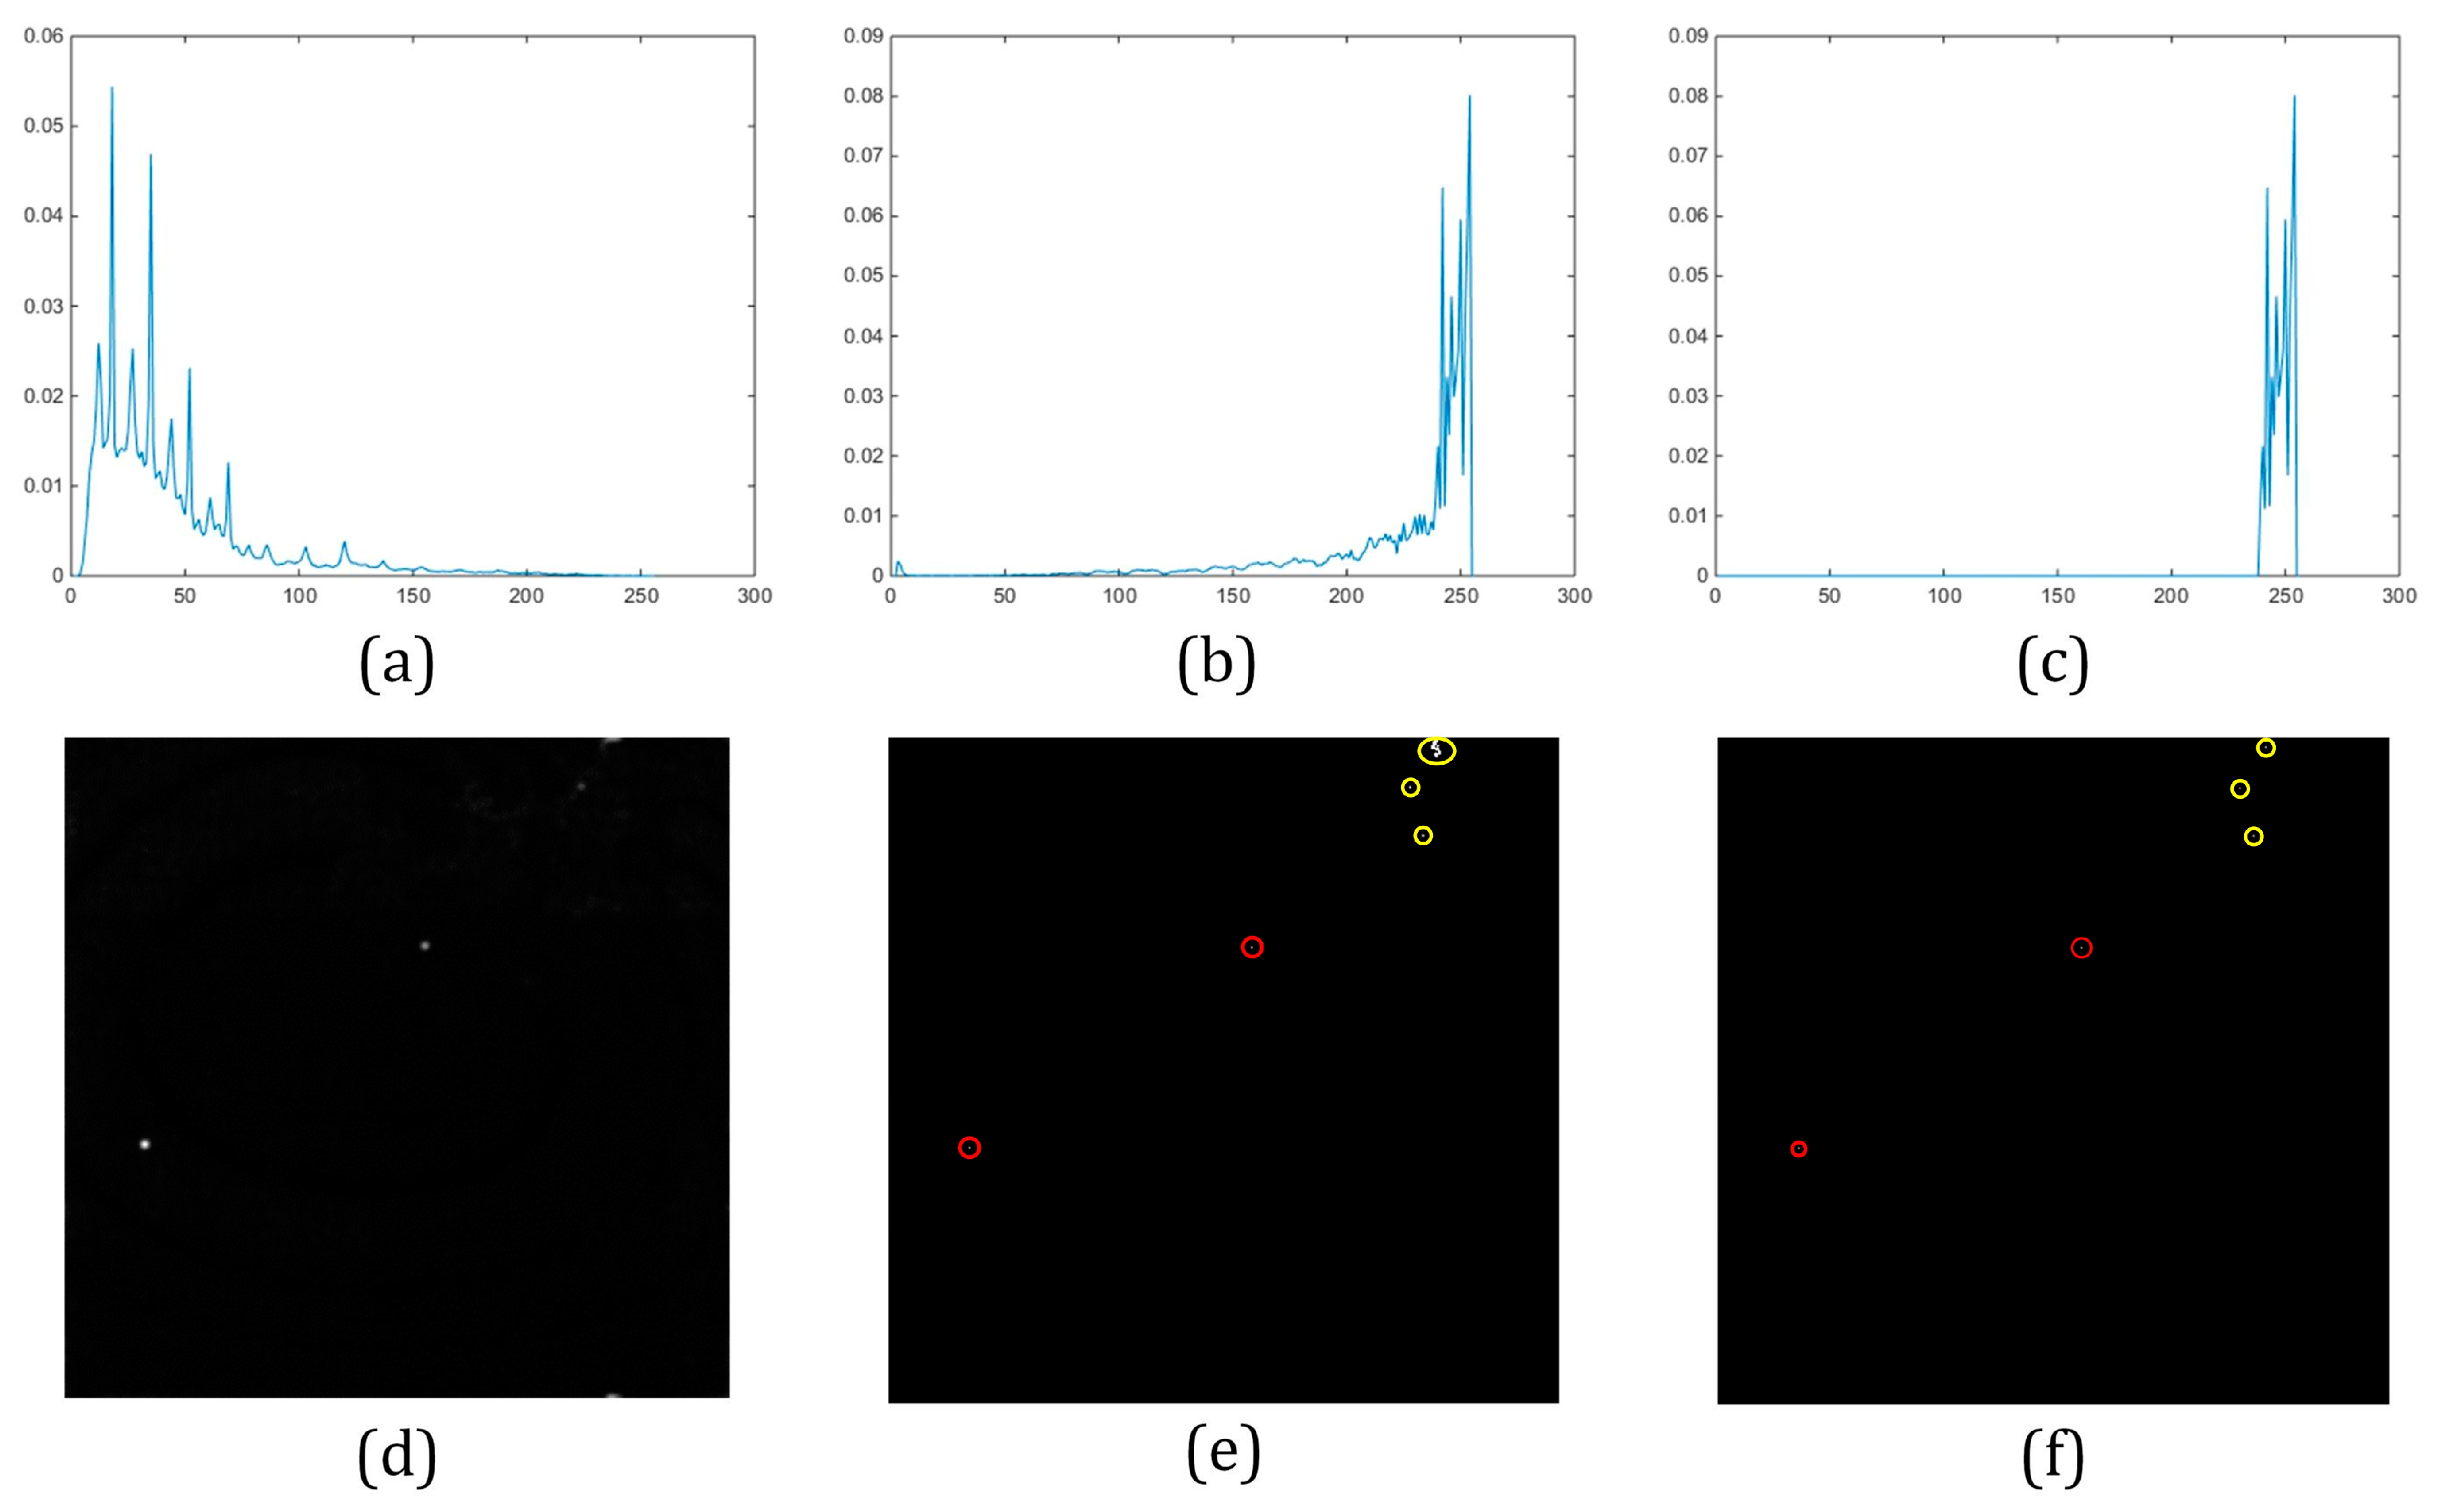
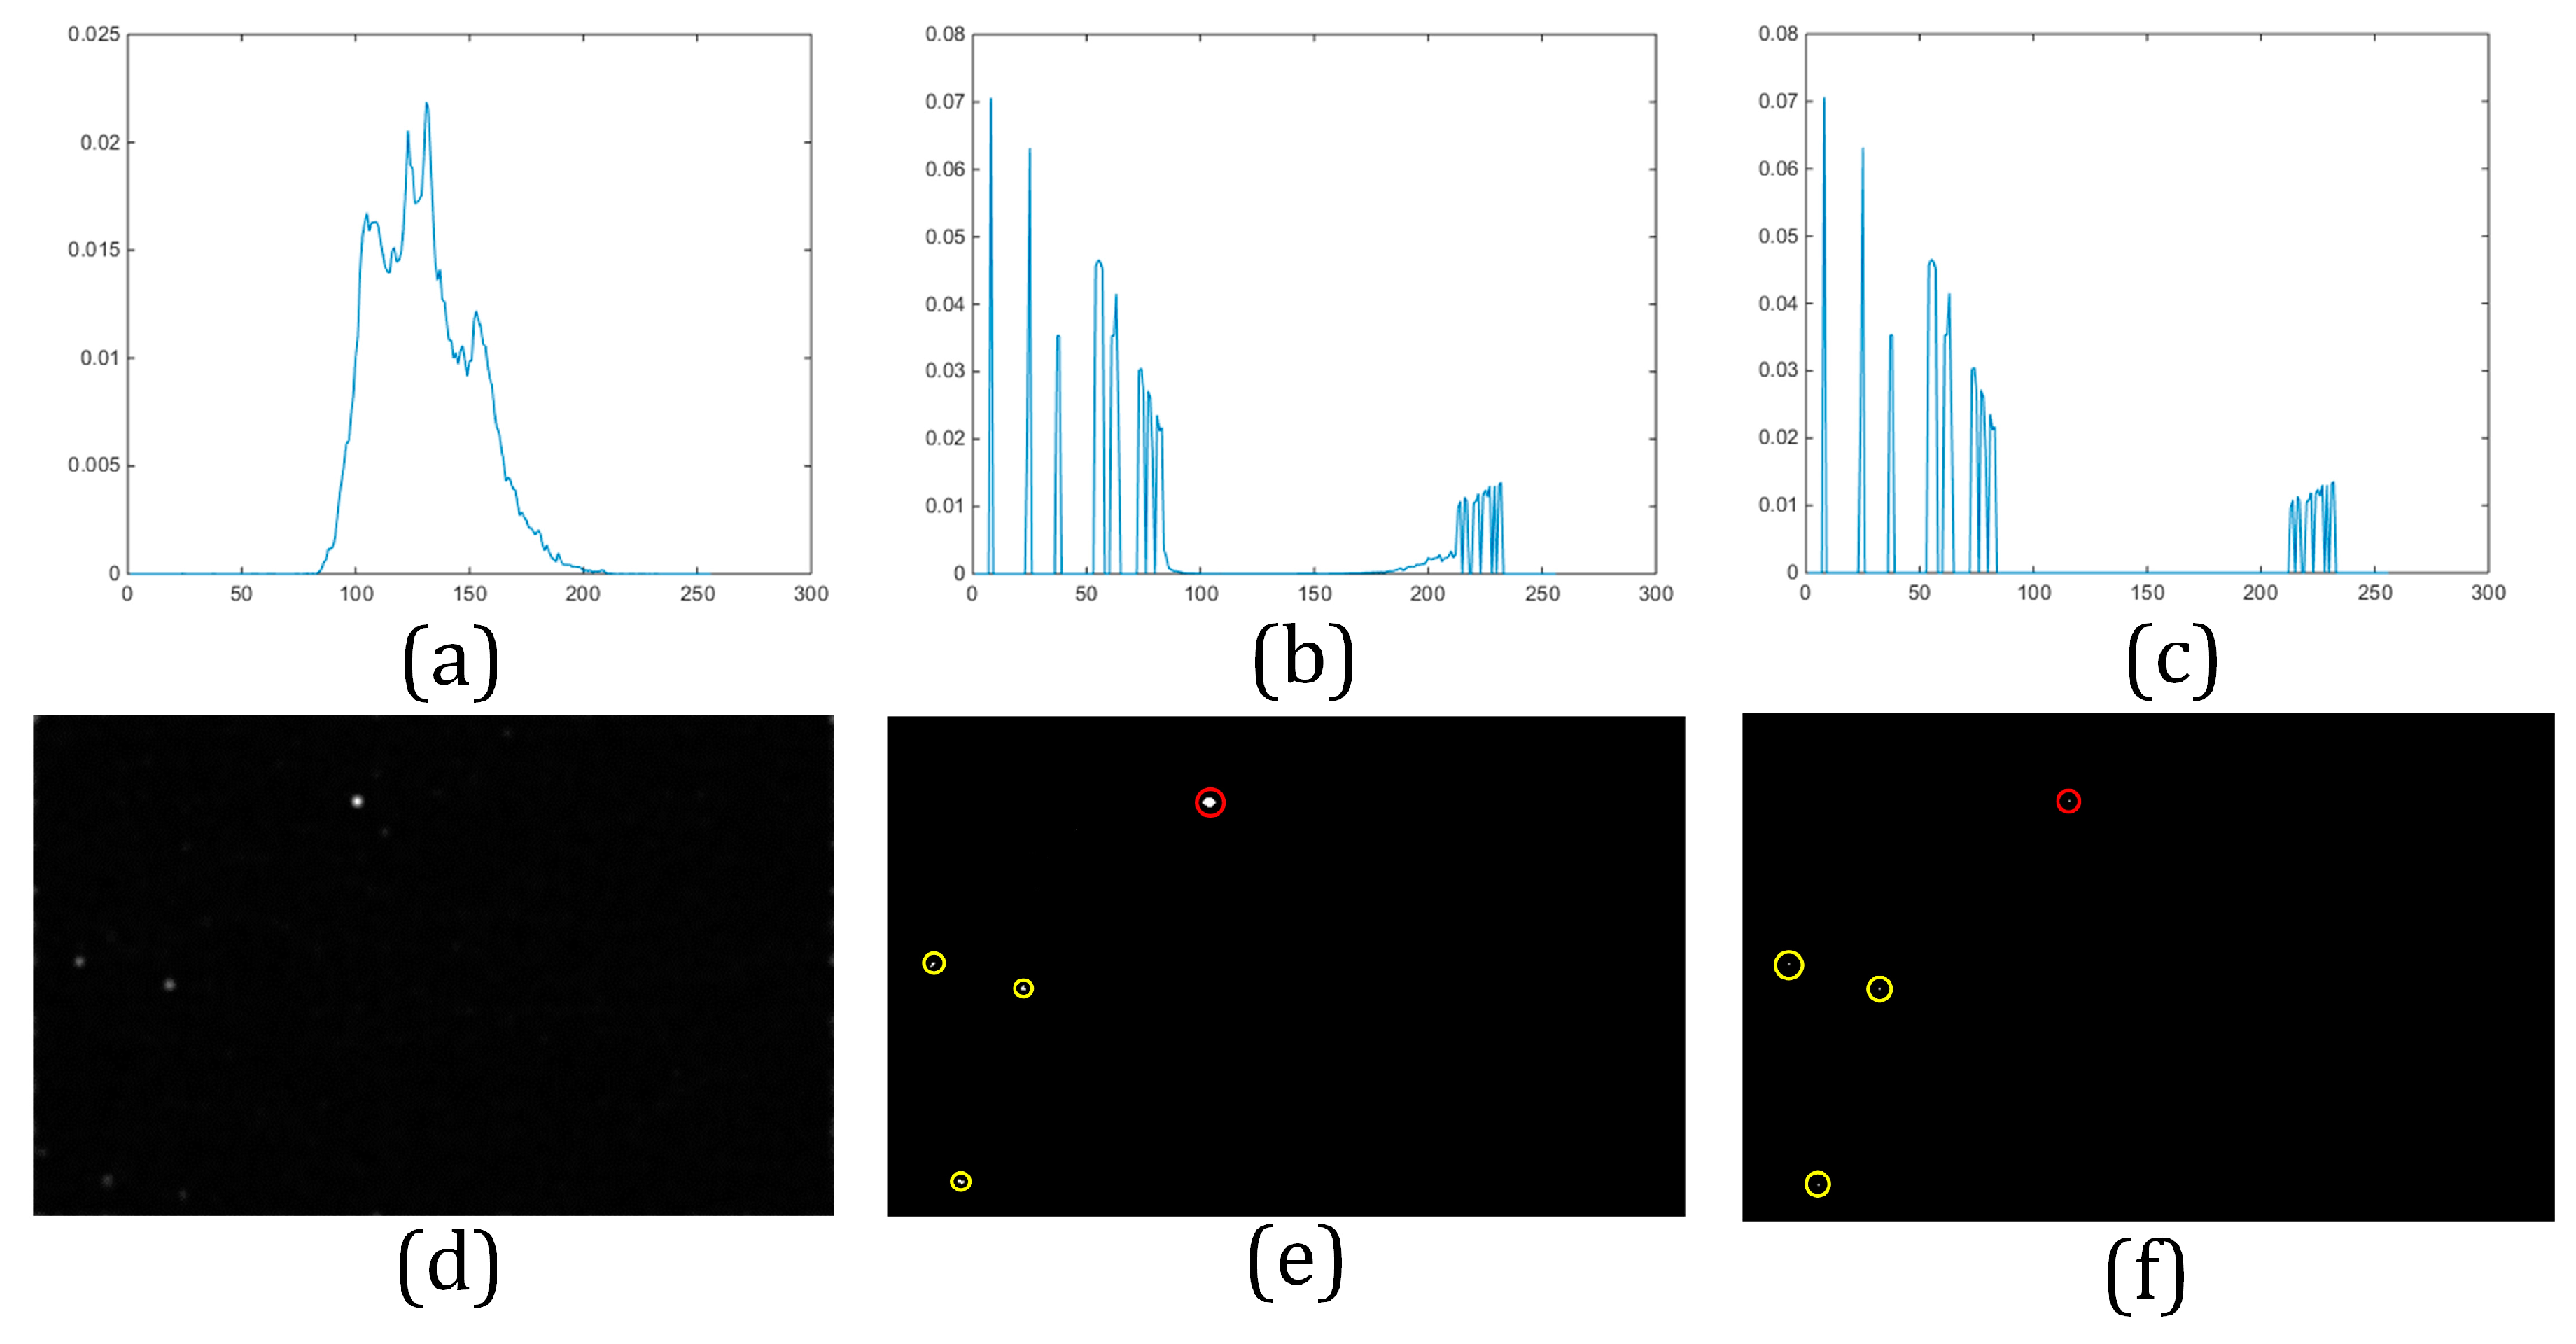
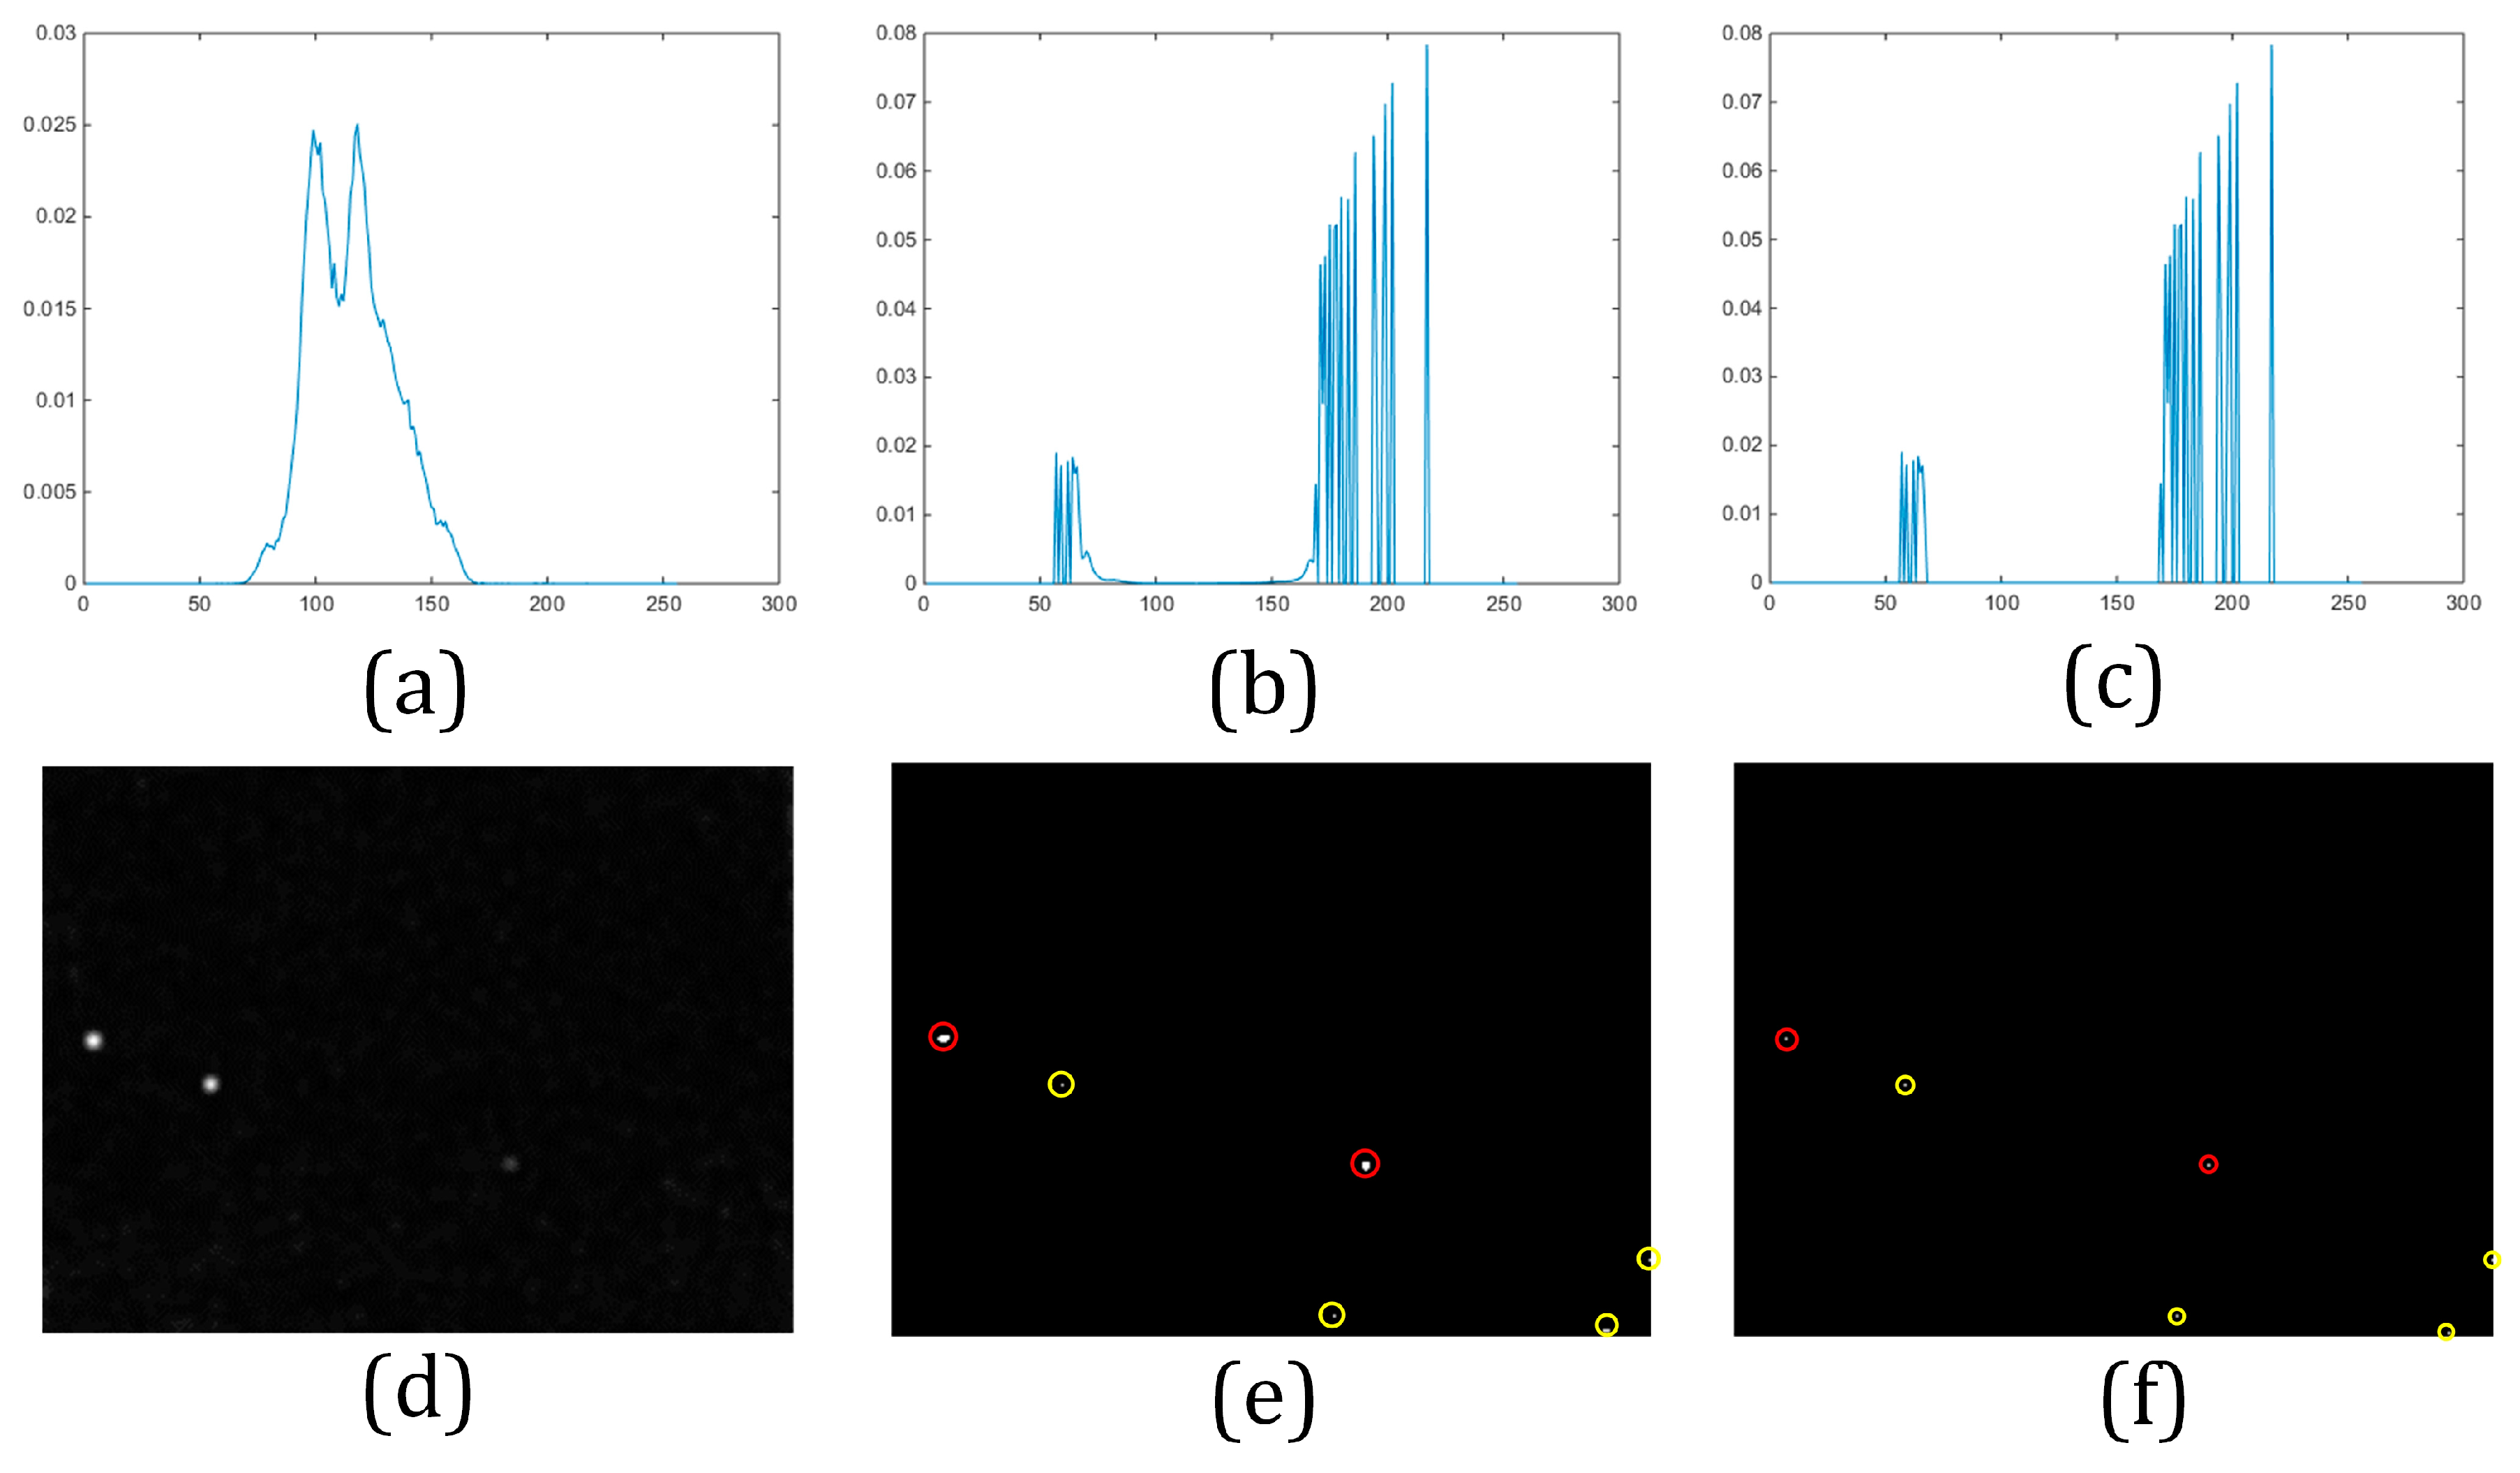
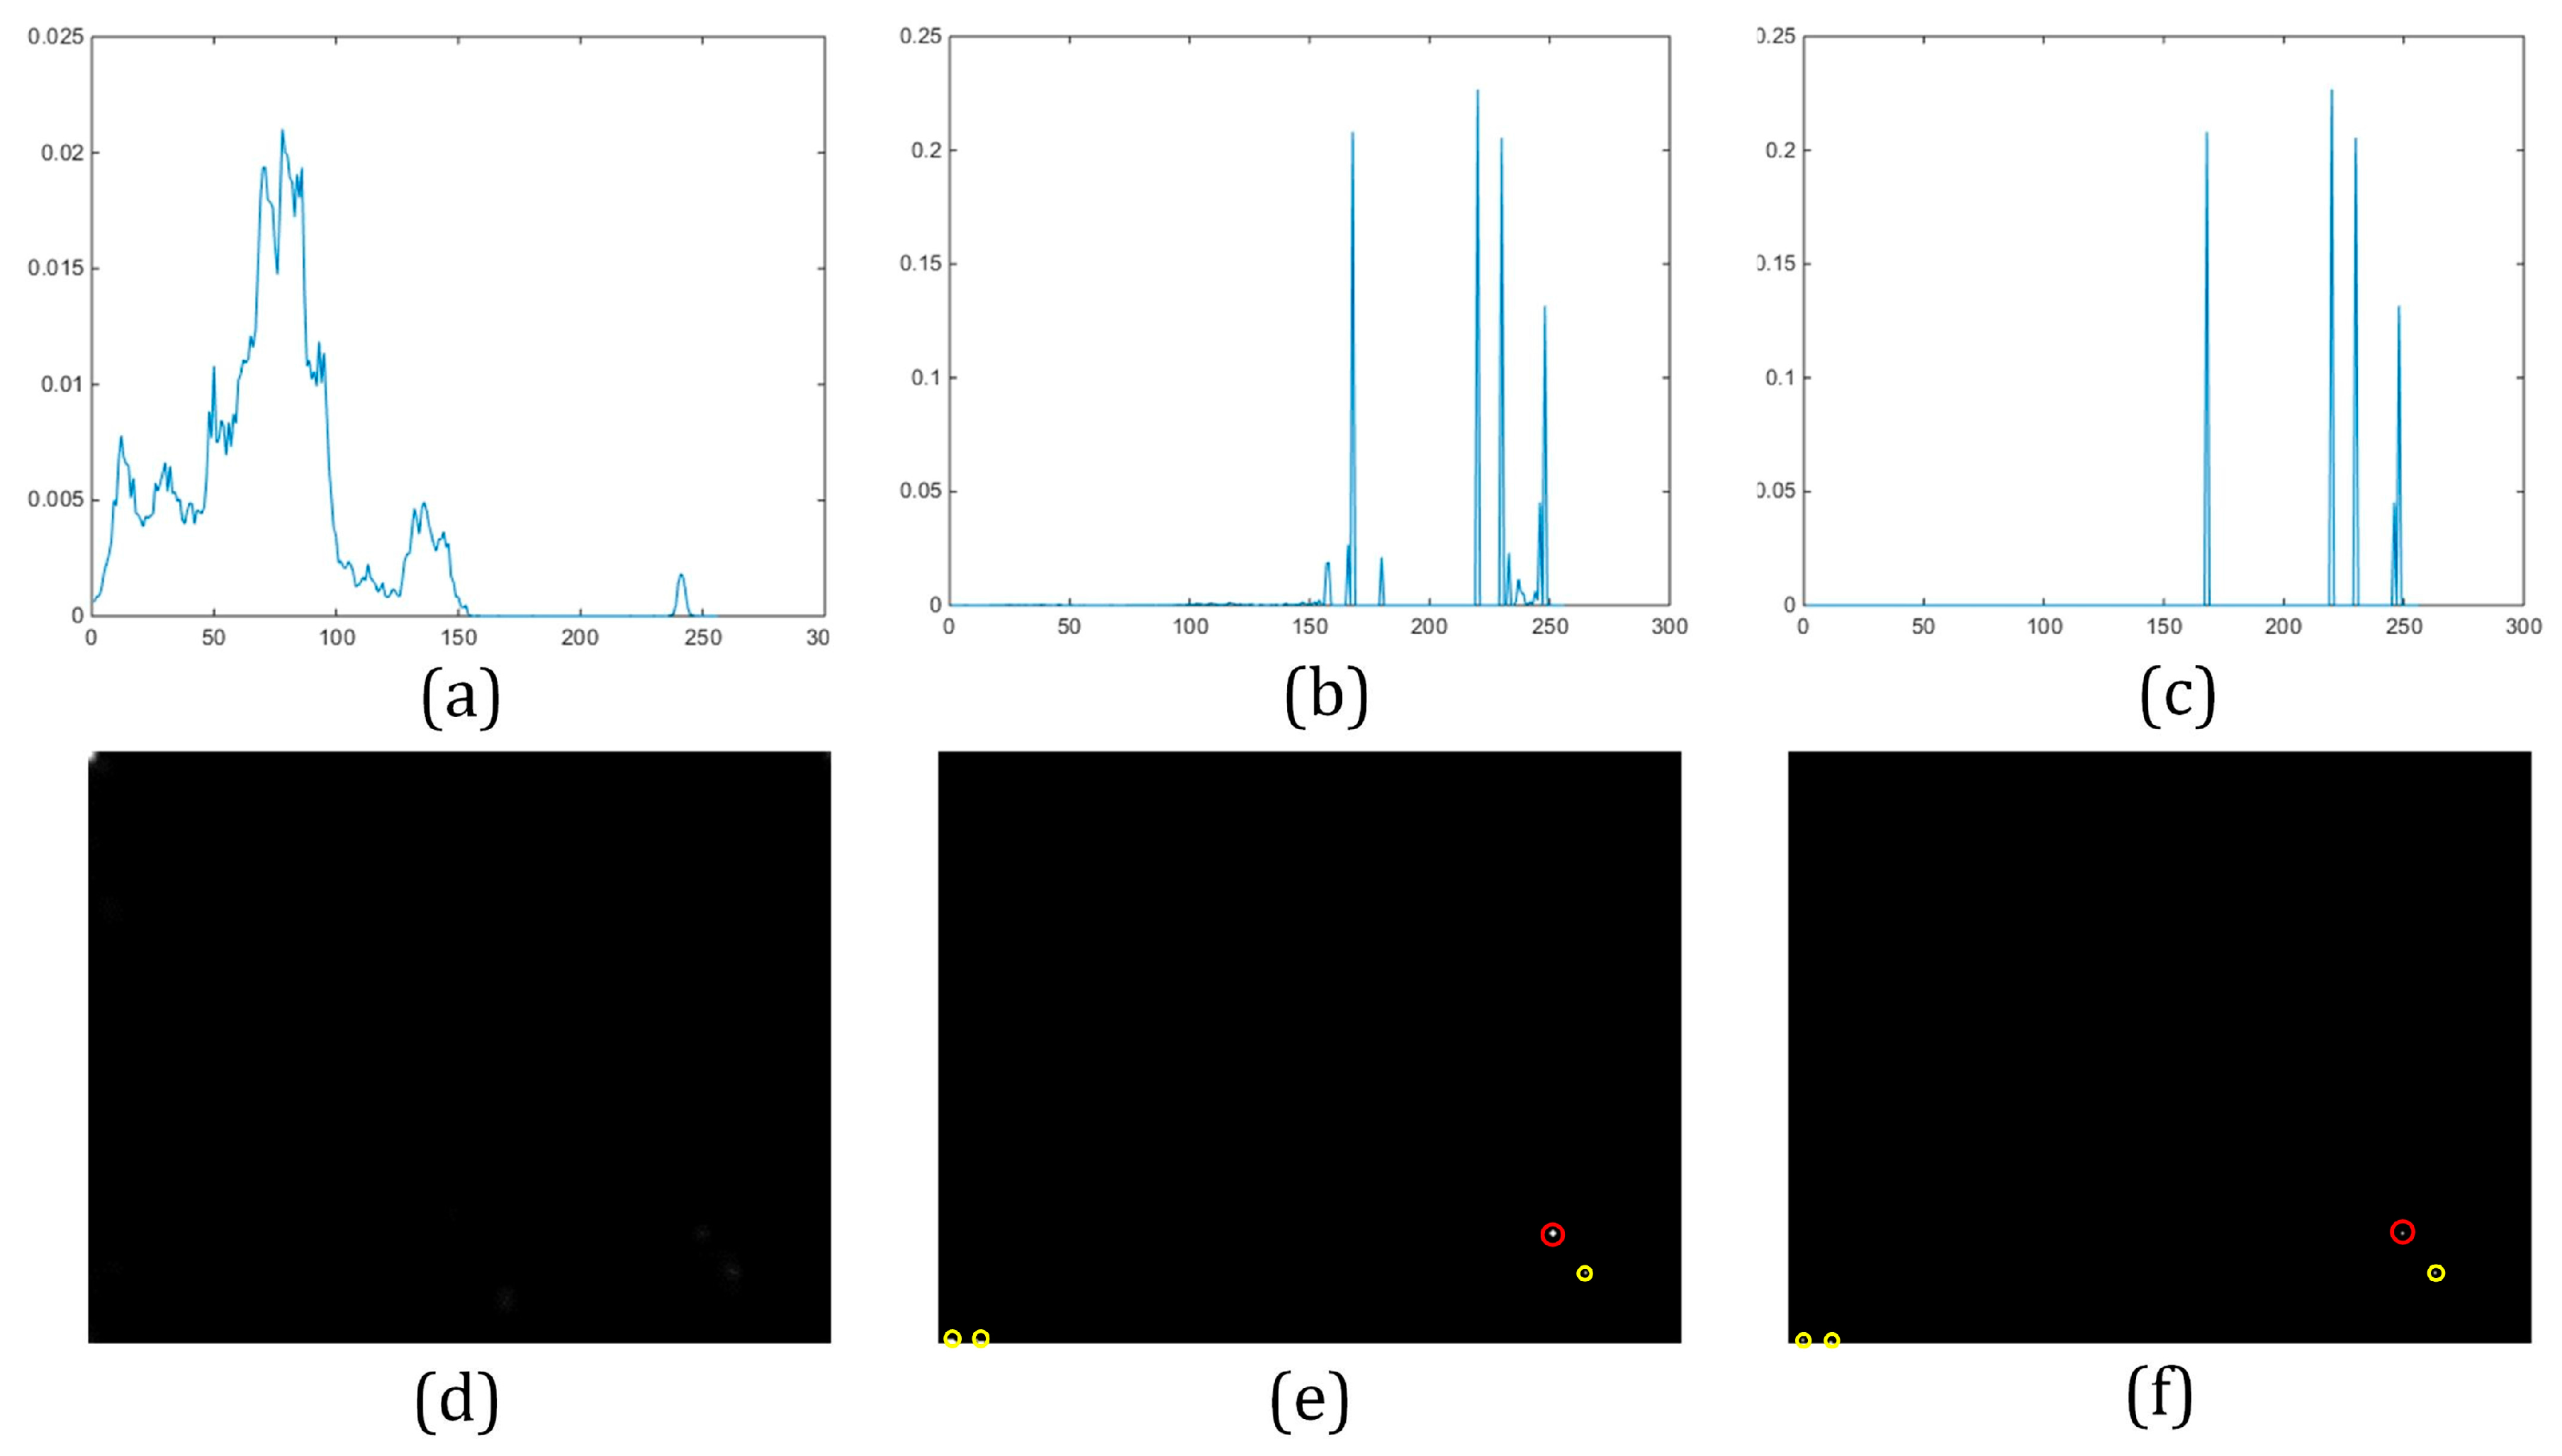
Figure 8 show the significant intermediate results and the output results of Seqs.(1–4) produced by our method, respectively. Note that real targets are marked with red circles and false alarms are marked with yellow ones. These figures demonstrate the following five points clearly:
- (1)
While intensity histogram only discloses the pixel number of each gray level, the peaks of the proposed saliency histogram are only located in gray levels corresponding to salient regions, i.e., saliency histogram reveals the saliency distribution of each gray level;
- (2)
The thresholds calculated via Otsu’s method can suppress the bins with small bin values in the raw saliency histogram well and only few bins are preserved in the modified saliency histograms;
- (3)
The saliency maps obtained by tuning amplitude spectra can roughly highlight the IR target no matter whether it is bright or dark, but the edges of sea waves and clouds with large gradient values are also preserved in the map;
- (4)
Each candidate region in the binarized image is represented by a single centroid point in the final output, although few false alarms still exist;
- (5)
The main sources of our false alarms are edges, dead pixels and still bright points.
Figure 9 presents the original processing results using the state-of-the-art algorithms, and
Figure 10 further shows their binarized results via thresholds calculated by Otsu’s method. For Max-Mean, it has poor performances when dealing with the cloud and sea backgrounds, indicating that it cannot remove the strong interferences caused by edges. BHP has the same drawbacks when addressing the edges, which can be seen from
Figure 10b, because this algorithm is sensitive to frequency characteristics and large numbers of false alarms would appear, if the cutting-off frequency is chosen inappropriately. In addition, according to
Figure 10c, an obvious phenomenon of Hat transformation is found that if there are both bright and dark targets in the image, it is inevitable that at least one kind of target would be lost because we cannot use Top-hat transformation and Bottom-hat transformation simultaneously. Finally, TDLMS has a stronger ability to suppress edges when compared to others, but it is easy to generate large quantities of candidate points for the same target region and this would cause repeated trajectories in inter-frame detections remarkably.
In order to discuss the performances more convincingly, two widely-accepted metrics called precision rate P and recall rate R [
27] are selected to measure the detection results quantitatively. As is illustrated in
Figure 11, an assumption is made that
is the pixel number of true targets existing in the current frame;
is the pixel number of targets detected by the tested algorithm, and
is the pixel number of targets detected correctly. In this case, precision rate P and recall rate R can be thus defined as
Furthermore, a comprehensive evaluation index
representing the detecting precision of each algorithm [
28] can be expressed as
where
is harmonic coefficient, and we set this coefficient as
in this paper.
indicates that there are no false alarms and all of the real targets are discovered, while
means that none of the real targets are found out. Hence, the larger
is, the more satisfactory the result is.
Table 2 reveals the statistical data of
for the in-frame detections at length. Clearly, the result presented by
Table 2 matches the qualitative analyses made above. Our method achieves the largest
in all sequences, but the accuracies are not at a high level as a whole.
4.3. Results of Inter-Frame Detection
In this part, the binarized detection results of the consecutive frames are accumulated in the final frame.
Figure 12 presents the cumulative results for each sequence in detail. Overall, our algorithm has the best performances in all sequences and nearly all of the false alarms remaining in the single frame detection are removed by the subsequent inter-frame detection effectively. Moreover, complete trajectories are drawn in the final resulting images, and the phenomenon of repeated trajectories for the same target is successfully avoided. By comparison, other methods have less satisfactory performances in this experiment. As is shown in the resulting images of Seq.1, Seq.3 and Seq.4, Max-Mean is easy to produce discontinuous trajectories, meaning that real targets are lost in certain frames. The trajectories generated by BHP are relatively complete, but regions with clutter edges contain large numbers of false alarms, which is especially outstanding in Seq.1 and Seq.3. Hat transformation suffers from missing detection seriously, and the trail of the dark IR small target is completely missed in Seq.3. However, this method can reduce the quantity of repeated trails to some extent when compared with the other three algorithms. Furthermore, it has a good anti-inference ability to clutter edges. In contrast, TDLMS tends to severely suffer from the repeated trails, and it is obvious that the trajectories produced by this method are thicker than others.
Table 3 presents the
values of the five groups in detail. From the data provided by this table, we can clearly find that
values of our method are higher than 97% and are at least two times larger than other methods in all of the four sequences. Through further analyses for the source of false alarms produced by contrastive algorithms, we argue that the major sources contain two aspects: (1) the repeated trajectories increase the quantities of redundant and useless points to a great extent; (2) the false detection results of edges have been accumulated.
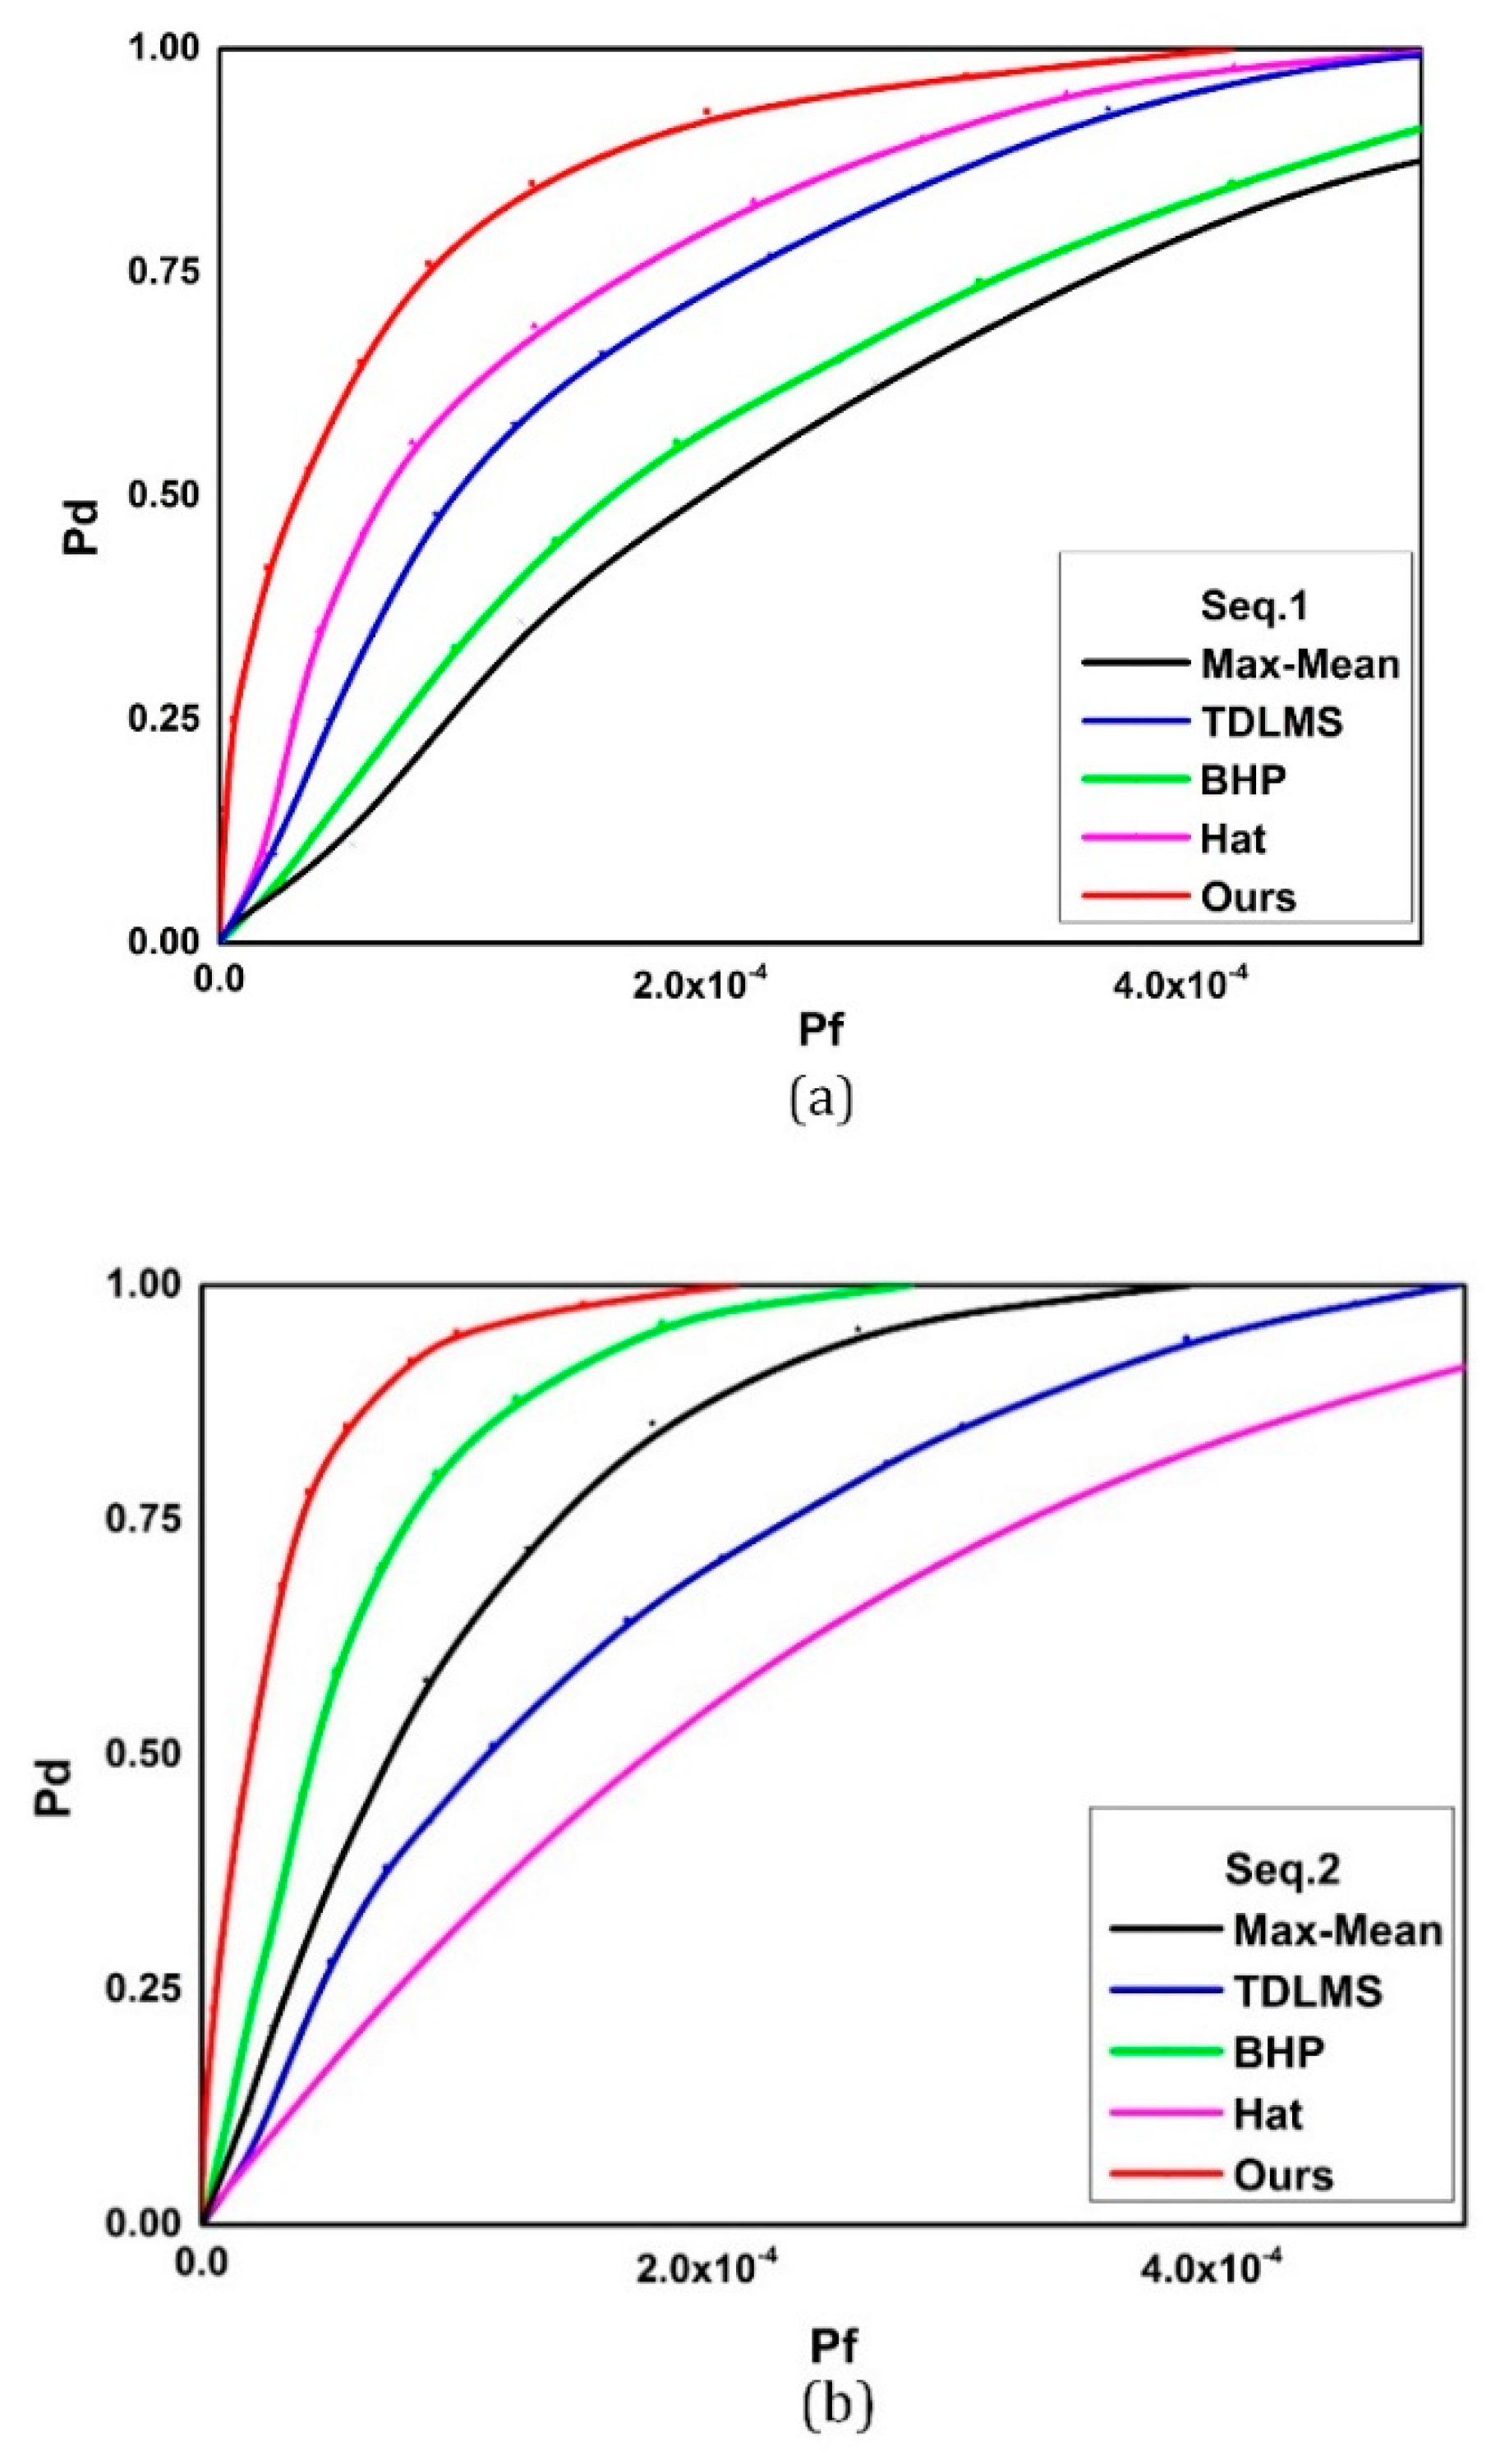
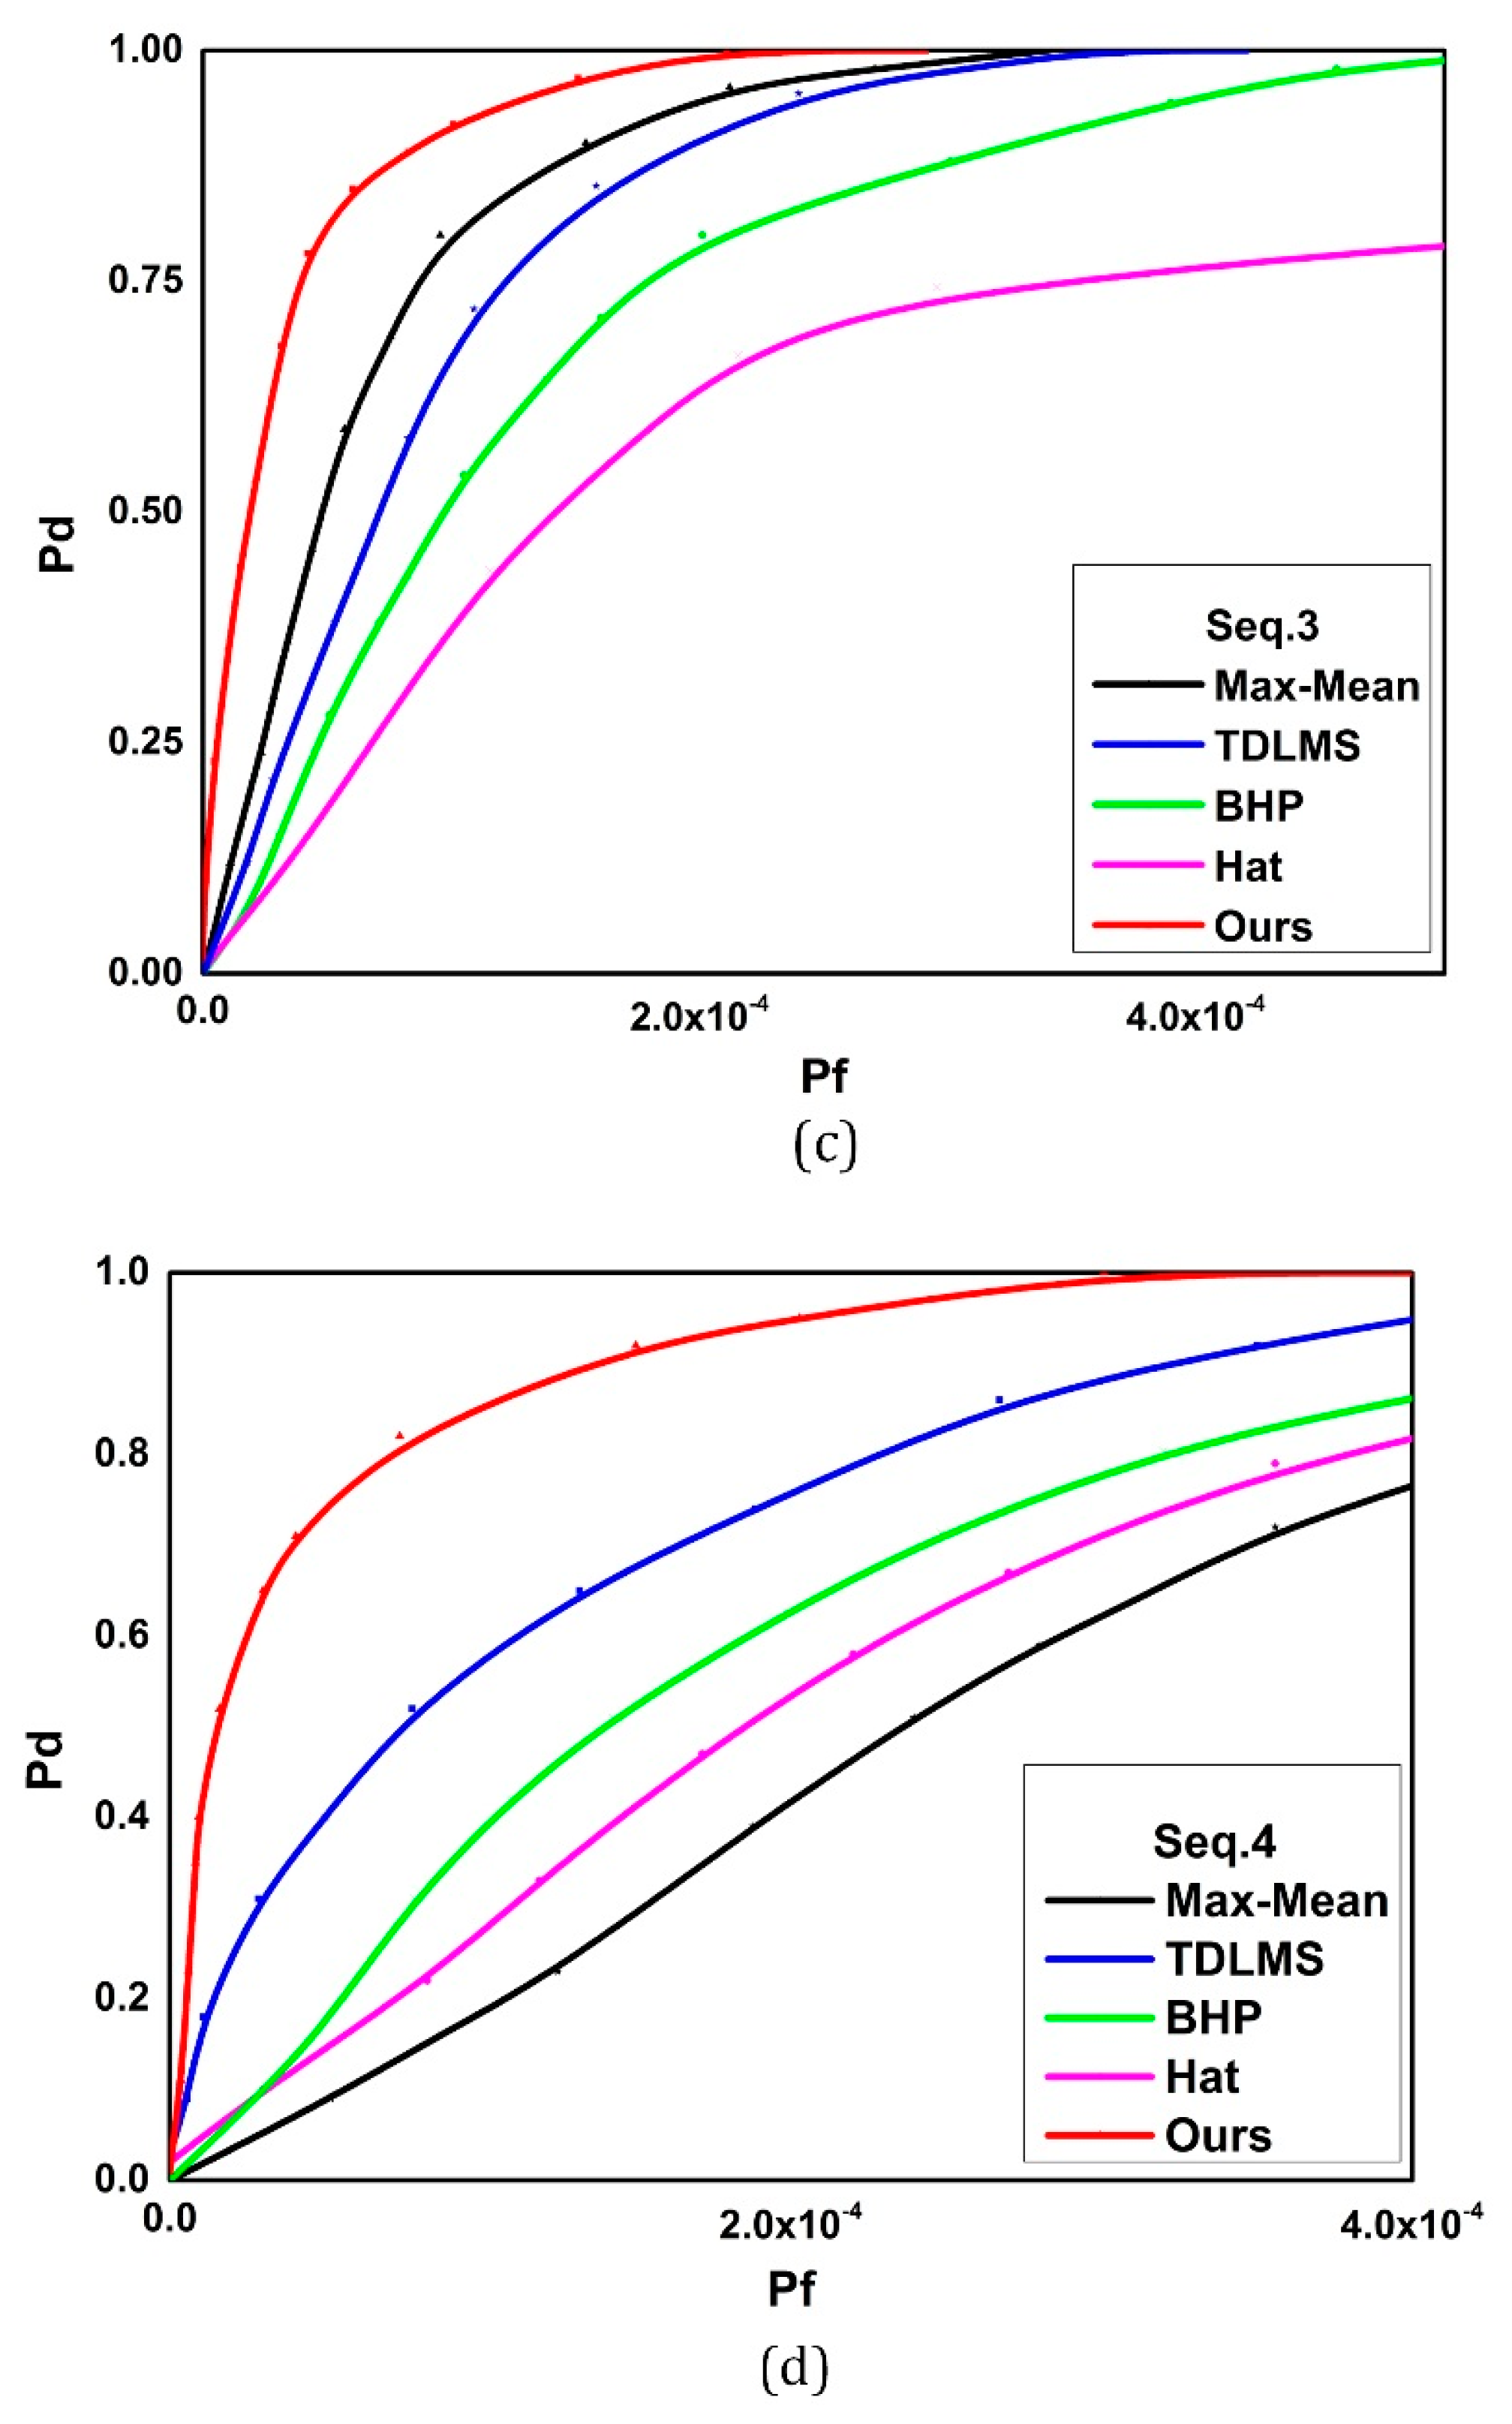
The ROC (Receiving Operating Characteristic) curve [
29] is an effective tool to describe the quality of detection methods. For an ROC curve, the abscissa and ordinate stand for the probability of false alarm rate (Pf) and detection rate (Pd), which are expressed as Equations (25) and (26), respectively:
where
denotes the total pixel number of the current frame. A good ROC means that the tested method is able to highlight the target and suppress the clutters at the same time. The ROC curves of the four experiments are drawn as
Figure 13.
In light of the four groups of ROC curves, it is apparent that the area under the ROC curve belonging to our method is always far larger than the contrastive methods. However, the performance of each contrastive method varies a lot under different backgrounds, further demonstrating that the robustness of the four methods is weaker than our method.
5. Conclusions
It is easy for conventional IR small target detection methods to generate large quantities of false alarms due to the small size of target, the lack of color or texture information and the interference of clutters. Furthermore, the existing algorithms scarcely have the ability to detect both bright and dark IR small targets accurately at the same time, and the inter-frame motion information is also ignored by most of the researchers.
In this paper, an IR small moving target detection method using saliency histogram and geometrical invariability is proposed. For the in-frame detection part, a saliency histogram is established by averaging the cumulative saliency value of each gray level so that a single-frame segmentation can be made via an adaptive threshold of the histogram, and the centroid position of candidate targets is calculated via a connected components labeling algorithm and a gray-weighted criterion. For the inter-frame detection part, false alarms are further removed according to the geometrical invariability existing between two relatively still points. Large numbers of experiments convincingly prove that our method has robustness and satisfactory precision under various natural backgrounds compared with other state-of-the-art methods.
In our future work, we plan to concentrate on investigating more well-performed features of the IR small target in single-frame detection so as to reduce the computing quantity of the inter-frame detection and further improve the final detection precision.


