Article

Biomedical Photoacoustic Imaging Optimization with Deconvolution and EMD Reconstruction

1
School of Electronic Science and Engineering, Nanjing University, Nanjing 210093, China
2
Institute of Acoustic, Tongji University, Shanghai 200092, China
*
Author to whom correspondence should be addressed.
Appl. Sci. 2018, 8(11), 2113; https://doi.org/10.3390/app8112113
Submission received: 12 October 2018 / Revised: 19 October 2018 / Accepted: 21 October 2018 / Published: 1 November 2018
(This article belongs to the Special Issue Photoacoustic Tomography (PAT))

Abstract

:
A photoacoustic (PA) signal of an ideal optical absorbing particle is a single N-shape wave. PA signals are a combination of several individual N-shape waves. However, the N-shape wave basis leads to aliasing between adjacent micro-structures, which deteriorates the quality of final PA images. In this paper, we propose an image optimization method by processing raw PA signals with deconvolution and empirical mode decomposition (EMD). During the deconvolution procedure, the raw PA signals are de-convolved with a system dependent deconvolution kernel, which is measured in advance. EMD is subsequently adopted to further process the PA signals adaptively with two restrictive conditions: positive polarity and spectrum consistency. With this method, signal aliasing is alleviated, and the micro-structures and detail information, previously buried in the reconstructing images, can now be revealed. To validate our proposed method, numerical simulations and phantom studies are implemented, and reconstructed images are used for illustration.

1. Introduction

Photoacoustic (PA) imaging, an emerging biomedical imaging modality based on PA effect, has been developed extensively in recent years. During PA imaging, laser pulses energy are delivered into biological tissues, leading to transient thermoelastic expansion and thus wideband ultrasound emission [1]. The generated ultrasound waves propagate to the surface where detected by ultrasound transducers [2], and are reconstructed into an image. As PA images can reveal pathology features and physiological structures according to the specific optical absorption distribution of biological tissues, the diagnoses on the tissue differs in physiological properties a lot, such as breast cancer diagnosis [3], and hemodynamics monitoring [4,5], making PA imaging a promising and high potential imaging modality.
Since typical detected PA signals of ideal optical absorbing particle is a single bipolar N-shape pulse [6,7], PA signals of a complicated biological tissue can be considered to be the combination of individual N-shape pulses. However, the N-shape wave basis results in two problems: the first problem is aliasing between adjacent micro-structures. The signal of a tiny target can be affected and even buried by the bipolar signal of a large target at a short distance, leading to unexpected aliasing and distortion in the final image. The second problem is that the existence of the N-shape wave complicates subsequent imaging work. When reconstructing images, the envelope of signal must transform the negative part into positive, as the negative part possesses significant information as well. Both drawbacks could deteriorate the quality of PA images.
Therefore, the processing on an N-shape wave can be significant in alleviating the drawbacks and has been investigated a number of studies. Li [7], identified some properties about the N-shape wave and introduced processing methods, including wavelet and deconvolution. Ermilov [8,9], transformed the bipolar N-shape pressure pulse to the monopolar pulse using wavelet transform in order to get the signal suitable for tomographic reconstruction. The deconvolution method can convert the bipolar N-shape wave to the monopolar wave and is rarely applied to processing signals, and thereby raising our interest. Traditionally, the deconvolution method is often applied to image reconstruction and image processing. For instance, Kruger [10] and Gamelin [11] used deconvolution methods in PA image reconstruction. Cai [12] improved the image resolution of PA microscopy by using deconvolution method on images. Recently, Nagaoka [13] proposed a reconstruction method to improve axial resolution through the suppression of the time side lobes in PA tomography by Wiener filtering.
In this paper, we propose using the image optimization method to process raw PA signals using signal deconvolution and empirical mode decomposition (EMD). This method mainly relies on signal deconvolution. However, as unexpected artifacts appeared around the imaging target only with signal deconvolution, EMD was instead adopted into our method as a subsequent step to further improve the reconstructed image quality. Moreover, we averaged multi-sampling raw PA signals with time shift correction by cross-correlation method as a preprocessing step in order to raise the signal-to-noise ratio (SNR) and enhance the performance of signal deconvolution.

2. Methods

Given that the detected PA signals have low SNR that deteriorate the quality of PA images, de-noising operation is quite common as a pre-processing step. Theoretically, averaging signals of multiple frames can eliminate random background noise and raise the SNR. However, non-negligible time shifts among signals of different frames always exist for a variety of reasons, including the slight fluctuation of the water around the imaging target, the small movement from a living biological imaging target, and system defect (possibly random delay generated by inner circuit). To solve this issue, we adopted an effective averaging method to adjust time shifts based on cross-correlation method [14,15].
First, we calculated the time shifts ( Δ m 1 , Δ m 2 , ) between the reference frame and other frames by cross-correlation. For discrete PA signals p 1 ( n ) and p 2 ( n ) , an estimate of the cross-correlation function is defined as [16]:
R ^ p 1 p 2 ( m ) = { 1 L | m | n = 0 L m 1 p 1 ( n + m ) p 2 ( n ) ,   m 0 R ^ p 1 p 2 ( m ) , m < 0 ,
where p 2 ( n ) is the complex conjugate of p 2 ( n ) , L is the maximum length of p 1 ( n ) and p 2 ( n ) , the normalization coefficient 1 / ( L | m | ) can avoid the zero bias inherent in the standard cross-correlation function. According to this equation, the value of time shift Δ m should equal to the value of m when the cross-correlation function R ^ p 1 p 2 ( m ) is of maximum value.
Assuming p 1 ( n ) is the uniform reference, p 2 ( n ) , the signals of all the rest frames need to be shifted to the length of their corresponding | Δ m | forwards or backwards based on the sign of Δ m . After that, shifted signals of multiple frames that all align is acquired, so we can obtain the final de-noised signal p ^ ( n ) by simply averaging them all.
Mathematically, the convolution result of a single wave and positive pulses with different delay is the superposition of many same-shaped waves with different delay, and the specific size of each wave depends on the size of the corresponding positive pulse. Hence, we assumed that PA signal is the convolution result of a series of specific monopolar pulses and a single N-shape wave. With that assumption, the monopolar signal, which contains the amplitude information and time information, can theoretically be acquired through deconvolution. As we mentioned in the former section, the N-shape wave basis has defects that will reduce the quality of PA images, while the de-convolved monopolar signals possess equally important information for imaging as raw PA signals and perform better than raw N-shape PA signals when reconstructed into images. We intended to acquire de-convolved signals to replace raw PA signals.
Generally, the discrete detected PA signal s ( n ) can be represented in convolution form as:
s ( n ) = o ( n ) h ( n ) + n ( n ) ,
where denotes convolution, h ( n ) is the kernel of this signal convolution system, s ( n ) is the detected raw signal, o ( n ) refers to the signal which we aim to acquire and n ( n ) represents the additive noise. In our method, we took h ( n ) as a normalized single N-shape pulse which is acquired by detecting an approximately ideal optical absorbing particle, specifically, the smallest source which the PA data acquisition system can measure. For example, assuming that velocity is 1540 m/s, an L7-4 ultrasound probe whose center frequency is 5.208 MHz can detect the minimum source is approximately a diameter of 0.296 mm, so in this case, the kernel h ( n ) ought to be acquired by detecting the source whose size is closest to and bigger than 0.296 mm.
The deconvolution algorithm we used was the Wiener deconvolution [17]. A typical simulated signal was used for demonstration. As shown in Figure 1b, the signal was converted from a bipolar signal to monopolar signal after deconvolution. However, directly using de-convolved signal to reconstruct images creates defects. As shown in Figure 1c, when reconstructing images by conventional delay-and-sum algorithm, assuming the velocity is uniform, the value corresponding with the position of the imaging target was also added to the other positions of the same distance to the transducer element as imaging target. Normally, artifacts can be restrained as the signal has both positive part and negative part to cancel each other out. Since the de-convolved signal is monopolar, unexpected artifacts will appear around the imaging object because amplitude cannot be cancelled out when summing up as they are all positive. To alleviate this phenomenon and further optimize the images, EMD was adopted subsequent to signal deconvolution.
The principle of EMD [18], is to decompose a signal into several intrinsic mode functions (IMFs) without setting any basis function in advance, and each of them reserves the local features of the original signal with different time scales. Given that different IMFs possess different features, we were able to rebuild new signals to meet our requirements by depressing some of the IMFs and enhancing other IMFs. Specifically, we applied weight coefficients to each IMF and refactor new signal automatically under the constraints which is set in advance. In our proposed method, we apply the de-convolved signal to EMD and refactor it with two constraints, positive polarity and spectrum consistence. Given that EMD can only process one-dimensional signals at a time, a one-dimensional signal o 1 ( n ) (detected by a single transducer element of the probe) of de-convolved signal o ( n ) should be considered as an example, the procedure [19] is described in detail as follows:
Step 1: Use EMD method to decompose signal o 1 ( n ) into k IMFs ( k is a changeable number) and the residue:
o 1 ( n ) = i = 1 k I M F i + r e s ( n ) ,
Step 2: Set weight coefficient value of each IMF to refactor a set of new signals:
n e w o 1 ( n ) = [ a 1   a 2     a k ] × [ I M F 1 I M F 2 I M F k ] ,
where a = [ a 1   a 2     a k ] refers to the weight coefficients of IMFs. As the number of IMFs is k , the number of weight coefficient is also k and each weight coefficient corresponds with an IMF. The value of each weight coefficient ranges from [0, 1] with step 0.1, so that the number of iteration is 11 k . The coefficient of residue remains 1.
Step 3: Calculate two constraints in each iteration:
The first constraint is positive polarity. As the original de-convolved signal is monopolar, positive polarity is set to avoid distortion between the refactor signal and the original signal. Positive polarity is defined as:
p = min ( n e w _ o 1 ( n ) ) max ( n e w _ o 1 ( n ) ) > threshold ,
where the threshold here should equal the minimum amplitude of o 1 ( n ) divided by maximum amplitude of o 1 ( n ) . Within each iteration, the second constraint can be calculated if the refactored signal satisfies the positive polarity. Otherwise, this iteration should be skipped and to begin the next iteration.
The second constraint is spectrum consistence. As the high frequency components usually retain detailed information, we applied the spectrum consistence to refactoring a new signal, with more detail and less aliasing. Spectrum consistence is defined as:
c = ω = f 1 f 2 f ( ω ) ω = f 0 f 1 f ( ω ) ,   ω < f s 2 ,
where f ( ω ) is the FFT result of refactored signal, f s refers to the sampling frequency. As band-limited ultrasound transducers can only receive the signal with a limited frequency band, f 0 refers to the low cut-off frequency, f 2 refers to the high cut-off frequency and f 1 is the middle frequency point of the frequency band. We assume that the high frequency component and the low frequency component is divided by f 1 . Set the initial c = 0 , and if the c of this iteration is bigger than the former one, the weight coefficient of this iteration should be adopted and the former c should be substituted by the new c .
Step 4: repeat the iterations in Step 2 and Step 3 until it traverses all the weight coefficients, and we can then assume that the n e w _ o 1 ( n ) , which satisfies the positive polarity and obtains the biggest spectrum consistence c is the best refactored signal.

3. Results

3.1. Numerical Simulations

We implemented numerical simulations based on the MATLAB (The MathWorks, Natick, MA, USA) k-Wave toolbox [20] using a HP server (Hewlett-Packard, Palo Alto, CA, USA), which has 2 Intel (Intel Corporation, Santa Clara, CA, USA) Xeon (R) X5670 CPU working at 2.93 GHz and 72.0 GB RAM. PA data were detected by 128 linear ultrasound element transducers, which distributed on the upper side of the numeric phantom. The speed of sound was set to 1540 m/s. In the simulation, two numeric phantoms were used to validate the effectiveness of our proposed method. To prevent the interference of the reconstruction method in k-Wave toolbox, we used the basic delay-and-sum reconstruction algorithm to reconstruct each image in our study.
First, the deconvolution kernel h ( n ) was acquired from a single transducer element on the upper side, which detects the numeric phantom that only consists of a point source of radius 1 in the middle position. The normalized h ( n ) , shown in Figure 1a performs as the uniform deconvolution kernel in our simulations.
To illustrate the deformation of signal and the direct results in reconstructed image clearly, we used a simple numeric phantom as seen in Figure 2a, which consists of a large point source in the middle and four small point sources around. Meanwhile, to make the simulation more realistic, we used a vessel-like image as seen in Figure 3a to simulate the complex numeric phantom.
As observed in Figure 2e and Figure 3e, bipolar N-shape signals are converted to monopolar signals after processing and more detailed information appears, especially in Figure 3e. The small N-shape waves affected by the negative part of the big N-shape waves became apparent. From the reconstructed images in Figure 2 and Figure 3, we can observe that the original signals result in aliasing and blurring in reconstruction (as Figure 2b and Figure 3b), the five dots and the two main branches are hard to distinguish. Moreover, the existence of N-shape wave leads to distortion in the image. Using Figure 2b as an example, the two points in the lower side are obviously weaker than the two points in the upper side, and on the other hand, the position of the two points in the lower side slightly moves downward compared with the set position (Figure 2a). This is because the wave after big waves is affected and even buried by the negative part of the big waves. But by performing deconvolution on signals (Figure 2c and Figure 3c), aliasing is alleviated, and distortion is corrected. After processing by EMD (Figure 2d and Figure 3d), the edge sharpness and resolution of the images were further improved. With the gap widening between main imaging targets, the five dots in Figure 2 and the branches in Figure 3, are distinguishable and separated now.
Since the original PA signal is bipolar, using an envelope is necessary when reconstructing images by means of delay-and-sum algorithm. However, this step could be left out due to the positive polarity of the refactored signal, which further improves image quality and increases efficiency.

3.2. Experiments

The schematic of our experimental setup is shown in Figure 4a. A tunable optical parametric oscillator (OPO) system (Phocus Mobile, Opotek, CA, USA) is pumped by a Nd; YAG laser (Brilliant B, Bigsky, MT, USA) is employed as the laser source. The laser works at the wavelength of 720 nm with pulse repetition rate of 10 Hz and pulse duration of 5.5 ns. A Verasonics system (Verasonics Inc., Kirkland, WA, USA) is controlled by a computer to receive raw PA data. An ultrasound linear array (L7-4, Philips, Amsterdam, The Netherlands) with 128 elements, 5.208 MHz center frequency and 0.298 mm element pitch was used. Ultrasonic coupling agent is used as the acoustic transmission medium between phantom and ultrasound probe.
The phantoms used in this experiment were made of porcine gelatin with 8% concentration as shown in Figure 4b,c. Figure 4b is the phantom used as the imaging target in our experiment which embedded with two rubber threads of diameter 1 mm and Figure 4d shows the placement of phantom, probe and laser in this experiment. The arrows in Figure 4b,c both point to the position where a probe acquired a signal of each phantom while carrying out the experiment. During the process of signal acquisition, each set of signals contained approximately 200 frames for a continuous period to average.
The deconvolution kernel is acquired from the middle transducer element of the probe, which detected a single tungsten wire of diameter 0.3 mm (as Figure 4c); approximately the smallest size L7-4 probe can measure. The normalized deconvolution kernel (as shown in Figure 5), averaged from 200 frame signals, was used as the deconvolution kernel in this experiment.
The comparison of the reconstructed result is shown in Figure 6. We can observe that the two oblique rubber wires are too close to look separated in the image reconstructed with original PA signal, as shown in Figure 6a. Without knowing the imaging targets in advance, it is difficult to distinguish the structure visually. After applying our proposed method, as shown in Figure 6b, the two lines are completely separated, and the realistic inner structures of this phantom can be more clearly identified. Meanwhile, image resolution is enhanced, and the artifact is slightly reduced.
To quantify the width of gaps in Figure 6 and compared to the realistic width of gap in Figure 4b, we measured the width of gaps in Figure 6. In Figure 4b, the diameter of the two rubber wires in the phantom are both 1 mm, we can observe that the realistic gap, where the arrow mark is pointing to, is approximately 0.4 mm. In respect of the reconstructed image of the original signal as shown in Figure 6a, the width of the gap is about 0.08 mm. For the reconstructed image of the processed signal as shown in Figure 6b, the width of the gap is about 0.3 mm. From the quantification, we can find that the image of processed signal more aptly indicates the accurate width and position of realistic targets.

4. Discussion and Conclusions

From the contrast of signals in the simulation before and after processing, the bipolar signals are converted into non-negative signals, whereas the processed signals in the experiment are relatively monopolar, but not strictly monopolar. The deconvolution result is sensitive to noise, which is inevitable in the signal acquisition procedure. Meanwhile, the relatively monopolar signals have some benefit in reducing artifacts in the final reconstructed image. Widespread artifacts as shown in Figure 2d appear around imaging targets when using the strictly monopolar signal, whereas artifacts can be slightly alleviated if the relatively monopolar signal are used.
In this work, we demonstrate an image optimization method by processing the raw PA signals using signal deconvolution and EMD. Using this method, raw bipolar signals are converted into quasi-monopolar signals and more detailed information can be obtained to alleviate the signal aliasing phenomenon. With the processed signals, PA image can be optimized, especially in resolution and edge sharpness. Moreover, the micro-structures, which were previously hidden and buried by large imaging targets, can now be revealed and separated. Both numeric simulations and phantom study illustrate the effectiveness of this method. As this method can help to distinguish between close objects and reveal detail information, it can potentially help with diagnoses, especially on tissues with micro-structures.

Author Contributions

Conceptualization, C.G. and J.Y.; data curation, C.G.; formal analysis, C.G.; funding acquisition, J.Y.; investigation, C.G.; methodology, C.G., J.Y. and Y.Z.; project administration, J.Y.; resources, J.Y., Q.C. and X.W.; software, C.G.; supervision, J.Y.; validation, C.G., Y.C. and Q.C.; visualization, C.G.; writing–original draft, C.G.; writing–review and editing, J.Y. and Y.Z.

Funding

This research was funded by the National Key Research and Development Program of China (No. 2017YFC0111402) and the Natural Science Funds of Jiangsu Province of China (No. BK20181256).

Conflicts of Interest

The authors declare no conflicts of interest.

References

  1. Xu, M.; Wang, L.V. Photoacoustic imaging in biomedicine. Rev. Sci. Instrum. 2006, 77, 041101. [Google Scholar] [CrossRef] [Green Version]
  2. Beard, P. Biomedical photoacoustic imaging. Interface Focus 2011, 1, 602–631. [Google Scholar] [CrossRef] [PubMed] [Green Version]
  3. Ku, G.; Fornage, B.D.; Jin, X.; Xu, M.; Hunt, K.K.; Wang, L.V. Thermoacoustic and photoacoustic tomography of thick biological tissues toward breast imaging. Technol. Cancer Res. Treat. 2005, 4, 559–565. [Google Scholar] [CrossRef] [PubMed]
  4. Wang, X.; Pang, Y.; Ku, G.; Xie, X.; Stoica, G.; Wang, L.V. Noninvasive laser-induced photoacoustic tomography for structural and functional in vivo imaging of the brain. Nat. Biotechnol. 2003, 21, 803–806. [Google Scholar] [CrossRef] [PubMed] [Green Version]
  5. Wang, X.; Xie, X.; Ku, G.; Wang, L.V.; Stoica, G. Noninvasive imaging of hemoglobin concentration and oxygenation in the rat brain using high-resolution photoacoustic tomography. J. Biomed. Opt. 2006, 11, 024015. [Google Scholar] [CrossRef] [PubMed] [Green Version]
  6. Oraevsky, A.A.; Andreev, V.A.; Karabutov, A.A.; Esenaliev, R.O. Two-dimensional optoacoustic tomography: Transducer array and image reconstruction algorithm. In Proceedings of the BiOS ‘99 International Biomedical Optics Symposium, San Jose, CA, USA, 14 June 1999; p. 12. [Google Scholar]
  7. Changhui, L.; Lihong, V.W. Photoacoustic tomography and sensing in biomedicine. Phys. Med. Biol. 2009, 54, R59. [Google Scholar]
  8. Ermilov, S.A.; Gharieb, R.; Conjusteau, A.; Miller, T.; Mehta, K.; Oraevsky, A.A. Data processing and quasi-3D optoacoustic imaging of tumors in the breast using a linear arc-shaped array of ultrasonic transducers. In Proceedings of the SPIE BiOS, San Jose, CA, USA, 28 February 2008; p. 10. [Google Scholar]
  9. Ermilov, S.A.; Khamapirad, T.; Conjusteau, A.; Leonard, M.H.; Lacewell, R.; Mehta, K.; Miller, T.; Oraevsky, A.A. Laser optoacoustic imaging system for detection of breast cancer. J. Biomed. Opt. 2009, 14, 024007. [Google Scholar] [CrossRef] [PubMed]
  10. Kruger, R.A.; Kiser, W.L.; Reinecke, D.R.; Kruger, G.A. Thermoacoustic computed tomography using a conventional linear transducer array. Med. Phys. 2003, 30, 856–860. [Google Scholar] [CrossRef] [PubMed]
  11. Gamelin, J.; Maurudis, A.; Aguirre, A.; Huang, F.; Guo, P.; Wang, L.V.; Zhu, Q. A real-time photoacoustic tomography system for small animals. Opt. Express 2009, 17, 10489–10498. [Google Scholar] [CrossRef] [PubMed] [Green Version]
  12. Cai, D.; Li, Z.; Chen, S.-L. In vivo deconvolution acoustic-resolution photoacoustic microscopy in three dimensions. Biomed. Opt. Express 2016, 7, 369–380. [Google Scholar] [CrossRef] [PubMed]
  13. Ryo, N.; Shin, Y.; Shin-ichiro, U.; Yoshifumi, S. Basic study of improvement of axial resolution and suppression of time side lobe by phase-corrected wiener filtering in photoacoustic tomography. Jpn. J. Appl. Phys. 2018, 57, 07LD11. [Google Scholar] [CrossRef]
  14. Li, W.; Zhang, L.; Yuan, J.; Liu, X.; Xu, G.; Wang, X.; Carson, P.L. Novel image optimization on photoacoustic tomography. In Proceedings of the 2014 IEEE International Ultrasonics Symposium, Chicago, IL, USA, 3–6 September 2014; pp. 1280–1283. [Google Scholar]
  15. Cao, M.; Feng, T.; Yuan, J.; Xu, G.; Wang, X.; Carson, P.L. Spread spectrum photoacoustic tomography with image optimization. IEEE Trans. Biomed. Circuits Syst. 2017, 11, 411–419. [Google Scholar] [CrossRef] [PubMed]
  16. Brunker, J.; Beard, P. Pulsed photoacoustic doppler flowmetry using time-domain cross-correlation: Accuracy, resolution and scalability. J. Acoust. Soc. Am. 2012, 132, 1780–1791. [Google Scholar] [CrossRef] [PubMed]
  17. Gonzales, R.C.; Woods, R.E. Digital Image Processing; Addison & Wesley Publishing Company: Reading, MA, USA, 1992. [Google Scholar]
  18. Huang, N.E.; Shen, Z.; Long, S.R.; Wu, M.C.; Shih, H.H.; Zheng, Q.; Yen, N.-C.; Tung, C.C.; Liu, H.H. The empirical mode decomposition and the hilbert spectrum for nonlinear and non-stationary time series analysis. Proc. R. Soc. Lond. Ser. A Math. Phys. Eng. Sci. 1998, 454, 903. [Google Scholar] [CrossRef]
  19. Zhu, Y.-H.; Yuan, J.; Pinter, S.Z.; Oliver, D.K.; Cheng, Q.; Wang, X.-D.; Tao, C.; Liu, X.-J.; Xu, G.; Carson, P.L. Adaptive optimization on ultrasonic transmission tomography-based temperature image for biomedical treatment. Chin. Phys. B 2017, 26, 064301. [Google Scholar] [CrossRef]
  20. Treeby, B.E.; Cox, B.T. K-wave: Matlab toolbox for the simulation and reconstruction of photoacoustic wave fields. J. Biomed. Opt. 2010, 15, 021314. [Google Scholar] [CrossRef] [PubMed]
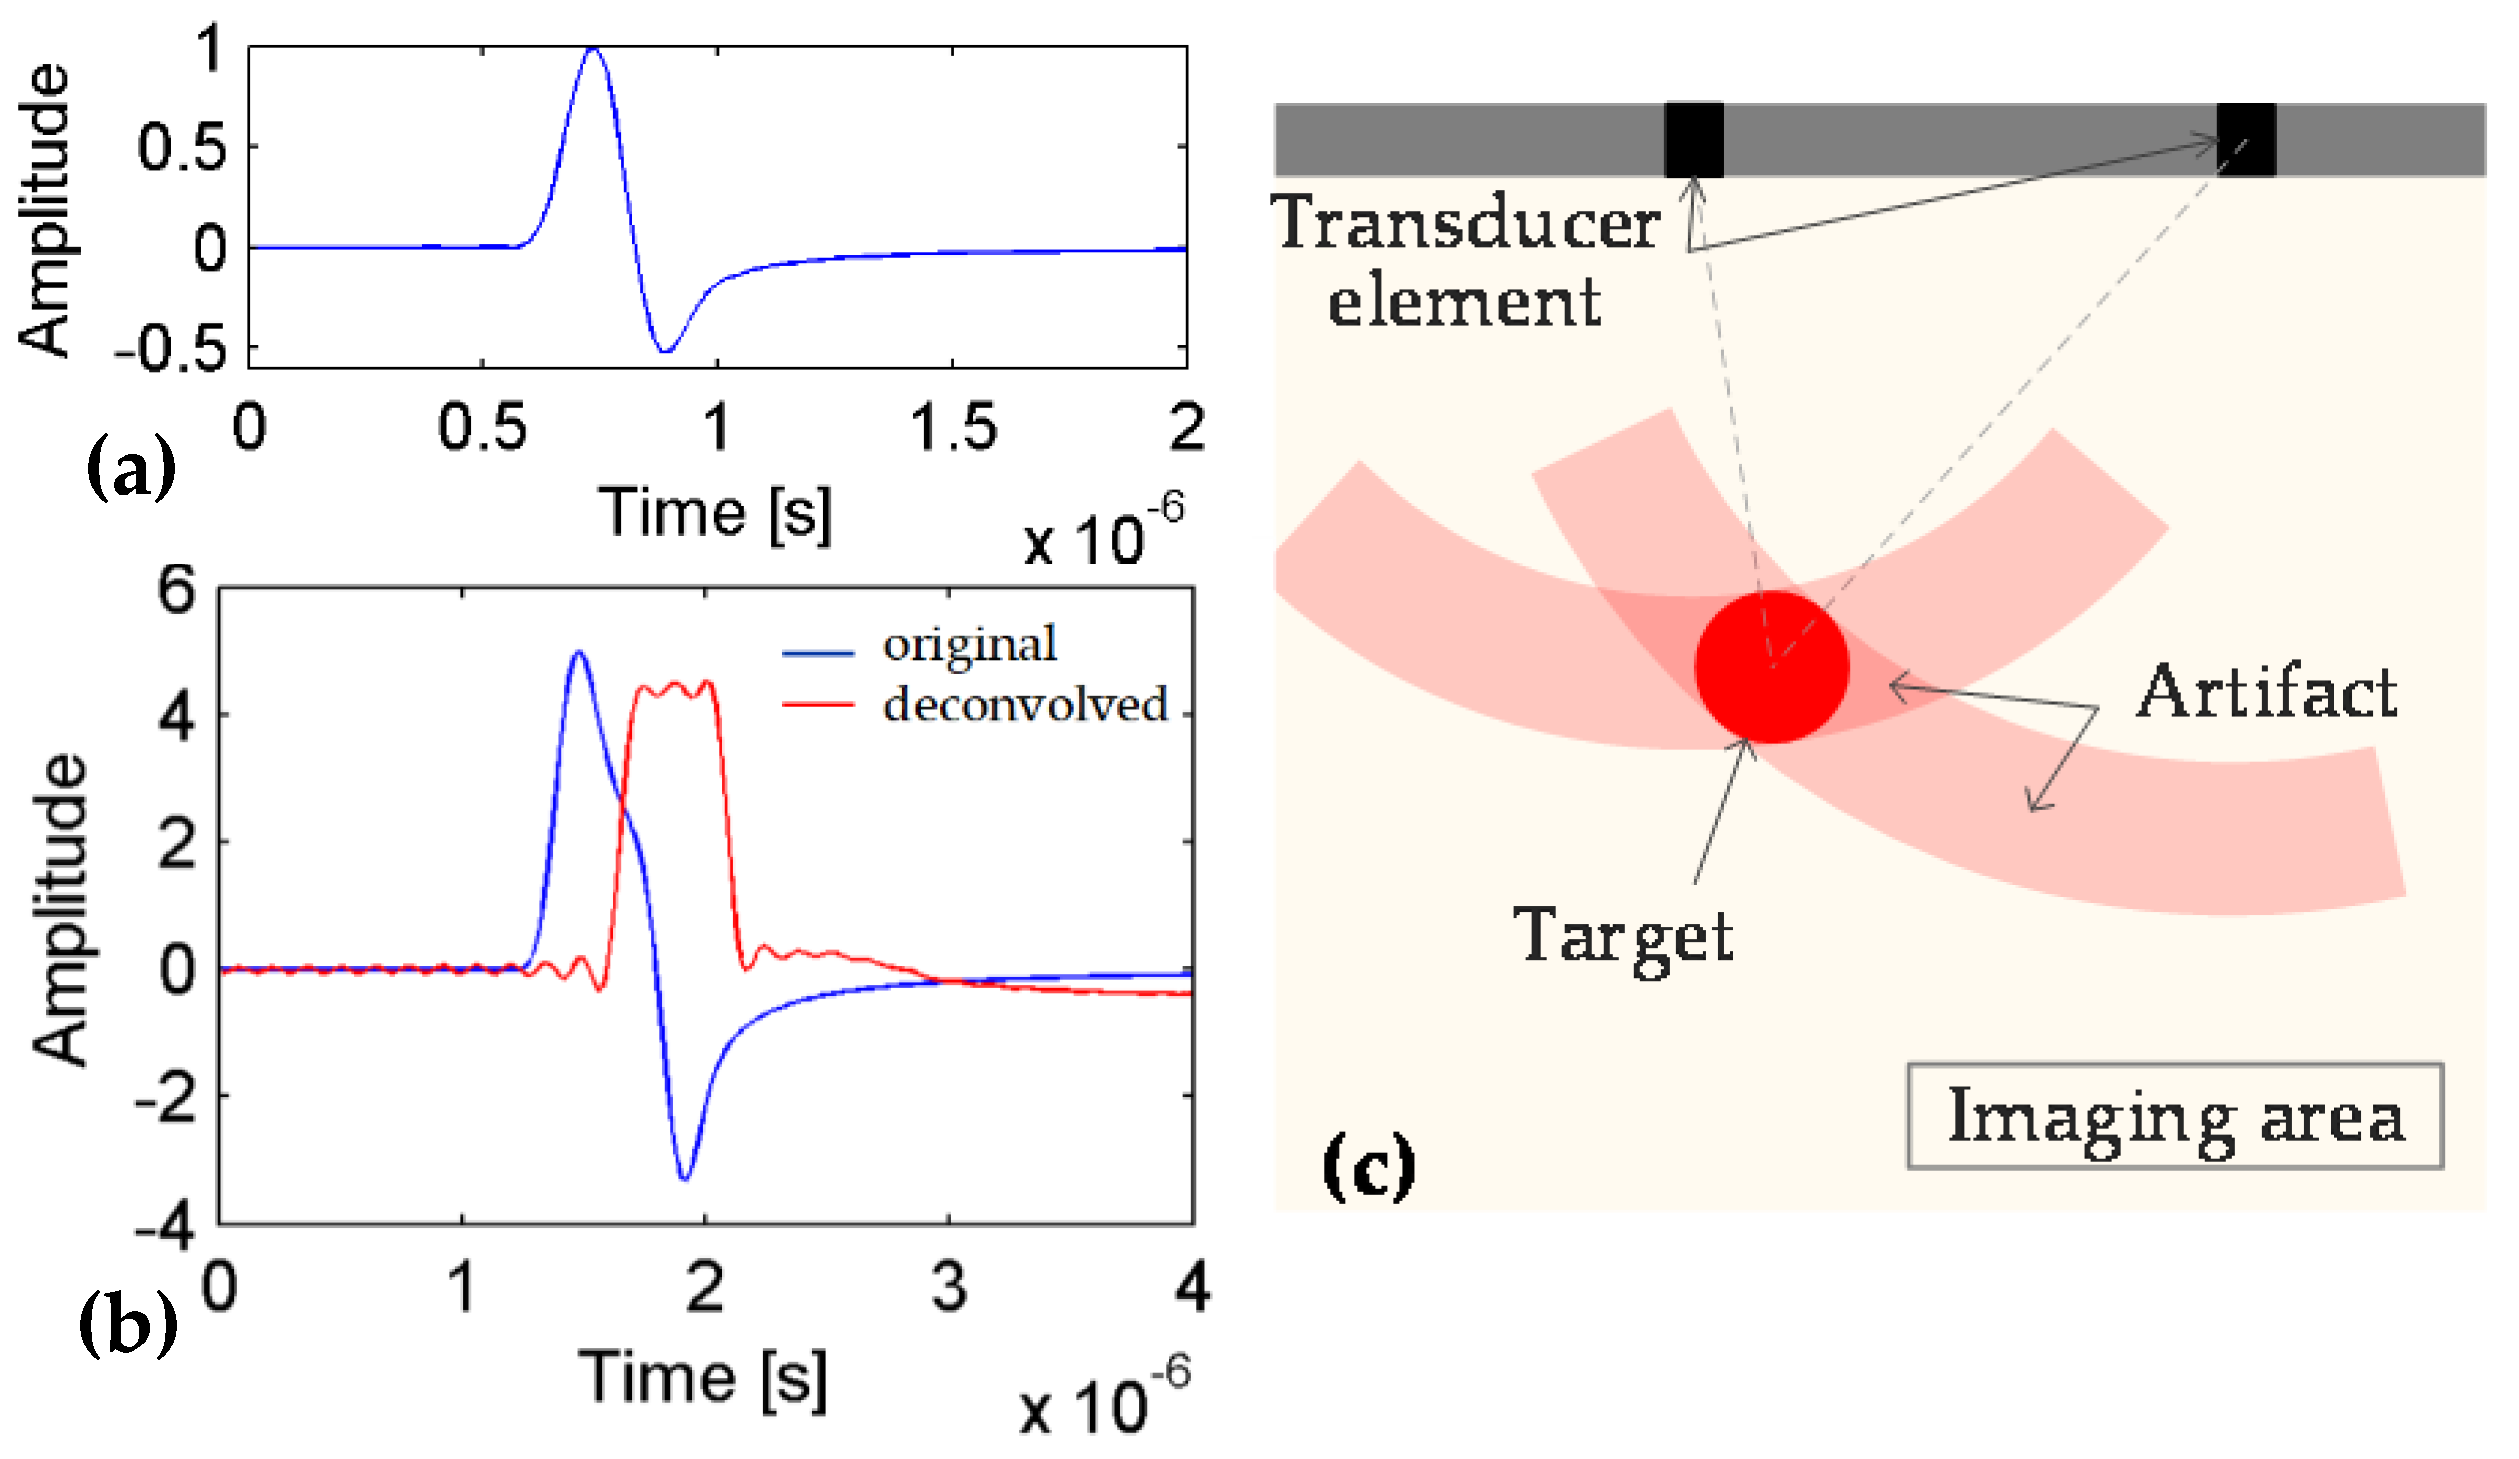
Figure 1. (a) Diagram of the normalized deconvolution kernel h ( n ) in simulation; (b) comparison of simulated signal before and after deconvolution; (c) illustration of the widespread artifacts forming process in delay-and-sum algorithm.
Applsci 08 02113 g001
Figure 2. Results of the signal processing and reconstruction in simple numeric phantom. (a) the set position of source and sensors; (b) reconstructed image of original signal; (c) reconstructed image of de-convolved signal; (d) reconstructed image of final processed signal; (e) signal processing result.
Applsci 08 02113 g002
Figure 3. Results of the signal processing and reconstruction in complex numeric phantom. (a) the set position of source and sensors; (b) reconstructed image of original signal; (c) reconstructed image of de-convolved signal; (d) reconstructed image of final processed signal; (e) signal processing result.
Applsci 08 02113 g003
Figure 4. (a) Schematic of the experimental setup; (b) the phantom used as imaging target (two rubber threads); (c) the phantom to acquire the deconvolution kernel (one tungsten wire); (d) a photo of the experiment setup.
Applsci 08 02113 g004aApplsci 08 02113 g004b
Figure 5. Diagram of the normalized deconvolution kernel in the experiment.
Applsci 08 02113 g005
Figure 6. Reconstruction results of the experiment. (a) the reconstructed image of original signal; (b) the reconstructed image of processed signal.
Applsci 08 02113 g006