Article

A New Approach to the Determination of Mineral and Organic Soil Types Based on Dilatometer Tests (DMT)

by
Simon Rabarijoely
Faculty of Civil and Environmental Engineering, Warsaw University of Life Sciences–SGGW, Nowoursynowska 159 St., 02-776 Warsaw, Poland
Appl. Sci. 2018, 8(11), 2249; https://doi.org/10.3390/app8112249
Submission received: 15 October 2018 / Revised: 3 November 2018 / Accepted: 6 November 2018 / Published: 14 November 2018

Abstract

:
In order to identify the soil type in the ground, Marchetti’s nomogram chart is commonly used on the basis of dilatometer tests (DMT). In this chart, the material index values (ID) and the dilatometer modulus (ED) are used to determine the state and type of soils predominant in mineral soils. Unfortunately, this classification is not accurate enough for the identification of organic soils. This article proposes a new classification based on a nomogram chart for both mineral soils and organic soils using (p0), (p1) readings and pore water pressure (uo).

Graphical Abstract

1. Introduction

The following tests are commonly used across the world to identify the type of mineral and organic soils in the ground of a designed object: a Standard Static Test (SPT), a Pressuremeter (PMT), a Cone Penetration Test (CPT) or a Marchetti dilatometer (DMT).
In recent years, static probing by “dilatometer penetration tests”, commonly known as DMT (Figure 1), is a widely-used method of in situ investigation of the ground to provide information needed by civil engineers for design, construction, permissions, and operation control. The results of the DMT field tests, complemented by well-established experience, need to be considered to derive the characteristic values (Xm) and to later design values (Xd) of geotechnical parameters [1,2,3,4]):
X d = X m / γ M
where γM is the partial factor of a material property.
This paper presents a review of the methods used in the identification of soils from DMT test results. Next, the analysis of the results from field test studies on six sites is presented in [5]: The DMT testing was carried out in the frame of the project of SGGW campus development [6], an experimental embankment (Antoniny site), embankment dams (Nielisz, Koszyce and Mielimąka), “Płocka subway station” and Stegny site in Warsaw. Finally, a new diagram for the identification of mineral and organic soils from DMT tests is offered.

2. Methodology and Interpretation of Dilatometer Tests

Dilatometer tests (DMT) were applied to recognize mineral and organic subsoils distinguished in the above-mentioned test sites. The details of the DMT test operation can be found in [2,7,8,9,10,11,12,13,14,15,16,17]. During the DMT tests, A, B and C readings are carried out as shown in Figure 1 [18,19]. A, B and C readings are adjusted according to the inertia impact resistance of the membrane, which allows to determine pressures p0, p1 and p2 (equ. 2 ÷ 4). The pressures p0, p1 and p2 together with the calculated value of the vertical effective stress component σ’vo and the pore water pressure uo are used to determine the following dilatometer indexes (equ. 5 ÷ 8) [1,13,17]:
-
0.05 mm corrected pressure treading in DMT p0
p o = 1.05 ( A Z M + A ) 0.05 ( B Z M B )
-
1.10 mm corrected pressure treading in DMT p1
p 1 = B Z M B
-
corrected third reading in DMT p2
p 2 = C Z M A
-
Material index ID
I d = P 1 P 0 P 0 u 0
-
Horizontal earth pressure index KD
K d = P 0 u 0 σ 0
-
Dilatometer modulus ED
E d = 34.7 · ( P 1 P 0 )
-
Water pressure index UD
U d = P 2 u 0 P 0 u 0
where:
  • p0A-pressure reading, corrected for Zm, ΔA membrane stiffness at 0.05 mm expansion, and 0.05 mm expansion itself, to estimate the total soil stress acting normal to the membrane immediately before its expansion into the soil (0.00 mm expansion).
  • p1B-pressure reading corrected for Zm and ΔB membrane stiffness at 1.10 mm expansion to give the total soil stress acting normal to the membrane at 1.10 mm membrane expansion.
  • p2C-pressure reading corrected for Zm and ΔA membrane stiffness at 0.05 mm expansion and used to estimate pore-water pressure.
  • σvo—vertical effective stress at the centre of the membrane before insertion of the DMT blade.
  • u0—pore-water pressure acting at the centre of the membrane before insertion of the DMT blade (often assumed as hydrostatic below the water table surface).
  • Zm—gage pressure deviation from zero when vented to atmospheric pressure (an offset used to correct pressure readings to the true gage pressure).
In order to reduce the necessity of using various types of equipment, field research methods are being sought that allow interpretation of the results obtained in a wide range. One of the field studies that meets this requirement is the Marchetti dilatometer [1], used more often in the country. The biggest advantage of studying the dilatometer is fast and not very complicated measurement, on the basis of which it is possible to determine the profiles of many soil parameters. The interpretation of ground parameters is based on the use of empirical relationships linking the results of measurements to the values of ground parameters [20,21]. It is standardized in the ASTM and the Eurocode [3]. The DMT has been the object of a detailed monograph by the ISSMGE Technical Committee TC16 [22,23,24].
In the case of dilatometer (DMT) investigations, the diagrams generally developed by Marchetti were commonly used [1,2] (Table 1, Figure 2). Marchetti [1] proposed a soil classification based on the ID material index where the value of the material index ID < 0.10 points to peat or sensitive clays with no clear discrimination between them. However, it should be pointed out that the diagram was developed based mainly on soil mineral tests. The Marchetti and Crapps diagram shows the relationship between the material index ID and the dilatometer modulus ED (in a log-log scale). The unit weight of soils (cohesive soils and non-cohesive soils) and their states are also presented in this diagram. Soils are classified as organic soils where the material index ID < 0.6 and the dilatometer modulus ED < 1.2 MPa.
Based on the analysis of dilatometer test results for pre-consolidated cohesive soils and organic soils, Larsson [7] proposed a revision of the value of the material index ID by taking into account the impact of pre-consolidation on the change of its value. The adjusted value of the material index ID(kor) according to Larsson’s recommendations [7] can be determined from the following relationships (Figure 3):
-
for depth < 2.0 m at KD > 2.5
I D ( k o r ) = I D 0.075 · ( K D 2.5 )
-
for depth ≥ 2.0 m at KD > 2.5
I D ( k o r ) = I D 0.035 · ( K D 2.5 )
If KD < 2.5 and/or ID ≤ 0.1 to ID(kor) = ID.
The nomogram chart proposed by Larsson [7] to determine the type of soil and its bulk density, based on the adjusted value of the material index ID(kor) and the dilatometer modulus ED, is shown in Figure 4. The characterization of soil on the corrected material index ID(kor) ≤ 0.6 (Table 1) is based on undrained shear strength τfu, using the division proposed by Leroueil and co-workers [25] (Table 2).

Geotechnical Conditions of Test Sites

This paper presents the test results of mineral and organic subsoil obtained from Antoniny and Koszyce sites located in the Noteć river valley in the Wielkopolska province, Nielisz site located in the Wieprz river valley in Lublin province, the SGGW Campus with the Department of Geotechnical Engineering SGGW, and the Stegny site located in Warsaw, where a laboratory and field testing programme has been carried out under and outside of the main dam embankment [26,27,28]. The location of all analyzed objects is shown in Figure 5. The grain size distribution curve obtained from laboratory tests for mineral soil from the described sites is presented in Figure 6.
The Antoniny test embankment was designed and performed in the frame of cooperation between the Department of Geotechnical Engineering SGGW and the Swedish Geotechnical Institute (SGI). The physical properties of the soil at the Antoniny site were determined during previous WULS-SGGW tests. The peat and gyttja layers have a thickness of 7.5 m; the ground is preconsolidated with the overconsolidated ratio OCR at 3–5 for peat, and 1.5–2.5 for gyttja [29,30,31]. The embankment was located in the Noteć river valley on organic sediments, which contain two layers: peat with a thickness of 4.1 m and gyttja with a thickness of 3.7 m. Generally, the organic subsoil is composed of amorphous peat with varying carbonate gyttja, and variable content of organic matter and calcium carbonate. In the amorphous peat, the content of organic parts Iom ranges from 65% to 75%, the content of calcium carbonate CaCO3 is equal to 10 ÷ 15% at moisture wn between 310 and 340%, and the determined liquidity limit WL is 305 ÷ 450%. The unit density ρ is 1.05 ÷ 1.10 g/cm3, when the specific density is ρs = 1.45 ÷ 1.50 g/cm3. In the calcareous gyttja, the content of organic parts Iom ranges from 5% to 20%, the content of calcium carbonate CaCO3 is equal to 65 ÷ 90% at moisture wn between 105 and 140%, and the determined liquidity limit WL is 80 ÷ 110%. The unit density ρ is 1.25 ÷ 1.40 g/cm3, whereas the specific density ρs = 2.2 ÷ 2.30 g/cm3 [26,27,28] (Table 3).
The Koszyce test dam was located in the Ruda river valley. A subsoil layer of soft organic soils was discovered in the central part of the dam. The organic soils are Quaternary deposits of an oxbow lake. The thickness of organic soils in this region generally exceeds 10 m and locally even 20 m. Dense sand occurs under the organic soils. The upper organic soils in the test area consist of a 2.5 m thick peat layer on the top of a 10.5 m thick gyttja layer underlain by a sand layer. In the amorphous peat, the content of organic parts Iom ranges from 70% to 85% and the content of calcium carbonate CaCO3 is equal to 5 ÷ 15% at moisture wn between 400% and 550%, and the determined liquidity limit WL is 450%. The unit density ρ is 1.05 ÷ 1.10 g/cm3, at the specific density ρs = 1.45 ÷ 1.50 g/cm3. Based on the index properties, the gyttja layer was sub-divided into three layers, the first one with a thickness of 2.5 to 6.3 m. In the calcareous gyttja (Gy), the content of organic parts Iom ranges from 10% to 20% and the content of calcium carbonate CaCO3 is equal to 65 ÷ 80% at moisture wn in the range of 120% and 160% and the determined liquidity limit WL is 80 ÷ 110%. The unit density ρ is 1.20 ÷ 1.35 g/cm3, at the specific density ρs = 2.1 ÷ 2.25 g/cm3. The second layer has a thickness from 6.3 to 10.5 m and represents calcareous gyttja (Gy). Its content of organic parts Iom ranges from 10% to 20% and the content of calcium carbonate CaCO3 is equal to 65 ÷ 75% at moisture wn between 180% and 220%, and the determined liquidity limit WL is 100 ÷ 110%. The unit density ρ is 1.25 ÷ 1.30 g/cm3, whereas the specific density ρs is 2.20 g/cm3. The third gyttja (calcareous-organic) (Gy) layer has the following properties: the content of organic parts Iom ranges from 10% to 15% and the content of calcium carbonate CaCO3 is equal to 70 ÷ 75% at moisture wn between 135% and 140%, and the determined liquidity limit WL is 105%. The unit density ρ is 1.30 ÷ 1.35 g/cm3, whereas the specific density ρs = 2.2 g/cm3 [26,27,28]. The static ground water level is present in the peat layer at the depth of 0.5 m below the ground surface. The preconsolidation pressure obtained from oedometer tests is higher than the initial values of effective vertical stresses, which shows that organic soils are overconsolidated with an overconsolidation ratio, OCR, in the range of 1.5 ÷ 4 [26,27,28] (Table 3).
The physical properties of the soil at the Nielisz site were determined during previous WULS-SGGW tests. The layer of soft subsoil has a thickness of 3 m to 5 m; the ground is slightly preconsolidated [29,30,31]. Two layers of organic subsoil were distinguished at the Nielisz site. In the first layer, the content of organic parts ranges from 20% to 30% at moisture between 120% and 150% and the determined liquidity limit WL is 130 ÷ 150%. The bulk density is 1.25 ÷ 1.30 g/cm3, whereas the specific density is 2.25 ÷ 2.30 g/cm3. In the second layer lying below, the content of the organic part is 10 ÷ 20% at a moisture of 105 ÷ 120% and a liquidity limit of 110 ÷ 130%; the bulk density of the layer is 1.30 ÷ 1.45 g/cm3, and the specific density is 2.30 ÷ 2.40 g/cm3. These layers are separated by sandy silt. Beyond the existing embankment under the downstream berm and the upstream slope, the soft soils are overconsolidated with an overconsolidation ratio, OCR, decreasing from 3 to 2 with depth [28] (Table 3).
Taking into account the physical and mechanical properties of the soils, five geotechnical layers were distinguished in the grounds of the WULS-SGGW Campus (Figure 6). Layer I consists of fluvioglacial layers of the Warta Glaciation (fgQpW)—medium and fine sands, with relative density Dr = 0.35 ÷ 0.55, and clay sands, sandy clays and silt with IL = 0.15 ÷ 0.20. Layer II represents the meltout sediments of the Warta Glaciation (bQpW)—medium and fine sands with ID = 0.3 ÷ 0.5, and sandy clay and clay sands with IL = 0.0 ÷ 0.20 and IL = 0.25 ÷ 0.54. Layer III is brown glacial clay from the Warta Glaciation (gQpW)—sandy clays with IL = 0.0 ÷ 0.11. Layer IV is grey glacial clay from the Odra Glaciation (gQpO)—sandy boulder clays with IL = 0.0 ÷ 0.12. Layers III and IV are similar in terms of plasticity, but clearly differ in the sand fraction content. The sandy clays layer III contains a few percent more of the sand fraction, which together with the analysis of the results of DMT sounding were the basis for the separation of these layers into sublayers. Layer V comprises river sediments of the Mazovian Interglacial (fQpM)—fine and medium sands, in the roof very compact layers with a relative density Dr = 0.8 ÷ 0.9 (Figure 6). Boulder clays with the OCR = 3 ÷ 7 are similar in terms of plasticity, but clearly differ in the content of the sand fraction [6] (Table 3).
The Stegny site is located in southern Warsaw, where a few sedimentation cycles, from sands to clays, were observed in vertical succession. The entire complex of Pliocene clays comprises of clays, silty clays (60–70%), silts (10–25%), and sands (10–20%). The CaCO3 and organic matter contents do not exceed 5% and 1%, respectively. The basic properties of the Mio-Pliocene clays are presented in Table 3.
Based on laboratory tests, Figure 4 shows the grain distribution curve for all analyzed objects.

3. Results

3.1. Dilatometer Tests Results

The test results obtained for selected sites are presented in Figure 7 and Figure 8. They were taken into account in the construction of a new classification system for organic soils presented in the following chapter.

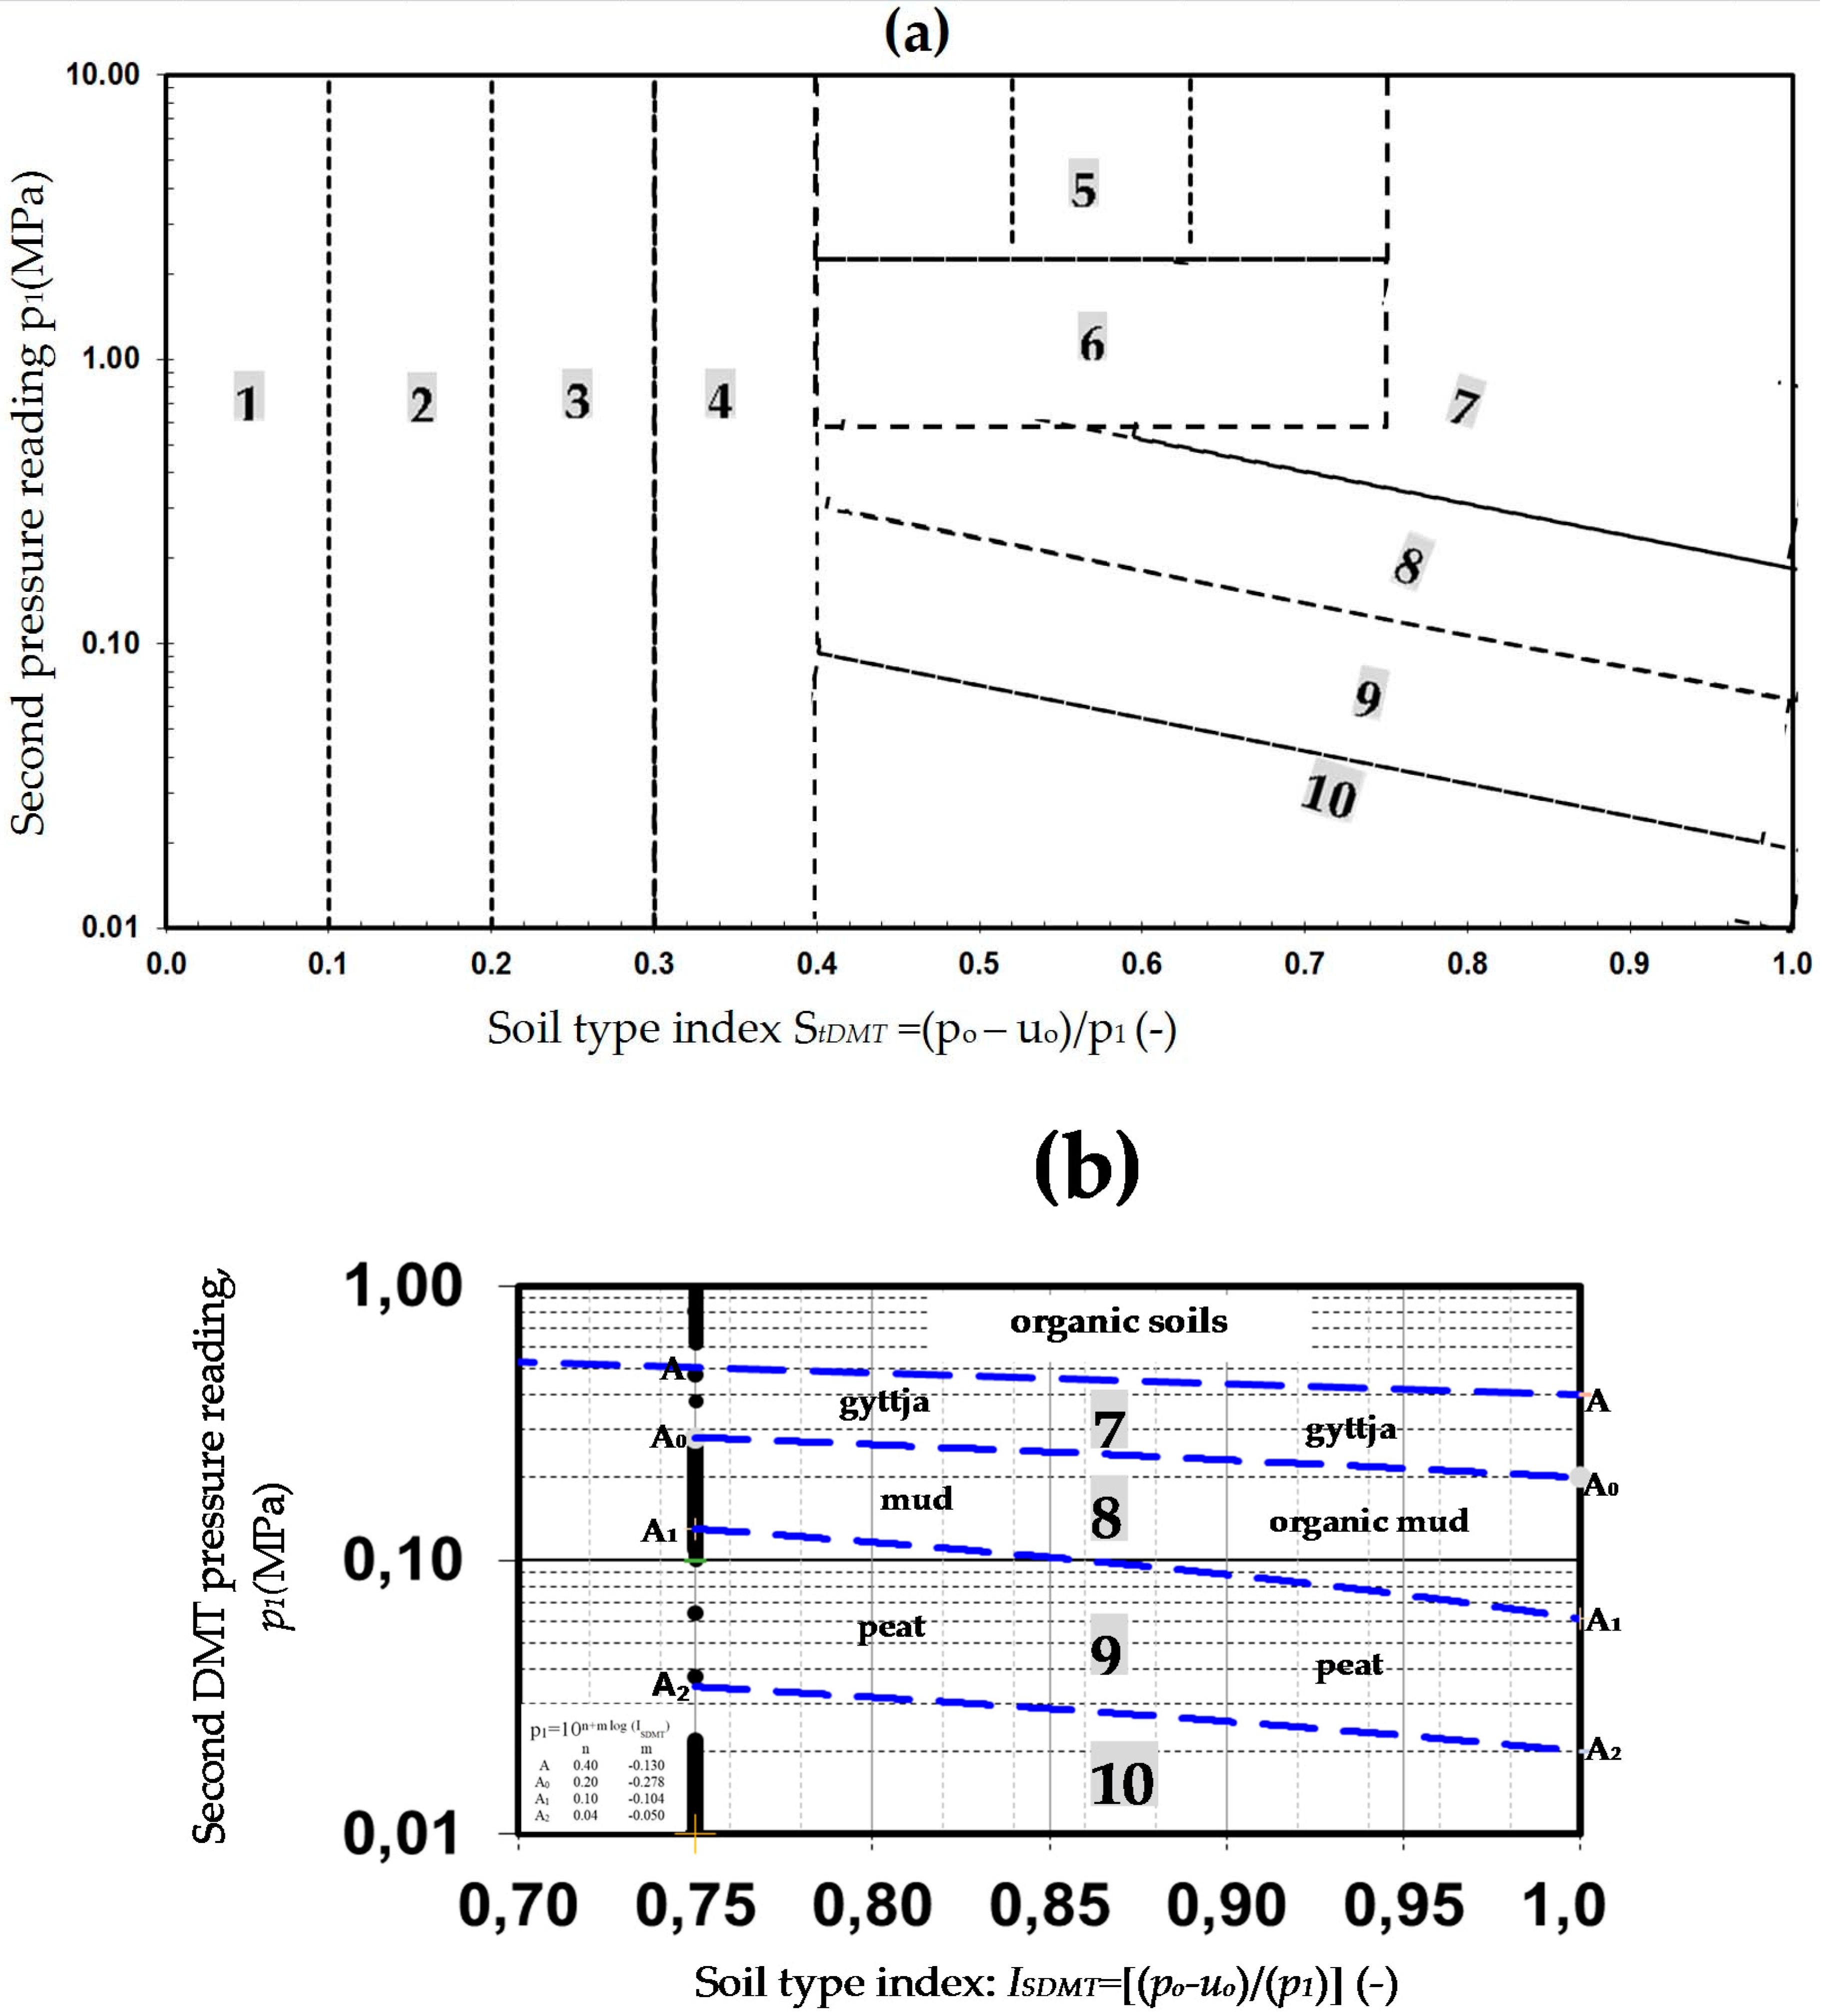
3.2. Proposed Classification Chart

The diagram chart developed in this paper is based on the diagram proposed by Marchetti and Crapps [2] (Figure 9). In this paper, based on the analysis of the dilatometer test results for pre-consolidated mineral and organic soils, it is proposed to introduce direct values p1—B-pressure reading corrected for Zm and ΔB membrane stiffness at 1.10 mm expansion to give the total soil stress acting normal to the membrane at 1.10 mm membrane expansion on the vertical axis, p0 and uo. Figure 10 shows the classification chart proposed in this paper based on p1 and soil type index ISDMT values to determine the soil type, its bulk weight, and undrained shear strength. Based on the uo, p0 and p1 values, the soil states were separated (Table 1); they were established on the undrained shear strength τfu, using the division proposed by Leroueil together with co-workers [24,32].
Analysis of the traced points on Marchetti’s nomogram by inserting the dilatometer modulus ED (MPa) on the vertical axis and the index ID (-) value on the horizontal axis shows that only this part of the non-cohesive soil area (ID > 1.8) gives clear discrimination of this group. However, the remaining soils of these divisions are not visible. Therefore, an action was undertaken to determine the boundaries of the division of a particular group of soils (residual mineral soils and organic soils); presented in Figure 10.
In order to create a mechanism for sub-dividing the area for each soil, a new interpretation of dilatometer results was proposed as follows by introducing the values p1 (MPa) and StDMT = (p0 uo)/p1. Namely, it was necessary to enter p1 (MPa) values on the vertical axis and StDMT = (p0 uo)/p1 values on the horizontal axis. On the basis of this technique, it can be noticed that in the case of non-cohesive soils, results similar as in Marchetti’s nomogram will be obtained. However, for both cohesive soils and organic soils, this new approach gives a clear subdivision of the area for a specific soil. As shown in Figure 10, seven areas may currently be distinguished. The areas are depicted by variously coloured dashed lines: the line in black represents non-cohesive soils, the line in blue stands for silt soils, the line in brown represents clay soils, the line in violet is the transition area, the line in red is gyttja, the line in green is mud and organic mud, and the line in grey represents peat.
To recognize the residual mineral soils and organic soils in a more detailed manner compared to Marchetti and Crapps [2], the proposed diagram shows the relationship between the second reading p1 and the soil type index ISDMT (Equation (11)). The ISDMT soil type index values can be calculated using Equation (11). Subsoils are classified as organic soils when the soil type index 0.40 < ISDMT ≤ 1.0 and the second pressure dilatometer reading p1 is in the range of 0.01 MPa < p1 ≤ 1.0 MPa (Table 4 and Table 5). The new diagram contains 10 areas: 1 ÷ 4—non-cohesive soils, 5—silt, 6—clay, 7—gyttja, 8—mud/organic mud, and 9 ÷ 10—peat (Figure 11a–c). For a more precise subdivision of organic soils, an additional nomogram chart was developed for areas 7, 8, 9 and 10. The detailed form and the use of this nomogram chart is shown in Figure 11b,c.
Soil type index:
I S D M T = p 0 u o P 1

4. Conclusions

Peat and gyttja, as well as organic mud, are located in the lower boundary zone of mineral soils, and in some cases, slightly above the limit set by Marchetti for organic soils. A very good and effective complement to this system are the methods developed in this article. The new system facilitates a more accurate separation of soils in the group into gyttia, peat, organic mud, clay, silt, and sands. This possibility is also confirmed in this study, in which gyttjas are relatively well-discriminated from organic mud, and peat is clearly separated from organic mud. In addition, distinct subdivisions can also be seen between silt, clay, and sand.
An analysis of the subsoil of mineral and organic soils that have been carried out in the DMT study allow for the conclusion that the identification of the zone and the range of non-cohesive, cohesive, and organic soils in the subsoil is possible by means of DMT classification systems using p0, p1 and uo parameters. The effectiveness of the systems depends on the complex number of factors affecting the parameters measured in DMT (p0, p1).

Acknowledgments

This work was supported by the Polish Ministry of Science and Higher Education.

Conflicts of Interest

The author declare no conflict of interest.

References

  1. Marchetti, S. In Situ Tests by Flat Dilatometer. J. Geotech. Geoenviron. Eng. 1980, 106, 299–321. [Google Scholar]
  2. Marchetti, S.; Crapps, D.K. Flat Dilatometer Manual; Internal Report of GPE; GPE Inc.: Gainesville, FL, USA, 1981. [Google Scholar]
  3. EN 1997-1. Eurocode 7: Geotechnical Design—Part 1; General Rules; CEN: Brussels, Belgium, 2001.
  4. Frank, R.; Bauduin, C.; Driscoll, R.; Kavvadas, M.; Krebs Ovesen, N.; Orr, T.; Schuppener, B. Designers’ Guide to EN 1997-1 Eurocode 7: Geotechnical Design–General Rules; Thomas Telford Service Ltd.: London, UK, 2004; 216p. [Google Scholar]
  5. Lechowicz, Z. Profiling of stress history in organic soils by dilatometer test. Ann. Wars. Agric. Univ. SGGW Land Reclam. 1997, 28, 97–105. [Google Scholar]
  6. Interrim Reports—Geotechnical Documentations for Design SGGW Campus Building (2000–2005); Department of Geotechnical Engineering, SGGW: Warsaw, Poland, 2000–2005. (In Polish)
  7. Larsson, R. Dilatometr Försök för Bedömning au Jordlagerföljd och Egenskaper i Jord. Information No. 10 [Dilatometer Test. An In-Situ Method for the Determination of Layer Sequences and Soil Properties. Information No. 10]; Swedish Geotechnical Institute: Linköping, Sweden, 1989. (In Swedish)
  8. Mayne, P.W. Evaluating effective stress parameters and undrained shear strength of soft-firm clays from CPT and DMT. In Pursuit of Best Practices—Proceedings of the 5th International Conference on Geotechnical & Geophysical Site Characterization (ISC-5), Queensland, Australia, 5-9 September; Australian Geomechanics Society: Sydney, Australia, 2016; Volume 1, pp. 19–40. ISBN 978-0-9946261-1-0. [Google Scholar]
  9. Long, M.; Boylan, N.; Powell, J.; O’Connor, S.; Donohue, S. Characterisation of the soils beneath the flood banks along the River Thames estuary. In Proceedings of the 4th International Workshop—Soil Parameters from In Situ Tests, Poznań, Poland, 27 September 2010; pp. 395–411. [Google Scholar]
  10. Schmertmann, J.H. Suggested method for performing the flat dilatometer test. ASTM Geotech. Test. J. 1988, 9, 93–101. [Google Scholar]
  11. Briaud, J.; Miran, J. The Flat Dilatometer Test; Report No. FHWA-SA-91-044; US DOT Federal Highway Administration: Springfield, VA, USA, February 1992; pp. 1–102.
  12. Młynarek, Z.; Niedzielski, A.; Tschuschke, W. Variability of shear strength and physical parameters of peat. In Proceedings of the 7th Danube European Conference on Soil Mechanic and Foundation Engineering, Kishinev, Mołdawi, 2–5 October 1983; pp. 93–98. [Google Scholar]
  13. Lechowicz, Z.; Rabarijoely, S. Dilatometer C-reading to help determine stratigraphy of organic subsoil. Ann. Wars. Agric. Univ. Land Recl. 2000, 29, 71–78. [Google Scholar]
  14. Młynarek, Z.; Tschuschke, W.; Wierzbicki, J.; Marchetti, S. Interrelationship between shear and deformation parameters for gytta and peat from CPT and DMT tests. In Proceedings of the 13th Danube European Conference on Geotechnical Engineering, Ljubljana, Slovenia, 29–31 May 2006. [Google Scholar]
  15. Młynarek, Z.; Wierzbicki, J.; Long, M. Factors affecting CPTU and DMT characteristics in organic soils. In Proceedings of the 11th Baltic Sea Geotechnical Conference: Geotechnical in Marintime Engineering, Gdańsk, Poland, 15–18 September 2008; Młynarek, Z., Sikora, Z., Dembicki, E., Eds.; Polish Committee on Geotechnics & Gdańsk University of Technology: Gdańsk, Poland, 2008; Volume 1, pp. 407–417. [Google Scholar]
  16. Młynarek, Z.; Wierzbicki, J.; Stefaniak, K. CPTU, DMT, SDMT results for organic and fluvial soils. In Proceedings of the 2nd International Symposium on Cone Penetration Testing (CPT ‘10), Huntington Beach, CA, USA, 9–11 May 2010; pp. 455–462. [Google Scholar]
  17. Bihs, A.; Long, M.; Marchetti, D.; Ward, D. Interpretation of CPTU and SDMT in organic, Irish soils. In Proceedings of the 2nd International Symposium on Cone Penetration Testing, CPT10, Huntington Beach, CA, USA, 9–11 May 2010; Volume 2, pp. 257–264. [Google Scholar]
  18. Lutenegger, A.J.; Kabir, M.G. Dilatometer C-reading to help determine stratigraphy. Proc. Int. Sym. Penetr. Test. 1988, 1, 549–553. [Google Scholar]
  19. Totani, G.; Calabrese, M.; Marchetti, S.; Monaco, P. Use of in situ flat dilatometer (DMT) for ground characterization in the stability analysis of slopes. In Proceedings of the 14th International Conference on Soil Mechanics and Foundation Engineering, Hamburg, Germany, 6–12 September 1997; pp. 607–610. [Google Scholar]
  20. Jamiolkowski, M.; Leroueil, S.; LO Presti, D.C.F. Design parameters from theory to practice. Theme lecture. In Proceedings of the International Conference on Geotechnical Engineering for Coastal Development, Yokohama, Japan, 3–6 September 1991. [Google Scholar]
  21. Młynarek, Z. Badania laboratoryjne oraz badania podłoża in situ. Referat generalny. Mat. na XI Kraj. Konf. Mech. Grunt. i Fund 1997, 3, 113–126. [Google Scholar]
  22. Marchetti, S.; Monaco, P.; Totani, G.; Marchetti, D. In situ tests by Seismic Dilatometer (SDMT). In From Research to Practice in Geotechnical Engineering; ASCE Geotechnical Special Publication N°. 180 Honouring; Schmertmann, J.H., Ed.; American Society Of Civil Engineers: New Orleans, LA, USA, March 2008; pp. 292–311. [Google Scholar]
  23. Amoroso, S. Use of seismic dilatometer for design infrastructures. In Proceedings of the Conference on 18th Southeast Asian Geotechnical & Inaugural AGSSEA Conference, Singapore, 29–31 May 2013; pp. 663–669. [Google Scholar]
  24. Ouyang, Z.; Mayne, P. Effective Stress Strength Parameters of Clays from DMT. Geotech. Test. J. 2018, 41, 851–867. [Google Scholar] [CrossRef]
  25. Lerouel, S.; Magnan, J.; Tavenas, F. Embankments on Soft Clays; English Edition; Wood, D.M., Translator; Ellis Horwood: New York, NY, USA, 1990; 360p. [Google Scholar]
  26. Wolski, W.; Szymański, A.; Mirecki, J.; Lechowicz, Z.; Larsson, R.; Hartlen, J.; Garbulewski, K.; Bergdahl, U. Two Stage-Constructed Embankments on Organic Soils; Report 32; Swedish Geotechnical Institute: Linköping, Sweden, 1988.
  27. Wolski, W.; Szymański, A.; Lechowicz, Z.; Larsson, R.; Hartlen, J.; Bergdahl, U. Full-Scale Failure Test on Stage-Constructed Test Fill on Organic Soil; Report 36; Swedish Geotechnical Institute: Linköping, Sweden, 1989.
  28. Lechowicz, Z.; Rabarijoely, S. Wykorzystanie badań in situ w ocenie wzmocnienia słabonośnego podłoża zapory budowanej etapowo. The use in situ tests in the evaluation of subsoil strengthening at stages in dam construction. Mat. na VII Konf. Tech. Kon. Zap. 1996, 231–240. (In Polish) [Google Scholar]
  29. Rabarijoely, S. The Use of Dilatometer Test for Evaluation of Organic Soil Parameters. Ph.D. Thesis, Warsaw Agricultural University—SGGW, Land Reclamation, Warszawa, Poland, 2000. (In Polish). [Google Scholar]
  30. Lechowicz, Z.; Rabarijoely, S.; Szczypiński, P. Wykorzystanie badań dylatometrycznych do określenia rodzaju gruntów organicznych. The use of dilatometer test to determine the type and state of organic soils. In Przegląd Naukowy Wydziału Melioracji i Inżynierii Środowiska; SGGW: Warszawa, Poland, 2004; pp. 191–201. (In Polish) [Google Scholar]
  31. Lechowicz, Z.; Fukue, M.; Rabarijoely, S.; Sulewska, M.J. Evaluation of the Undrained Shear Strength of Organic Soils from a Dilatometer Test Using Artificial Neural Networks. Appl. Sci. 2018, 8, 1395. [Google Scholar] [CrossRef]
  32. Smagin, A.V.; Sadovnikova, N.B.; Vasenev, V.I.; Smagina, M.V. Biodegradation of Some Organic Materials in Soils Band Soil Constructions: Experiments, Modeling and Prevention. Materials 2018, 11, 1889. [Google Scholar] [CrossRef] [PubMed]
Figure 1. Marchetti dilatometer: (a)—flat blade, 1—electric wire, 2—pneumatic tubing, 3—steel membrane, (b)—test stages, 4—pushing, 5—contact stress p0, 6—expansion stress p1, 7—pressure p2, c: view of DMT blade actually used in soil in situ tests.
Applsci 08 02249 g001
Figure 2. Chart for estimating soil type and unit weight for soil (normalized to γw) [1,2].
Applsci 08 02249 g002
Figure 3. Difference between material index (ID(Mar)) and material index ID(kor) for different clay content depending on the horizontal stress index KD [7].
Applsci 08 02249 g003
Figure 4. Chart for estimating mineral and organic soils [7].
Applsci 08 02249 g004
Figure 5. Location of test sites in the region of Poland.
Applsci 08 02249 g005
Figure 6. Grain size distribution curve obtained from laboratory tests for the mineral soils from the described sites.
Applsci 08 02249 g006
Figure 7. Profiles of p0, p1 and p2 from dilatometer (DMT) and hydrostatic pressure uo tests: (a) for the Antoniny site; (b)—for the Nielisz subsoil; (c)—for the Stegny subsoil; (d)—for the SGGW Campus subsoil [30,31].
Applsci 08 02249 g007
Figure 8. Profiles of material indexes ID from the DMT tests carried out for the subsoil of the Nielisz, Stegny and the SGGW Campus sites: (a)—before loading, (b)—after loading for Nielisz site; 1—measured values, 2—average values ± one standard deviation.
Applsci 08 02249 g008
Figure 9. Chart for estimating soil type and unit weight (normalized to γw) [2].
Applsci 08 02249 g009
Figure 10. Variation of p1 with soil type index St_DMT = (p0 uo)/p1.
Applsci 08 02249 g010
Figure 11. Chart estimating the type and state of residual mineral soils and organic soils.
Applsci 08 02249 g011aApplsci 08 02249 g011b
Table 1. Soil classification based on material index ID [1].
Soil TypeMaterial Index ID (-)
Organic soils and cohesive soilsPeat/Sensitive clays<0.10
Clay0.10–0.35
Silty clay0.35–0.60
Clayey silt0.60–0.90
Silt0.90–1.20
Sandy silt1.20–1.80
non-cohesive soilsSilty sand1.80–3.30
Sand>3.30
Table 2. Soil states based on undrained shear strength [25].
Description of Soil StateUndrained Shear Strength τfu [kPa]
Very soft<12.5
Soft12.5–25
firm25–50
Stiff50–100
Very stiff100–200
Hard>200
Table 3. Index properties of organic soils at the Antoniny, Koszyce, Nielisz, Stegny and SGGW Campus test sites.
SiteType of SoilOrganic Content Iom [%]CaCO3 Content [%]Water Content wn [%]Liquid Limit wL [%]Density
Unit Weight of Soil ρ [t/m3]Specific Weight of Soil ρs [t/m3]
Antoninyamorphous Peat65–7510–15310–340305–4501.05–1.101.45–1.50
calcareous Gyttja5–2065–90105–14080–1101.25–1.402.2–2.30
Koszyceamorphous Peat70–855–15400–5504501.05–1.11.45–1.50
calcareous Gyttja (Gy)10–2065–80120–16080–1101.20–1.352.1–2.25
calcareous Gyttja (Gy)15–2065–75180–220100–1101.25–1.302.2
NieliszOrganic mud (Mor)20–30-120–150130–1501.25–1.302.25–2.3
Organic mud (Mor)10–20-105–120110–1301.30–1.452.30–2.40
StegnyPliocene clays--19.20–28.5067.6–88.02.1–2.22.68–2.73
SGGW CampusBoulder clay--5.20–20.1021.9–26.62.0–2.22.68–2.73
Table 4. Proposed soil classification based on ISDMT and p1 from in situ (DMT) tests.
ZoneDescriptionρ (t/m3)ρd (t/m3)Void Ratio e (-)wn (%)p1 (MPa)ISDMT (-)τfu (MPa) from FVT
Residual mineral soils
1Coarse sand (CSa)1.70 ÷ 2.151.65 ÷ 2.00.20 ÷ 0.484.0 ÷ 250.2 ˂ p1 ≤ 100.0 ÷ 0.10.10 ≤ τfu < 0.30
2Medium sand (MSa)1.70 ÷ 2.151.65 ÷ 2.00.20 ÷ 0.484.0 ÷ 250.2 ˂ p1 ≤ 100.1 ÷ 0.20.10 ≤ τfu < 0.30
3Fine sand (Fsa)1.70 ÷ 2.151.60 ÷ 2.00.20 ÷ 0.485.0 ÷ 280.2 ˂ p1 ≤ 100.2 ÷ 0.30.10 ≤ τfu < 0.30
4Silty sand(siSa)1.70 ÷ 2.151.59 ÷ 2.00.20 ÷ 0.485.0 ÷ 280.2 ˂ p1 ≤ 100.3 ÷ 0.40.10 ≤ τfu < 0.30
5SILT(Si)1.60 ÷ 2.101.4 ÷ 1.900.18 ÷ 0.7010 ÷ 302.0 ˂ p1 ≤ 100.4 ÷ 0.750.02 ≤ τfu < 0.5
6CLAY(Cl)1.60 ÷ 2.101.50 ÷ 1.700.18 ÷ 0.4020 ÷ 400.5 ˂ p1 ≤ 20.4 ÷ 0.750.02 ≤ τfu < 0.6
Organic soils
7Gyttja (Gy)1.20 ÷ 1.400.50 ÷ 0.602.5 ÷ 3.2;110% ÷ 150%0.09 ≤ p1 ˂0.20.40 ˂ ISDMT ≤ 1.00.0125 ≤ τfu < 0.0255
8Mud (M) or Organic mud (Mor)1.25 ÷ 1.700.54 ÷ 0.672.6 ÷ 3.2;110% ÷ 140%0.2 ˂ p1 ≤ 0.50.0255 ≤ τfu < 0.0505
9peat1.05 ÷ 1.100.17 ÷ 0.2444.5 ÷ 7.3350% ÷ 500%p1 ˂ 0.09τfu < 0.0125
10τfu > 0.0125
Table 5. Proposed soil classification based on ISDMT and p1 from in situ (DMT) tests.
Soil Types\ParametersResidual Mineral SoilsOrganic Soils
Non-Cohesive SoilsCohesive SoilsGyttja (Gy)Mud (M) and Organic Mud (Mor)Peat
ISDMT0.0 ˂ ISDMT ≤ 0.40.4 ˂ ISDMT ≤ 0.750.4 ˂ ISDMT ≤ 1.0
p1 (MPa)0.1 ˂ p1 ≤ 101.0 ˂ p1 ≤ 100.09 ≤ p1 ˂ 0.20.2 ˂ p1 ≤ 0.5p1 ˂ 0.09

