Article

Prognostic Assessment of the Viability of Hydrothermal Liquefaction as a Post-Resource Recovery Step after Enhanced Biomethane Generation Using Co-Digestion Technologies

1
Department of Physics, University of Otago, PO Box 56, 9016 Dunedin, New Zealand
2
Department of Food Science, University of Otago, 9016 Dunedin, New Zealand
*
Author to whom correspondence should be addressed.
Appl. Sci. 2018, 8(11), 2290; https://doi.org/10.3390/app8112290
Submission received: 8 October 2018 / Revised: 6 November 2018 / Accepted: 16 November 2018 / Published: 19 November 2018
(This article belongs to the Section Environmental Sciences)

Abstract

:

Featured Application

The proposed integrated system investigated in this paper may provide the basis for simultaneous sterilization and enhanced resourced recovery from organic waste streams in future studies.

Abstract

In line with global efforts at encouraging paradigm transitions from waste disposal to resource recovery, the anaerobic co-digestion of substrates of wet hydrolyzed meat processing dissolved air flotation sludge and meat processing stock yard waste was investigated in the present study. It was demonstrated that the co-digestion of these substrates leads to the introduction of co-digestion synergizing effects. This study assessed biomethane potentials of the co-digestion of different substrate mixtures, with the preferred substrate mixture composed of stockyard waste and wet hydrolyzed meat processing dissolved air flotation sludge, present in a 4:1 ratio on a volatile solid mass basis. This co-digestion substrate mix ratio presented an experimentally determined cumulative biomethane potential of 264.13 mL/gVSadded (volatile solid). The experimentally determined cumulative biomethane potential was greater than the predicted maximum cumulative biomethane potential of 148.4 mL/gVSadded, anticipated from a similar substrate mixture if synergizing effects were non-existent. The viability of integrating a downstream hydrothermal liquefaction processing of the digestate residue from the co-digestion process, for enhanced resource recovery, was also initially assessed. Assessments were undertaken via the theoretical based estimation of the yields of useful products of biocrude and biochar obtainable from the hydrothermal liquefaction processing of the digestate residue. The environmental sustainability of the proposed integrated system of anaerobic digestion and hydrothermal liquefaction technologies was also initially assessed. The opportunity for secondary resource recovery from the digestate, via the employment of the hydrothermal liquefaction process and the dependence of the environmental sustainability of the integrated system on the moisture content of the digestate, were established. It is anticipated that the results of this study will constitute an invaluable basis for the future large-scale implementation of the proposed integrated system for enhanced value extraction from organic waste streams.

Graphical Abstract

1. Introduction

Previous investigations have proposed the feasibility of utilizing readily available meat processing waste streams as sustainable biorefinery feedstocks for biochemical and biofuel production [1]. Recent studies have demonstrated that meat processing dissolved air flotation (DAF) sludge can serve as a cheap and sustainable biodiesel feedstock via an integrated two-step in-situ hydrolysis and esterification pathway [2]. Crucially however, the utilization of meat processing DAF sludge as a biodiesel feedstock will result in the generation of significant masses of wet hydrolyzed DAF sludge (WHDS) after the biodiesel production process [3,4]. This WHDS residue was identified as constituting a secondary waste stream that must be efficiently utilized to prevent possible secondary pollution issues. Recognizing that the WHDS residue contains masses of useful degradable organics, the anaerobic digestion of the WHDS residue has been proposed as a viable pathway for the efficient low-cost utilization of this residue. This is because anaerobic digestion (AD) conversion processes are recognized as highly effective pathways for cheap biomethane generation via an oxygen-free microbial degradation of organics [5]. The high moisture content of WHDS, however, suggests that the technical feasibility of utilizing WHDS as a sustainable AD feedstock may be severely inhibited, since reduced concentrations of degradable substrates will lead to uncompetitive biomethane potentials [6,7]. A review of literature has suggested that the application of the anaerobic co-digestion (ACD) technological pathway may constitute a viable approach that will efficiently circumvent concerns associated with poor biomethane generation arising from low substrate concentrations [6,7,8]. This is because apart from enabling an increase in the mass of biodegradable material available for degradation, ACD may provide an opportunity for the introduction of favorable substrate synergizing effects via the dilution of any unwanted residual compounds that may influence nutrient availability to anaerobic microbes [6,7]. One possible unwanted chemical that may be retained in trace quantities within the WHDS substrate is non-polar hexane that is employed during the recovery of the fatty acid products from the lab-scale in-situ hydrolysis process [3]. There is, however, also a risk of introducing unfavorable antagonizing effects in a co-digestion mixture. In the case of such antagonizing effects, the potential benefits of increased substrate concentration available for biodegradation are outweighed by the negative effect of possible toxicity of one of the substrates [9]. Evidently, the abundance of several ACD studies in the literatures reinforces the current research interest in the co-digestion approach. Examples of such studies include the researches by Li et al. [9], Huang et al. [10] and González et al. [11]. Li et al. [9] investigated the ACD of chicken processing waste and Miscanthus and ACD of chicken manure and sea grass for different mix ratios by mass of 1:1, 1:3 and 3:1. They showed that the ACD of chicken processing waste and Miscanthus presented antagonizing effects, manifested as reduced biomethane potentials relative to the predicted biomethane potential when the substrates were degraded in the absence of antagonizing effects. Additionally, they showed that synergizing effects were introduced when the ACD of chicken manure and sea grass was undertaken. These synergizing effects were manifested by enhanced biomethane potentials in all co-digestion substrate mixtures investigated relative to the predicted biomethane potentials when the substrates were degraded in the absence of synergizing effects. The study undertaken by Huang et al. [10] assessed biomethane potentials from the ACD of aloe peel waste and dairy manure for different substrate mix ratios by mass of 1:0, 3:1, 1:1, 1:3 and 0:1. They demonstrated the presence of synergizing effects, manifested as higher biomethane potentials recorded when the substrates were co-digested, relative to the predicted biomethane potential when the substrates were digested independently of the synergizing effects. They also showed that the ACD of aloe peel waste and dairy manure in a substrate mix ratio by mass of 3:1 resulted in the highest biomethane potential. González et al. [11] investigated the ACD of substrate mixtures composed of vinasse and press mud substrates in the mix ratios of 0:1, 1:0, 1:3, 3:1 and 1:1 on a chemical oxygen demand (COD) mass basis. In the work of González et al., it was demonstrated that the ACD of substrate mixtures composed of vinasse and press mud substrates resulted in the introduction of synergizing effects which were also expressed as enhanced biomethane potentials. They showed that the ACD of vinasse and press mud substrates in the substrate mass mix ratio of 3:1 resulted in the highest biomethane potential. The present study, therefore, seeks to experimentally investigate the preferred substrate mix ratio for the co-digestion of WHDS residue and stockyard (SY) waste. The influence of the carbon to nitrogen (C/N) ratio of each substrate mixture on the biomethane potential is also investigated, as previous studies have demonstrated that the preferred C/N ratio for an improved biomethane potential are largely substrate specific and may range from 9 [12] to 30 [13] for different AD processes. The stockyard waste employed as a co-digestion substrate is obtained from animal holding pens and is composed of mainly livestock fecal matter, with over 15 megatons of fecal matter estimated to be generated per year in New Zealand [14]. The SY waste also contains residual animal food due to spills from feeding troughs, water due to spills from watering troughs, water from periodic ‘wash-down’ operations and liquid animal secretions (urine). Therefore, the SY waste stream was selected as a viable co-digestion substrate, as it provides a sustainable supply of useful biomass in New Zealand due to its obvious abundance (Frances Wise, Group Environmental Manager, Alliance Group Limited, New Zealand personal communication, 15 September 2016).
This investigation also recognizes that while the ACD of WHDS and SY waste may lead to improvements in specific biomethane productivity, the associated increase in substrate concentrations will lead to an upsurge in the volume of wet residual digestate generated. This upsurge in the generation of the wet residual digestate will exacerbate existing challenges associated with the storage, handling and management of digestate [15]. The handling of the wet residual digestate is usually achieved via complex processing steps that emphasize digestate treatment prior to its disposal to the environment rather than value extraction [16]. The digestate processing steps applied serve to minimize associated health risks due to the exposure of livestock and humans to zoonotic agents that may be retained in the digestate [17]. These zoonotic agents are responsible for infections in animals such as foot-and-mouth disease and infections in humans such as influenza and salmonellosis [17]. The need for extensive digestate processing is also reinforced by Risberg et al. [18]. They stated that, in addition to the presence of residual pathogens, digestate could also contain heavy metals and antibiotic residues. This explains the varying effects (positive or negative) of the application of organic fertilizers on the soil microbial community. Given that there is a possibility of escalating digestate handling costs due to the increased mass of digestate residue obtainable from the application of the ACD approach, an alternative one-step hydrothermal liquefaction (HTL) digestate processing operation is proposed as a viable intensification technology that will simplify existing digestate processing methods. Digestate processing using the proposed one-step HTL digestate technology has the capacity of being a preferred digestate handling pathway, because the HTL of the digestate will facilitate the sterilization of the digestate stream while also enabling the production of useful product streams via a ‘one-step’ process. A simplified illustration of the proposed one-step digestate processing technology compared to existing digestate processing technologies is presented in Figure 1.
Figure 1 shows that digestate handling requires a solid-liquid phase separation stage to enable the separation of the solid and the liquid phases [19]. Having separated the solid and the liquid phases, a portion of the separated liquid fraction is subjected to tertiary treatment via advanced oxidation technologies to sterilize the liquid fraction prior to its disposal in surrounding water bodies [1]. Another portion of the liquid fraction is recirculated to the AD digester to help replenish the microbial population, thereby sustaining the anaerobic degradation process. Finally, some of the solid fractions are stabilized via drying and composting to aid storage of the remaining solid fraction to be directly introduced to agricultural lands [16]. On the other hand, the proposed hydrothermal liquefaction of the digestate will incorporate a single transformation step with product separation achieved simply by exploring the hydrophobicity of biocrude and the surface properties of biochar, such as porosity and particle size of the product streams [20]. The introduction of the HTL technology as a viable resource recovery strategy from biogas digestate residue will also eliminate the need for additional hygienisation treatments of any by-product streams due to the high temperature and high pressure operating conditions imposed during HTL processes [1]. Therefore, the present study hypothesizes that a shift from the traditional complex and costly digestate handling method to an alternative methodology that employs a one-step HTL processing of the digestate, will promote the efficient handling of the digestate with the additional benefit of enhanced resource recovery.
In summary, in the present study, the preferred substrate mix ratio, on a volatile solid (VS) basis, for enhanced biomethane production from the co-digestion of the WHDS and the SY waste has been investigated. The dependence of biomethane potential on the C/N ratio of the substrate mixtures and an assessment of the suitability of existing kinetic models to accurately describe biomethane production rates from the ACD of the substrates have also been investigated. Finally, the potential of employing HTL technology for digestate sterilization and enhanced resource recovery has been assessed.
The novelty of the present study is emphasized by its exploration of the feasibility of an unconventional integrated process incorporating anaerobic co-digestion and HTL technologies as a pathway for enhanced value extraction from organic waste streams. The feasibility assessment has been undertaken via a consideration of the useful products yields of biomethane, biocrude and biochar and the energetics of the proposed integrated process.

2. Materials and Methods

2.1. Materials

The wet hydrolyzed DAF sludge (WHDS) was obtained via catalyzed in-situ hydrolysis, according to the methods described by Okoro et al. [3,21]. The SY waste sample was obtained from animal enclosures of a major large-scale meat processing plant in New Zealand. Anaerobically digested sludge from an up-flow anaerobic sludge blanket (UASB) reactor, operating under mesophilic temperature condition, was obtained from a municipal sewage treatment plant (Green Island, Dunedin, New Zealand) and utilized as the inoculum. The WHDS and acquired SY waste samples were sealed in airtight containers and preserved in a fridge at 4 °C. The air in the vessel containing the freshly collected inoculum sample was initially purged with nitrogen gas to displace any oxygen present; then, the inoculum sample was degassed for four days to deplete any residual biodegradable organic material present in the inoculum prior to initiating anaerobic digestion experiments.

2.2. Analytical Methods

The bio-degradabilities of different substrate mixtures were assessed in batch reactors due to its simplicity, popularity and short residence time of batch-wise reactors [22]. The substrates were introduced into the reactor at the beginning of the AD reaction cycle together with buffer solutions (described in the experimental design section below) to minimize disturbances associated with sudden pH changes, with the performance of the AD process assessed by measuring the biomethane potential. The total solid content, volatile content and ash content of the inoculum, WHDS and SY waste samples were measured according to the standard methods of the ASTM (American Society for Testing and Materials) E1756-08 [23], ASTM D3175-11 [24] and ASTM D 2017-98 [25], respectively. The fixed carbon content in mass fraction on a dry basis, of each sample, was determined by subtracting the sum of the mass fractions of the ash and volatile contents from unity. The elemental analysis (carbon, hydrogen, nitrogen and sulphur contents) of each sample was undertaken using a Carlo-Erba EA1108 elemental analyzer (FISONS, Milan, Italy). The elemental oxygen (O) content (fraction) was determined by subtracting the ash, carbon, hydrogen, nitrogen and sulphur contents (fractions) from the value of unity. The pH of each sample was measured using a Hanna precision pH meter, model 209 (Woonsocket, RI, USA). The specific gravity of each sample was also measured according to the ASTM D70-03 standard method [26]. The measured characteristics of WHDS, SY waste and inoculum utilized are presented in Table 1.

2.3. Experimental Design

The batch-wise anaerobic digestion of the substrate mixtures was undertaken in a 500 mL bioreactor (conical flask, Schott Duran, Germany) such that a working volume of 400 mL was maintained. Biomethane potential was measured using a eudiometer with each bioreactor subjected to a constant mesophilic temperature of 37.0 ± 0.1 °C using a general purpose stirred thermostatic water bath (GD100, Cambridgeshire, UK). Substrate mixtures characterized by mass ratios of the volatile solids of WHDS (VSWHDS) to the volatile solids of SY (VSSY) of 1:0, 4:1, 3:2, 2:3, 1:4 and 0:1 were degraded anaerobically to determine which VS mass ratio will best promote enhanced biomethane generation. The substrate–inoculum mixture was prepared such that a volatile solid mass ratio of inoculum to a substrate (ISR) of 2 was maintained. This ISR ratio will eliminate possible biomass limiting kinetics in the system via the prevention of excessive acidification of the substrate media [27,28]. The mass characteristics of the co-digestion mixtures are presented in Table 2.
The buffer system provided in each bioreactor was a solution composed of 350 mg/L of anhydrous di-potassium hydrogen orthophosphate (K2HPO4), 250 mg/L of potassium dihydrogen orthophosphate (KH2PO4) and 5000 mg/L of sodium hydrogen carbonate (NaHCO3) [29]. No external nutrient sources (trace metals) were introduced to the bioreactor mix, since nutrient requirements for microbes can be sufficiently provided internally in substrates mixtures composed of organic fractions of animal excreta, municipal or sewage solid wastes [30,31]. Prior to initializing the experiment, each bioreactor was purged with nitrogen gas to displace atmospheric oxygen so that anaerobic digestion was encouraged. An illustration of the experimental setup discussed is presented in Figure 2. During the AD process, the volume of biomethane produced was measured using a eudiometer unit as shown in Figure 2.
The AD biogas generated was purified for biomethane volume measurement by stripping it of (mainly CO2) impurities via bubbling of the biogas using a 3 N barrier solution of sodium hydroxide (NaOH) [32]. The volumetric displacement of the barrier solution of NaOH in a connecting reservoir was subsequently utilized in measuring the daily biomethane potential, for 20 days, according to ISO/DIS 14853 standard methods [33]. This approach constitutes the standard methodology utilized in bench-scale laboratory biomethane volumetric determinations [32,33,34]. Agitation of the bioreactors was undertaken twice daily to enable uniform availability of useful substrates to microbes and thus provide further growth impetus for aceticlastic methanogens present in the substrates.
The pressure of 760 mmHg was maintained by ensuring that the connecting reservoir tank was open to the atmosphere with daily measured biomethane gas volumes normalized to the standard temperature condition of 273.15 K using the ideal gas law. Pressure compensation (to ≈760 mmHg) was achieved by ensuring that barrier liquid level in the eudiometer was returned to the liquid level in the reservoir after daily biomethane potentials were recorded. Although negligible contributions to the biomethane potentials were anticipated from the degradation of residual biomass present with the inoculum (after the degassing operation), a control bioreactor containing only the inoculum was also subjected to a similar anaerobic degradation process. The reported biomethane potentials from the different bioreactors were subsequently corrected using the biomethane potentials obtained from the control bioreactor containing only the inoculum. Finally, to facilitate a low-cost and efficient estimation of the percentage biomethane content (volumetric basis) of the total volume of biogas generated from the co-digestion substrates, each bioreactor was equipped with a similar gas measurement setup as described above, with the only modification being the barrier solution utilized. The NaOH liquid barrier was replaced with an acidified (pH of 2)-saturated NaCl solution as the barrier solution to enable the determination of the total biogas volume as utilized in a previous study [35]. This is because the acidified-saturated NaCl solution will prevent the dissolution of the major components of the biogas of CO2 and CH4 such that the volume of biogas, in terms of its major components, can be measured [35,36]. Experiments for determining biomethane potential and biogas potential for each substrate mixture were undertaken simultaneously with biogas volumes recorded on days with associated biomethane yields. The percentage biomethane content (volumetric content basis) of biogas was subsequently calculated.
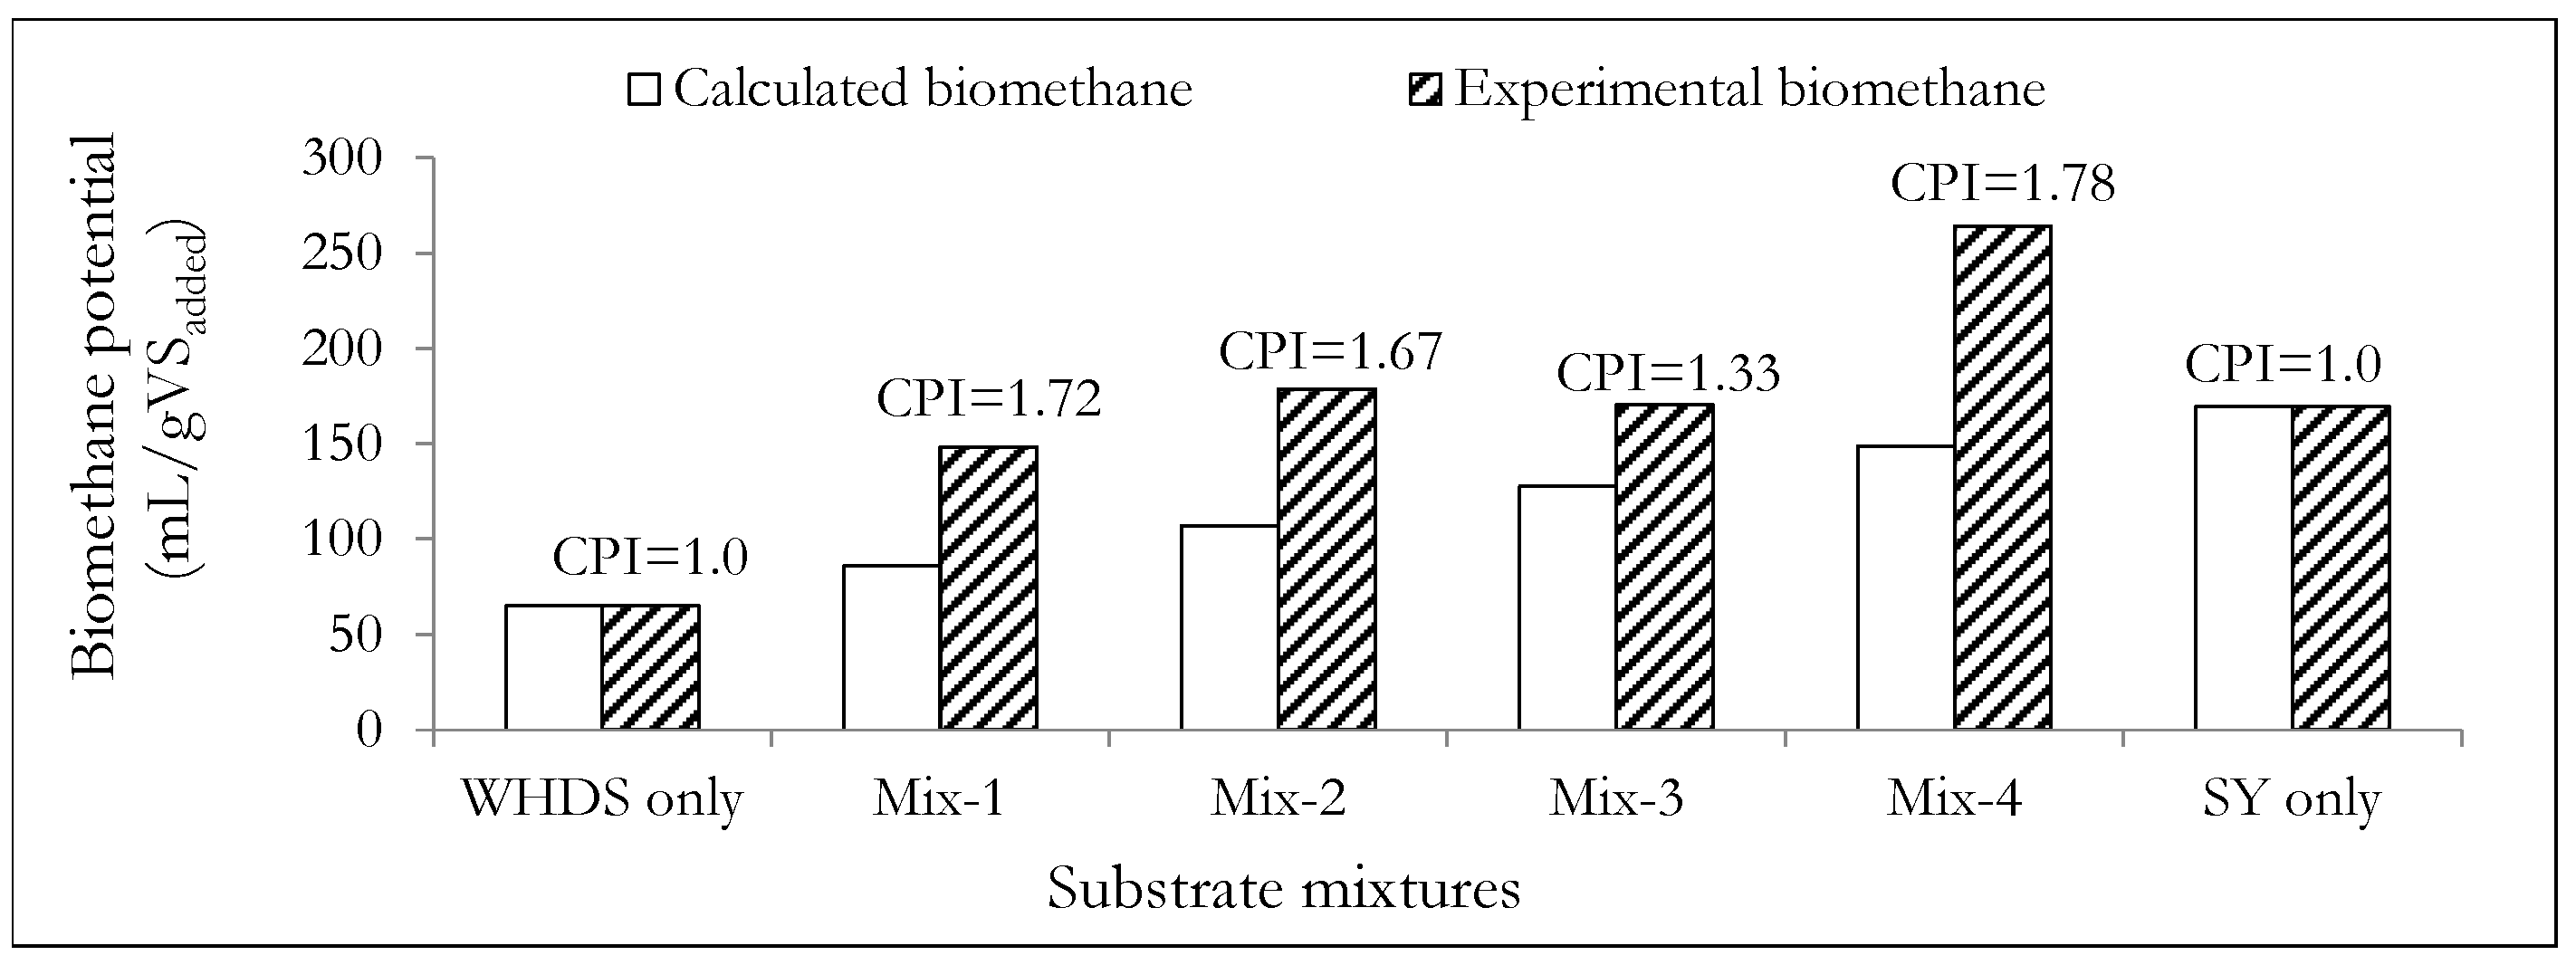
Possible synergizing and antagonistic effects that may arise from the application of the ACD pathway were investigated by assessing the characteristic co-digestion performance index (CPI) of each substrate mixture [37]. Generally, if the CPI is greater than 1, the presence of synergizing effects is demonstrated; if the CPI is less than 1, the presence of antagonizing effects is established. However, if a CPI value is equal to 1, it suggests that the ACD process occurs independently of synergizing and antagonistic effects [38]. The CPI for each substrate mixture can therefore be calculated as follows [38]:
CPI = B M P exp B M P c a l
where BMPexp represents the experimentally measured biomethane potential of each substrate mixture in mL/gVSadded; BMPcal represents the biomethane potential determined for each substrate mixture in mL/gVSadded as follows [38]:
B M P c a l = x W H D S ( B M P W H D S ) + x S Y ( B M P S Y )
where xWHDS represents the mass fraction of WHDS in the co-digestion substrate mixture on a VS mass basis, BMPWHDS represents the experimentally determined biomethane potential due to the degradation of only WHDS in mL/gVSadded, xSY represents the mass fraction of the SY biomass in the co-digestion substrate mixture on a VS basis and BMPSY represents the biomethane potential due to the degradation of only SY in mL/gVSadded.
Changes in the pH of the different substrate mixtures were also monitored via the assessment of the pH value of carefully recovered aliquots of the digestate. The recovery of the aliquots of the digestate was undertaken every two days, using a Pasteur pipette as an improvised probe sampler to minimize disruptions in the degradation process due to unwanted exposure of the anaerobic microbes to atmospheric oxygen. Changes in the pH of the different digestate samples were subsequently determined using a Hanna precision pH meter, model 209. For most of the bioreactors, daily biomethane generation ceased after 12 days, with cumulative biomethane production attaining asymptotic values for hydraulic retention times (HRTs) greater than 12 days. However, all bioreactors were evaluated for a HRT of 20 days, since 20 days represents the traditional digestion time that characterizes conventional anaerobic digestion plants in batch-wise operations under mesophilic temperature conditions [39,40]. All anaerobic digestion experiments for biomethane potential measurement were conducted in duplicate with the average values reported. The biomethane potential measured and the associated standard errors are available in Table S1, and are presented in Section S1 of the supplementary document.

2.4. Kinetic Assessments

The kinetics of biomethane production, as an invaluable tool to enhance the understanding of the AD process were investigated using three major models of modified gompertz model [41], cone model [42] and exponential (first order) model [9]. These models are able to elucidate the dynamics of biomethane production during AD processes [43]. The cone model and the exponential model adequately describe the kinetics of biomethane production based on the solubilisation (hydrolysis) rate constant. However, if biomethane production is characterized by a more traditional bacterial growth curve with a sigmoidal profile, the modified gompertz model is considered appropriate [9,41,42]. The selection of the correct kinetic model for reliable biomethane potential prediction is not a trivial enterprise, as the precision of the models differs with the operating conditions imposed during the AD process and the nature of substrate digested [43].
The modified gompertz model, cone model and exponential (first order) model are presented in Equation (3) [41], Equation (4) [42] and Equation (5) [9], respectively, as follows:
B t = B max × exp ( exp [ 2.7183 × R m B max ( λ t ) + 1 ] )
B t = B max 1 + ( k t ) n
B t = B max ( 1 e ( k ( t λ ) ) )
In Equations (3)–(5), Bt is the cumulative biomethane potential in mL/gVSadded at time t in days, Bmax is the maximum possible cumulative biomethane potential produced after an infinite number of days in mL/gVSadded, k is the biomethane production rate constant in d−1, Rm is the maximum biomethane production rate in mL/g-VSadded-d and λ and n represent the initial delay period in the degradation process in days and the shape factor, respectively, and are both dimensionless parameters.
The kinetic model parameters were determined using the nonlinear least squares regression tool in Matlab computing package (Version R2015a, the Math Works Inc., Natick, MA, USA). The suitability of the three alternative models listed above in predicting the biomethane potential was statistically assessed via a combined comparison of the root mean square errors (RMSE) and the coefficient of determination values (R2) of the different biomethane production kinetic models. Generally, the preferred model presents the lowest value of RMSE and highest value of R2. The relation for the root means square errors (RMSE) is expressed as follows:
RMSE = ( 1 n i = 1 n ( P i Y i ) 2 ) 1 / 2
where n is the number of data pairs, Pi is the biomethane potential predicted by the models in mL/gVSadded on the ith day and Yi is the measured biomethane potential in mL/gVSadded on the ith day.

2.5. Preliminary Assessment of the Alternative One-Step Digestate Processing Approach

To initially assess the viability of the one-step HTL digestate processing pathway proposed, the yields of the possible products were predicted and assessed. This is because the theoretical product yields from the HTL processing of the digestate can be estimated if the digestate’s carbohydrate, lipid, proteins and ash content are known [44,45]. The digestate residue investigated as a feedstock for the HTL was obtained from the ACD bioreactor that presented the highest biomethane potential. The yields of the products, namely biocrude, insoluble solid residue (also called biochar), soluble solids dissolved in the post-HTL water and the gas phase products, obtained after the HTL processing of the wet digestate, were estimated using predictive models [44,45,46]. According to the recent work of Sheng et al. [46], the optimal yield of the biocrude product (ybio) on a dry basis (wt.%, percentage of kg product/kg of dry digestate) can be estimated as follows:
y b i o = 0.9 X l + 0.385 X p + 0.025 X c + 0.052 [ X l X p | X l X p | ] + 0.093 [ X l X c | X l X c | ] + 0.003 [ X p X c | X p X c | ]
where Xl, Xp and Xc represent the lipid, protein and carbohydrate mass content, in wt.%, in feedstock, respectively.
The optimal yield on a dry basis (wt.%, percentage of kg product/kg of dry digestate) of other useful products, such as the yield of soluble solids(yss) and the yield of the gaseous products (yg), were estimated by applying the additive models proposed by Li et al. [45] as follows:
y s s = 0.24 X p + 0.86 X a
y g = 0.07 X p + 0.46 X c
In the two equations, Xp, Xc and Xa represents the protein, carbohydrate and ash content in wt.%, in the digestate on a dry basis, respectively. The theoretical yield of the biochar product (ychar) was estimated by mass balance as follows:
y c h a r = 100 % ( y g + y a q + y b i o )
The theoretical model equations of Equations (8)–(10) were determined for the HTL process occurring at a reaction temperature and reaction time of 300 °C and 30 min [45], respectively. In the present study the reactor pressure has been specified as 13.5 MPa, since HTL processes typically occur at pressures conditions ranging from 5–20 MPa.
To characterize the digestate residue, the ash content, specific gravity and elemental content were measured using the methods highlighted in Section 2.2 above. The residual lipid content, was determined gravimetrically [47] using a BST/SXM-1 after Soxhlet extraction unit (FOSS Ind., Denmark). The protein content was determined according to the AOCS (American Oil Chemists’ Society) official method Ba4e-93 [48]. The total carbohydrate content was determined by subtracting the fractional ash content, crude fat content and protein content from the value of unity [49]. To further test the viability of introducing a HTL processing step for enhanced resource recovery, the environmental performance of an integrated system of HTL and ACD technologies was initially assessed. In this study, the environmental performance of the integrated system was analyzed using the net energy ratio (NER), because NER is widely regarded as a surrogate measure of renewability, and thus, is considered a sufficient metric in most initial sustainability assessments [50]. Generally speaking, if the NER ratio is greater than one, the NER of the overall system presents a favorable energetic performance and is environmentally sustainable [50,51]. This is because a NER ratio that is greater than one constitutes the minimum requirement necessary to indicate if a given system results in reduced dependency on fossil energy [51]. It is also important to note that different energy carriers (i.e., electrical and thermal) will have different qualities (i.e., useful work obtainable reflective of the 2nd law of thermodynamics), and thus, must be converted to equivalent energetic forms prior to employing the proposed NER methodology. Therefore, the values of the heat (thermal) energy required for maintaining the ACD process and the HTL process at 37 °C and 300 °C, respectively, were converted to their chemical energy forms. The electrical energy required to pressurize the digestate to 13.5 MPa within the HTL reactor was also converted to its chemical energy equivalent [52]. Therefore, the environmental performance of the integrated HTL and ACD processes, in terms of the NER metric, was determined by calculating the NER of the process as follows:
NER = j N H H V j × P j ( E E η H E + i n E H f , i η C H )
where HHVj represents the higher heating value of the jth energy dense product of biogas (HHVm) and biocrude (HHVb), Pj represents the production capacity of the biogas and biocrude in kg/h, EH-f,i represents input heat energy in kJ/h for the ith unit operation, from fossil based sources, EE represents the electrical energy consumed by a high pressure pump, ηC-H represents the thermal efficiency of energy conversion from fuel to heat using boilers and ηH-E represent the thermal efficiency of energy conversion from fuel to electrical energy. N and n represent the number of energy dense product streams and the number of heat energy demanding unit operations, respectively. In this study, ηC-H and ηH-E were specified as 0.9 and 0.472 [52,53,54].
In this study it was recognized that the moisture content of the digestate will be largely influenced by the mass of the buffer solutions introduced to the ACD mixture, with a small (large) mass of the buffer solution leading to a small (large) overall moisture content of the digestate. Moreover, the dependence of the environmental performance (NER) of the integrated system on the moisture content of the digestate residue was assessed. In addition, it was assumed that the compositions of the ACD substrate mixture and the digestate were uniform, and the integrated system was operating at steady-state. Considering Equation (11), it was necessary to determine the HHVs of the energy dense biocrude and energy dense biogas products generated from the integrated system. Therefore, the HHV of the biocrude product (HHVb) in MJ/kg was estimated as follows [45]:
H H V b = 30.74 8.52 A O S c + 0.024 X p
where Xp is the mass percentage protein content of digestate on a dry basis and AOSc denotes the average oxidation state of feedstock-carbon which is calculated as follows [45]:
A O S c = 3 N m o l % + 2 O m o l % H m o l % C m o l %
where Cmol%, Hmol%, Nmol% and Omol% represent the percentage molar contents of corresponding elements in digestate. The HHV of the biogas product (HHVm) in MJ/kg was estimated based on the experimentally determined mass fractions of the biomethane and carbon dioxide components, and methane HHV of 55 MJ/kg [55]. Due to the large range of the temperature change (from 298.15 K to 573.15 K) imposed during the HTL process, a change in the specific heat capacity of the digestate was anticipated during the HTL process. Therefore, the heat energy required for the HTL process (EH-HTL) in kJ, at 300 °C (573.15 K) was calculated as follows [56,57]:
E H H T L = m d [ w 298.15 T c w d T + ( 1 w ) 298.15 T c d d T ]
where the specific heat capacity of the water present in the digestate, cw, in kJ/kg·C is given by [58]:
c w = 5 × 10 7 T 3 0.00061 T 2 + 2388 T 27.071
and the specific heat capacity of dry digestate, cd, in kJ/kg·K is estimated as follows [59]:
c d = 0.0000038 T 2 + 0.00598 T 0.79528
In Equation (14), the mass of the digestate, md in kg is determined from mass balance as follows:
m d = ( m r m b i o g a s )
where
m b i o g a s = m S B m ρ b x m
The additional heat energy required to maintain the ACD bioreactor at 37 °C is as follows [60]:
E A C D = m S × c p s × T × 1.3
In Equations (14)–(19), w represents the fractional moisture content of the digestate feedstock, T represents the HTL reaction temperature, in K, Bm is the measured experimental biomethane potential in m3 per kg, ρb is the density of biogas in kg/m3, mbiogas denotes the mass of biogas in kg, xm is the volumetric fraction of biomethane in the biogas determined experimentally, ms is the mass of the substrate mixture in kg, cps is the specific heat capacity of the substrate mixture in kJ/kg·K, ∆T denotes the temperature difference between the temperature of the feed substrate (ambient temperature, 298.15 K) and the target substrate temperature (mesophilic temperature, 310.15 K) and the constant number 1.3 is the factor used to account for the heat losses from the digester. According to previous studies, the specific heat capacity of the digestate mixture can be assumed to be constant and is approximately equal to the specific heat capacity of water of 4.184 KJ/kg·K [61,62,63].
The electrical energy (EE) required by the high pressure pump necessary to pressurize the digestate from the atmospheric pressure of 0.1 MPa to a high pressure of 13.5 MPa in the HTL reactor is calculated as follows [64]:
E E = m d P ρ d η
where ∆P represents the pressure increase achieved using the high pressure pump in kPa, η represents the pump efficiency and was assumed to be 0.3, since previous studies showed that the average pumping efficiency in large process plants can be less than 0.4 [65,66] and ρb is the average density of digestate in kg/m3.

3. Results and Discussions

3.1. Anaerobic Digestion Experiments

The values of the ratio of VSWHDS to VSSY of the different substrate mixtures are listed in Table 3, where the cumulative biomethane potentials obtained after 20 days are also listed. The daily biomethane potential in mL/gVSadded and cumulative biomethane potential in mL/gVSadded from the anaerobic degradation of the different substrate mixtures of Mix-1 to Mix-4, for WHDSonly and SYonly, are shown in Figure 3 and Figure 4, respectively.
The daily biomethane potential curves presented in Figure 3 show that initially, a rapid anaerobic degradation occurred for most of the substrate mixtures, with a high daily biomethane production occurring within one day of the experiments. This observation may be explained by acknowledging that the microbial population (the inoculum) was harvested from an environment similar to the environment in which the AD process was undertaken in this study. This led to shorter adaptation times. Some of these environmental similarities are in terms of the substrate concentrations, temperature and pH conditions. Furthermore, the displacement of oxygen gas in the bioreactor headspace using nitrogen gas, minimized unwanted oxygen-related inhibitions, thus further reducing the microbial adaptation time.
The values of the biomethane potential of the different co-digestion substrate mix ratios (BMP) are listed in Table 3. The cumulative biomethane potential curves are subsequently presented in Figure 4. Table 3 and Figure 4 show that the substrates designated as Mix-4 and WHDS only were characterized with the highest biomethane potential of 264.13 mL/gVSadded and the lowest biomethane potential of 65.43 mL/gVSadded, respectively. The poor cumulative biomethane potential generated from the degradation of the WHDS only substrate may be a reflection of the presence of some residual reagents, such as non-polar hexane used in fatty acid recovery from the WHDS [3] that may be toxic to the microbial population present. The results also suggest that the VSWHDS to VSSY mass mixing ratio of 1:4 (wet mass mix ratio of SY to WHDS of 1.029:1), with a moisture content of the substrate mixture being 7.26 times the mass of dry solids, provided the best balance of nutrients for enhanced biodiversity and microbial activity for the anaerobic degradation process.
The results presented in Table 3 and Figure 4 show that the introduction of the SY waste as a co-digestion substrate may serve to improve the biomethane content of the biogas generated from the degradation of the WHDS only substrate by diluting any residual toxic chemical present. Slight variations in the biomethane content were measured for all other substrate mixes investigated, with the biomethane content of the biogas generated kept approximately close to 61 vol.% and carbon dioxide as a residual biogas component. Crucially the mean density of the biogas product of the different ACD system of the present study is estimated to be ≈1.2 kg/m3 under standard conditions and is comparable to the biogas density reported in the literature [67].
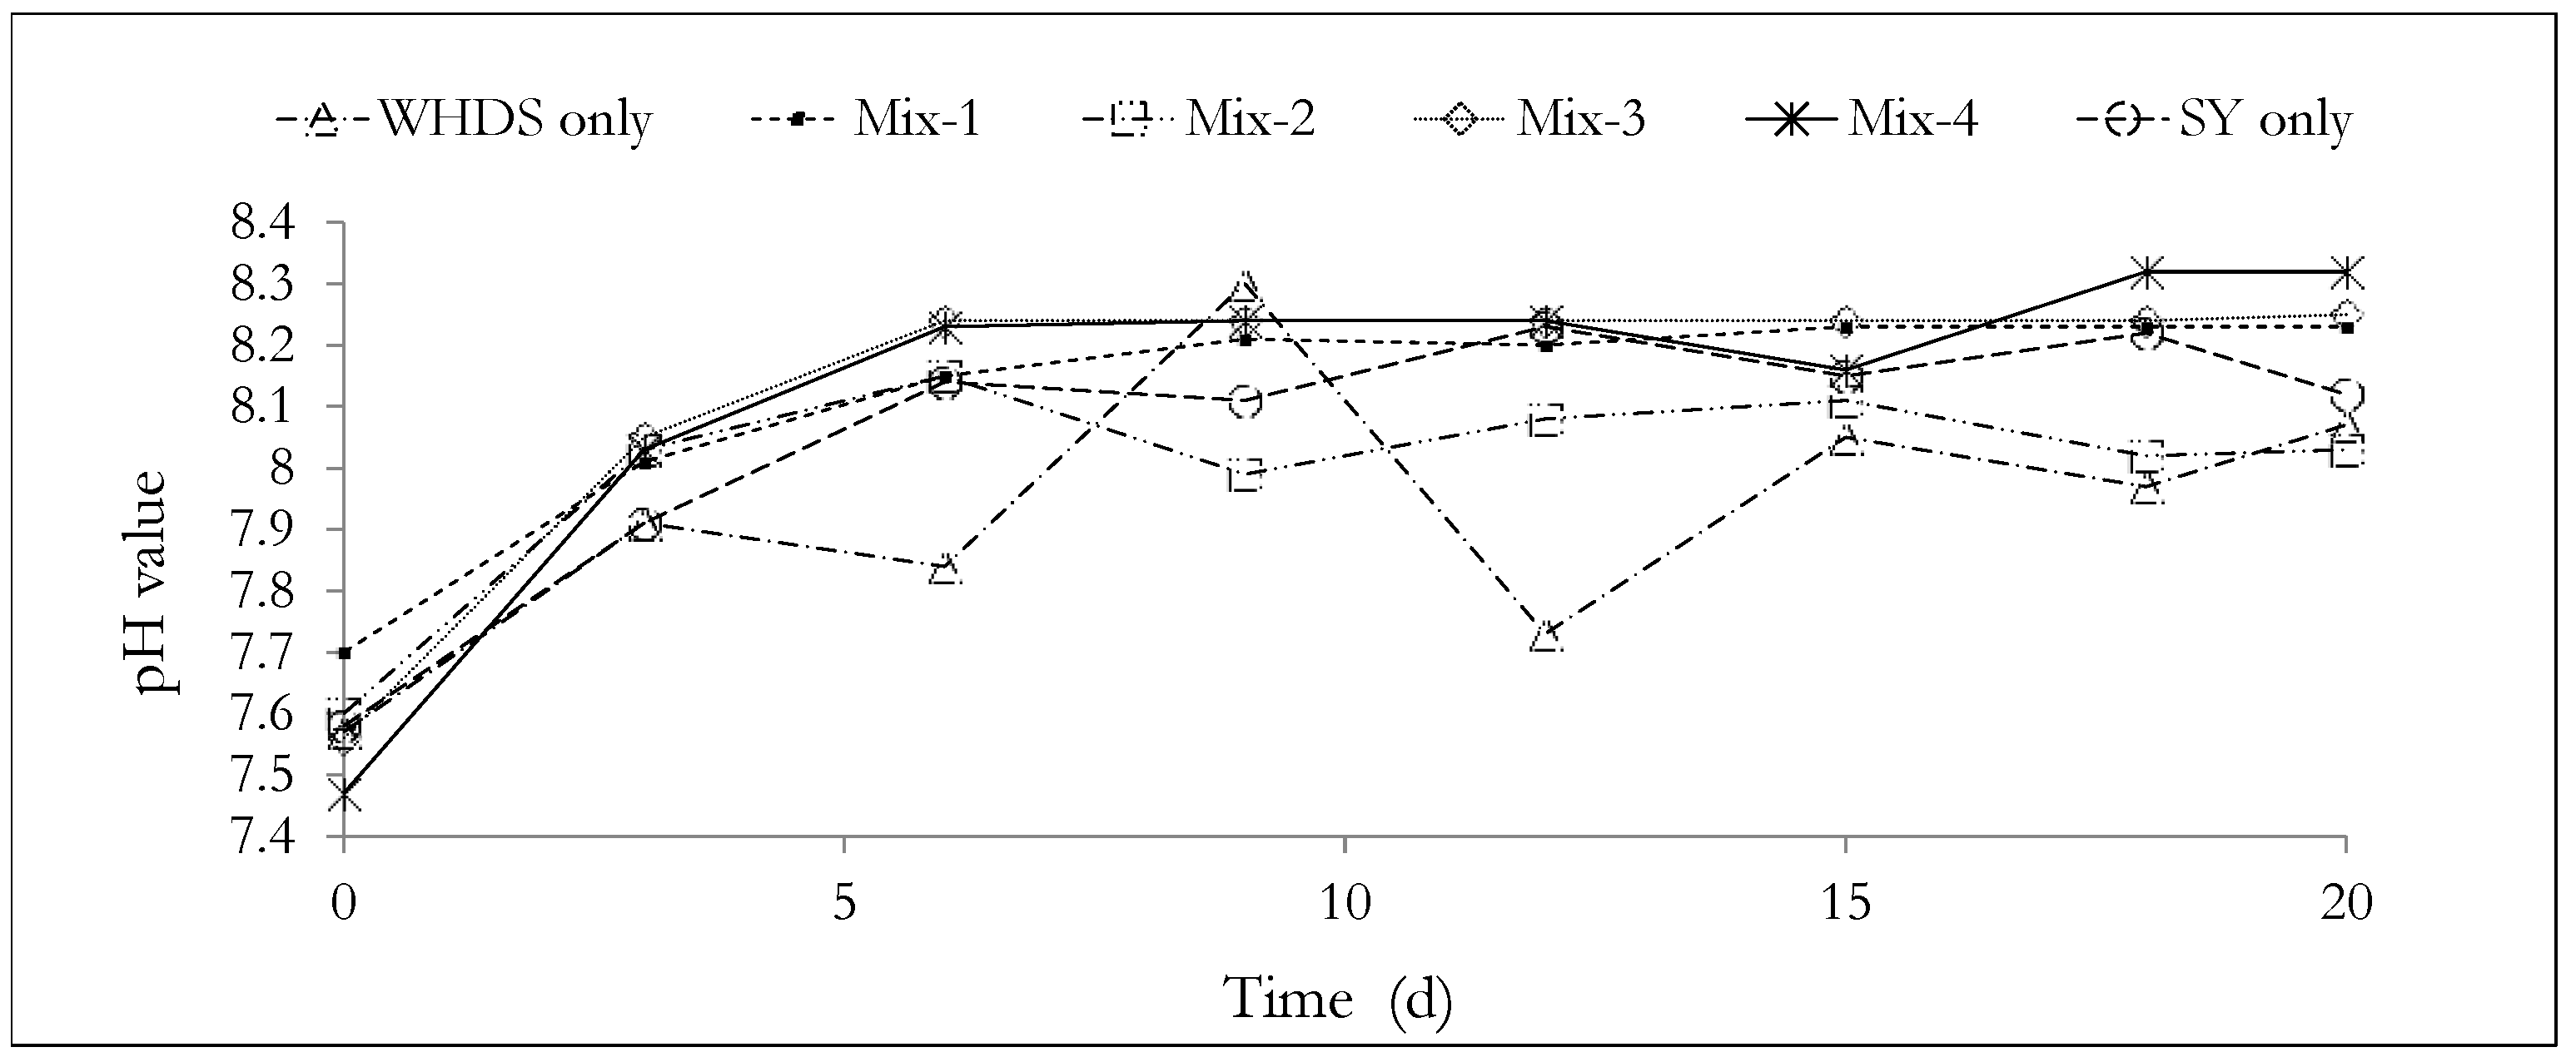
The pH value profiles for the AD processes are presented in Figure 5. The pH values measured and the associated standard errors are available in Table S2 and presented in Section S1 of the supplementary document. Figure 5 shows that the substrate pH was relatively stable, since the overall difference in pH (from the start of the experiment to the end of the experiment) was less than 1 in all bioreactors. This observation suggests the presence of a high buffering capacity in all bioreactors. This may be explained by acknowledging the combined effects of the introduced buffer solutions at the start of the ACD process and the additional buffer capacity that characterizes most co-digestion systems, which was observed by Lima et al. [68]. The possible generation of carbonates, such as NaHCO3, in the substrate mixture during the anaerobic digestion process, may also have contributed to enhancing the buffer capacity of the ACD process [69].
It is observed that the sharpest pH drop of 8.3 to 7.73 occurs during the degradation of the substrate of WHDS only. This may be due to a higher concentration of the intermediate acids produced from the acidogenesis phase in the degradation of the WHDS only substrate. The reduction in pH (8.3 to 7.73) may be due to the inhibitory effect of a high C/N (17.25) ratio on the methanogenesis phase of the AD process, and thus, may further explain the low biomethane potential (65.43 mL/VSadded) observed from the degradation of the WHDS only substrate.
Figure 6 shows that the ACD of WHDS and SY waste substrates will always lead to the introduction of synergizing effects in all the mix ratios considered. This is because the CPIs (Equation (1)), of all ACD substrate mixtures considered were greater than 1, with the best mix ratio (VSWHDS to VSSY of 4:1) presenting a CPI of 1.78.
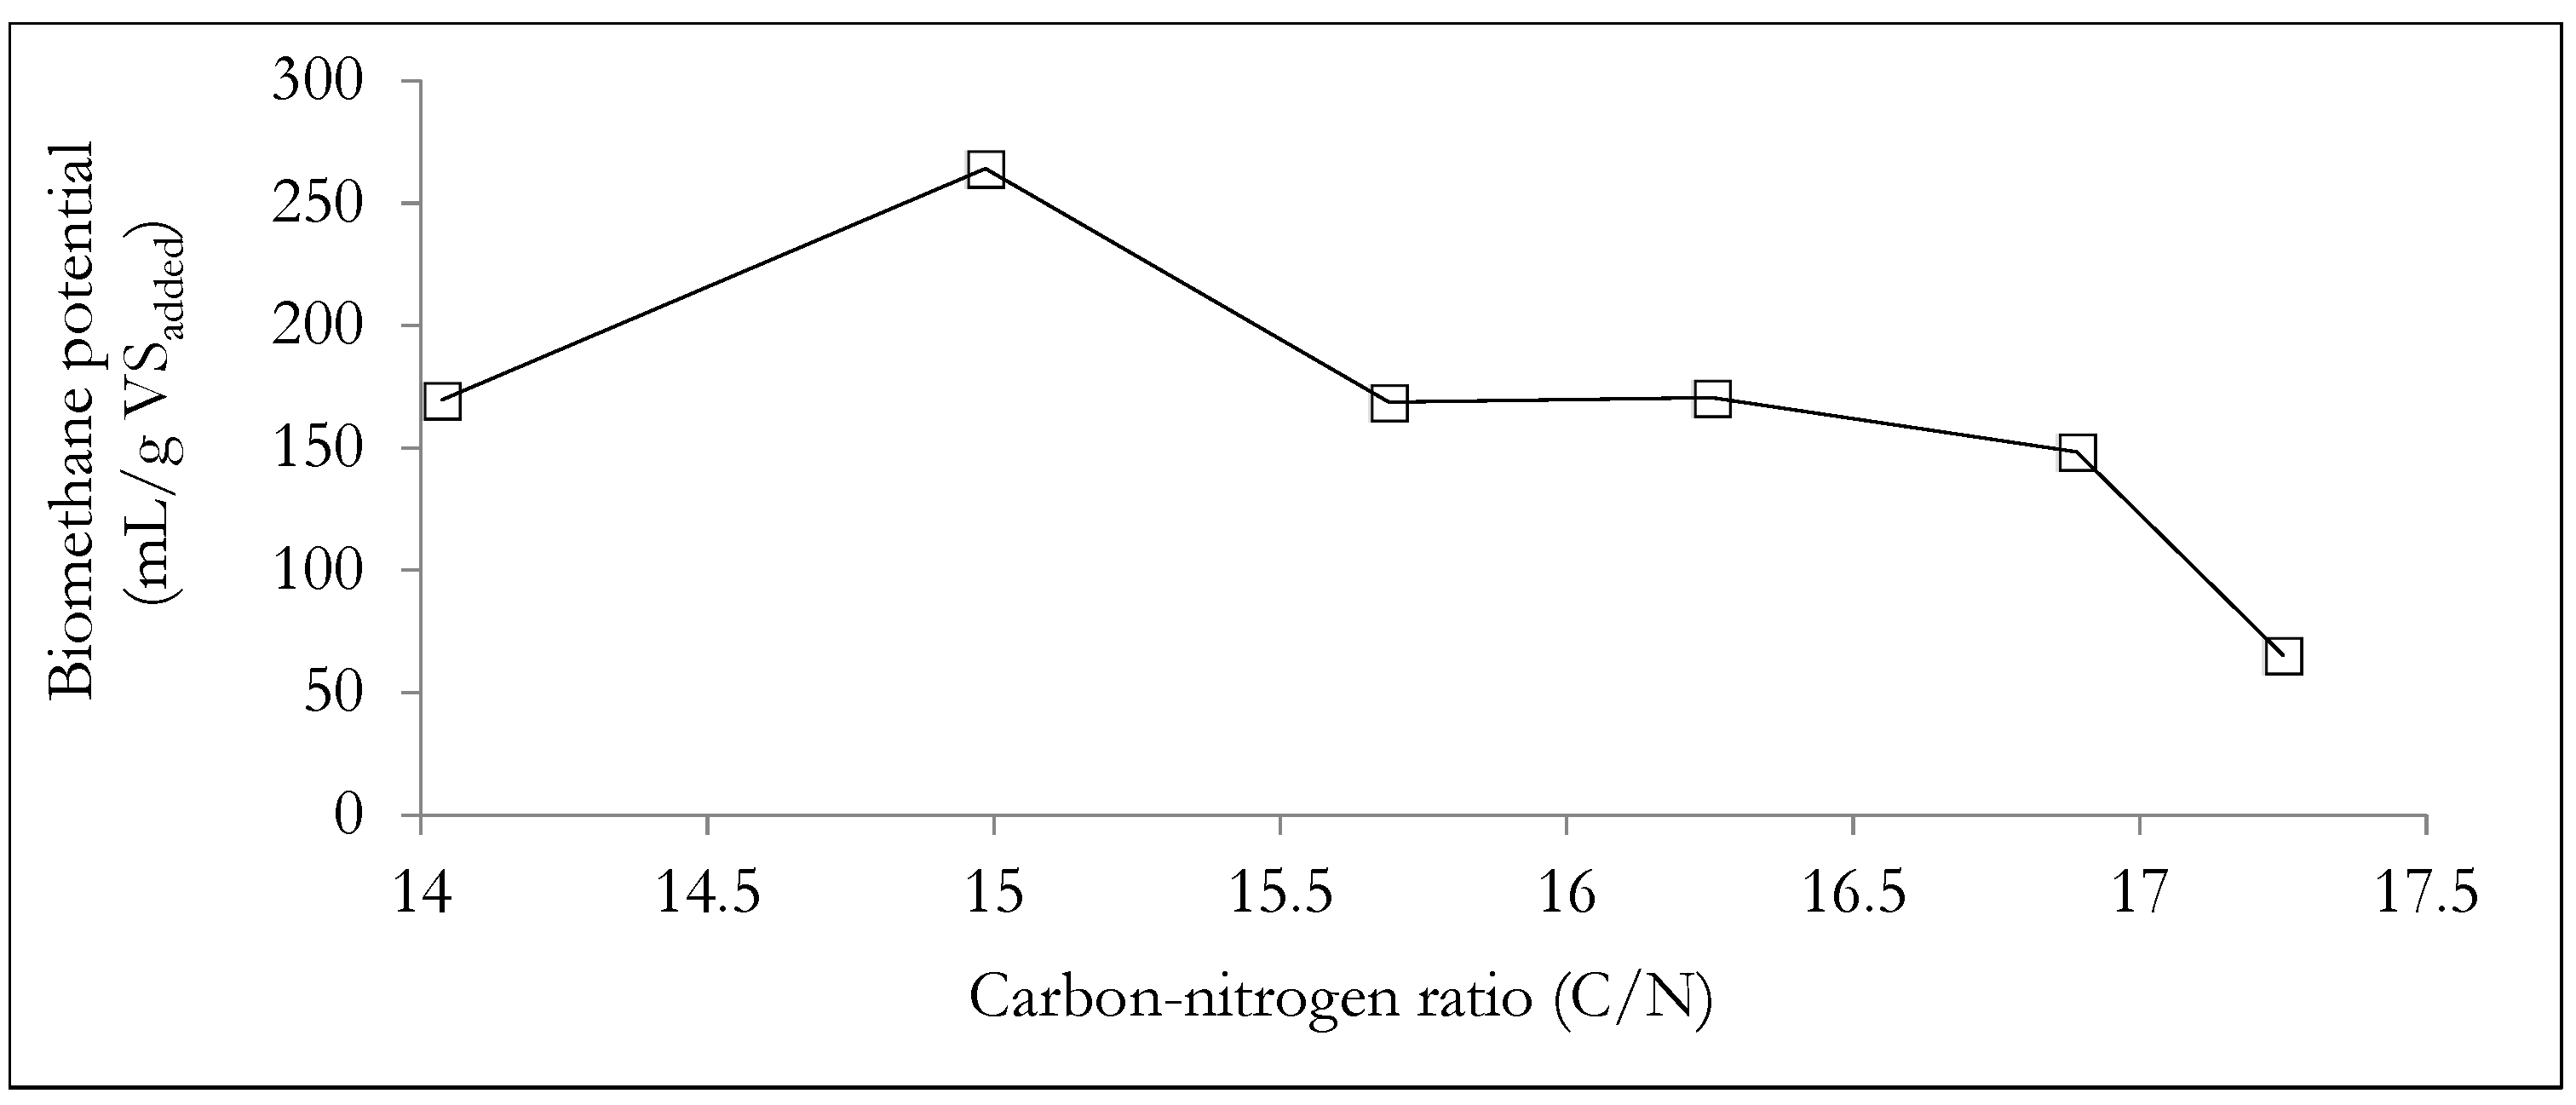
Figure 7 shows the influence of the carbon to nitrogen (C/N) ratio on the cumulative biomethane potential. The experimental results suggest that for WHDS and SY waste substrate mixtures, a C/N ratio of 14.99 was the most appropriate for enhanced biomethane generation. Therefore, the results suggest that for C/N ratios << 15, there will be an insufficient supply of carbon for digestion by the microbes, leading to suppressed growth of the methanogens [70]. Additionally, lower C/N ratios will result in excessive nitrogen content, thus increasing the risk of ammonia (NH3) generation, a situation that is considered inhibitory to the AD process [1,70]. On the other hand, excessively high C/N ratios (>> than 15) in WHDS and SY co-digestion substrate mixtures will result in an increased risk of substrate acidification, a situation that is also inhibitive to the methanogenesis phase of the AD process [71].
The parameters for the biomethane potential kinetic models, Equations (3)–(5), were fitted and presented in Table 4, together with the associated values of the root mean square error (RMSE) and the coefficient of determination (R2) values.
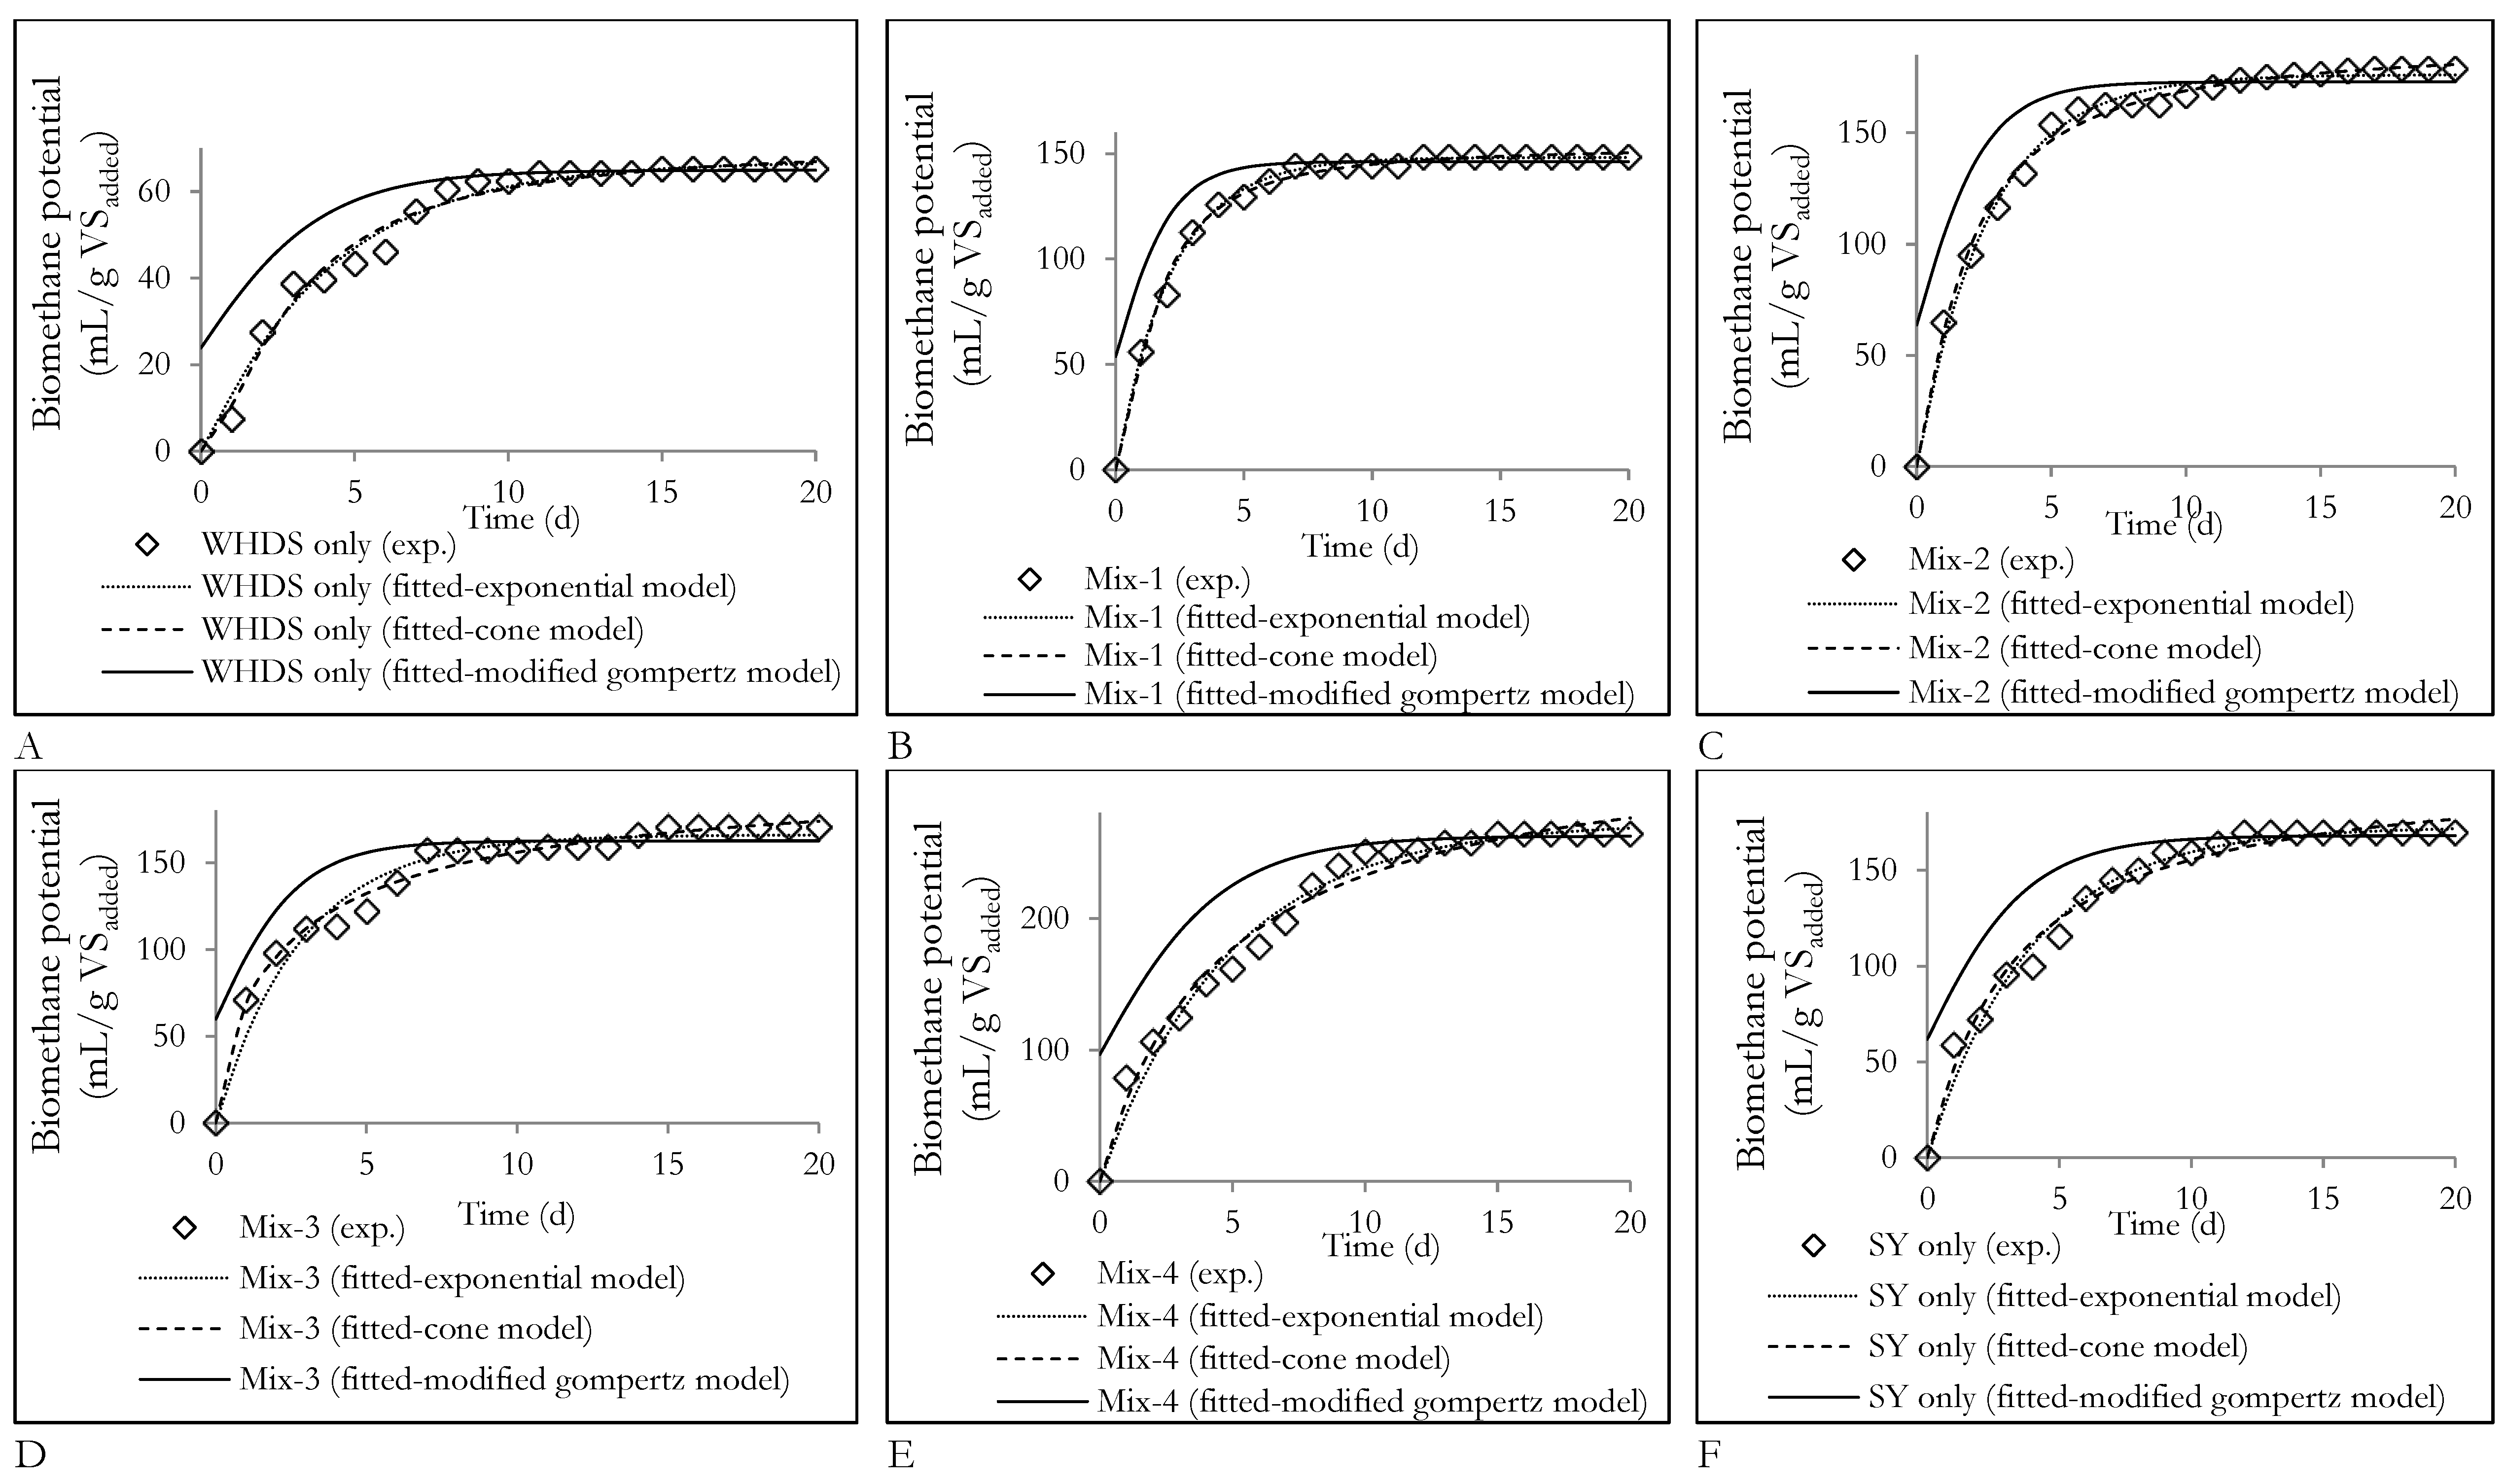
In Table 4, the values of the parameters have been determined for a 95% statistical confidence level. From Table 4, it can be seen that the exponential model best describes the kinetics of cumulative biomethane production during the degradation of WHDS only, Mix-1, Mix-4 and SY only substrates. This is because the exponential model presents the lowest RMSE of 2.747, 2.017, 10.03 and 5.967 for predicting the cumulative biomethane yield from the degradation of substrates of WHDS only, Mix-1, Mix-4 and SY only, respectively. The cone model is seen to be sufficient in describing the cumulative biomethane potential from the degradation of Mix-2 and Mix-3 substrates. This is because the cone model presents the lowest RMSE of 3.568 and 5.417 for predicting cumulative biomethane yield from the degradation of Mix-2 and Mix-3, respectively. The sufficiency of the exponential model and the cone model in WHDS only, Mix-1, Mix-2, Mix-3, Mix-4 and SY only is indicative of the dominance of the rate biomass hydrolysis or solubilization in dictating the kinetics of biomethane generation.
The graphical illustration of the model fitted for the different biomethane yields is shown in Figure 8. The modified gompertz model was the least reliable biomethane kinetic model for all substrate mixtures considered, since the predicted cumulative biomethane production did not follow a sigmoid growth curve pattern as shown in Figure 8, with rapid biomethane generation recorded in the first day of degradation. The observed trend was largely due to the absence of a sufficiently long ‘lag’ phase, which characterizes typical sigmoid patterns, during the degradation of substrate mixtures. Additionally, the results suggest that the synergizing effects observed in Mix-3 and Mix-1 as illustrated by the high CPI value (>1) may have led to an enhanced substrate solubilization rate, thus promoting rapid bioavailability of degradable organic matter. This is because the increase in the CPI determined for Mix-3 (CPI = 1.33) and Mix-1 (CPI = 1.72) mirrored the increase in the substrate solubilization rate constants (constants k in Equations (3) and (4)) calculated to be 0.417 d−1 and 0.448 d−1 for Mix-3 and Mix-1 substrate mixtures, respectively. Moreover, further investigation of the substrate solubilization rates (constants k in Equations (3) and (4)) showed that for Mix-4, the low solubilization rate highlighted by the lower value of constant k of 0.207 d−1 did not necessarily result in poor biomethane yields as illustrated by its highest cumulative biomethane yield (264.13 mL/gVSadded). Additionally, the substrate Mix-4 presented the highest synergizing effect as illustrated by the highest CPI value of 1.78. This observation is consistent with previous studies that showed that the biomethane yield was not solely dependent on the solubilization rate, since high (low) solubilization rates did not always lead to high (low) biomethane yields [43]. While the solubilization (hydrolysis) rate enhanced the AD process and was therefore important, it did not constitute the only factor governing biomethane productivity. In addition to the solubilization rate, the importance of other factors, such as pH, microbial nutrient availability and the microbial population present, were also reinforced when the biomethane kinetic parameters describing biomethane yield from Mix-2 was assessed. It was observed that, although the ACD Mix-2 substrate exhibited the highest rate of substrate solubilization of 0.532 d−1 (constants k in Equations (3) and (4)), this high solubilization rate did not translate to the highest CPI (1.67) or the highest biomethane yield (179 mL/gVSadded).

3.2. Productivity and Energetic Assessment of the Integrated System of HTL and ACD Subsystems

The digestate residue was characterized and the measured values are presented in Table 5. Table 5 shows that the measured average percentage contents of elemental carbon (C), hydrogen (H), nitrogen (N), oxygen (O) and ash content on a dry basis (percentage of kg-element/kg of dry digestate) present in the digestate from the ACD process were 28.64 wt.%, 4.45 wt.%, 2.8 wt.%, 24.6 wt.% and 39.53 wt.%, respectively, with sulphur (S) content being negligible. Additionally, Table 5 shows that the average percentage contents of carbohydrate, crude protein and lipid present in the digestate, on a dry basis (percentage of kg-carbohydrate or protein or lipid/kg of dry digestate) were 41.4 wt.%, 17.5 wt.% and 1.6 wt.%, respectively. The mean specific gravity and mean pH value of the digestate were also determined to be 1.02 and 8.23, respectively.
An assessment of elemental carbon mass flow in the substrate mixture of Mix-4, into the ACD process, compared to the sum of the mass of the elemental carbon in the biogas stream and the mass of the elemental carbon in dried digestate has been undertaken. The mass of elemental carbon fed to the anaerobic system in Mix 4 is shown to be comparable to the total mass of elemental carbon of the product streams of biogas and digestate with a relative error of 0.08. The methods employed in the mass balance calculation are presented in detail in Section S2 of the supplementary document. This establishes the accuracy of the methods employed above. Possible reasons for the difference between the mass of elemental carbon fed to the anaerobic system and that in the combined biogas stream and dried digestate stream are also discussed in Section S2 of the supplementary document.
The high percentage of carbohydrate content, 41.4 wt.%, of the digestate is not unexpected, as carbohydrate typically constitutes the major organic component present in the biogas digestate. Previous work showed that the carbohydrate content of AD digestate residue was as high as 54 wt.% [72]. The measured carbohydrate content suggests the presence of hemi-cellulosic and cellulosic carbohydrate forms in the AD digestate residue, since these carbohydrate forms are characterized by their poor solubilization rates and their degradation difficulties [73]. The average crude protein content of 17.5 wt.% and the average lipid content of 1.6 wt.% were comparable to the average crude protein content and average lipid content of anaerobic digestate from a waste water treatment plant, as reported in a previous study, as approximately 15 wt.% and 1 wt.%, respectively [72]. The high average ash content (39.53%) of the digestate may be explained to be due to the high ash content of the original substrates anaerobically digested. Differences in the organic composition of the digestate obtained in this study and other digestates reported in the literature may be due to disparate compositions of the original AD substrates.
Employing Equations (7)–(10) above, the yields of the biocrude, gas product, biochar and soluble solids present in the post-hydrothermal liquefaction (post-HTL) water were estimated from the measured physicochemical properties of the digestate. The estimated yields of the HTL product fractions are presented in Figure 9.
Figure 9 shows that a low biocrude yield of 9.55 wt.% (percentage of kg-biocrude/kg-dry digestate) was estimated from the HTL of the digestate. This biocrude is an energy dense product that can serve as a liquid fuel and also as a valuable source of platform biochemicals [74]. The low biocrude yield was not unexpected, since the lipid content of the HTL feedstock is a crucial factor influencing HTL biocrude yield [75]. The mean lipid content of the HTL feedstock in this study was only 1.6 wt.%. The HTL insoluble biochar yield was estimated to be 32 wt.% (percentage of kg-biochar/kg-dry digestate), which is within the range of 1.3–35.0 wt.% (percentage of kg-biochar/kg-dry digestate) measured for HTL processing of different biomass feedstocks [45]. The soluble solids present in the post-HTL water constitutes another HTL product stream and was estimated to be relatively high at 38.19 wt.% (percentage of kg-soluble solids/kg-dry digestate) compared to typical values ranging from 4.6–31.2 wt.% (percentage of kg-soluble solids/kg-dry digestate) of soluble solid yields obtained from biomass reported in the literature [45]. Due to the typically low concentrations of the soluble solids in the post-HTL water, it may not be a viable approach to undertake further energy intensive product recovery steps [76]. The gas yield of 20.27 wt.% (percentage of kg-gas/kg-dry digestate) was also estimated. This gas product is typically composed of CO2 gas [77,78]. The low concentrations of soluble solids in the post-HTL water and the typically high concentration of CO2 in the gas product imply that the post-HTL water and the gas product may not present immediate secondary application opportunities. However, based on the combined yields of biochar and biocrude of over 40 wt.% (percentage of kg-useful product/kg-dry digestate), further experimental investigation of the HTL processing of digestate may be justified as a basis of future work. This is because biochar and biocrude may constitute valuable products that may provide additional energetic and economic benefits to the ACD system. This implies that in addition to the utilization of the biocrude product as a liquid fuel or source of biochemicals, the HTL biochar product may be utilized in soil remediation, carbon sequestration and as a cheap adsorbent for the removal of impurities such as phenol, heavy metals and dye from waste water [79].
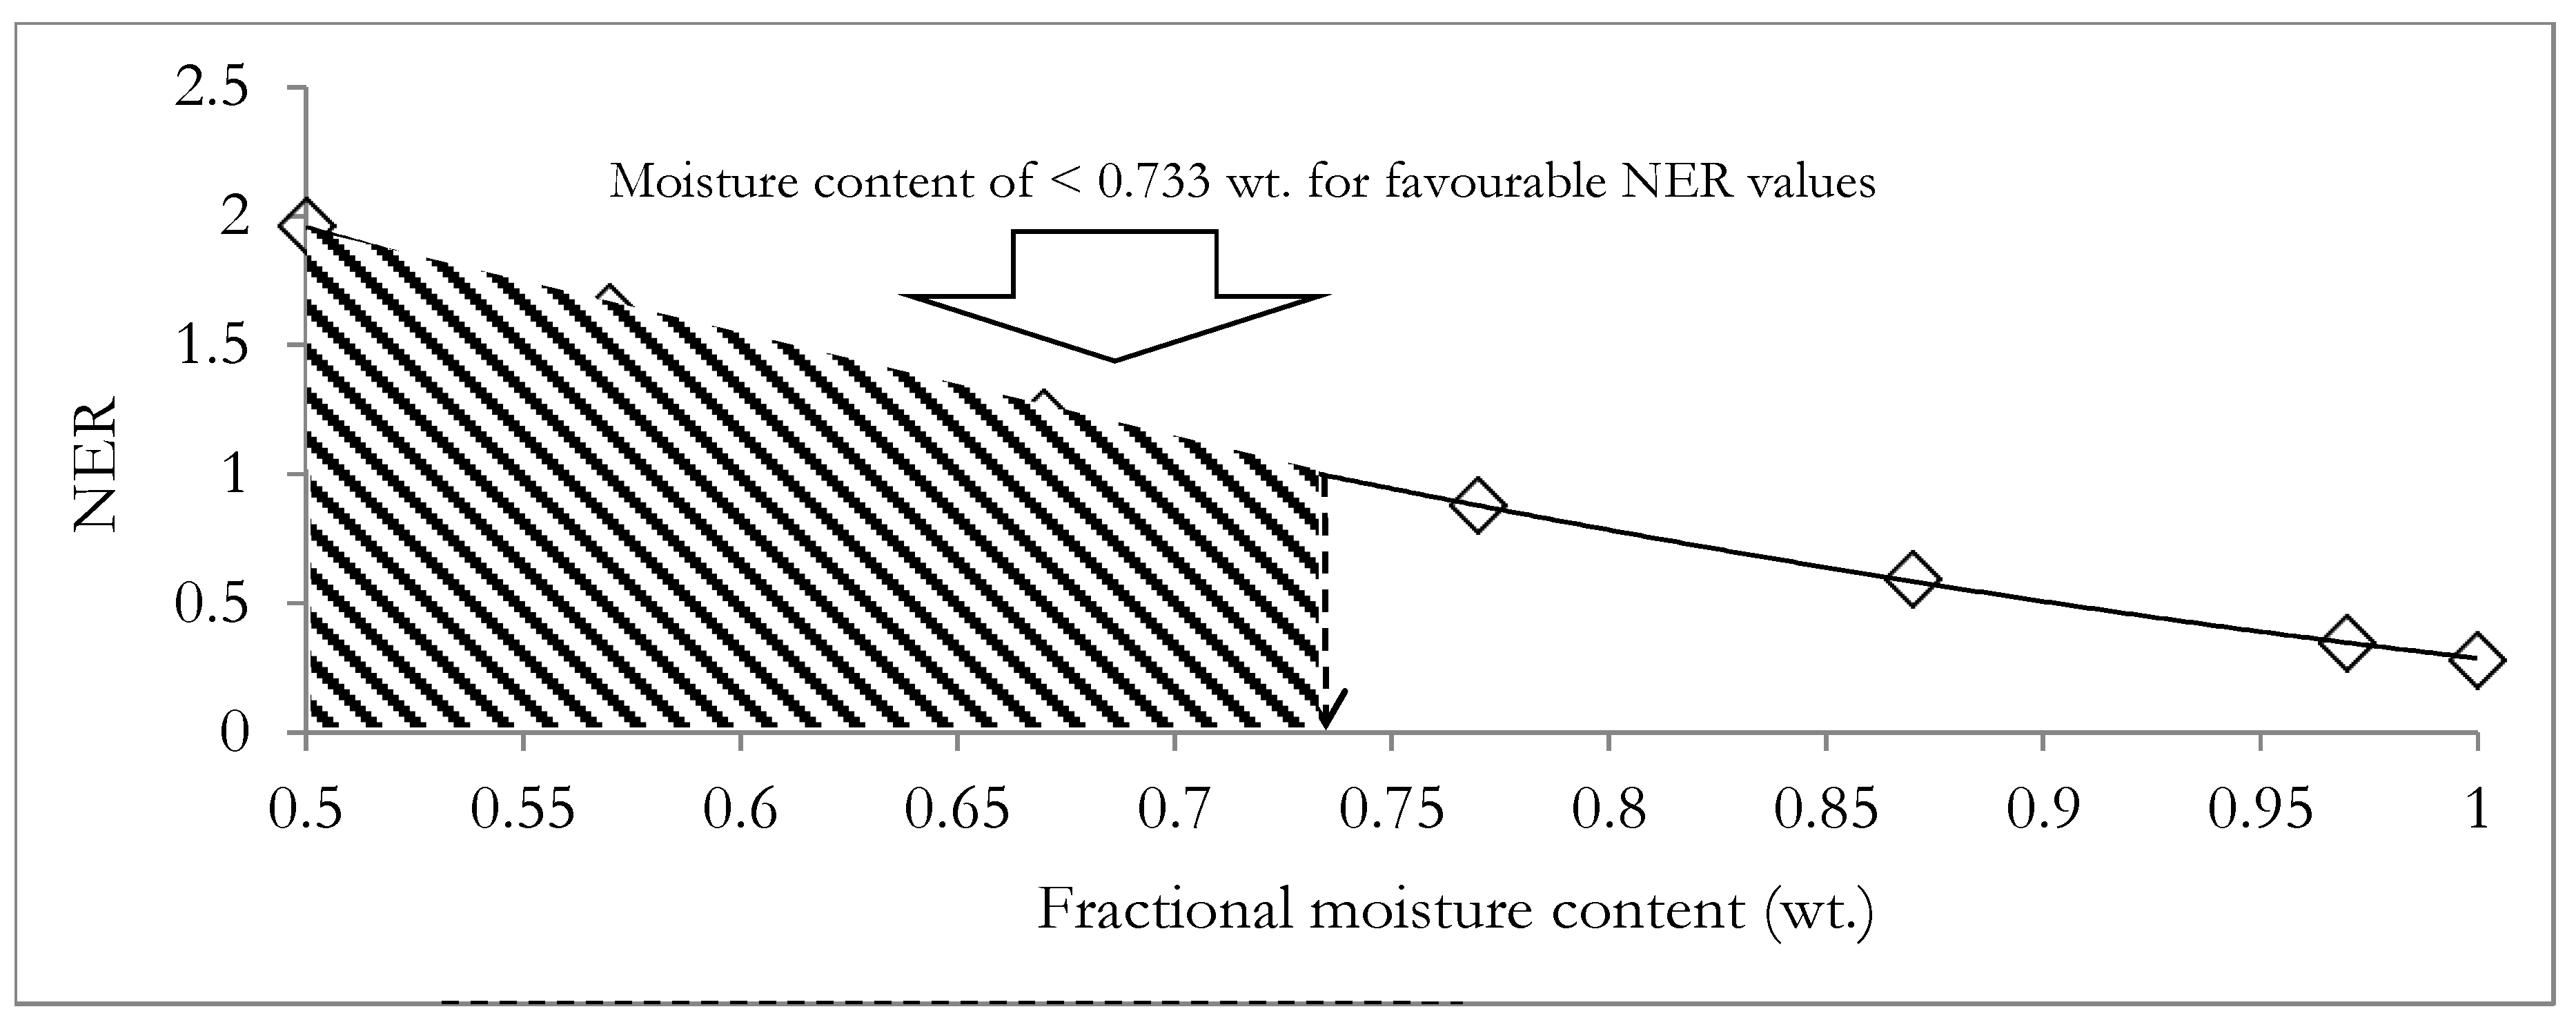
Applying Equations (12) and (13), the AOSc was determined to be −0.3255 and the HHV of the energy dense biocrude product was subsequently estimated to be 34 MJ/kg. The calculated HHV of the biocrude product is within the range expected for the typical biocrude product from the HTL processing of biomass, which was reported to be in the range from 30 MJ/kg to 38 MJ/kg [80]. Applying Equations (14)–(20) for different digestate moisture contents (fractional) ranging from 0.999 wt. to 0.5 wt., the NER was determined and is presented in Figure 10.
Figure 10 shows that the NER negatively correlates with increments in the moisture content of the digestate, with the fractional moisture content of the digestate necessary for environmental sustainability being less than 0.733 wt. The result suggests that it may be necessary to incorporate a compromise between the need to employ a large mass of the buffer solution and the need to achieve a favorable environmental performance with NER > 1. Additionally, Equation (10) suggests that an improved waste heat recovery from the integrated system of HTL and the ACD system will also serve to improve overall environmental performance.

4. Conclusions

In the present study, the anaerobic co-digestion (ACD) of wet hydrolyzed DAF sludge (WHDS) and stock yard (SY) waste was investigated. It was demonstrated that the anaerobic co-digestion of WHDS and SY waste always resulted in enhanced biomethane potentials compared to biomethane potentials obtainable from the anaerobic digestion of the individual WHDS and SY substrates. This overall improved biomethane yield associated with the co-digestion systems was attributed to the presence of substrate synergizing effects. It was also shown that the WHDS to SY waste mix ratios of 1:4 on a volatile solids mass basis enhanced biomethane production with a CPI of 1.78. An increase in the solubilization rate of the macromolecules present in the substrate was insufficient to explain the synergistic effects, since the high solubilization rate constant did not necessarily translate to an equally high biomethane yield. Other factors, such as the nutrients balance for enhanced biodiversity and microbial activity and enhanced dilution of inhibitory compounds, e.g., the residual toxic hexane in the substrates, were therefore suggested as worthy factors that positively influenced biomethane yields. Finally, the possibility resource recovery from digestate was also proposed via the coupling of the one-step HTL process with the ACD system. This study demonstrated that, based on the chemical composition of the digestate, satisfactory HTL useful product yields were feasible. The preliminary energetic assessments highlighted the dependence of environmental performance of the integrated process of HTL and ACD technologies on the moisture content of the digestate. It is therefore inferred that there might be a trade-off between the mass of high moisture buffer solution introduced for pH maintenance and the need for a favorable environmental performance. Improved heat recovery was also identified as an approach that would encourage favorable energetic performance of the proposed integrated system with opportunities of recovery of useful products of biochar and biocrude clearly elucidated.

Supplementary Materials

The following are available online at https://www.mdpi.com/2076-3417/8/11/2290/s1, Section S1, Table S1: Gas volumes obtained during the anaerobic co-digestion of the substrate mixtures, Section S1, Table S2: Variation in the pH of each substrate mixtures during the anaerobic co-digestion process, Section S2.1: Calculations for carbon balance, Section S2.2: Explanation for the estimated losses in the mass of carbon in product streams.

Author Contributions

Z.S. and J.B. conceptualized the study; O.O. designed the approaches used in this study, conducted experiments and drafted the manuscript, together with Z.S. and J.B.

Funding

This research received no external funding.

Acknowledgments

Oseweuba gratefully acknowledges the financial support of the University of Otago via the Otago Doctoral scholarship. He is grateful to Andrew Sim of the Green Island waste treatment plant, Otago for his help in providing access to a steady supply of inoculum. He also acknowledges the input of Ashley Duncan of the Department of Human Nutrition, University of Otago for providing excellent suggestions during preliminary experimental runs.

Conflicts of Interest

The authors declare no conflict of interest.

References

  1. Okoro, O.V.; Sun, Z.; Birch, J. Meat processing waste as a potential feedstock for biochemicals and biofuels—A review of possible conversion technologies. J. Clean. Prod. 2017, 142, 1583–1608. [Google Scholar] [CrossRef]
  2. Okoro, O.V.; Sun, Z.; Birch, J. Meat processing dissolved air flotation sludge as a potential biodiesel feedstock in New Zealand: A predictive analysis of the biodiesel product properties. J. Clean. Prod. 2017, 168, 1436–1447. [Google Scholar] [CrossRef]
  3. Okoro, O.V.; Sun, Z.; Birch, J. Experimental evaluation of a polystyrene sulphonic acid resin catalyst in the hydrolysis of low-grade lipids from the meat processing industry. Biomass Bioenergy 2018, 116, 49–59. [Google Scholar] [CrossRef]
  4. Okoro, O.V. Scaled-up biodiesel production from meat processing dissolved air flotation sludge: A simulation study. AgriEngineering 2018, 1, 3. [Google Scholar] [CrossRef]
  5. Wang, M.; Park, C. Investigation of anaerobic digestion of Chlorella sp. and Micractinium sp. grown in high-nitrogen wastewater and their co-digestion with waste activated sludge. Biomass Bioenergy 2015, 80, 30–37. [Google Scholar] [CrossRef]
  6. Massaro, V.; Digiesi, S.; Mossa, G.; Ranieri, L. The sustainability of anaerobic digestion plants: A win–win strategy for public and private bodies. J. Clean. Prod. 2015, 104, 445–459. [Google Scholar] [CrossRef]
  7. Domingues, R.F.; Sanches, T.; Silva, G.S.; Bueno, B.E.; Ribeiro, R.; Kamimura, E.S.; Franzolin Neto, R.; Tommaso, G. Effect of enzymatic pretreatment on the anaerobic digestion of milk fat for biogas production: Byproducts from agri-food industry: New strategies for their revalorisation. Food Res. Int. 2015, 73, 26–30. [Google Scholar] [CrossRef]
  8. Cesaro, A.; Belgiorno, V. Pretreatment methods to improve anaerobic biodegradability of organic municipal solid waste fractions. Chem. Eng. J. 2014, 240, 24–37. [Google Scholar] [CrossRef]
  9. Li, C.; Strömberg, S.; Liu, G.; Nges, I.A.; Liu, J. Assessment of regional biomass as co-substrate in the anaerobic digestion of chicken manure: Impact of co-digestion with chicken processing waste, seagrass and Miscanthus. Biochem. Eng. J. 2017, 118, 1–10. [Google Scholar] [CrossRef]
  10. Huang, X.; Yun, S.; Zhu, J.; Du, T.; Zhang, C.; Li, X. Mesophilic anaerobic co-digestion of aloe peel waste with dairy manure in the batch digester: Focusing on mixing ratios and digestate stability. Bioresour. Technol. 2016, 218, 62–68. [Google Scholar] [CrossRef] [PubMed]
  11. González, L.M.L.; Reyes, I.P.; Romero, O.R. Anaerobic co-digestion of sugarcane press mud with vinasse on methane yield. Waste Manag. 2017, 68, 139–145. [Google Scholar] [CrossRef] [PubMed]
  12. Sosnowski, P.; Wieczorek, A.; Ledakowicz, S. Anaerobic co-digestion of sewage sludge and organic fraction ofmunicipal solid wastes. Adv. Environ. Res. 2003, 7, 609–616. [Google Scholar] [CrossRef]
  13. Tanimu, M.I.; Ghazi, T.I.M.; Harun, R.M.; Idris, A. Effect of carbon to nitrogen ratio of food waste on biogas methane production in a batch mesophilic. Int. J. Innov. Manage. Technol. 2014, 5, 116–119. [Google Scholar]
  14. Hall, P.W.; Gifford, J.; Richardson, M. Bioenergy Options for New Zealand: A Situation Analysis of Biomass Resources and Conversion Technologies; Scion, Energy Group: Wellington, New Zealand, 2007. [Google Scholar]
  15. Baere, D. Anaerobic digestion of solid waste: State of the art. Water Sci. Technol. 2000, 41, 283–290. [Google Scholar] [CrossRef] [PubMed]
  16. Drosg, B.; Fuchs, W.; Al seadi, T.; Madsen, M.; Linke, B. Nutrient recovery by biogas digestate processing. IEA Bioenergy 2015, 2015, 711. [Google Scholar]
  17. Baggesen, D.L. Veterinary Safety in Relation to Handling of Manure and Animal by Products and the Use of Biogas Technologies; Presentation National Food Institute Denmark: Kgs Lyngby, Denmark, 2007. [Google Scholar]
  18. Risberg, K.; Cederlund, H.; Pell, M.; Arthurson, V.; Schnurer, A. Comparative characterization of digestate versus pig slurry and cow manure—Chemical composition and effects on soil microbial activity. Waste Manag. 2017, 61, 529–538. [Google Scholar] [CrossRef] [PubMed]
  19. Camilleri-Rumbau, M.S.; Norddahl, B.; Wei, J.; Christensen, K.V.; Søtoft, L.F. Microfiltration and ultrafiltration as a post-treatment of biogas plant digestates for producing concentrated fertilizers. Desalin. Water Treat. 2014, 55, 1639–1653. [Google Scholar] [CrossRef]
  20. Jones, S.B.; Zhu, Y.; Anderson, D.B.; Hallen, R.T.; Elliott, D.C.; Schmidt, A.J.; Albrecht, K.O.; Hart, T.R.; Butcher, M.G.; Drennan, C.; et al. Process Design and Economics for the Conversion of Algal Biomass to Hydrocarbons: Whole Algae Hydrothermal Liquefaction and Upgrading; Springfield: Sangamon, IL, USA, 2014. [Google Scholar]
  21. Okoro, O.V.; Sun, Z.; Birch, J. Enhanced Fatty Acid Generation from Meat Processing Dissolved Air Flotation Sludge. In Proceedings of the 25th European Biomass Conference and Exhibition, Stockholm, Sweden, 12–15 June 2017. [Google Scholar]
  22. Batstone, D.J.; Tait, S.; Starrenburg, D. Estimation of hydrolysis parameters in full-scale anerobic digesters. Biotechnol. Bioeng. 2009, 102, 1513–1520. [Google Scholar] [CrossRef] [PubMed]
  23. ASTM. Standard Test Method for Determination of Total Solids in Biomass; ASTM International: West Conshohocken, PA, USA, 2015. [Google Scholar]
  24. ASTM. Standard Test Method for Volatile Matter in the Analysis Sample of Coal and Coke; American Society for Testing and materials International: West Conshohocken, PA, USA, 2011. [Google Scholar]
  25. ASTM. D2017-98 Standard Test Method of Accelerated Laboratory Test of Natural Decay Resistance of Woods, Decay, Evaluation, Laboratory, Natural, Resistance and Subjected to Termite Bioassay According to No-Choice Test Procedure Based upon AWPA E1-97; American Society for Testing and Materials: West Conshohocken, PA, USA, 1998. [Google Scholar]
  26. ASTM. Standard Test Method for Specific Gravity and Density of Semi-Solid Bituminous Materials (Pycnometer Method); American Society for Testing and Materials International: West Conshohocken, PA, USA, 2013. [Google Scholar]
  27. Jensen, P.D.; Ge, H.; Batstone, D.J. Assessing the role of biochemical methane potential tests in determining anaerobic degradability rate and extent. Water Sci. Technol. 2011, 64, 880–886. [Google Scholar] [CrossRef] [PubMed]
  28. Oliveira, N.R.; Alves, M.M. Influence of inoculum activity on the bio-methanization of a kitchen waste under different waste/inoculum ratios. Process Biochem. 2004, 39, 2019–2024. [Google Scholar] [Green Version]
  29. Ehimen, E.; Connaughtonw, S.; Sun, Z.; Carrington, G.C. Energy recovery from lipid extracted, transesterified and glycerol co digested microalgae biomass. GCB Bioenergy 2009, 88, 371–381. [Google Scholar] [CrossRef]
  30. Demirel, B.; Scherera, P. Trace element requirements of agricultural biogas digesters during biological conversion of renewable biomass to methane. Biomass Bioenergy. 2011, 35, 992–998. [Google Scholar] [CrossRef]
  31. Li, J.; Jhaa, A.K.; He, J.; Ban, Q.; Chang, S.; Wang, P. Assessment of the effects of dry anaerobic codigestion codigestion of cow dung with waste water sludge on biogas yield and biodegradability. Int. J. Phys. Sci. 2011, 6, 3723–3732. [Google Scholar]
  32. Hinds, G.R.; Mussoline, W.; Casimir, L.; Dick, G.; Yeh, D.H.; Ergas, S.J. Enhanced methane yields in high-solids anaerobic digestion through inoculation with pulp and paper mill sludge. Environ. Eng. Sci. 2016, 33, 907–917. [Google Scholar] [CrossRef]
  33. Guwy, A.J. Equipment used for testing anaerobic biodegradability and activity. Rev. Environ. Sci. Biotechnol. 2004, 3, 131–139. [Google Scholar] [CrossRef]
  34. Zhang, W.; Wei, Q.; Wu, S.; Qi, D.; Li, W.; Zuo, Z.; Dong, D. Batch anaerobic co-digestion of pig manure with dewatered sewage sludge under mesophilic conditions. Appl. Energy 2014, 128, 175–183. [Google Scholar] [CrossRef]
  35. Gamble, K.J. Anaerobic Digestion from the Laboratory to the Field: An Experimental Study into the Scalability of Anaerobic Digestion. Ph.D. Thesis, Appalachian State University, Boone, NC, USA, 2014. [Google Scholar]
  36. Walker, M.; Zhang, Y.; Heaven, S.; Banks, C. Potential errors in the quantitative evaluation of biogas production in anaerobic digestion processes. Bioresour. Technol. 2009, 100, 6339–6346. [Google Scholar] [CrossRef] [PubMed] [Green Version]
  37. Wang, Y.; Li, G.; Chi, M.; Sun, Y.; Zhang, J.; Jiang, S.; Cui, Z. Effects of co-digestion of cucumber residues to corn stover and pig manure ratio on methane production in solid state anaerobic digestion. Bioresour. Technol. 2018, 250, 328–336. [Google Scholar] [CrossRef] [PubMed]
  38. Ebner, J.H.; Labatut, R.A.; Lodge, J.S.; Williamson, A.A.; Trabold, T.A. Anaerobic co-digestion of commercial food waste and dairy manure: Characterizing biochemical parameters and synergistic effects. Waste Manag. 2016, 52, 286–294. [Google Scholar] [CrossRef] [PubMed]
  39. Ho, D.P.; Jensen, P.D.; Batstone, D.J. Methanosarcinaceae and acetate-oxidizing pathways dominate in high-rate thermophilic anaerobic digestion of waste-activated sludge. Appl. Environ. Microbiol. 2013, 79, 6491–6500. [Google Scholar] [CrossRef] [PubMed]
  40. Roberts, R.; Davies, W.J.; Forster, C.F. Two-stage, thermophilic-mesophilic anaerobic digestion of sewage sludge. Process Saf. Environ. Prot. 1999, 77, 93–97. [Google Scholar] [CrossRef]
  41. Zwietering, M.H.; Jongenburger, L.; Rombouts, F.M.; Van’t Riet, K. Modeling the bacterial growth curve. Appl. Environ. Microbiol. 1990, 56, 1875–1881. [Google Scholar] [PubMed]
  42. Pitt, R.E.; Cross, T.L.; Pell, A.N.; Schofield, P.; Doane, P.H. Use of in vitro gas production models in ruminal kinetics. Math. Biosci. 1999, 159, 145–163. [Google Scholar] [CrossRef]
  43. Zhen, G.; Lu, X.; Kobayashi, T.; Kumar, G.; Xu, K. Anaerobic co-digestion on improving methane production from mixed microalgae (Scenedesmus sp., Chlorella sp.) and food waste: Kinetic modeling and synergistic impact evaluation. Biochem. Eng. J. 2016, 299, 332–341. [Google Scholar] [CrossRef]
  44. Leow, S.; Witter, J.R.; Vardon, D.R.; Sharma, B.K.; Guest, J.S.; Strathmann, T.J. Prediction of microalgae hydrothermal liquefaction products from feedstock biochemical composition. Green Chem. 2015, 17, 3584–3599. [Google Scholar] [CrossRef] [Green Version]
  45. Li, Y.; Leow, S.; Fedders, A.C.; Sharma, B.K.; Guest, J.S. Quantitative multiphase model for hydrothermal liquefaction of algal biomass. Green Chem. 2017, 19, 1163–1174. [Google Scholar] [CrossRef]
  46. Sheng, L.; Wang, X.; Yang, X. Prediction model of biocrude yield and nitrogen heterocyclic compounds analysis by hydrothermal liquefaction of microalgae with model compounds. Bioresour. Technol. 2018, 247, 14–20. [Google Scholar] [CrossRef] [PubMed]
  47. AOAC. Animal feed. In Official Methods of Analysis; Association of Official Analytical Chemists International: Arlington, VA, USA, 1995. [Google Scholar]
  48. AOCS. Combustion Method for Determination of Crude Protein in Animal Feeds, Oilseed Meals and Oilseeds; American Oil Chemists Society: Urbana, IL, USA, 1998. [Google Scholar]
  49. AOAC. Official Methods of Analysis of AOAC International, 19th ed.; AOAC International: Gaithersburg, MD, USA, 2012. [Google Scholar]
  50. Hill, J.; Nelson, E.; Tilman, D.; Polasky, S.; Tiffany, D. Environmental, economic and energetic costs and benefits of biodiesel and ethanol biofuels. Proc. Natl. Acad. Sci. USA 2006, 30, 11206–11210. [Google Scholar] [CrossRef] [PubMed]
  51. Silalertruksa, T.; Gheewala, S.H. Environmental sustainability assessment of bio-ethanol production in Thailand. Energy 2009, 34, 1933–1946. [Google Scholar] [CrossRef]
  52. Freris, L.; Infield, D. Renewable Energy in Power Systems; Wiley: New York, NY, USA, 2008. [Google Scholar]
  53. Efficiency of Conventional Thermal Electricity and Heat Production. Available online: https://www.eea.europa.eu/data-and-maps/indicators/efficiency-of-conventional-thermal-electricity-generation-4/assessment-1 (accessed on 7 August 2018).
  54. Eurelectric. Efficiency in Electricity Generation; VGB PowerTech: Essen, Germany, 2003. [Google Scholar]
  55. Heat Values of Various Fuels. Available online: www.world-nuclear.org/information-library/facts-and-figures/heat-values-of-various-fuels.aspx (accessed on 27 February 2017).
  56. Vardona, D.R.; Sharma, B.K.; Blazina, G.V.; Rajagopalan, K.; Strathmann, T.J. Thermochemical conversion of raw and defatted algal biomass via hydrothermal liquefaction and slow pyrolysis. Bioresour. Technol. 2012, 109, 178–187. [Google Scholar] [CrossRef] [PubMed]
  57. Yokoyama, S.; Suzuki, A.; Masanori Murakamit, T.O. Liquid fuel production from sewage sludge by catalytic conversion using sodium carbonate. Fuel 1987, 66, 1150–1155. [Google Scholar] [CrossRef]
  58. ToolBox, E. Water—Thermophysical Properties. Available online: https://www.engineeringtoolbox.com/water-thermal-properties-d_162.html (accessed on 12 August 2017).
  59. Gupta, M.; Yanga, Y.; Roy, C. Specific heat and thermal conductivity of softwood bark and softwood char particles. Fuel 2003, 82, 919–927. [Google Scholar] [CrossRef]
  60. Ehimen, E.A. An Investigation on the Coproduction of Biodiesel and Methane from Microalgae. Ph.D. Thesis, University of Otago, Dunedin, New Zealand, 2010. [Google Scholar]
  61. Budde, J.; Prochnow, A.; Plöchl, M.; Quiñones, T.S.; Heiermann, M. Energy balance, greenhouse gas emissions, and profitability of thermobarical pretreatment of cattle waste in anaerobic digestion. Waste Manag. 2016, 49, 390–410. [Google Scholar] [CrossRef] [PubMed]
  62. Banks, C.J.; Salter, A.M.; Heaven, S.; Riley, K. Energetic and environmental benefits of co-digestion of food waste and cattle slurry: A preliminary assessment. Resour. Conserv. Recycl. 2012, 56, 71–79. [Google Scholar] [CrossRef] [Green Version]
  63. GSES. Planning and Installing Bioenergy Systems: A Guide for Installers, Architects and Engineers; The German Solar Energy Society: James and James Science Publishers: London, UK, 2005; p. 359. [Google Scholar]
  64. Welty, J.R.; Wicks, C.E.; Wilson, C.E.; Rorrer, G.L. Fundementals of Momentum, Heat and Mass Transfer; Wiley: New York, NY, USA, 2008. [Google Scholar]
  65. Sustainability-Victoria. Energy Efficiency Best Practice Guide, Pumping Systems; Sustainability Victoria: Melbourne, Australia, 2009. [Google Scholar]
  66. Pemberton, M. Pump Efficiency Drives Cost Savings. Available online: https://www.controleng.com/single-article/pump-efficiency-drives-cost-savings (accessed on 3 April 2018).
  67. Deublein, D.; Steinhauser, A. Biogas from Waste and Renewable Resources: An Introduction, 2nd Revised and Expanded Edition; Wiley-VCH: Weinheim, Germany, 2011. [Google Scholar]
  68. Lima, D.M.F.; Rodrigues, J.A.D.; Boe, M.; Alvarado-Morales, M.; Ellegaard, L.; Angelidaki, I. anaerobic modelling for improving the synegy and robustness of manure co-digestion process. Braz. J. Chem. Eng. 2016, 33, 871–883. [Google Scholar] [CrossRef]
  69. Procházka, J.; Dolejš, P.; MácA, J.; Dohányos, M. Stability and inhibition of anaerobic processes caused by insufficiency or excess of ammonia nitrogen. Appl. Microbiol. Biotechnol. 2012, 93, 439–447. [Google Scholar] [CrossRef] [PubMed]
  70. Wang, X.; Lu, X.; Li, F.; Yang, G. Effects of temperature and carbon-nitrogen (C/N) ratio on the performance of anaerobic co-digestion of dairy manure, chicken manure and rice straw: Focusing on ammonia inhibition. PLoS ONE 2014, 9, e97265. [Google Scholar] [CrossRef] [PubMed]
  71. Rahman, M.A.; Møller, H.B.; Saha, C.K.; Alam, M.M.; Wahid, R.; Feng, L. Optimal ratio for anaerobic co-digestion of poultry droppings and lignocellulosic-rich substrates for enhanced biogas production. Energy Sustain. Dev. 2017, 39, 59–66. [Google Scholar] [CrossRef]
  72. Vardon, D.R.; Sharma, B.K.; Scott, J.; Yu, G.; Wang, Z.; Schideman, L.; Zhang, Y.; Strathmann, T.J. Chemical properties of biocrude oil from the hydrothermal liquefaction. Bioresour. Technol. 2011, 102, 8295–8303. [Google Scholar] [CrossRef] [PubMed]
  73. Martin-Ryals, A.D. Evaluating the Potential for Improving Anaerobic Digestion of Cellulosic Waste via Routine Bioaugmentation and Alkaline Pretreatment. Ph.D. Thesis, University of Illinois at Urbana-Champaign, Champaign, IL, USA, 2012. [Google Scholar]
  74. Ramirez, J.A.; Brown, R.J.; Rainey, T.J. A review of hydrothermal liquefaction bio-crude properties and prospects for upgrading to transportation fuels. Energies 2015, 8, 6765–6794. [Google Scholar] [CrossRef] [Green Version]
  75. Biller, P.; Ross, A.P. Potential yields and properties of oil from the hydrothermal liquefaction of microalgae with different biochemical contents. Bioresour. Technol. 2011, 102, 215–225. [Google Scholar] [CrossRef] [PubMed]
  76. Maddi, B.; Panisko, E.; Wietsma, T.; Lemmon, T.; Swita, M.; Albrecht, K. Quantitative characterization of aqueous byproducts from hydrothermal liquefaction of municipal wastes, food industry wastes, and biomass grown on waste. ACS Sustain. Chem. Eng. 2017, 5, 2205–2214. [Google Scholar] [CrossRef]
  77. Mørup, A.J.; Becker, J.; Christensen, P.R.; Houlberg, K.; Lappa, E.; Klemmer, M.; Madsen, R.; Glasius, M.; Iversen, B. Construction and commisioning of a continuous reactor for hydrothermal liquefaction. Ind. Chem. Eng. Res. 2015, 54, 5935–5947. [Google Scholar] [CrossRef]
  78. Madsen, R.; Christensen, P.; Houlberg, K.; Lappa, E.; Mørup, A.; Klemmer, M.; Olsen, E.; Jensen, M.; Becker, J.; Iversen, B.; et al. Analysis of organic gas phase compounds formed by hydrothermal liquefaction of dried distillers grains with solubles. Bioresour. Technol. 2015, 192, 826–830. [Google Scholar] [CrossRef] [PubMed]
  79. Huang, H.; Yuan, X.; Wu, G. Liquefaction of biomass for bio-oil products. In Waste Biomass Management—A Holistic Approach; Springer: Cham, Switzerland, 2017; pp. 231–251. [Google Scholar]
  80. Tian, C.; Zhidan, L.; Zhang, Y. Hydrothermal Liquefaction (HTL): A promising pathway for biorefinery of algae. In Algal Biofuels; Springer: Cham, Switzerland, 2017; pp. 361–391. [Google Scholar]
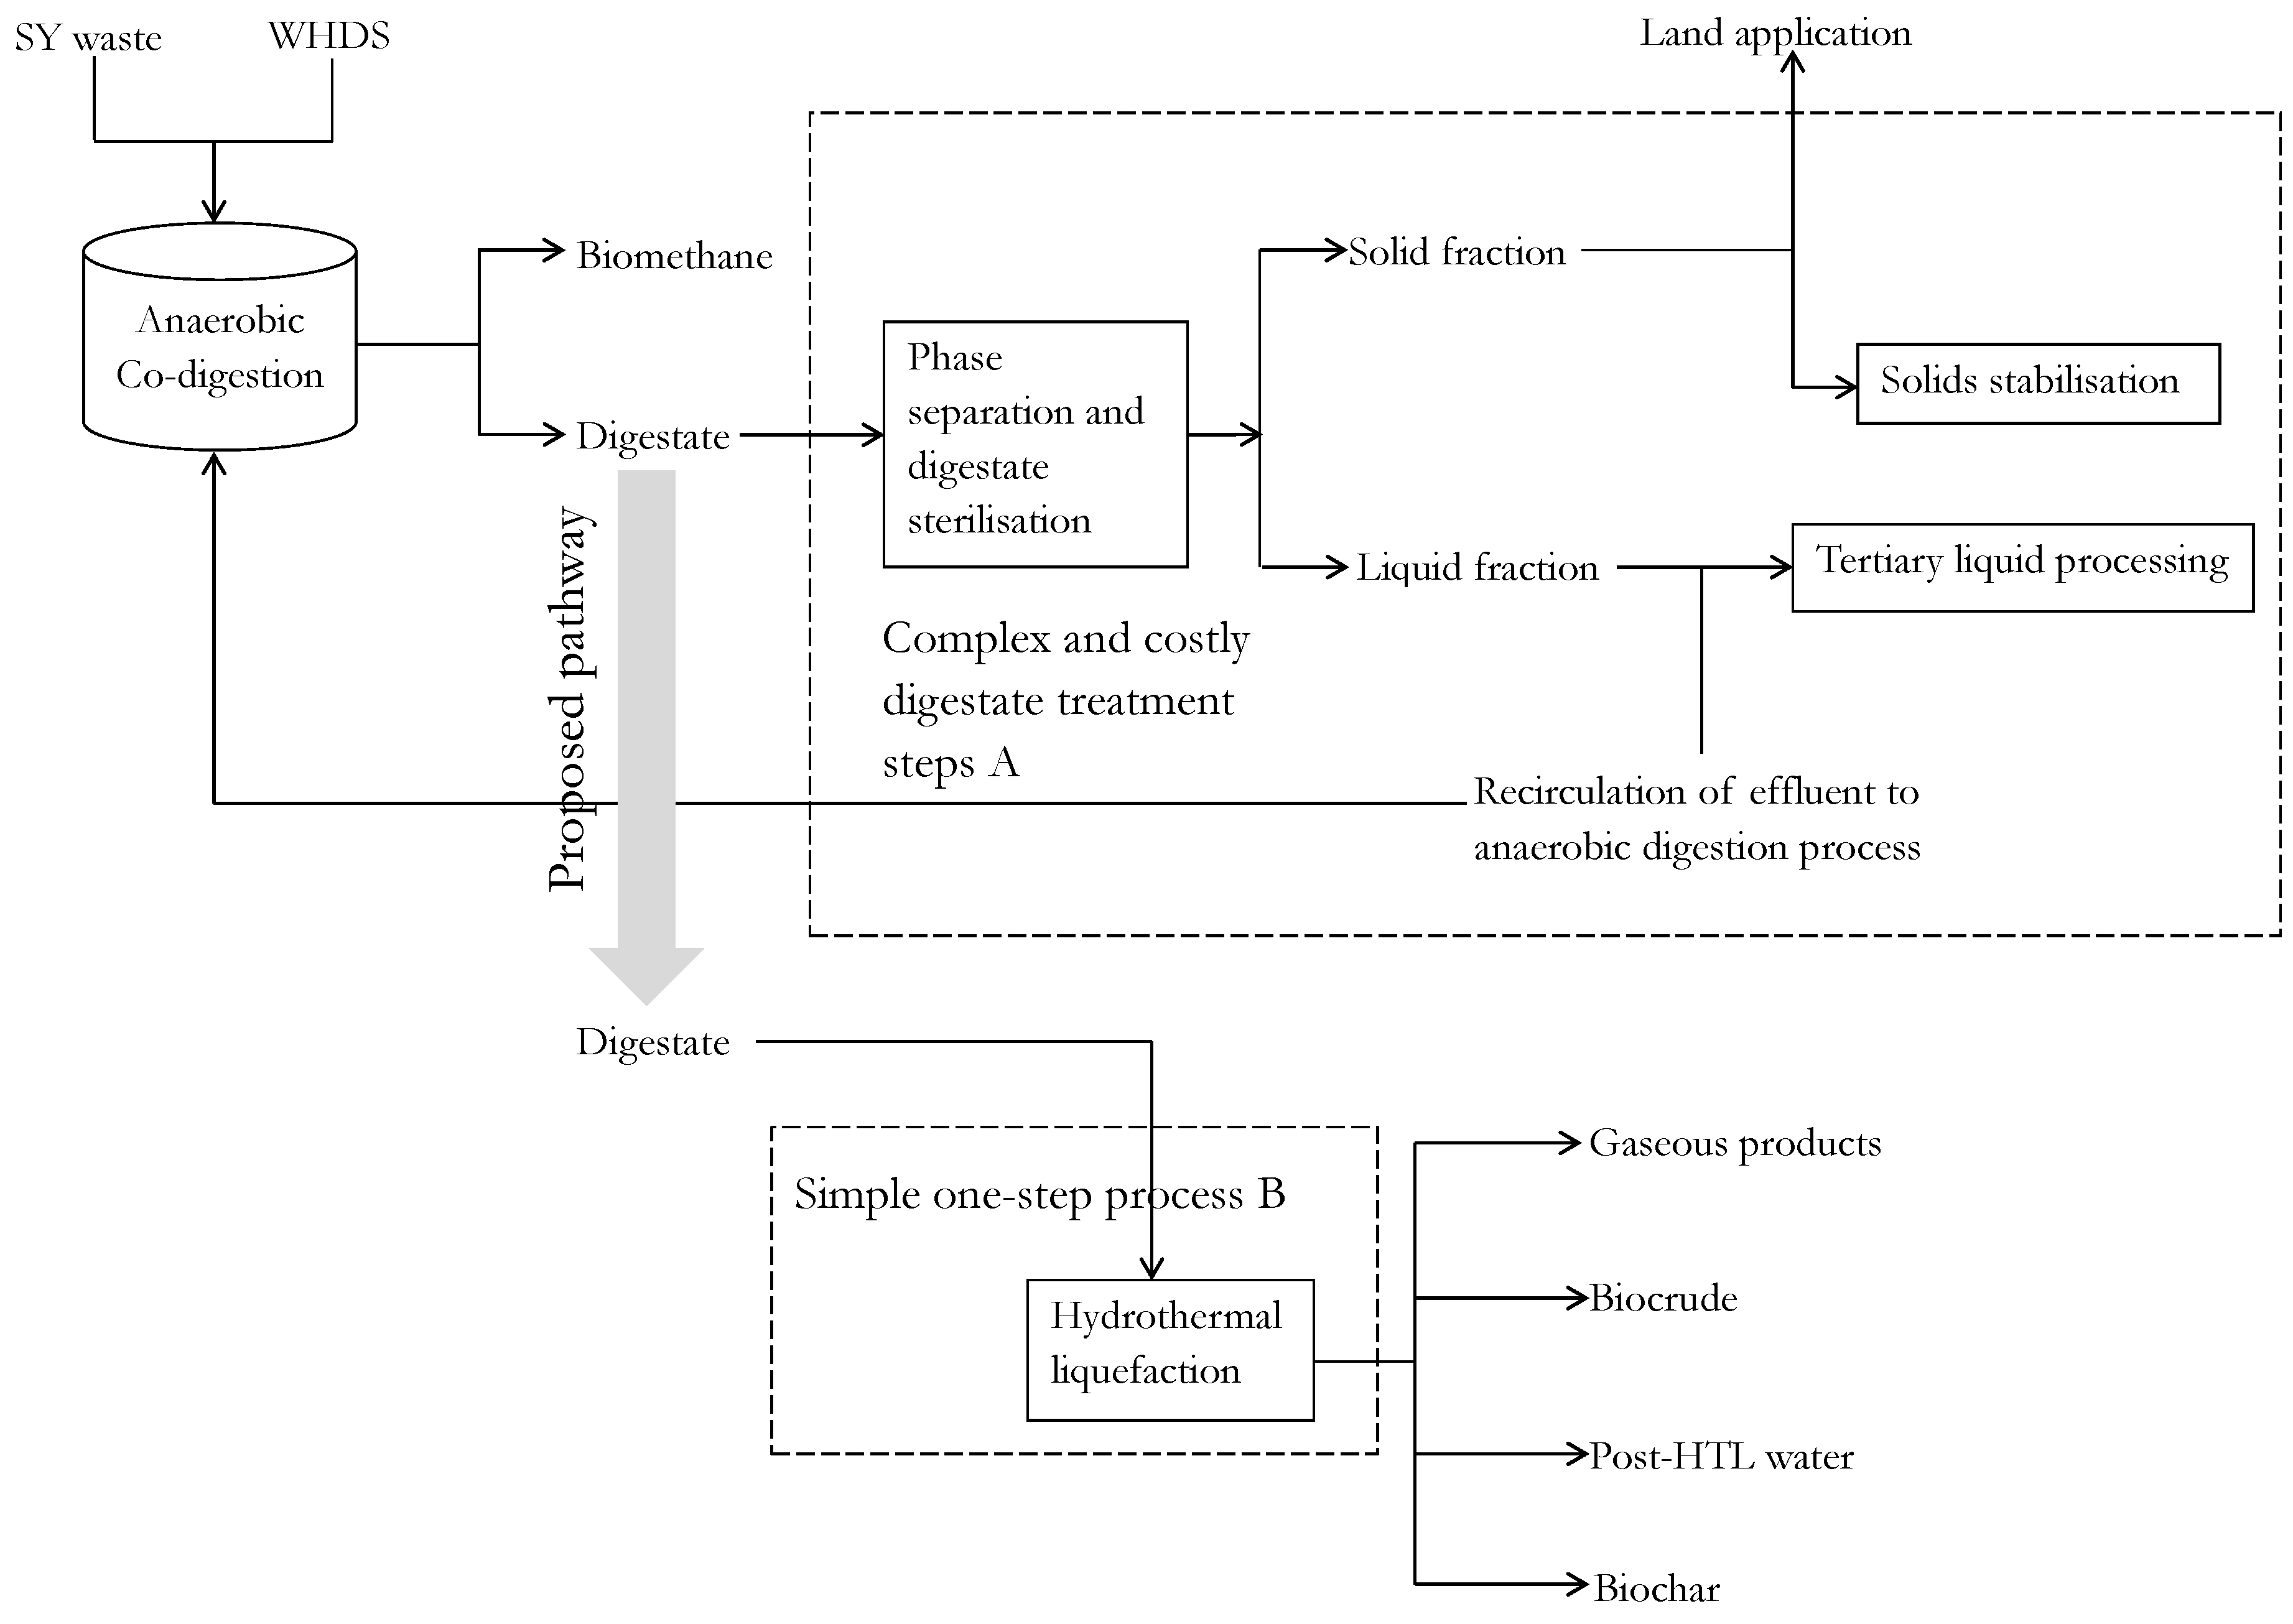
Figure 1. Proposed enhanced resource recovery step B compared to traditional digestate handling technologies A: SY, WHDS and HTL denote stockyard, wet hydrolyzed dissolved air flotation DAF sludge and hydrothermal liquefaction, respectively; SY: stockyard; WHDS: wet hydrolyzed DAF sludge; HTL: hydrothermal liquefaction; DAF: dissolved air flotation sludge.
Applsci 08 02290 g001
Figure 2. Labeled schematic representation of the experimental set-up for assessing the co-digestion of substrate mixtures of VSWHDS to VSSY mass ratios of 1:0, 4:1, 3:2, 2:3, 1:4 and 0:1.
Applsci 08 02290 g002
Figure 3. Daily biomethane potential from the different co-substrate mixtures investigated. The mass ratios of the volatile solids of WHDS to the volatile solids of SY for the different substrate mixtures are listed in Table 3.
Applsci 08 02290 g003
Figure 4. The variation of cumulative biomethane potential with time from the different substrate mixtures. The mass ratios of the volatile solids of WHDS to the volatile solids of SY for the different substrate mixtures are listed in Table 3.
Applsci 08 02290 g004
Figure 5. Analyzing the pH changes during the anaerobic degradation process. The mass ratios of the volatile solids of WHDS to the volatile solids of SY for the different substrate mixtures are listed in Table 3.
Applsci 08 02290 g005
Figure 6. A comparative assessment of the calculated and the experimentally determined biomethane potentials. The mass ratios of the volatile solids of WHDS to the volatile solids of SY for the different substrate mixtures are listed in Table 3.
Applsci 08 02290 g006
Figure 7. Analyzing the effect of C/N ratio on biomethane yield.
Applsci 08 02290 g007
Figure 8. Fitted kinetic model curves for cumulative biomethane potentials from the anaerobic digestion of different substrates; (A): Variation of biomethane potentials of the degradation of the substrate of WHDS (wet hydrolyzed DAF sludge) only with time; (B): Variation of biomethane potentials of the degradation of the substrate of Mix-1 with time; (C): Variation of biomethane potentials of the degradation of the substrate of Mix-2 with time; (D): Variation of biomethane potentials of the degradation of the substrate of Mix-3 with time; (E): Variation of biomethane potentials of the degradation of the substrate of Mix-4 with time; (F): Variation of biomethane potentials of the degradation of the substrate of stockyard (SY) only with time.
Applsci 08 02290 g008
Figure 9. Theoretically determined yield of the major HTL products from the digestate feedstock: db indicates dry basis.
Applsci 08 02290 g009
Figure 10. Variation of the net energy ratio (NER) of the integrated hydrothermal liquefaction and anaerobic co-digestion system and the moisture content of the digestate.
Applsci 08 02290 g010
Table 1. Characterization of the WHDS (wet hydrolyzed DAF sludge), SY (stockyard) waste and inoculum.
ParametersInoculumWHDSSY
Total solids (%w/w, wet feedstock)2.33 (0.07)7.35 (0.65)16.73 (0.01)
Volatile solids (%w/w TS 1)41.89 (1.64)24.86 (0.42)42.45 (0.94)
Fixed carbon (%w/w TS)23.21 (1.94)49.57 (0.64)23.68 (1.16)
VS 2 to TS mass ratio0.42 (0.02)0.25 (0.03)0.42 (0.02)
Ash (%w/w TS)34.90 (0.07)25.57 (0.48)33.87 (0.68)
Carbon content (%w/w TS)29.66 (0.14)42.88 (0.13)33.37 (0.29)
Nitrogen content (%w/w TS)3.61 (0.05)2.49 (0.07)2.40 (0.02)
Sulphur content (%w/w TS)0.795 (0.03)2.40 (0.06)0.30 (0.00)
Hydrogen content (%w/w TS)4.87 (0.07)5.91 (0.07)4.73 (0.02)
Oxygen content (%w/w TS)26.18 (0.16)20.76 (0.51)25.33 (0.68)
Carbon to nitrogen mass ratio8.23 (0.11)17.22 (0.48)13.90 (0.167)
pH value7.46 (0.01)8.09 (0.00)7.56 (0.00)
Specific gravity at 20 °C0.97 (0.01)0.96 (0.01)1.07 (0.05)
Empirical formula (ash free db 3)C100H196N10O66SC48H79N2O17SC297H504N18O169S
1 TS represents total solids, 2 VS represents volatile solids, standard errors are shown in parentheses based on duplicate measurements and 3 db represents dry weight basis.
Table 2. The mass characteristics of the different co-digestion substrate mixtures investigated.
(VSWHDS/VSSY)1:04:13:22:31:40:1
Bioreactor DesignationWHDS OnlyMix-1Mix-2Mix-3Mix-4SY Only
Parameter
WHDS (g wet basis)54.72843.78332.83721.89110.9460.000
SY (g wet basis)0.0002.8165.6328.44811.26314.081
Total carbon (g dry basis)1.7251.5371.3491.1610.9740.786
Total nitrogen (g dry basis)0.1000.0910.0830.0740.0650.056
carbon to nitrogen (C/N) ratio17.25016.89016.25315.68914.98514.036
Table 3. Biomethane potential and biomethane contents of biogas generated from the degradation of the different substrate mixtures.
VSWHDS: VSSYDesignationBiomethane Potential (mL/gVSadded) 1Biomethane Content (vol.%) 1
1:0WHDS only65.4356.5
4:1Mix-1148.5858.8
3:2Mix-2179.0361.1
2:3Mix-3170.5361.9
1:4Mix-4264.1361.2
0:1SY only169.6461.5
1 Mean value.
Table 4. Values of the parameters of the biomethane kinetic models (Equations (3)–(5)).
SubstrateExponential (First Order) ModelCone ModelModified Gompertz Model
BmaxkλRMSER2BmaxknRMSER2BmaxRmλRMSER2
WHDS only67.10.2480.1322.7470.98270.940.3241.5352.7840.98265.110.350.03.330.974
Mix-1148.30.4480.02.0170.997153.50.6481.5302.7910.995146.642.130.04.960.984
Mix-2176.20.3770.04.1000.993190.70.5321.2273.5680.995173.042.500.08.230.967
Mix-3166.10.3550.08.5080.962206.00.4170.7985.4170.985162.637.770.012.990.912
Mix-4273.00.2070.010.030.983341.50.2150.99010.880.981262.736.200.014.720.962
SY only172.70.2580.05.9670.985202.90.3111.0466.6130.980168.227.990.09.470.962
Bmax is the maximum possible cumulative biomethane potential produced after an infinite number of days, in mL/gVSadded, k is the biomethane production rate constant in d−1, λ and n represent the initial delay period in the degradation process in days and the shape factor respectively, RMSE represents the root mean square errors and R2 represents the coefficient of determination.
Table 5. Characteristics of digestate residue.
Biogas DigestateValue
Lipid content 1 (wt.%)1.60 (0.2)
Protein content 1 (wt.%)17.50 (0.09)
Ash content 1 (wt.%)39.53 (0.39)
Carbohydrate content 1 (wt.%)41.40 (0.44)
Carbon content 1 (wt.%)28.64 (0.10)
Nitrogen content 1 (wt.%)2.80 (0.02)
Sulphur content 1 (wt.%)Trace
Hydrogen content 1 (wt.%)4.45 (0.07)
Oxygen content 1 (wt.%)24.60 (0.40)
pH value of wet digestate8.32 (0.32)
Bulk specific gravity at 20 °C1.02 (0.02)
Standard errors are shown in parentheses based on duplicate measurements; 1 measured on a dry digestate basis.