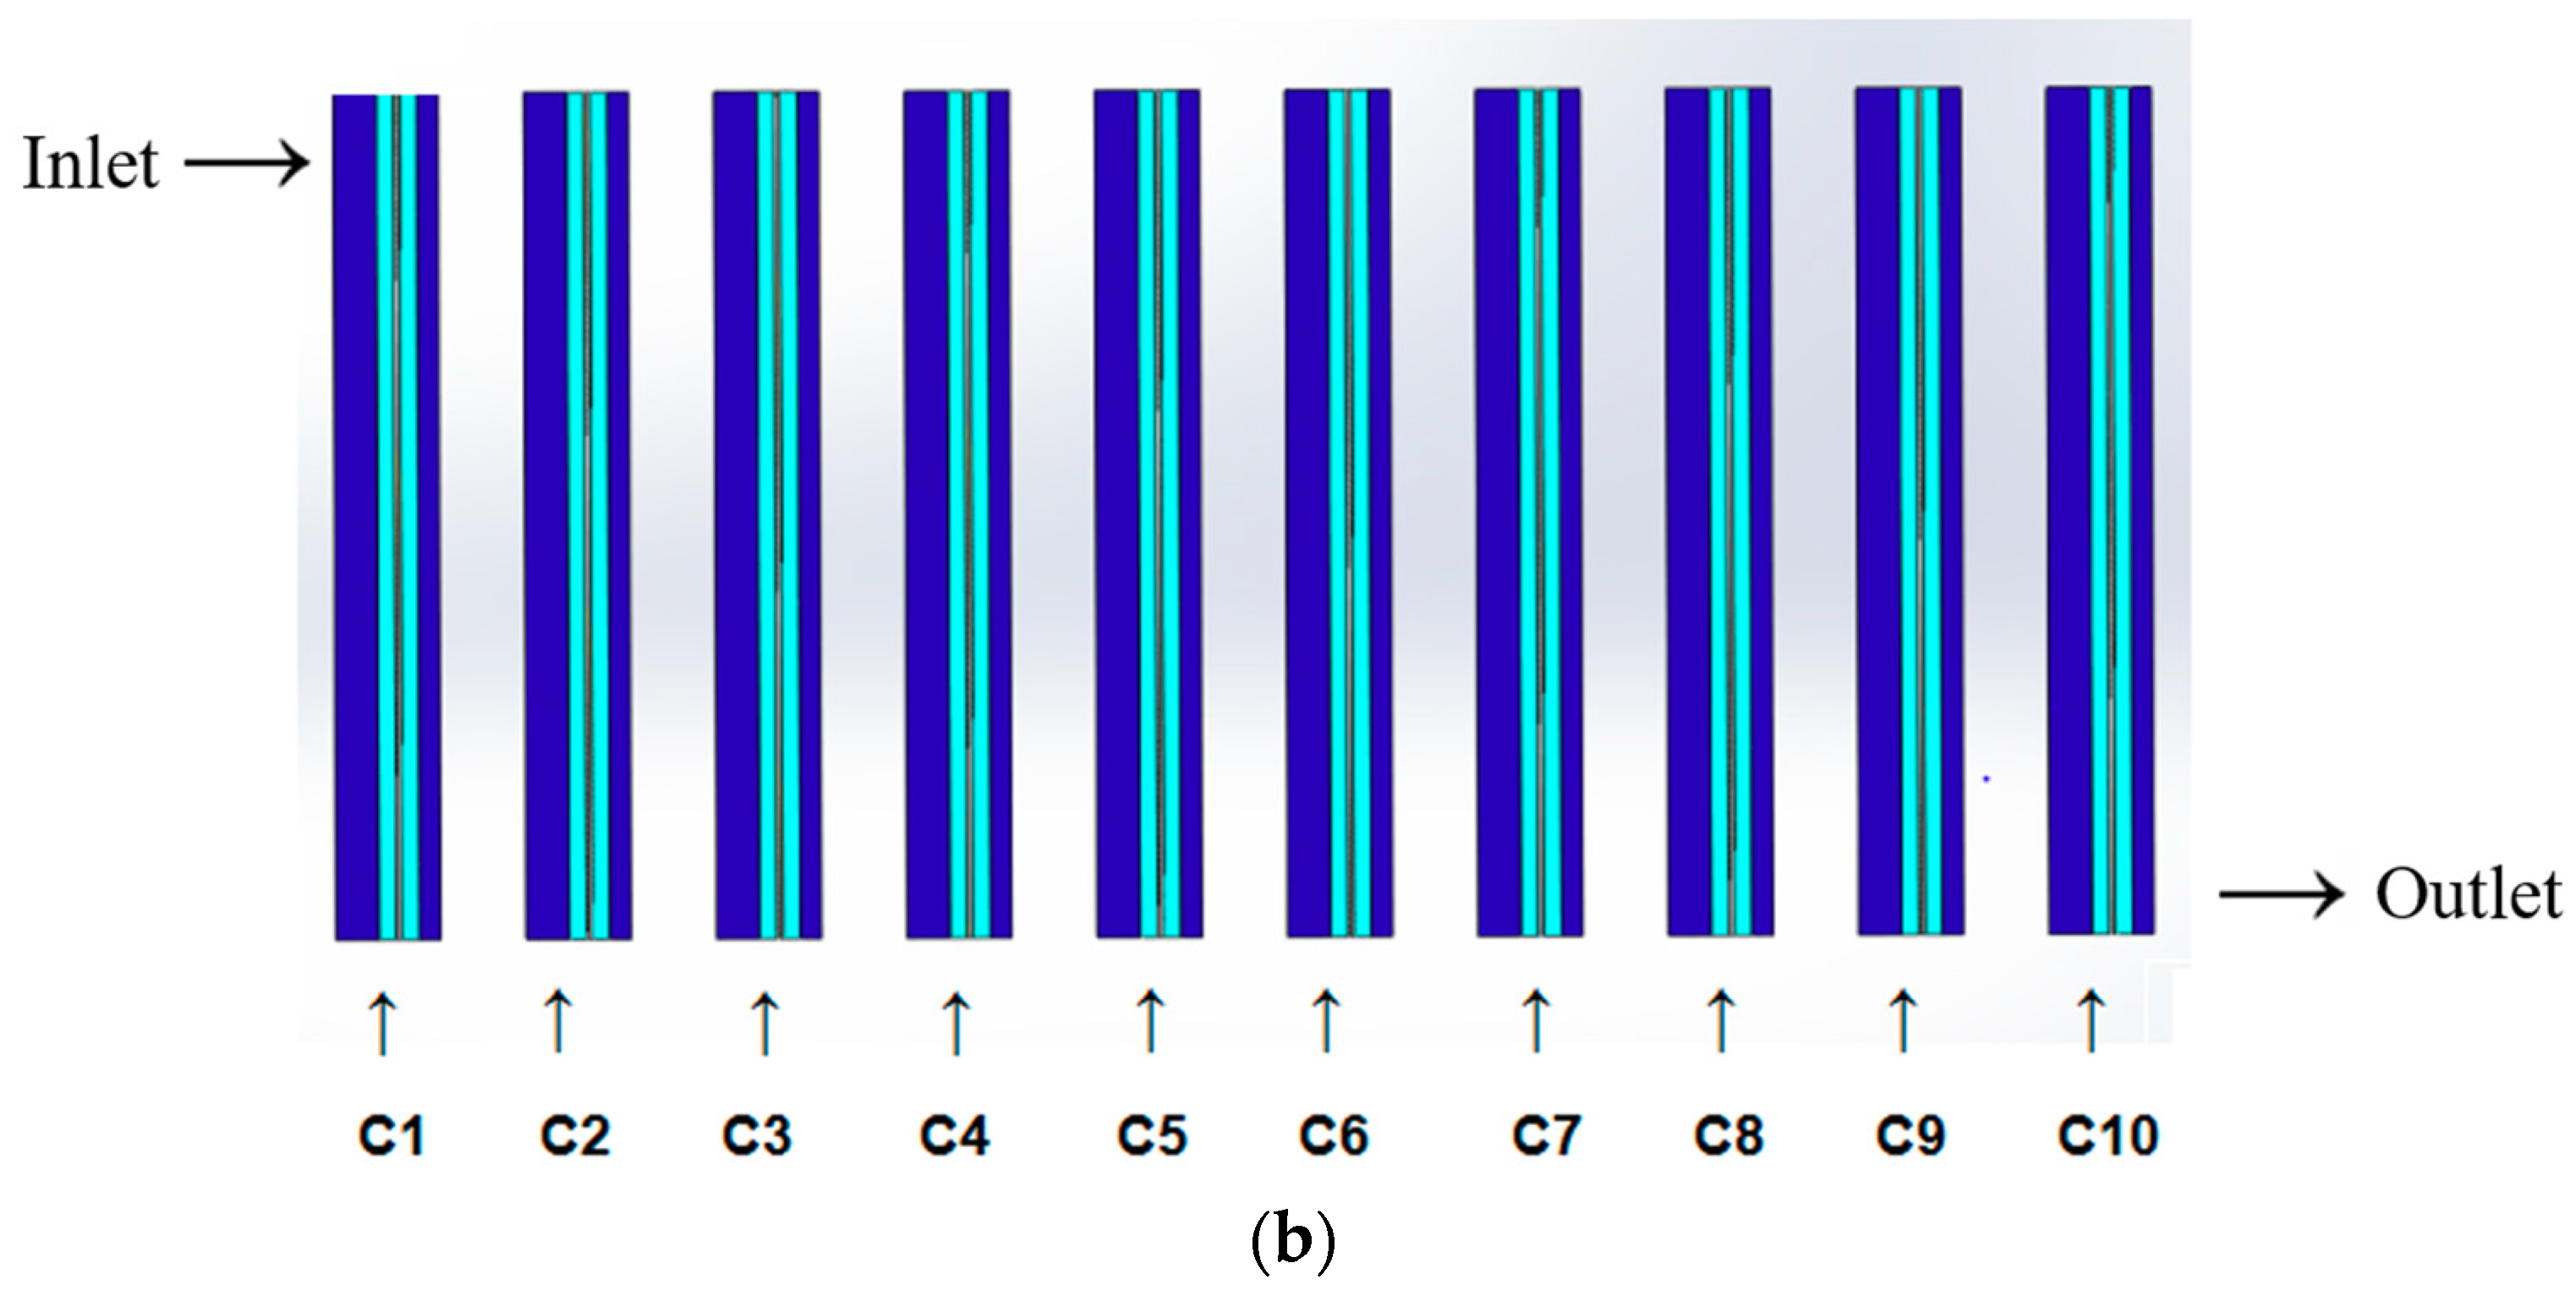
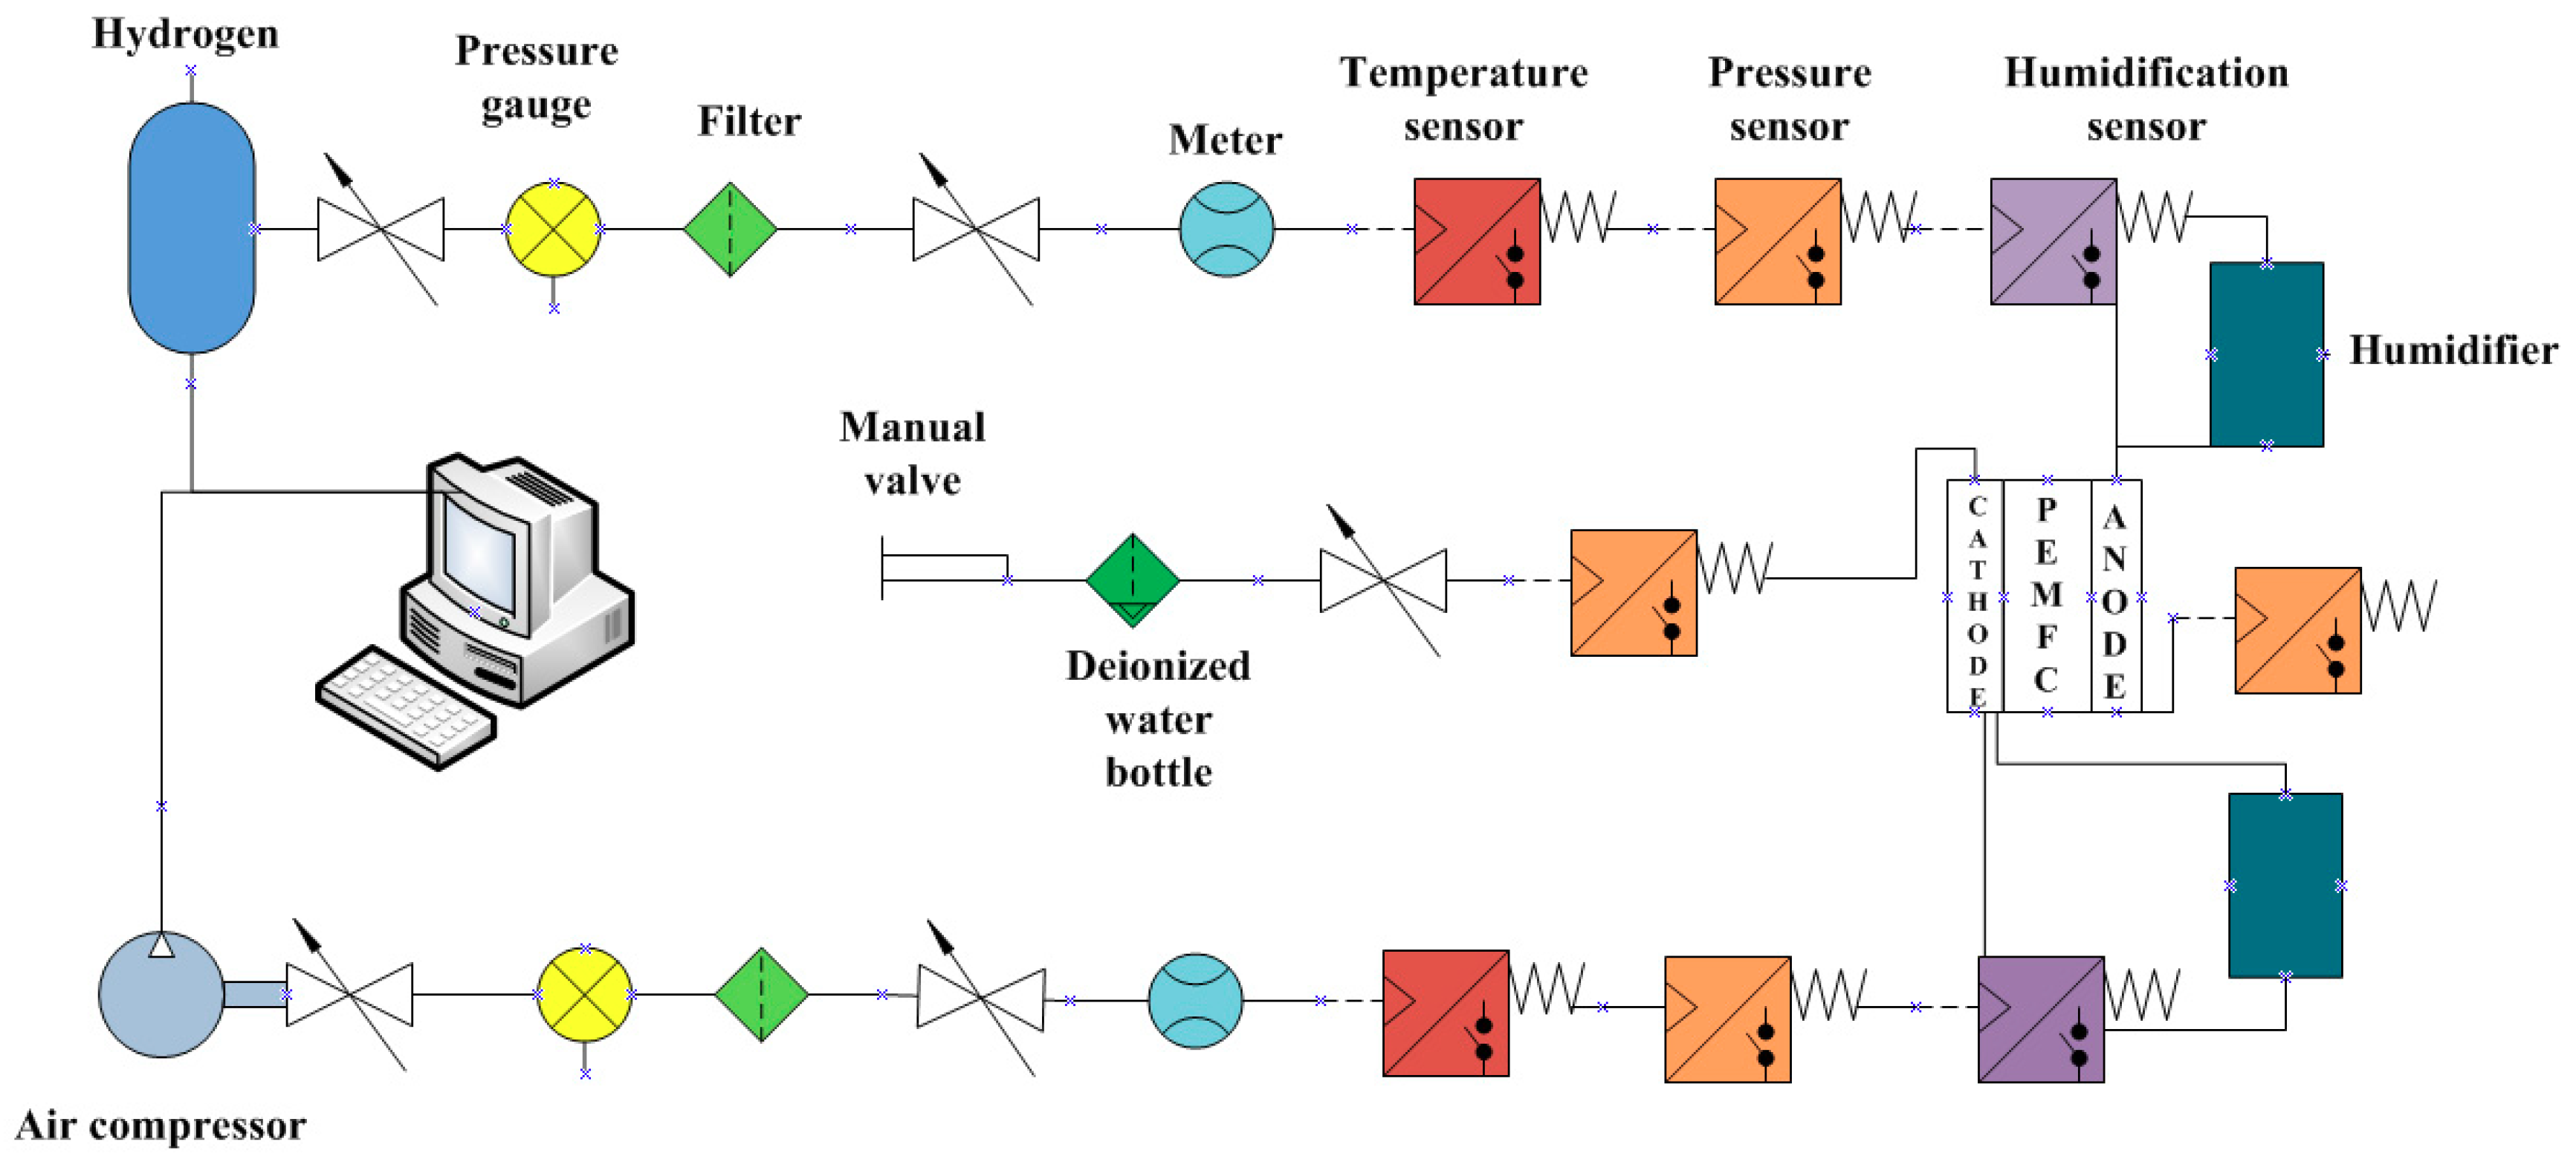
4.1. Polarization Curves with 10 Single Cells
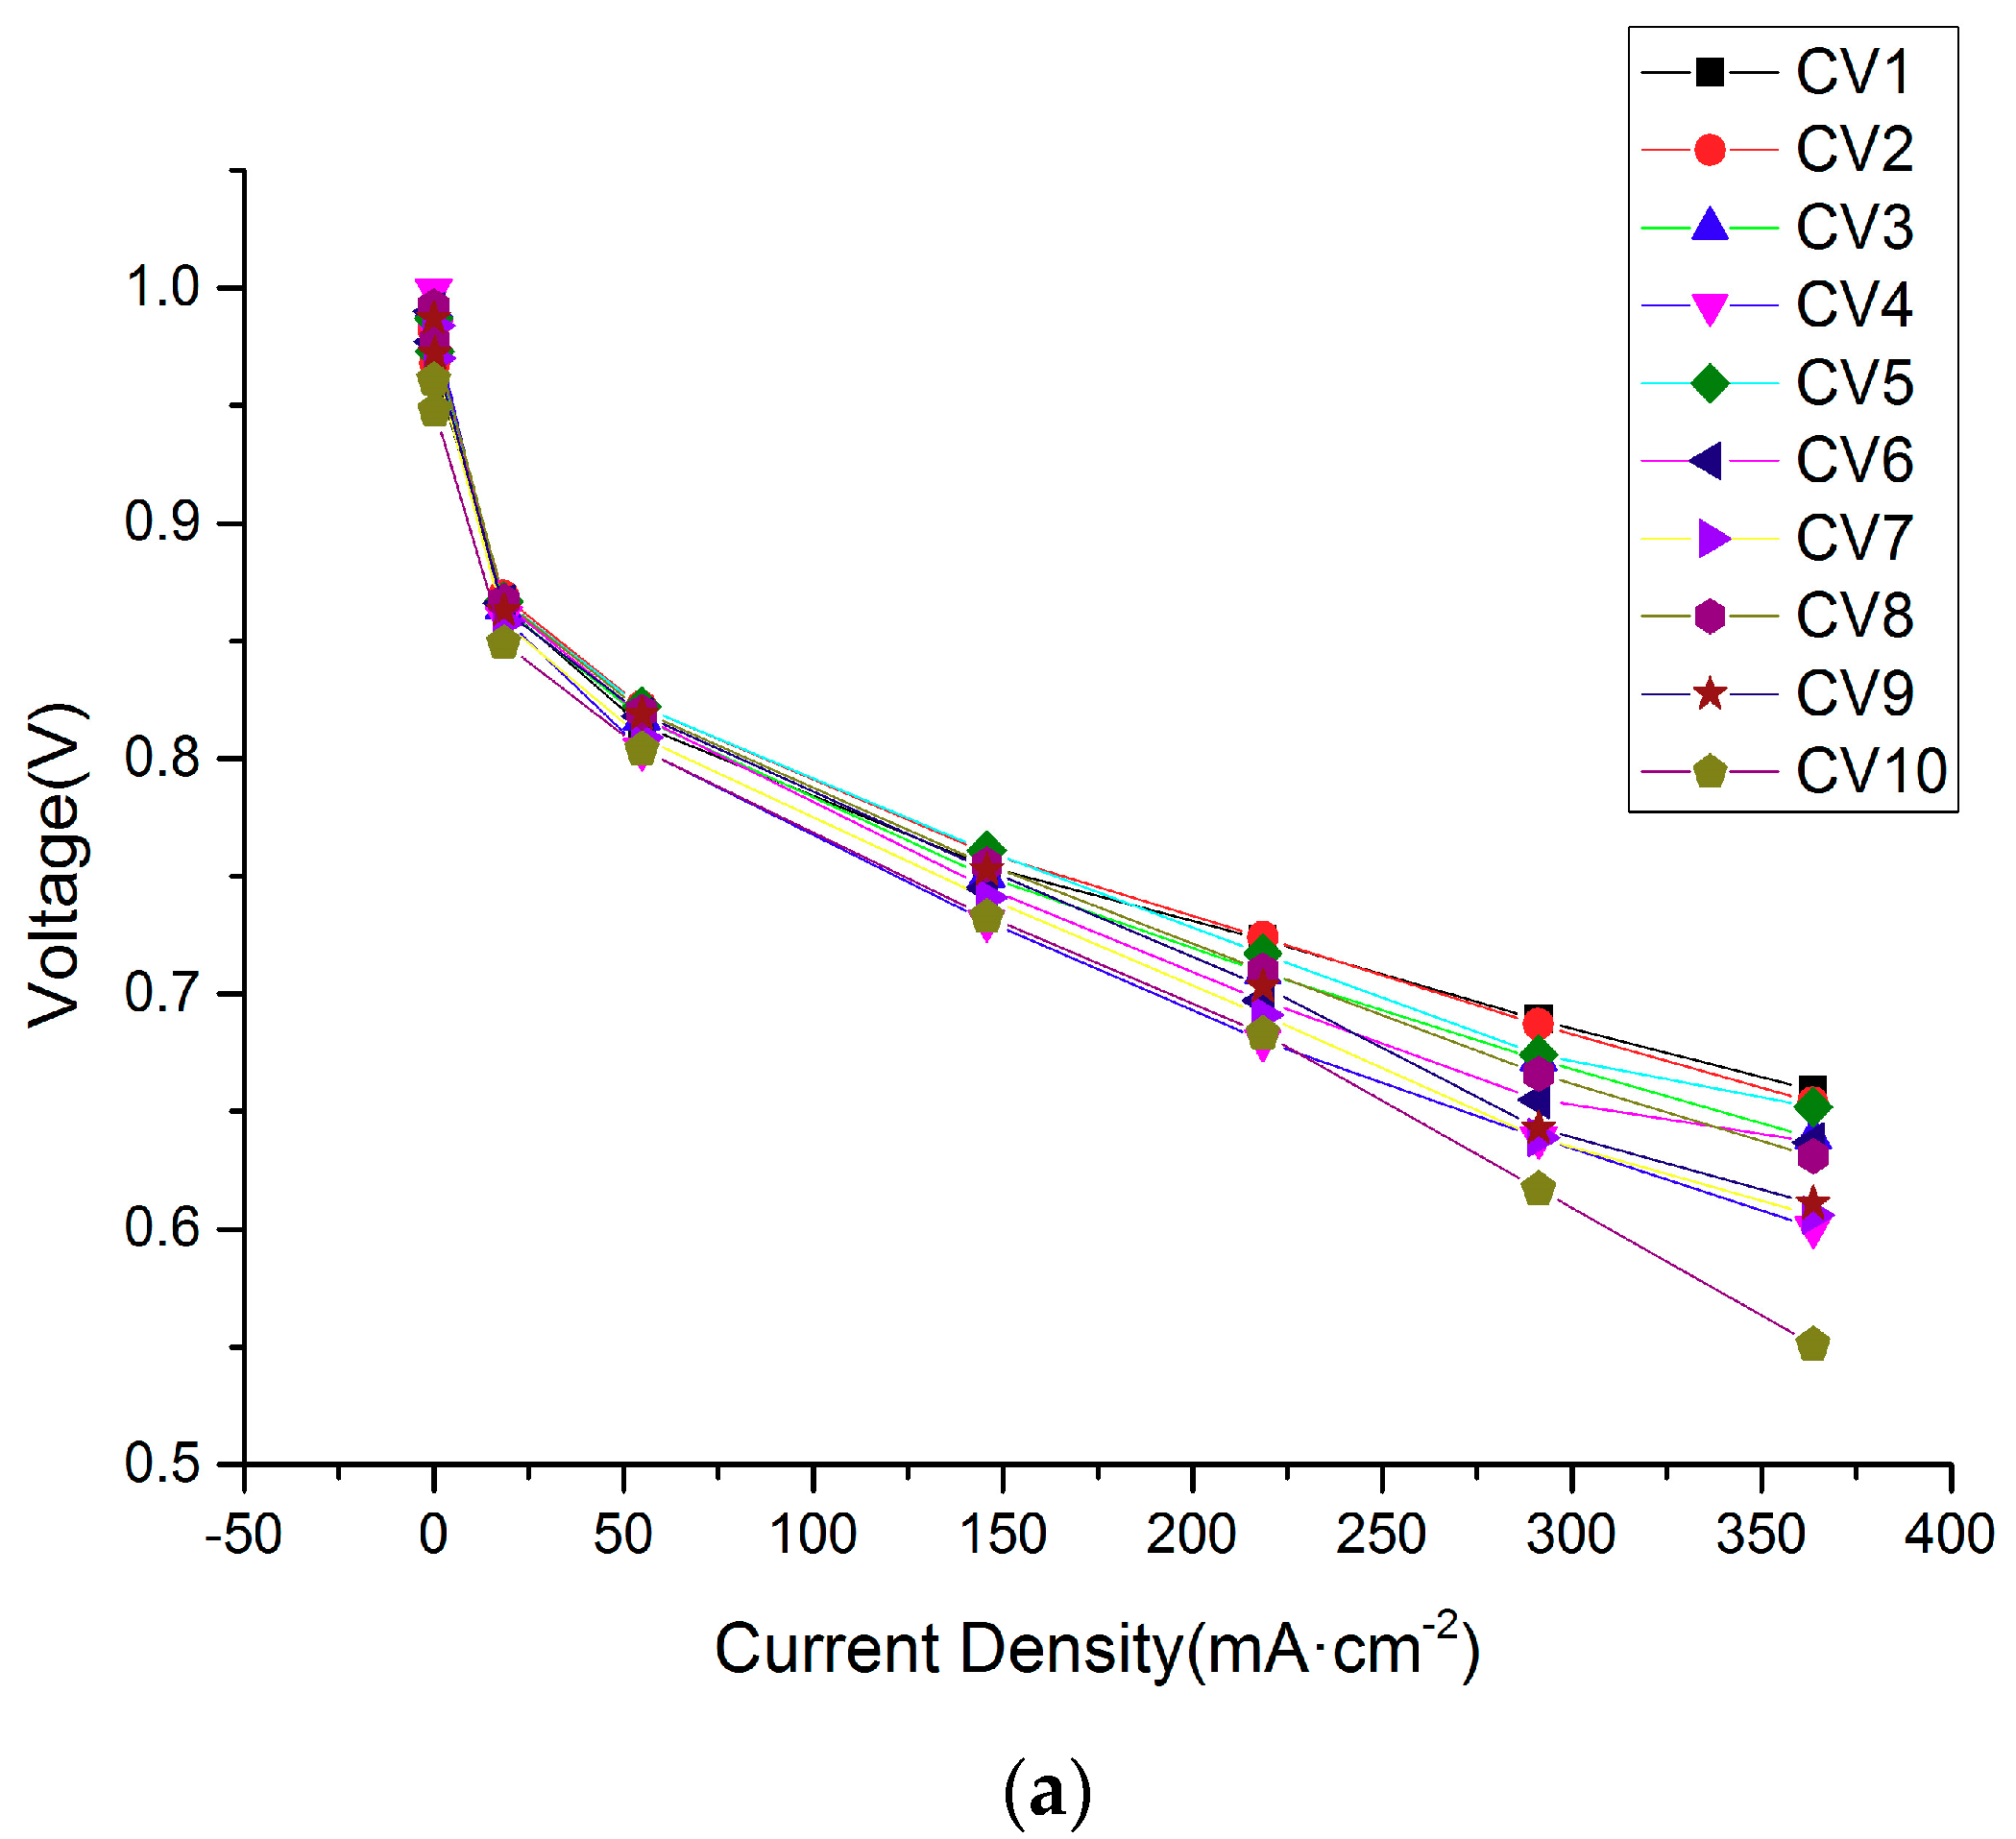
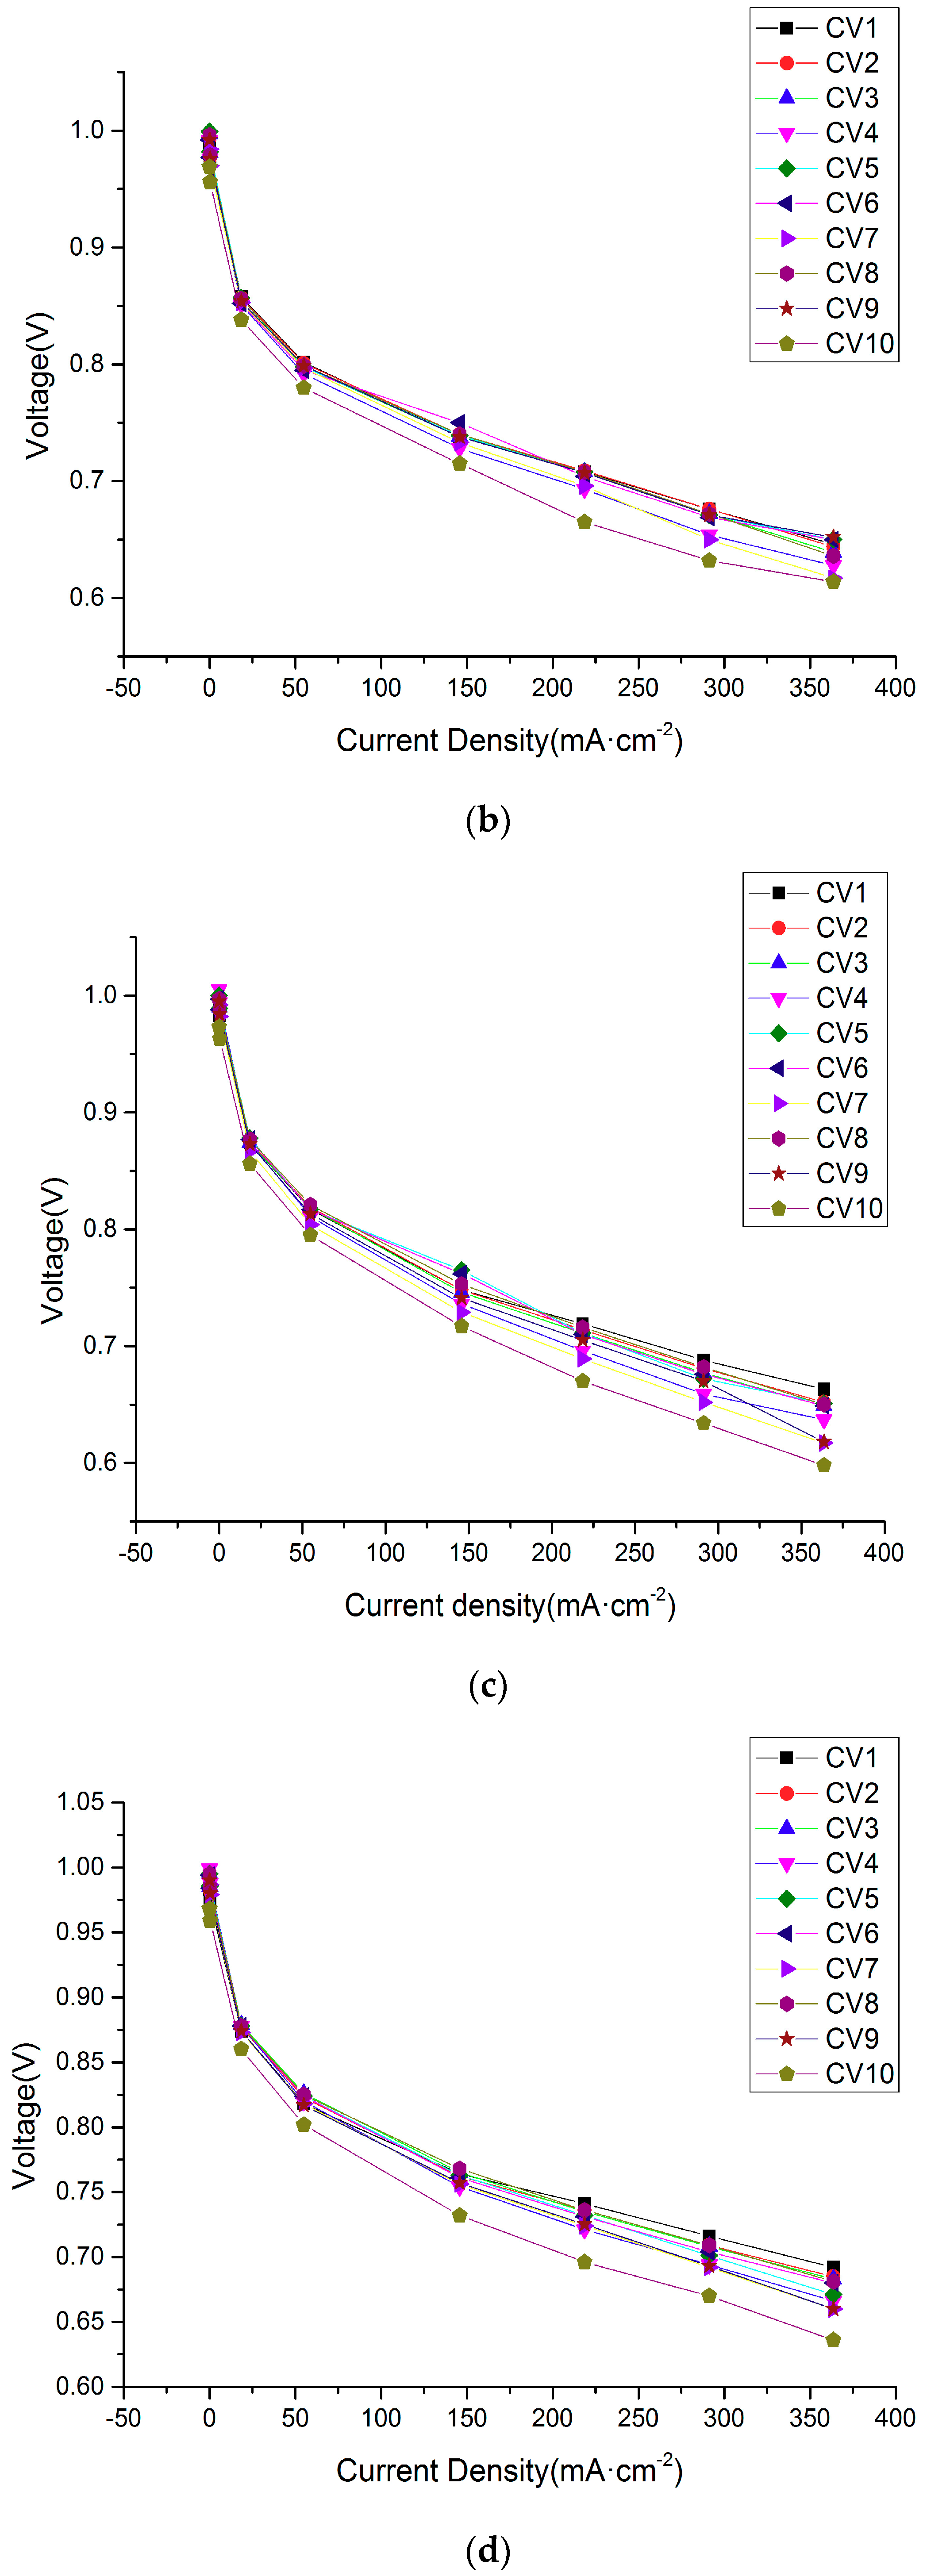
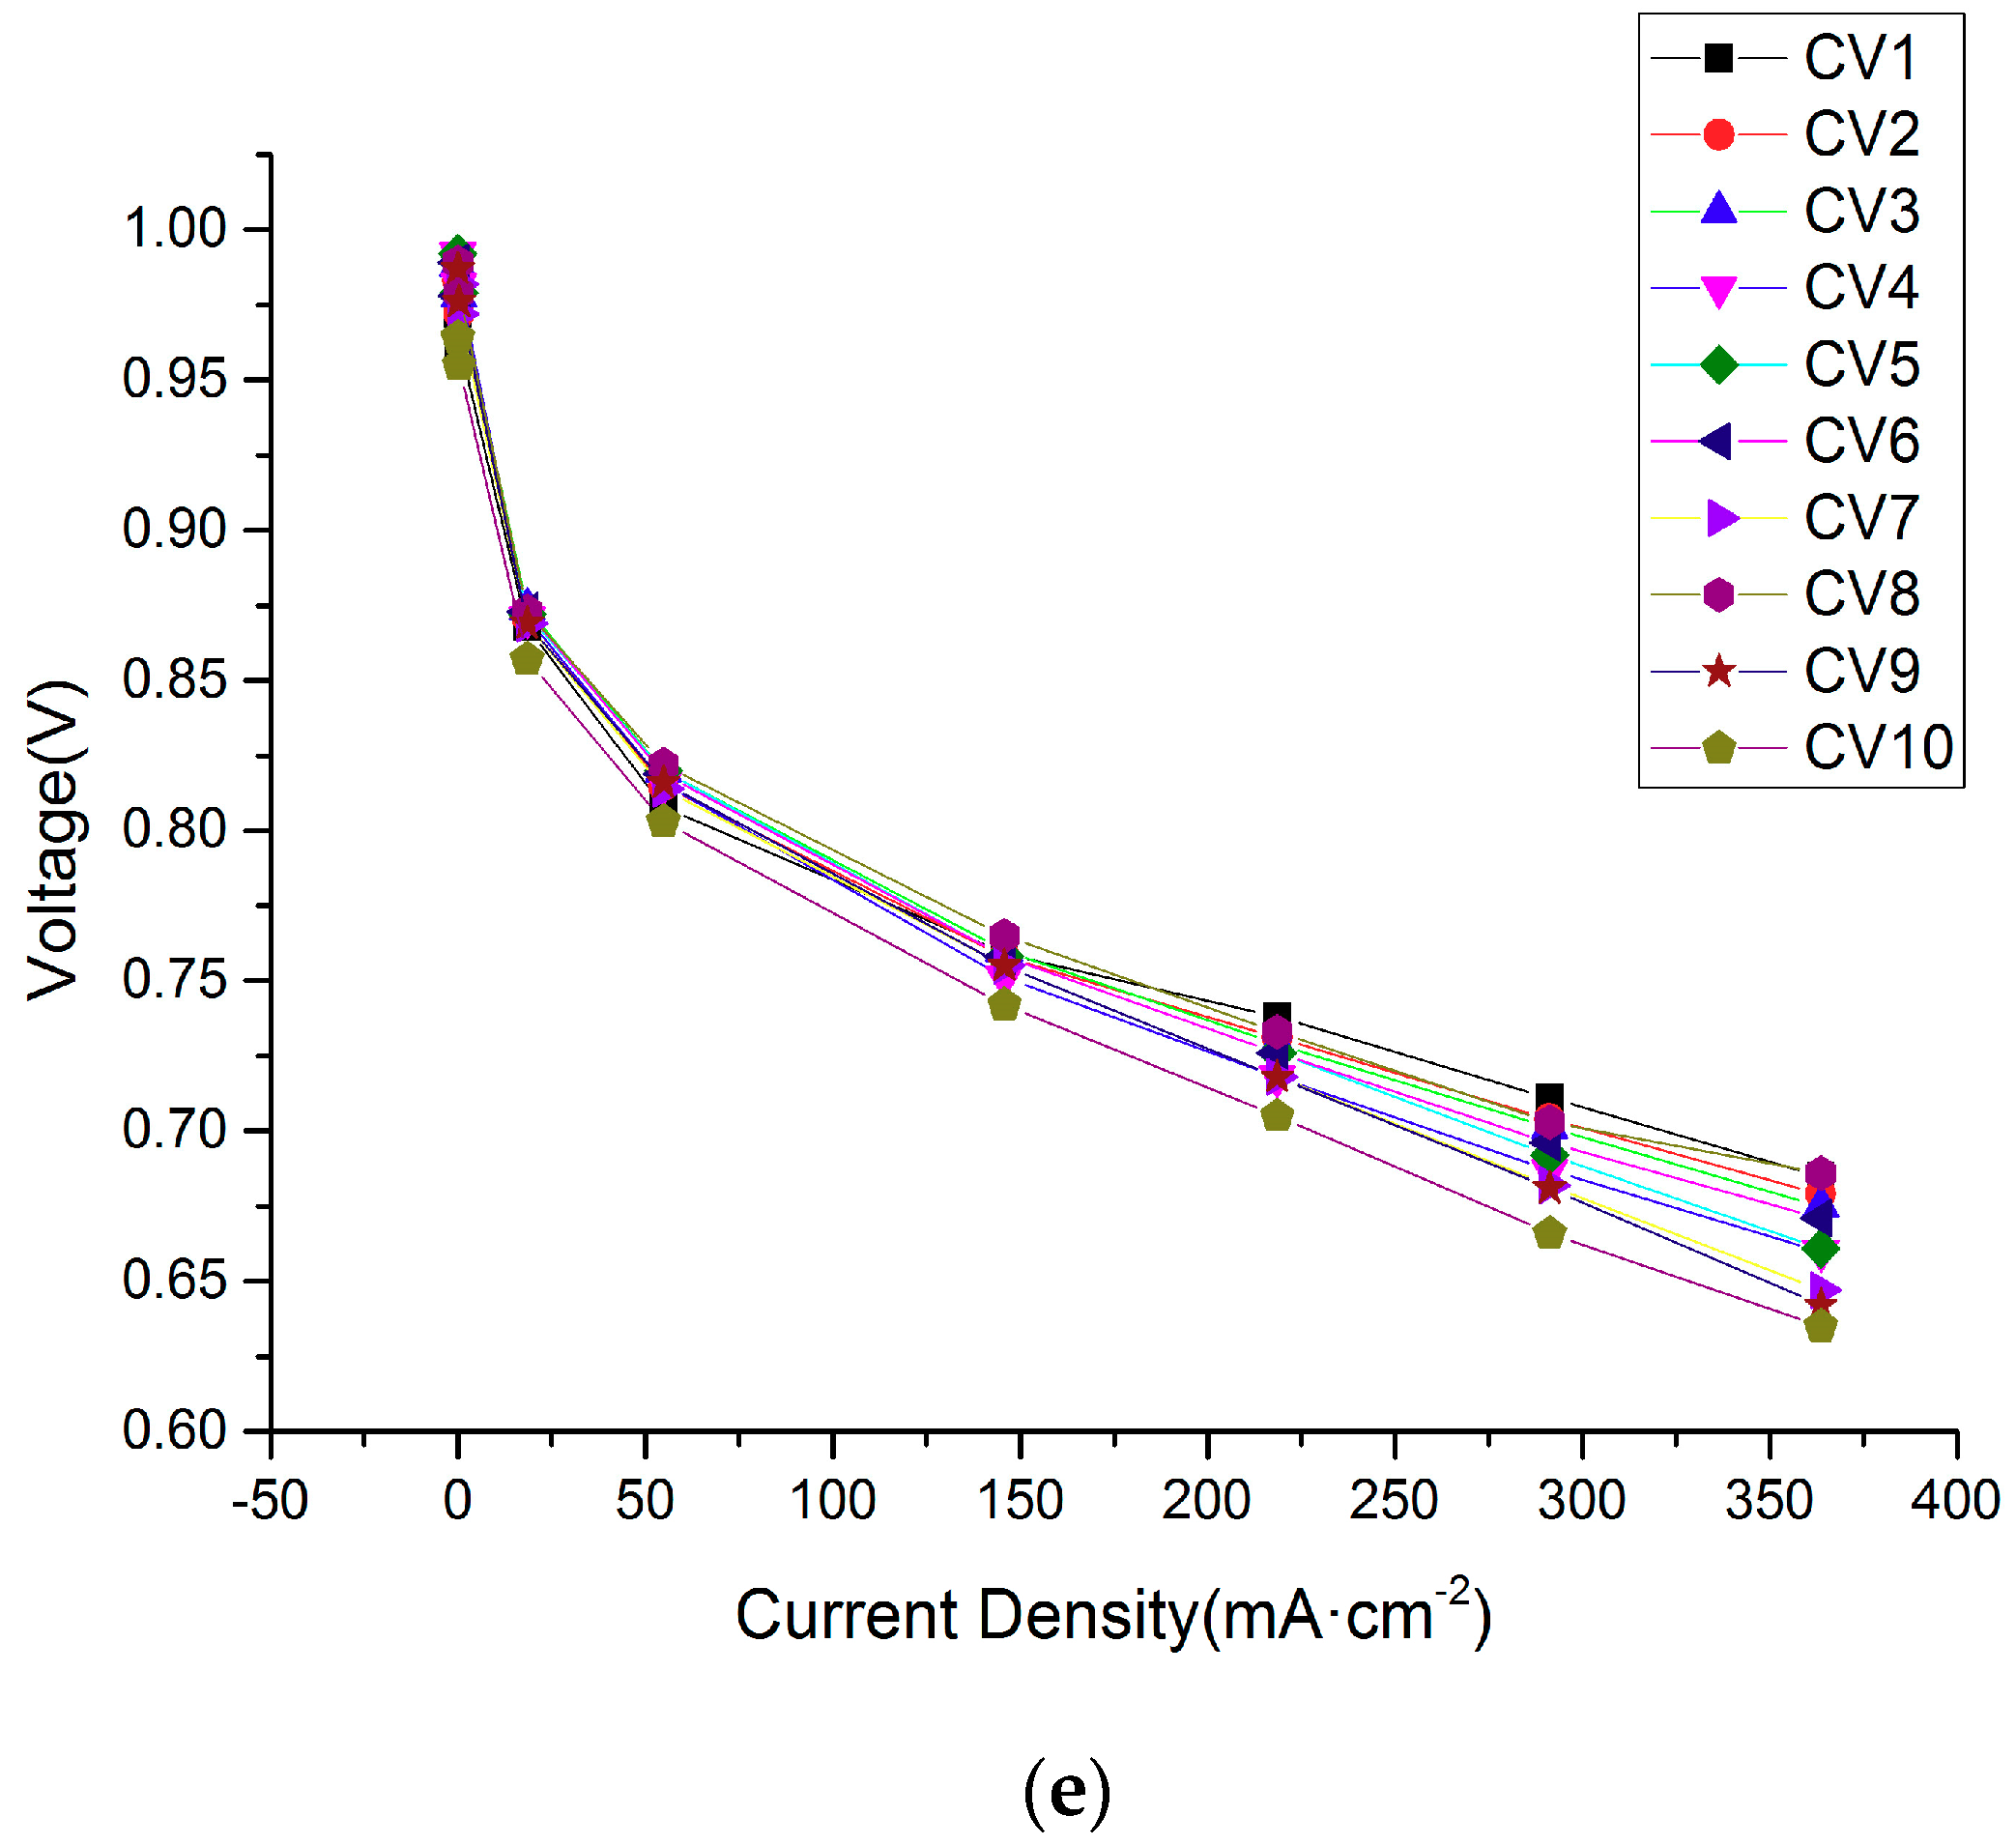
Figure 5 presents the polarization curves with 10 cells for an operating temperature of 70 °C, a gas inlet pressure of 0.1 MPa and an elevated anode relative humidity of 40%, 55%, 70%, 85%, and 100%.
Table 2,
Table 3,
Table 4,
Table 5 and
Table 6 show the dynamic performance at different relative humidity about the voltage drop. It can be found that the voltage was in the range of 0.551 V~0.973 V, while the current density was 0~360 mA/cm
2. Moreover, the maximum voltage appeared on single cells in different locations in the stack, because of different current densities. Around 0 current density, the maximum voltage appeared at C4 or C5, which was in the middle of stack. Oppositely, for a maximum current density of 360 mA/cm
2, the maximum voltage almost focused on a single cell of the gas inlet inside, due to a lower flow rate and the accumulation of gas. Jang et al. [
33] also came to similar conclusions. They revealed that the cell performance on both sides of the stack was slightly better than that of the center cell. Additionally, the voltage differences between the single cells increased as the current density increased, because this was related to the increase of the reaction rate. The water flooding phenomenon did not occur because the experimental maximum current density almost did not reach the concentration polarization area.
As shown in
Figure 5a and
Table 2, the maximum voltage difference was 0.108 V between C1 and C10 at a current density of 360 mA/cm
2. The maximum voltage differences generated in
Figure 5b–e were between two cells, which were C1 and C10, the same as
Figure 5a, which respectively were 0.044 V, 0.065 V, 0.056 V, and 0.05 V at a current density of 360 mA/cm
2. It was obvious that the voltage differences between the cells gradually decreased as the relative humidity increased, resulting from the increase of ionic conductivity and resistance reduction [
26]. It also could be observed that C10 voltage was the lowest, and its performance was the poorest for different current densities and relative humidity. This may be because the amount of gas reaching C10 was relatively small, and the reaction rate was low, due to the pressure drop.
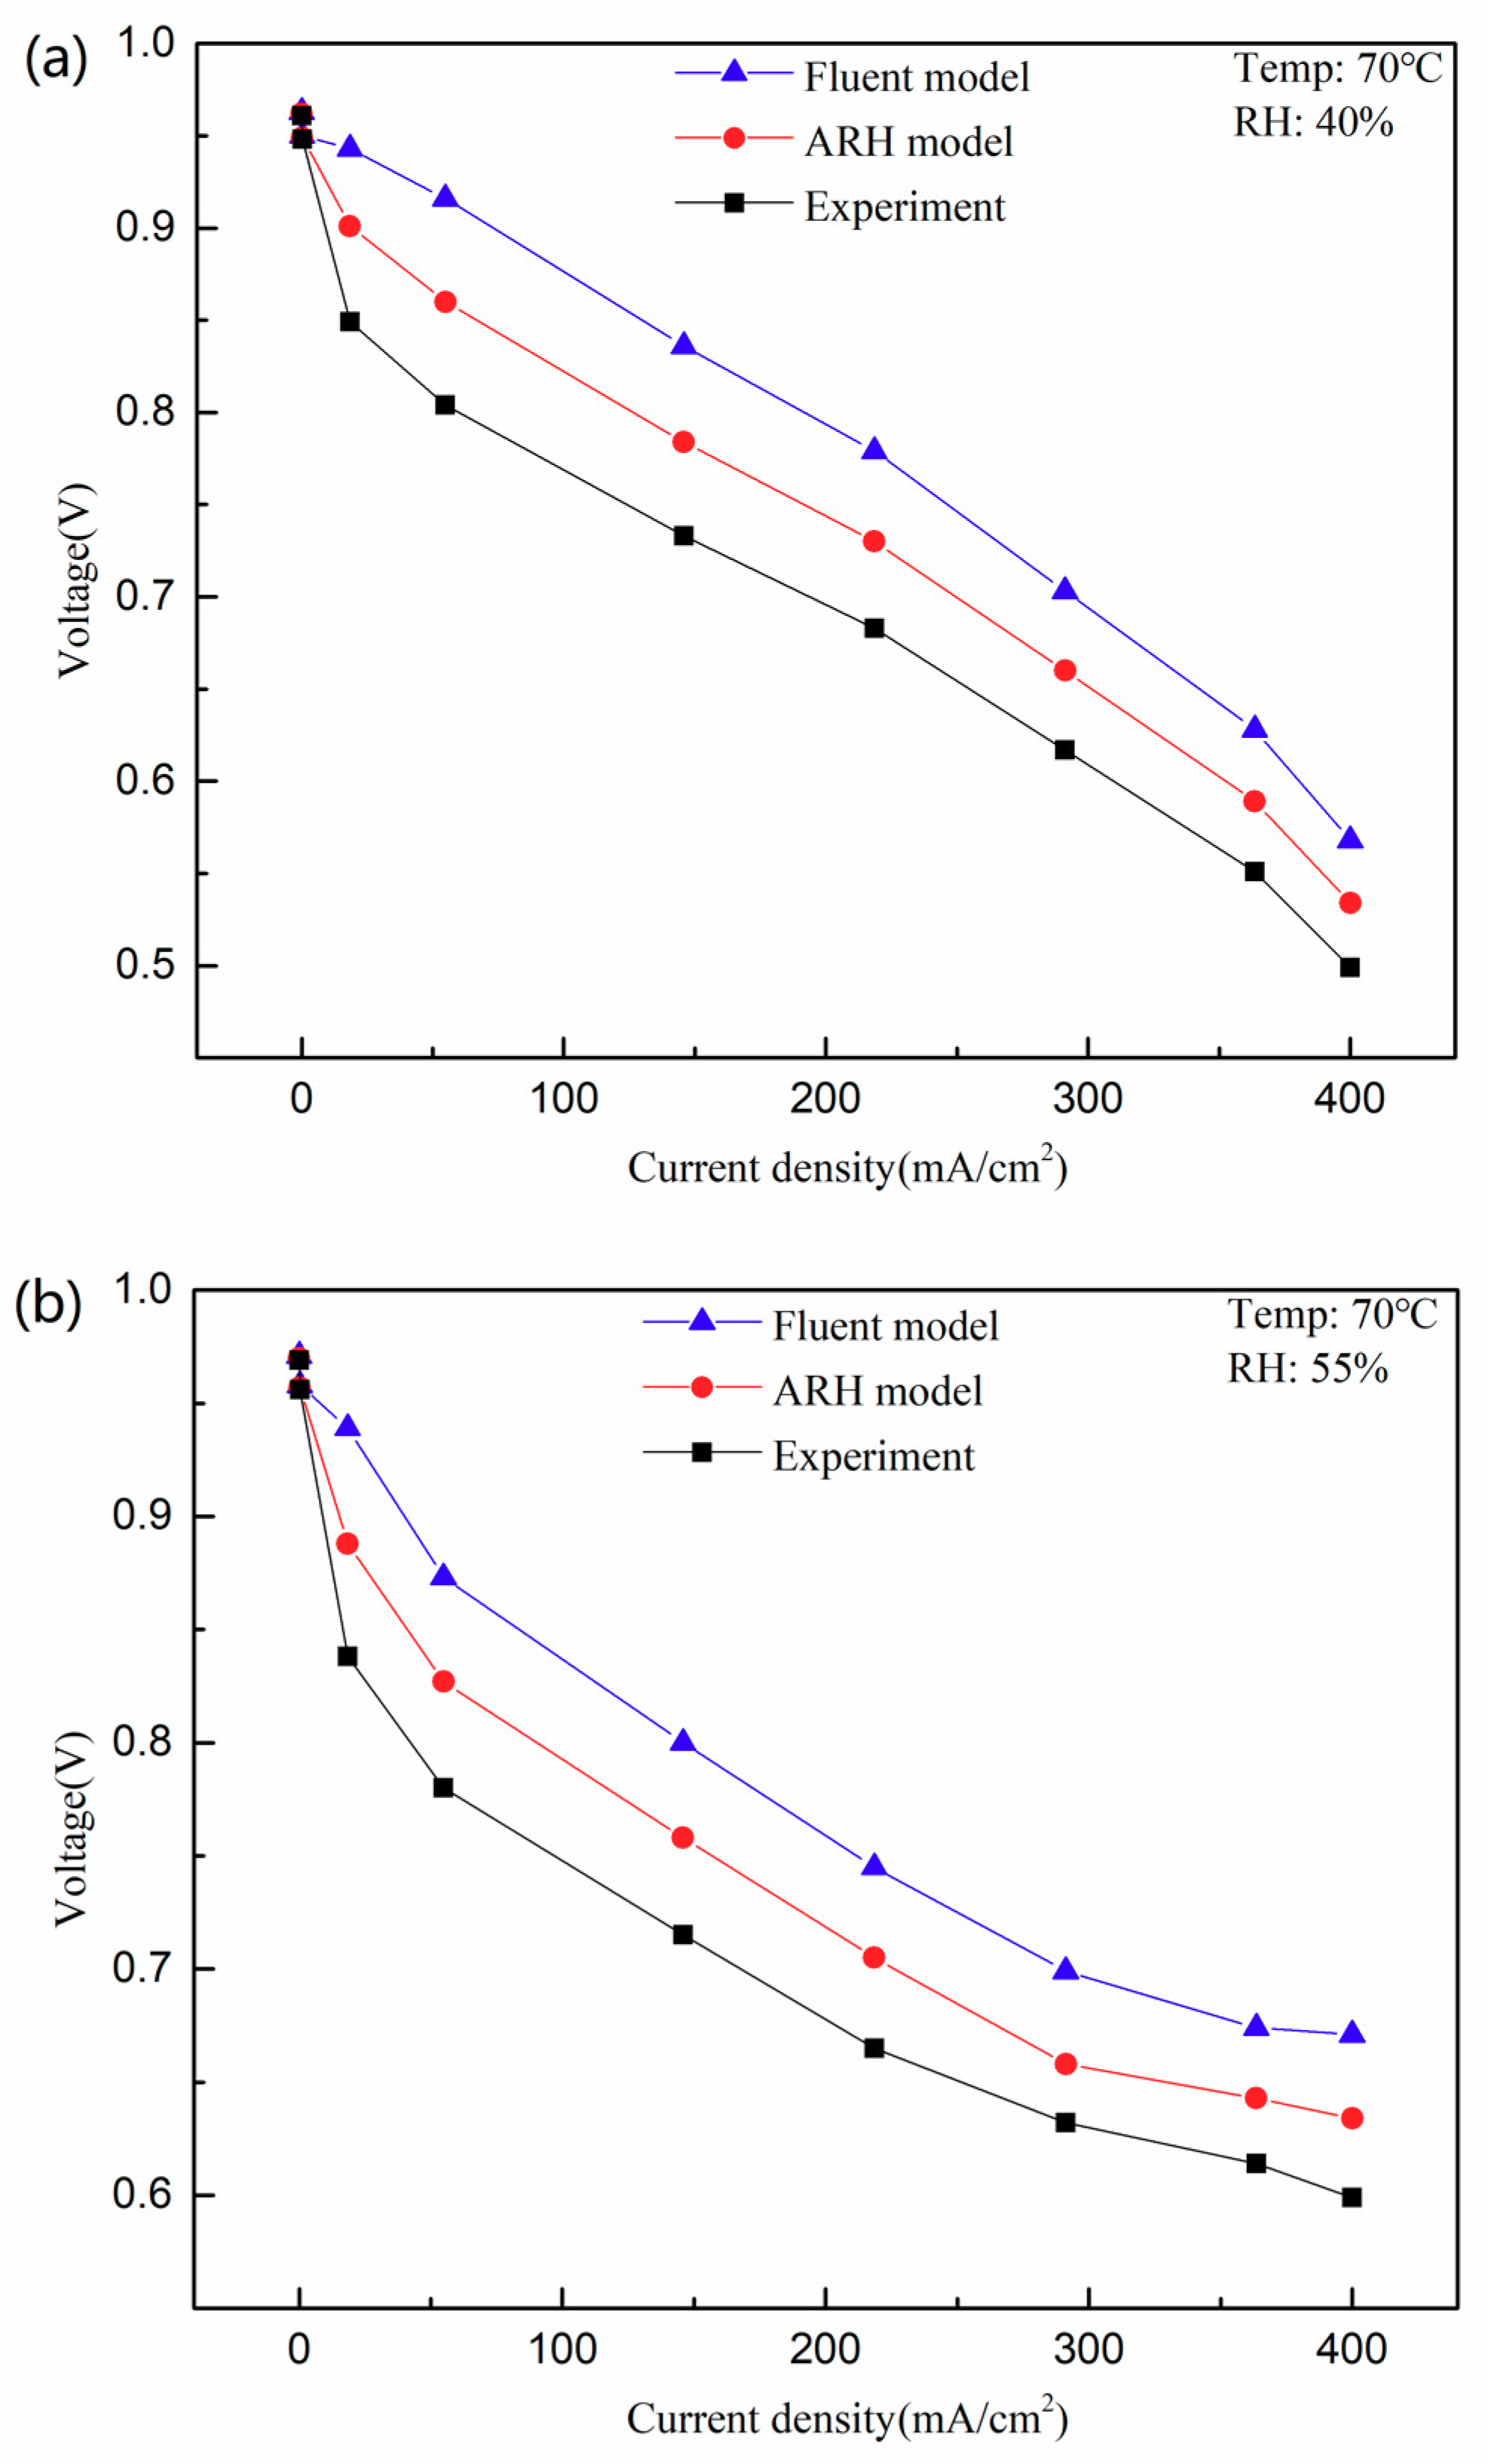
4.2. The Fastest Power Attenuation Single Cell
Based on the above series of experimental data, an important conclusion is that C10 is a single cell with the poorest performance in the stack being obtained. The ARH model was applied to the C10 calculation to compare among the Fluent model results and experiment results, and to prove its reliability. In order to more clearly express the cell performance, polarization curves, and power density curves about the ARH model, the Fluent model and experiment are shown in
Figure 6 under these conditions of working temperature, 70 °C, and different anode relative humidities. It could be found that the voltage and power density changing tendencies had a good agreement. However, there existed obvious voltage differences and power density differences between the experiment data and the simulation results for different relative humidities.
The C10 polarization curves and power density curves are shown in
Figure 6a under a relative humidity of 40%. It can be observed that the voltage was in the range of 0.5~1.0 V when the current density varied from 0 to 400 mA·cm
−2. There was a maximum voltage for the experiment data and the simulation model results when the current density was around 0, because the electrochemical reaction rate was low, due to a lower gas inlet flow rate. The voltage differences between the experimental data and the simulation model data increased first, and then they gradually decreased as the current density increased. The maximum voltage difference appeared at around the current density of 50 mA·cm
−2. This is because the activation loss enhancement is related to the proton transfer rate and voltage reduction. The current density and reaction rate improvement causes an activation loss enhancement [
17]. More specifically, the ARH model results were more reliable because they were always closer to the experimental results than the Fluent model results. The error between the ARH model (0.534 V) and the experiment data (0.499 V) was almost 7% at around a current density of 400 mA·cm
−2. This is because the ARH model not only takes into account the pressure drop between the flow channels of the single cells, but it also considers the pressure drop among the single cells in the stack. Also, water saturation improved with the increase of current density, resulting in the adsorption rate and throughput rate of the H
+ rise on the proton exchange membrane. Compared with the research of Li [
34], we concluded that there are almost no concentration regions from the presented power density curves, so that there is no flooding phenomenon.
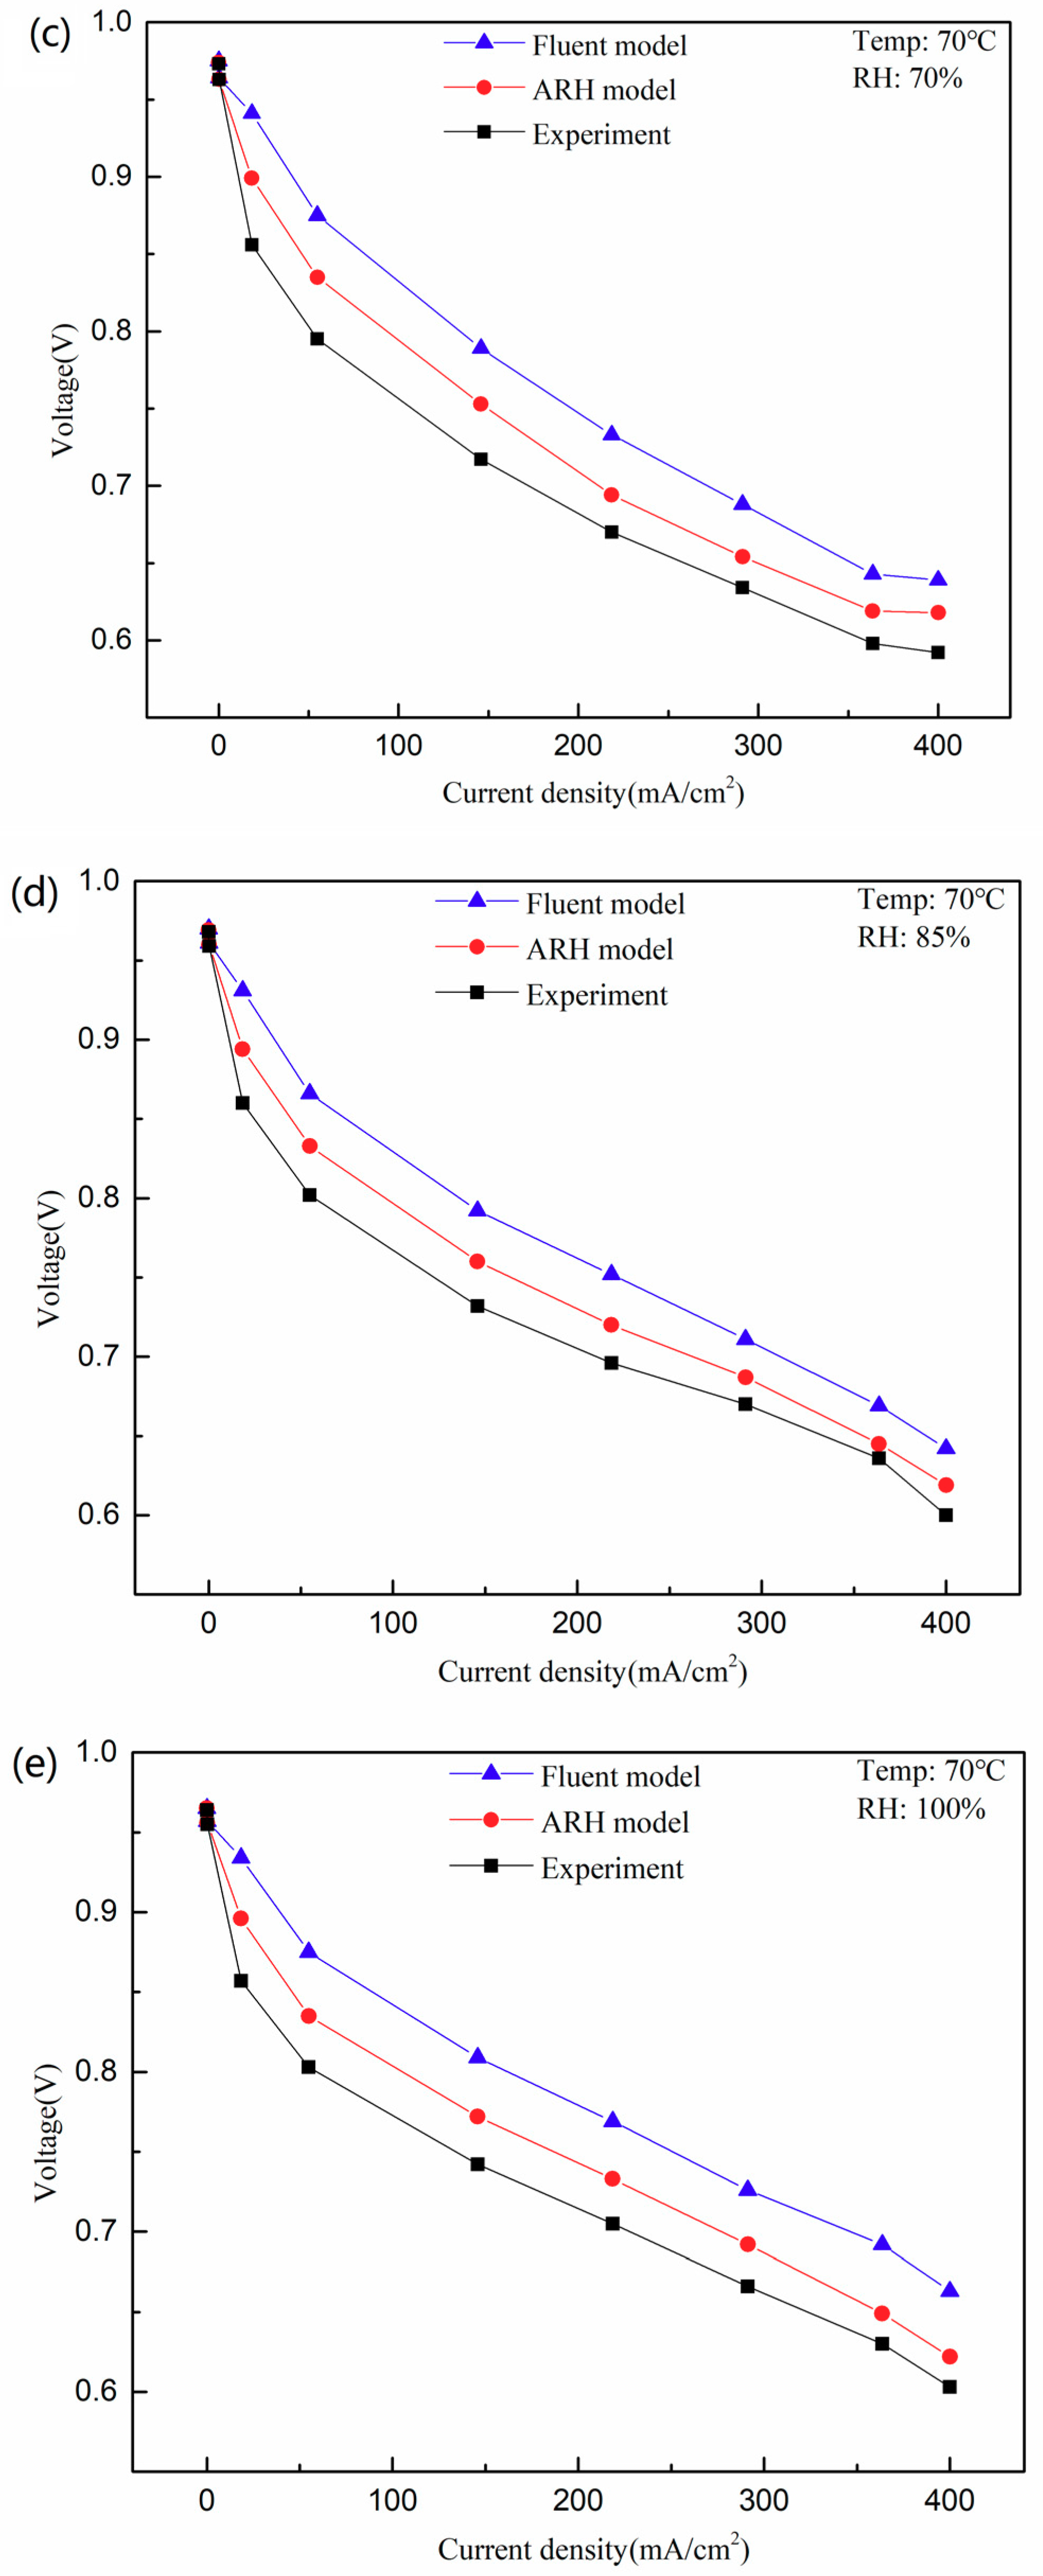
In
Figure 6b, the polarization curves and power density curves for a relative humidity of 55% are shown. Compared against the polarization curves in
Figure 6a, the minimum voltage was from 0.499 V up to 0.599 V. This was relevant to the higher ionic conductivity and lower resistance, and this could be attributed to the higher proton exchange membrane water content and the relative humidity [
35]. The Fluent model results, ARH model results, and experiment results had a similar tendency to those in
Figure 6a, and the curves changed more gently as the current density increased. When the current density was 0, the Fluent model, ARH model, and experiment voltages respectively were 0.972 V, 0.97 V, and 0.969 V and there was no difference, as the gas had not yet begun to react. It can be seen that there was a sharp drop in voltage when the current density was in the range of 0~50 mA·cm
−2. During this stage, the proton exchange membrane water content depended largely on the gas humidification, due to the lower electrochemical reaction. Similarly, the maximum differences of voltage and power density occurred near the current density of 50 mA·cm
−2, and the differences of the voltage and power density between the Fluent model (0.873 V, 43.65 mW·cm
−2) and the experiment (0.78 V, 39 mW·cm
−2) were 0.093 V and 4.65 mW·cm
−2, which were bigger than those (0.047 V, 2.35 mW·cm
−2) between the ARH model (0.827 V, 41.35 mW·cm
−2) and the experiment. It could easily be observed that the ARH model values were closer to the experiment values, to better predict the cell performance. There was a softer drop in voltage when the current density was in the range of 50~400 mA·cm
−2. The water content mainly came from the electrochemical reaction, and it was almost not affected by gas humidification with the increase of the current density. The calculation precision improved for the ARH model, because it considers the saturation pressure based on the pressure drop of the real PEMFC structure, and not the conventional equation.
A proper relative humidity is responsible for improved membrane water content and ion conductivity [
36]. As shown in
Figure 6c, several representative data for a relative humidity 70% are expressed in the polarization curves and power density curves. It could be found that simulation data and experiment data matched well. The voltage and power density differences gradually decreased when the current density was bigger than 50 mA·cm
−2. Especially, the Fluent model data (0.643 V) was the closest to the experiment data (0.598 V) at the current density of 360 mA·cm
−2, and even the voltage error was reduced to 8%, the same as Takalloo [
37] explained. As we expected, the ARH model data (0.619 V) was closer to experiment data compared to the Fluent model data at 360 mA·cm
−2. The water contents of the proton exchange membrane were produced by the electrochemical reaction and gas humidification. Additionally, it was obvious that the voltage and power density differences were smaller than that in
Figure 6a,b. This is because the current density and relative humidity improvement caused the saturation of proton exchange membrane improvement, thus facilitating ion conductivity and reducing the resistance.
As shown in
Figure 6d, the polarization curves and power density curves under the relative humidity 85% are displayed. The simulation data and experiment data showed no significant difference at around the current density of 0. The voltage differences between the simulation data and experiment data gradually increased from 0 to 50 mA·cm
−2, due to the increase of gas humidification and pressure drop. During the low current density region, gas humidification plays a vital role in the water content of the proton exchange membrane. The simulation data were consistent with the experiment data, and their differences were gradually ignored with the increase of the current density (50~400 mA·cm
−2). It can be observed that ARH model result (0.645 V) was closer to experiment data (0.636 V) at around the current density of 360 mA·cm
−2, and even the relative accuracy was increased by 72% compared with the Fluent model result (0.669 V). Since PEMFC operation temperature was relatively high, the ionic conductivity influenced by the high relative humidity was considered. In addition to the operating temperature, saturation pressure in ARH model takes into account the pressure drop, hydrogen inlet pressure, and the structural parameters of the cell. Thus, the ARH model results are more reliable than the Fluent model. Jeon et al. [
19] also confirmed that cell system efficiency improvement depends on the relative humidity rather than the operation temperature. Additionally, the fuel cell is likely to be prone to flooding, due to the high operation temperature and the relative humidity [
38].
There are, respectively, three polarization curves and power density curves with a relative humidity of 100% in
Figure 6e. The simulation results and experiment results in
Figure 6e were similar to the
Figure 6a–d results. There existed a sharp drop in voltage at a current density of 0~50 mA·cm
−2. As a result of a low electrochemical reaction, gas humidification was necessary to ensure water content on the membrane. When the current density was about 360 mA·cm
−2, the Fluent model voltage (0.692 V) increases by 9% more than the experimental voltage (0.635 V), and the ARH model voltage (0.649 V) was closer to the experiment value, and it almost increased by 3% compared to the experiment voltage. The voltage differences decreased as predicted in
Figure 6a–c. However, the voltage differences in
Figure 6e rose again compared to that in
Figure 6d. This is because the proton exchange membrane was likely to be flooded under real experiment due to higher relative humidity, but simulation conditions were affected by pressure drop, whose tendencies were the same as
Figure 6a–d. In addition, Machado et al. [
39] found that relative humidity had a stronger influence on cell performance, especially at a lower voltage range, as the gradient of water activity controlled the adsorption strength.
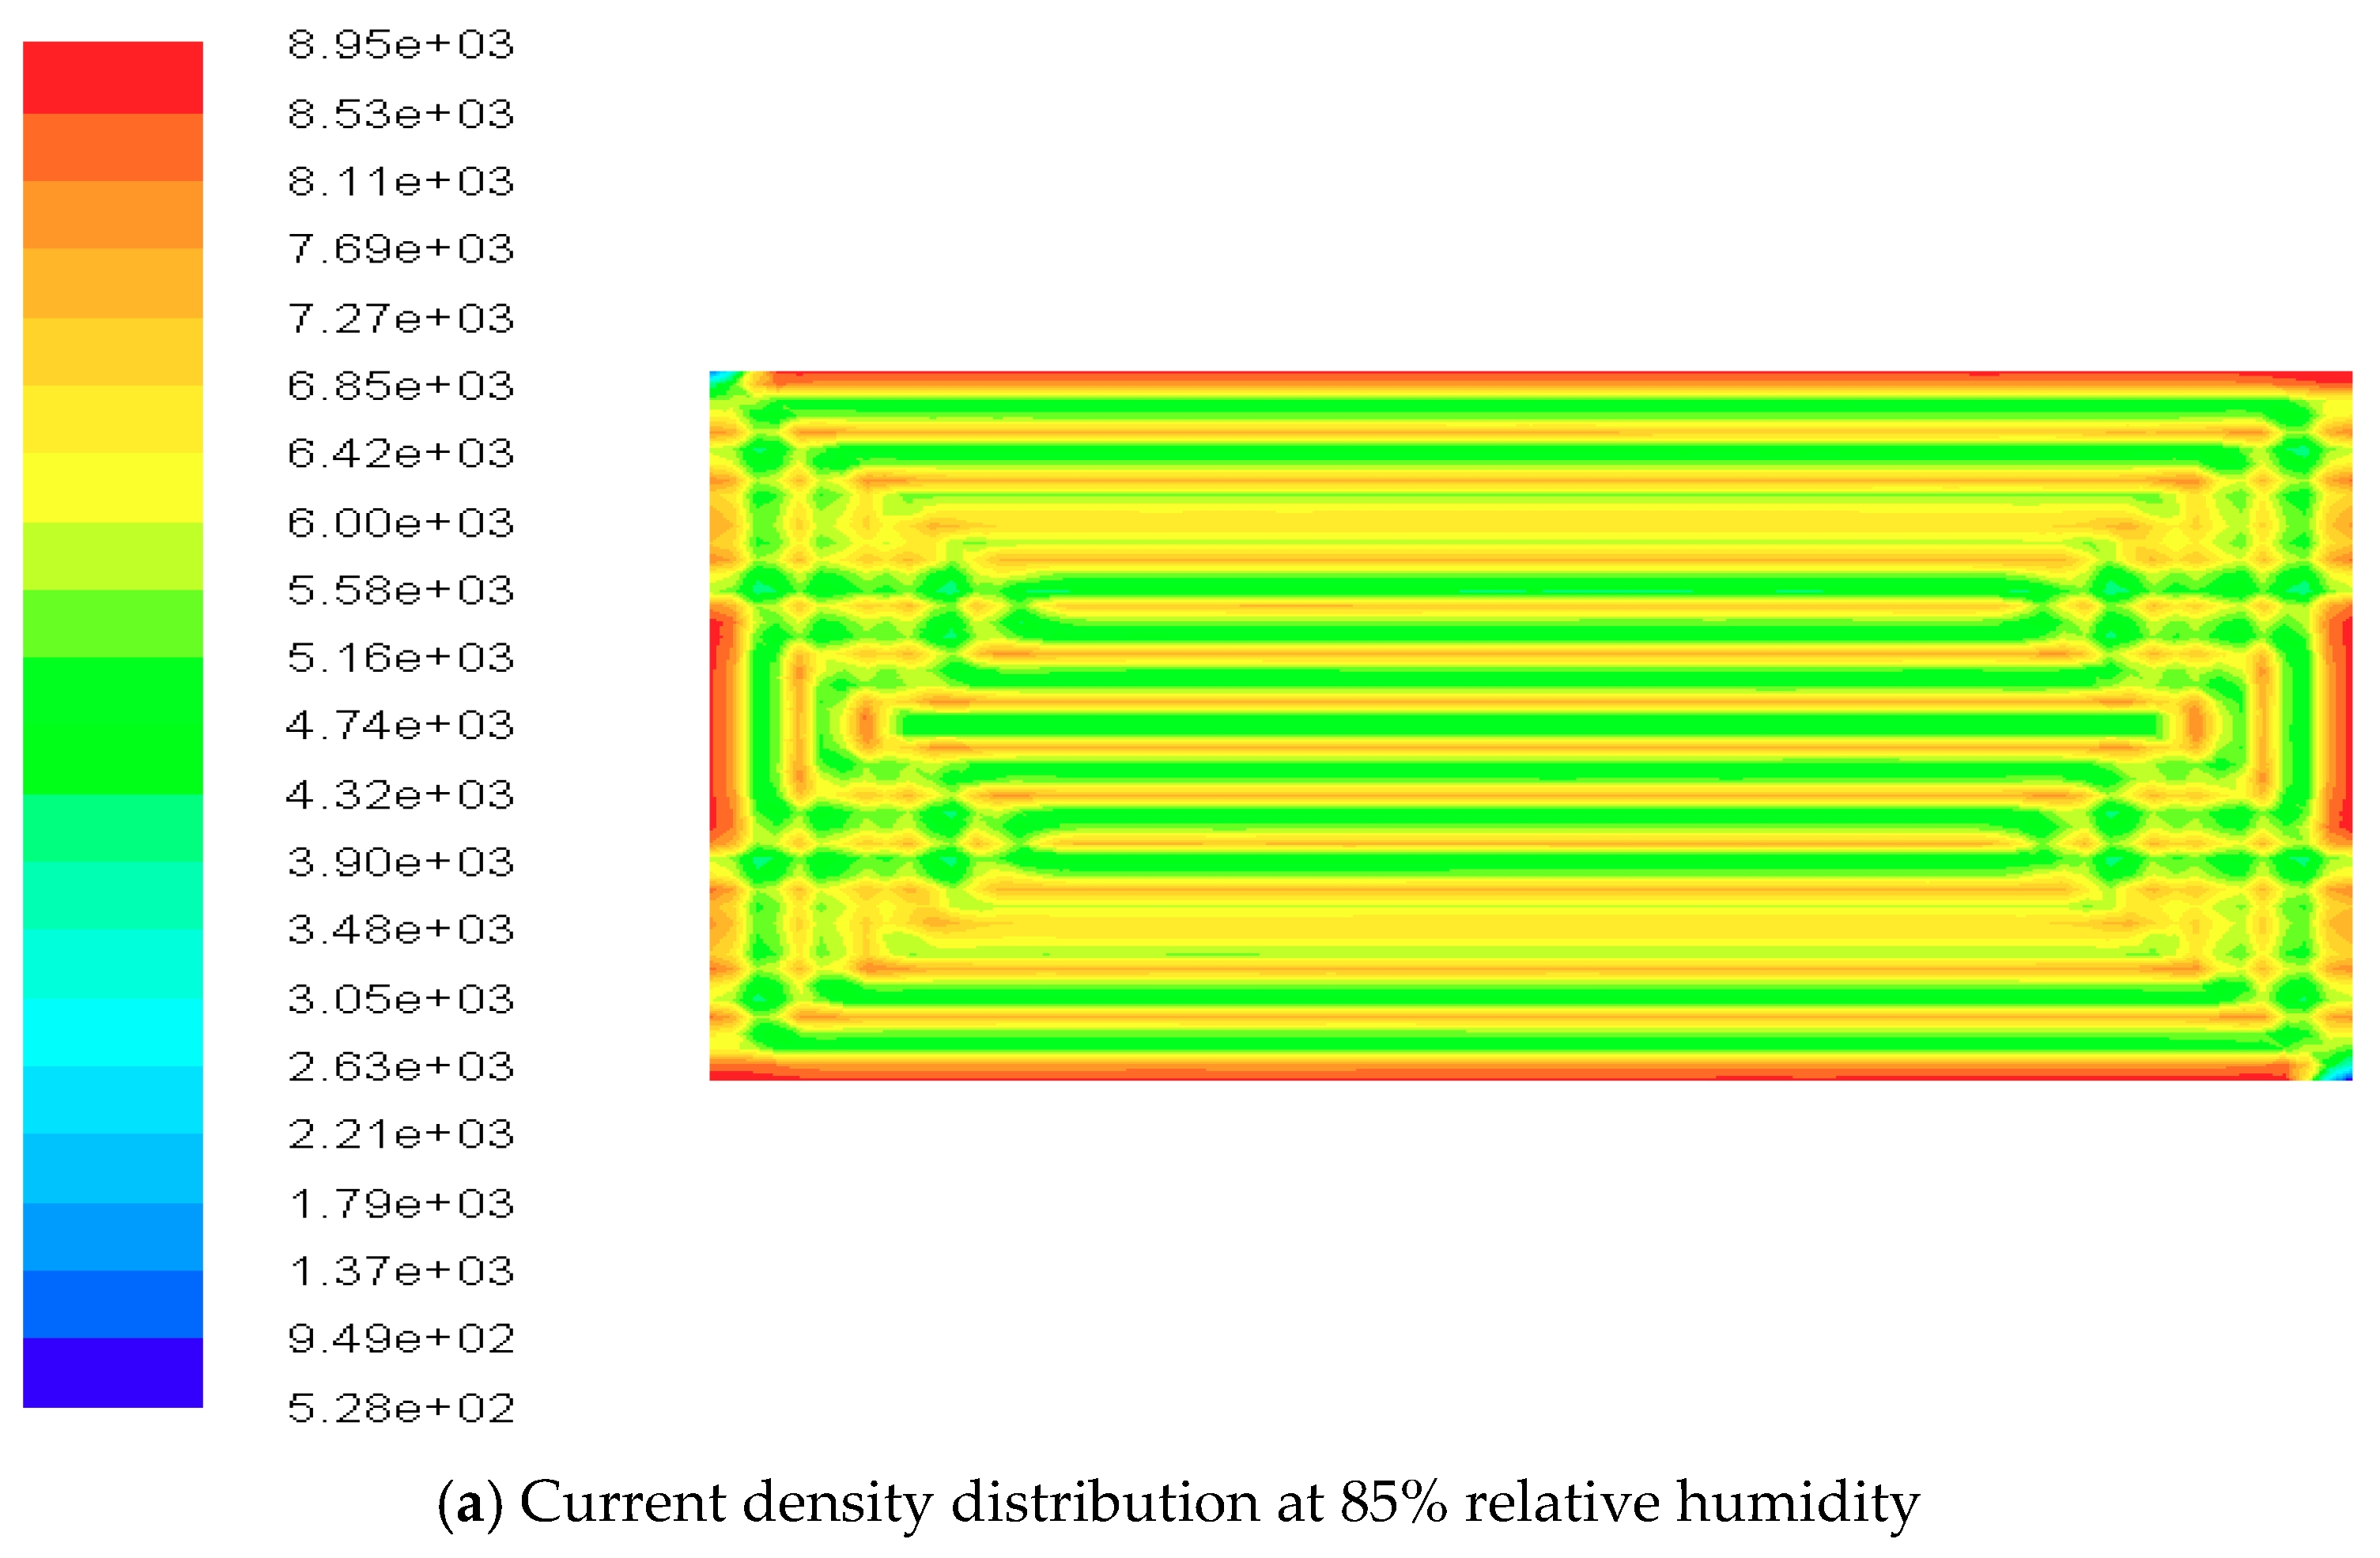
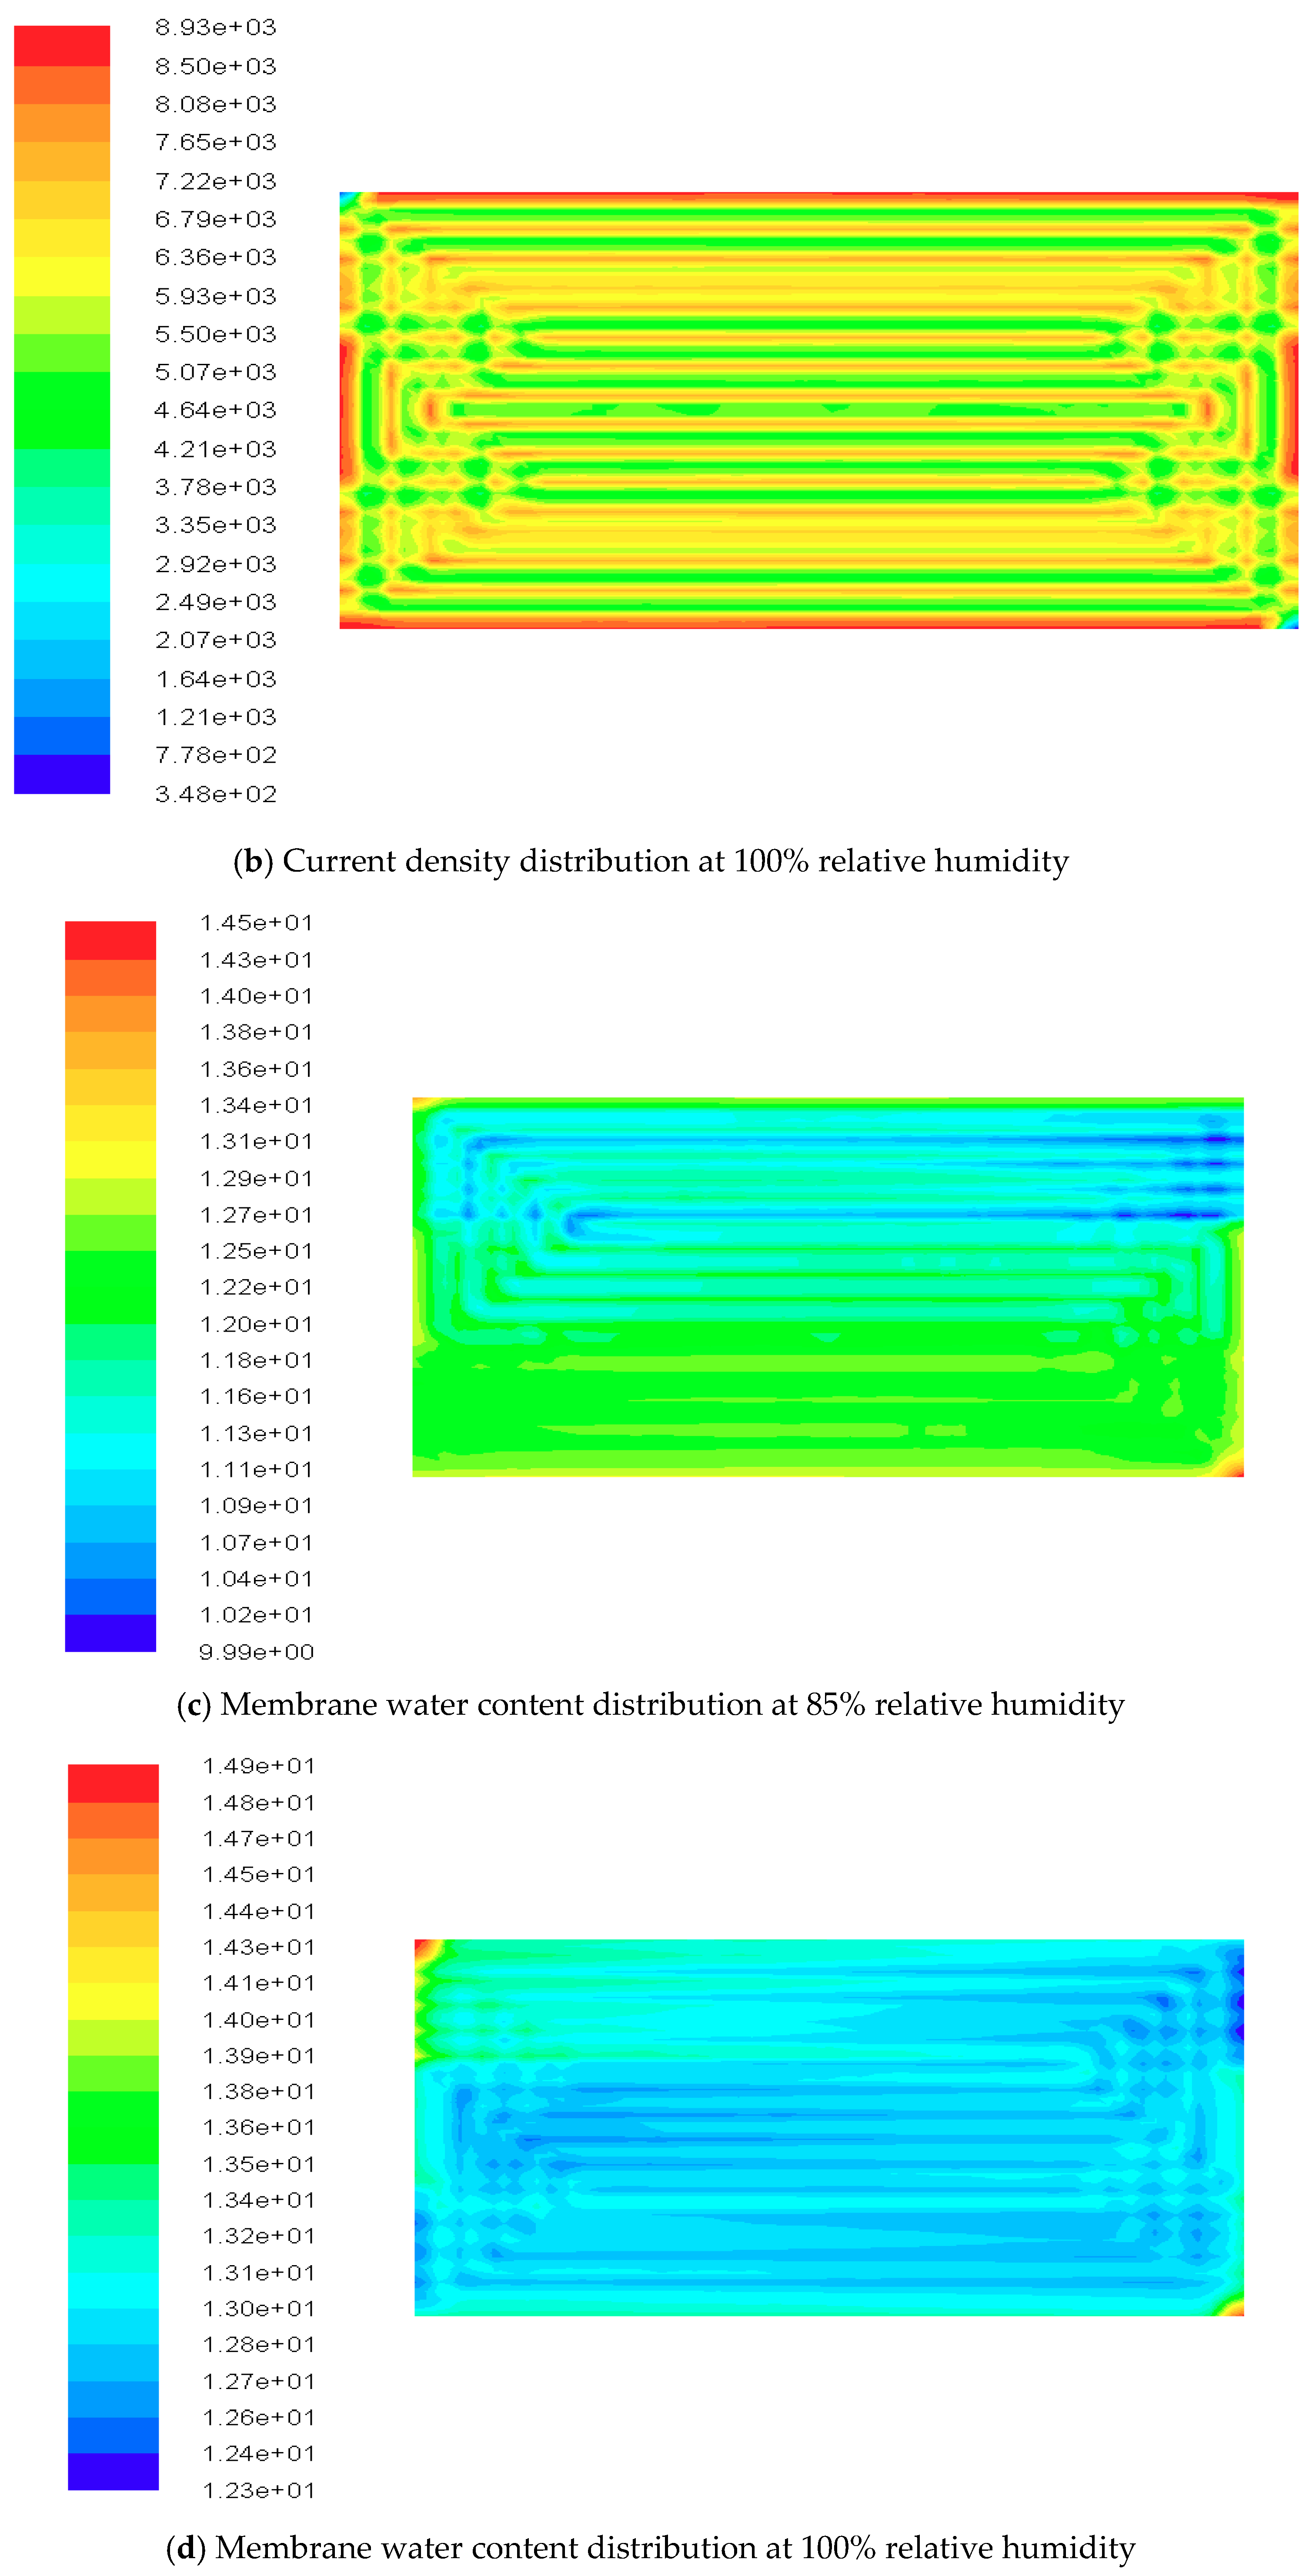
4.3. Contours of Fuel Cell Species Distribution
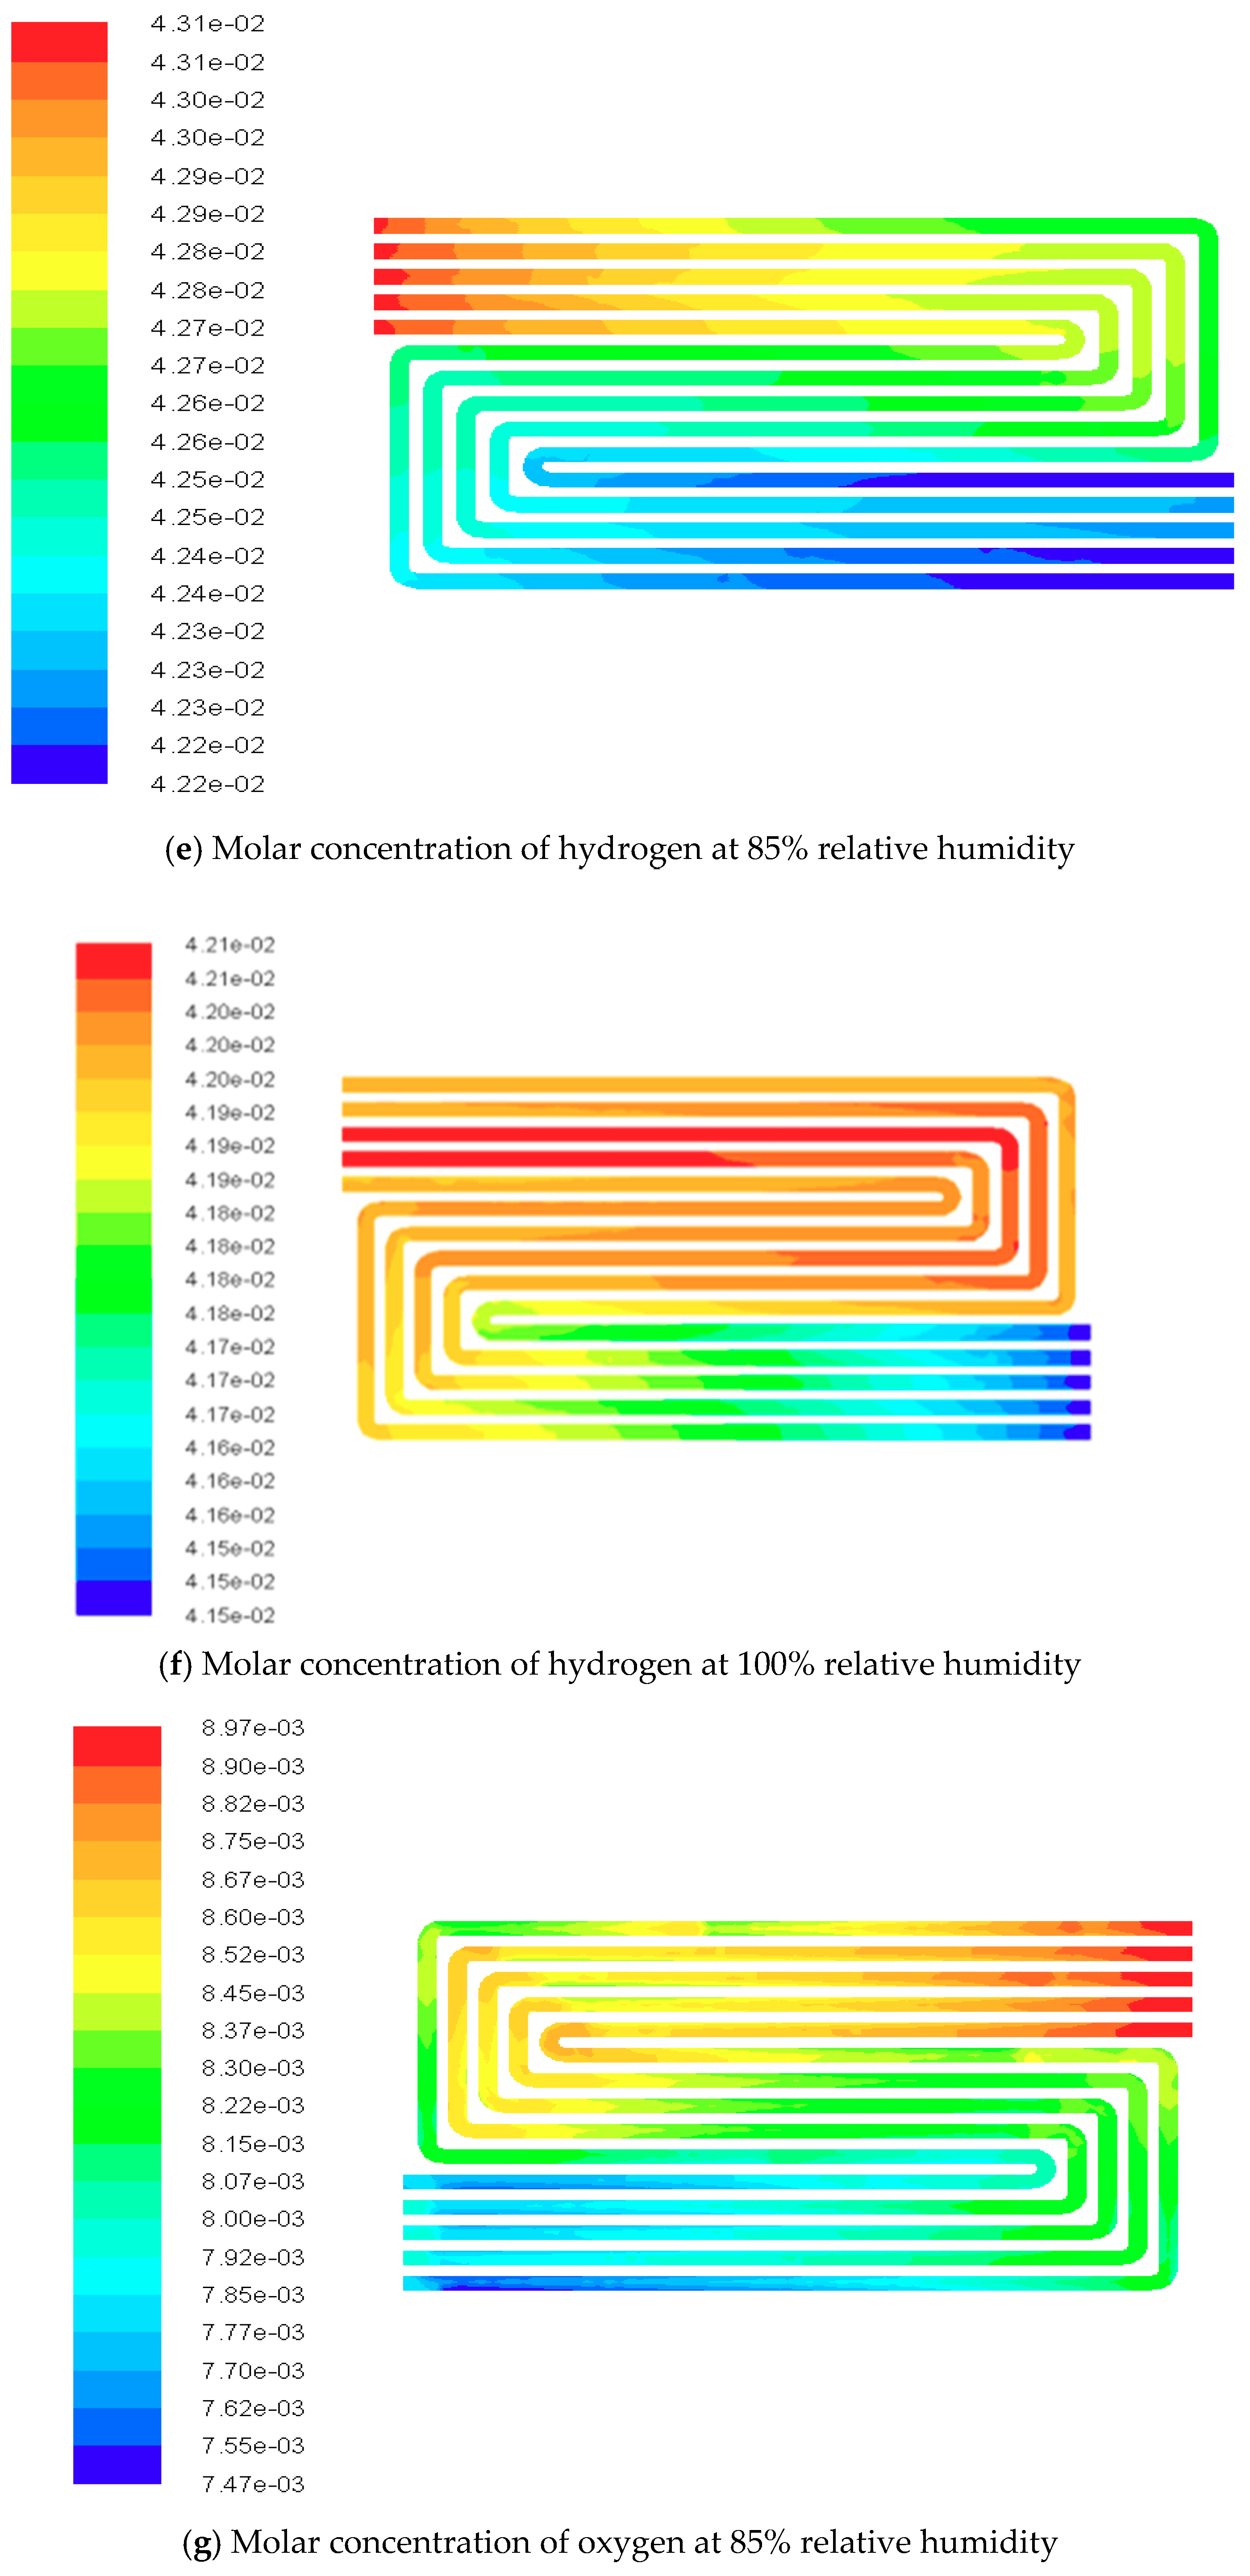
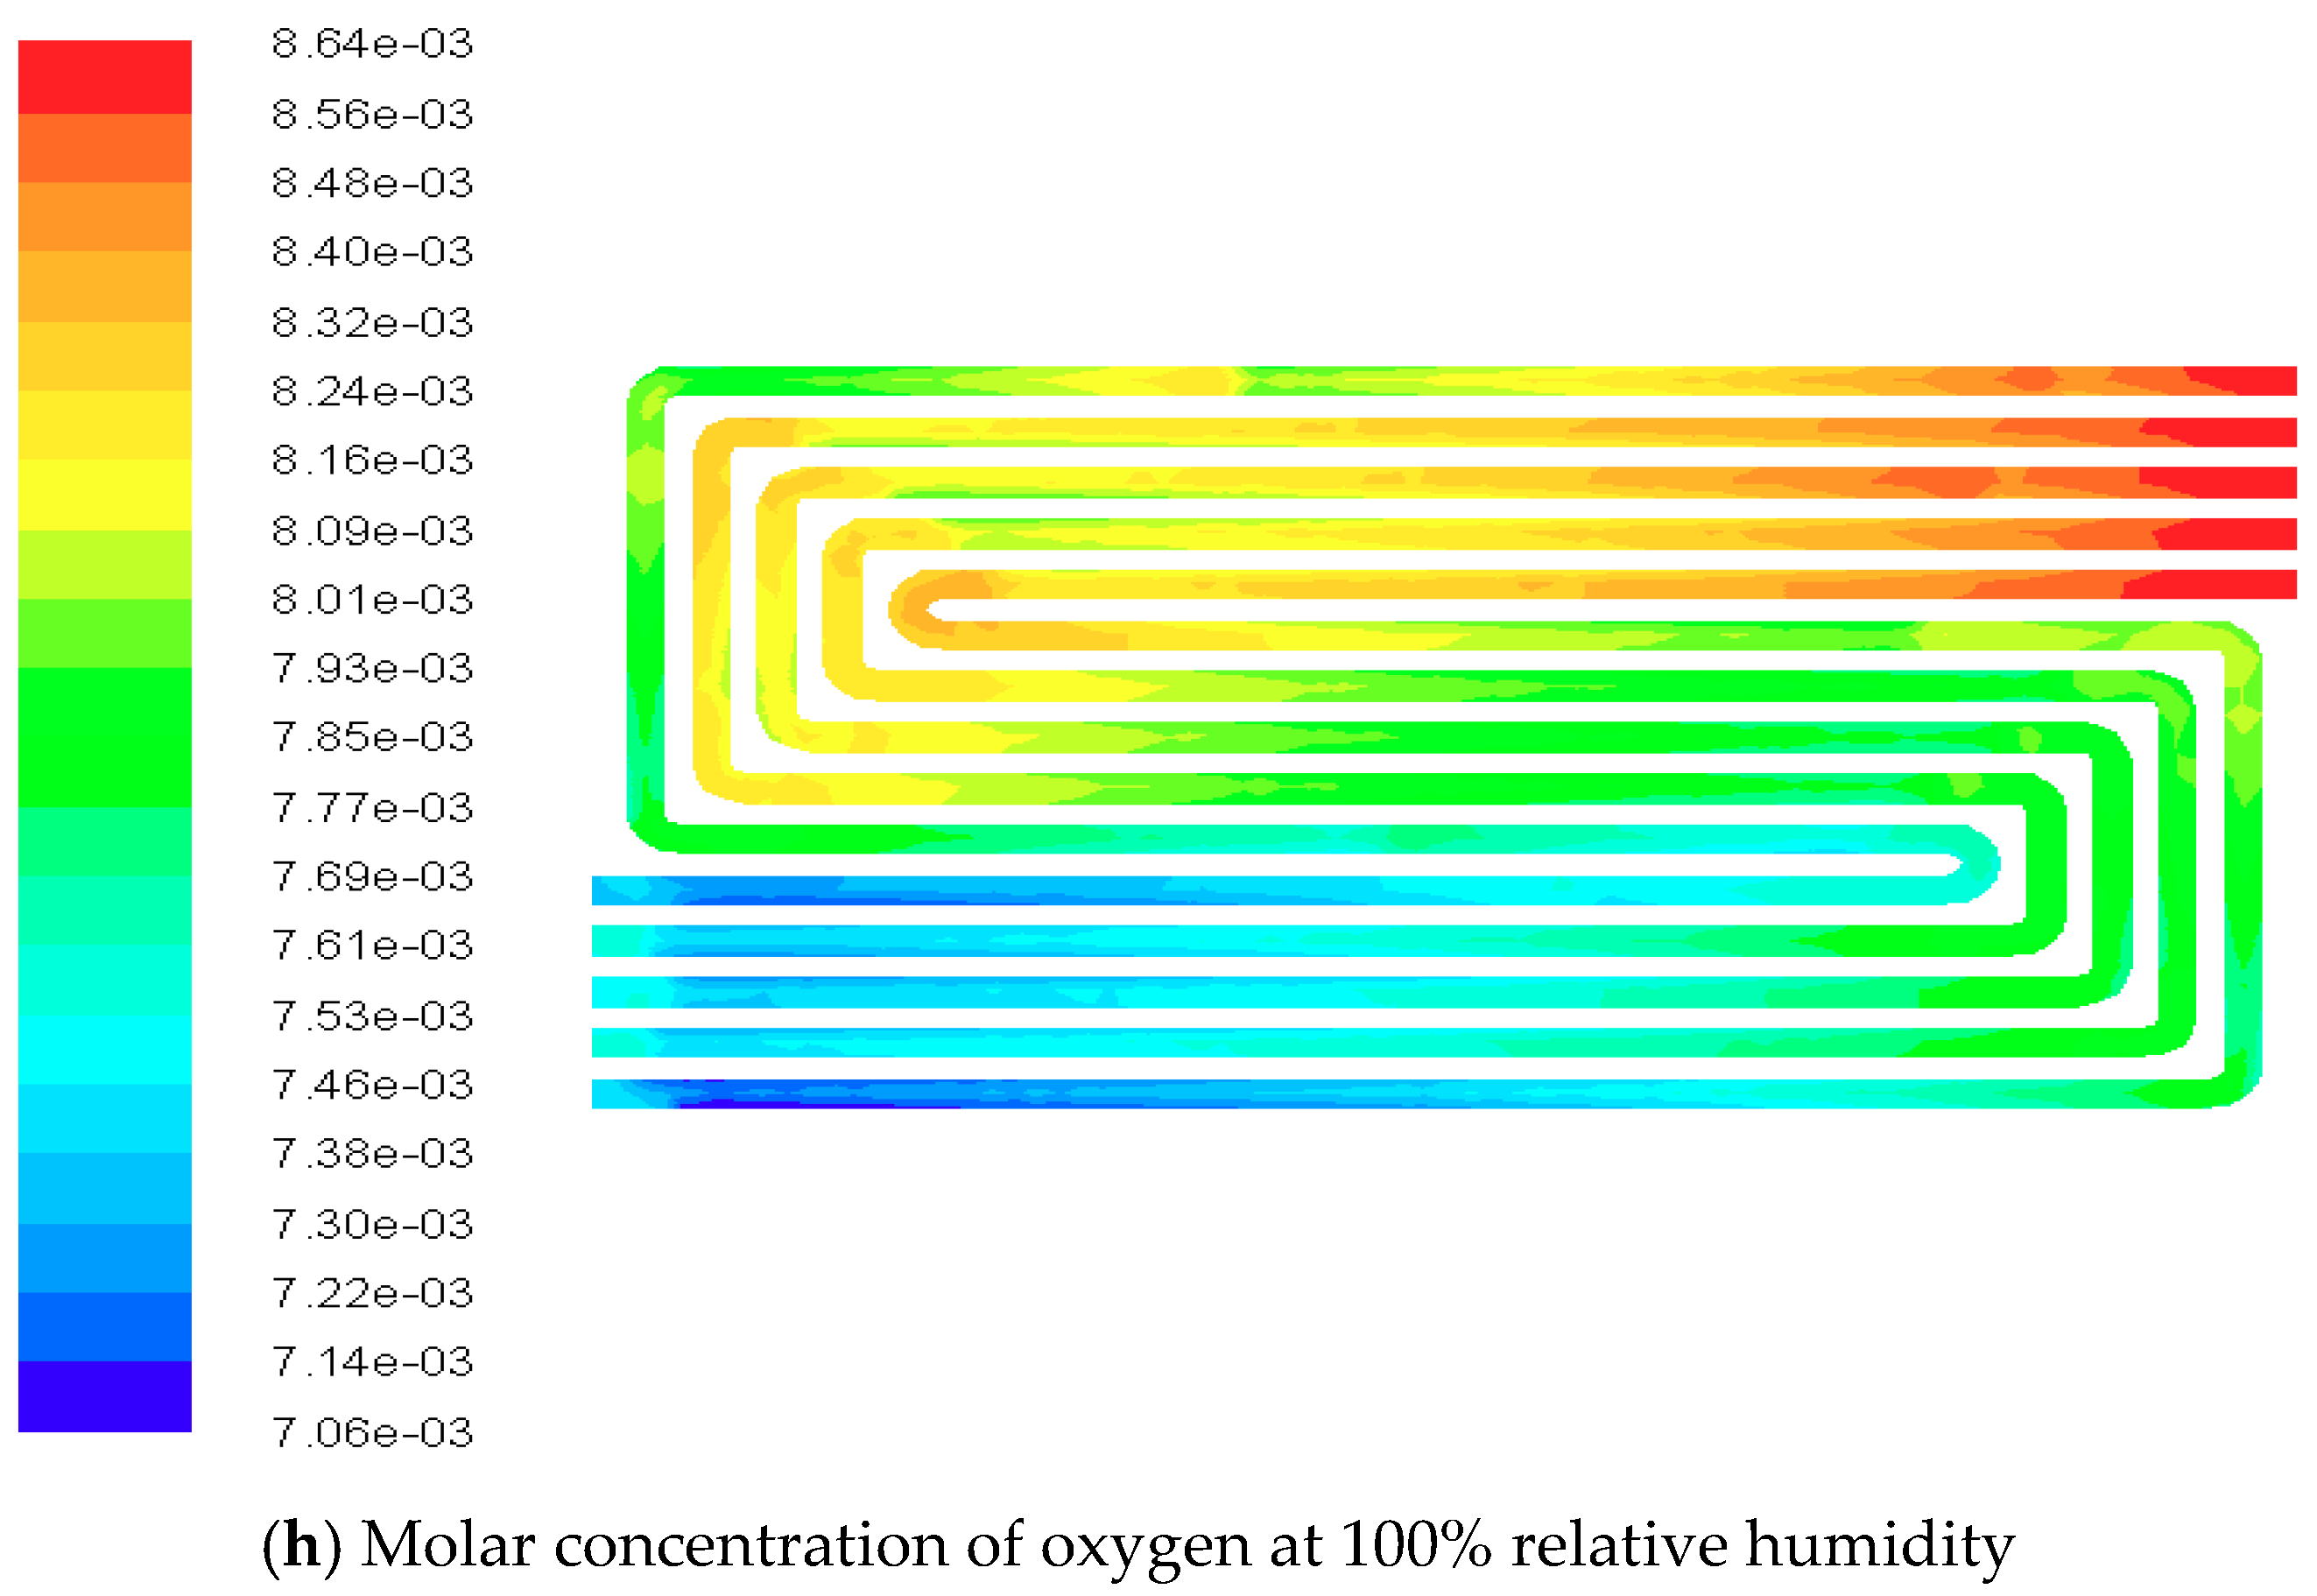
The contours of the fuel cell species distribution including the current density, membrane water content, and molar concentrations of hydrogen and oxygen, are represented under the conditions of relative humidity 85% and 100% in
Figure 7. It could be observed that the ARH model voltage value at a higher relative humidity was closer to real experiment value from the polarization curves, so that the contours of 85% and 100% relative humidity were chosen, and the operative voltage was 0.6 V.
The current density distribution on the proton exchange membrane surface is shown in
Figure 7a,b. The current density distribution was uniform and similar to Rahimi-Esbo [
32] research. Also, the pressure drop uniformity influenced current density distribution to some extent especially at the flow channel terminals. It could be found that the current density was in the range of 5.28 × 10
2~8.95 × 10
3 at a relative humidity of 85%. The current density was in the range of 3.48 × 10
2~8.93 × 10
3 at a relative humidity of 100%. It is obvious that there are bigger differences during the low current density region, and that the differences gradually narrow with the increase of current density.
Figure 7c,d shows the counters of membrane water content distribution. It can be observed that membrane water content at a relative humidity of 85% was less than that at a relative humidity of 100% and that their results were opposite to the current density distribution. Additionally, the counters of molar concentrations of hydrogen and oxygen were respectively listed in
Figure 7e–h. The variation range of hydrogen molar concentration was not large, and its tendency in anode channels was different, due to different relative humidities. From the gas inlet to the outlet in the anode channel, the molar concentration of hydrogen gas gradually decreased and the maximum and minimum concentrations were 4.31 × 10
−2 and 4.22 × 10
−2 at a relative humidity of 85%. A similar tendency has also emerged at a relative humidity of 100%, where the maximum molar concentration of hydrogen gas was 4.21 × 10
−2, and the minimum was 4.15 × 10
−2. This may be because the hydrogen flow rate and the mass fraction are relatively low, so the variation range is small [
40]. The pressure drop and water content generated by a higher humidity have significantly effects on the molar concentration distribution, so the molar concentration values are smaller at relative humidities of 100%. Similarly, the oxygen molar concentrations are in the range of 7.47 × 10
−3~8.97 × 10
−3 and 7.06 × 10
−3~8.64 × 10
−3 at cathode channels for relative humidities of 85% and 100%, and their variation tendencies show a good agreement. Purushothama Chippar et al. [
41] pointed out that simulation values such as current density and molar concentration at high relative humidities are smaller than at low relative humidity, resulting from the reaction rate improvement. As in their investigation, the simulation values at a relative humidity of 100% in this work were smaller than those at a relative humidity of 85%. This is because the pressure drop in the stack has a great influence on the relative humidity and cell output parameters. Water generated by a higher operating temperature of 70 °C and a high relative humidity of 100% promotes the passage of protons.


