Article

Direct Numerical Simulation of Gas–Particle Flows with Particle–Wall Collisions Using the Immersed Boundary Method

1
Course of Science and Technology, Tokai University, 4-1-1 Kitakaname, Hiratsuka, Kanagawa 259-1292, Japan
2
Department of Prime Mover Engineering, Tokai University, 4-1-1 Kitakaname, Hiratsuka, Kanagawa 259-1292, Japan
3
Department of Aeronautics and Astronautics, Tokai University, 4-1-1 Kitakaname, Hiratsuka, Kanagawa 259-1292, Japan
4
Institute of Fluid Science, Tohoku University, 2-1-1 Katahira, Aoba-ku, Sendai, Miyagi 980-8577, Japan
*
Author to whom correspondence should be addressed.
Appl. Sci. 2018, 8(12), 2387; https://doi.org/10.3390/app8122387
Submission received: 13 October 2018 / Revised: 4 November 2018 / Accepted: 21 November 2018 / Published: 26 November 2018

Abstract

:
We investigated particulate flows by coupling simulations of the three-dimensional incompressible Navier–Stokes equation with the immersed boundary method (IBM). The results obtained from the two-way coupled simulation were compared with those of the one-way simulation, which is generally applied for clarifying the particle kinematics in industry. In the present flow simulation, the IBM was solved using a ghost–cell approach and the particles and walls were defined by a level set function. Using proposed algorithms, particle–particle and particle–wall collisions were implemented simply; the subsequent coupling simulations were conducted stably. Additionally, the wake structures of the moving, colliding and rebounding particles were comprehensively compared with previous numerical and experimental results. In simulations of 50, 100, 200 and 500 particles, particle–wall collisions were more frequent in the one–way scheme than in the two-way scheme. This difference was linked to differences in losses in energy and momentum.

1. Introduction

The dynamics of the particle–wall and particle–particle collisions for Reynolds numbers below 1000 have been studied by various experiments and numerical simulations. Eames et al. [1] and Vanella et al. [2] explored the vortex structures generated by particle–wall collisions by the experiment and numerical simulation, and Griffith et al. [3] analyzed the dynamics associated with particle–particle collisions. Kajishima [4] and Deen et al. [5] conducted numerical simulations of the flows around multiple particles to investigate the clustering of particles and turbulence effects. Di Sarli et al. [6], using the numerical simulation based on the Eulerian approach for the fluid phase and the Lagrangian approach for the solid phase, studied the effect of the diameter of dust particles injected in a spherical vessel on the resulting turbulent flow field and dust distribution. However, the flow structures and the particle behavior of a system with multiple particle–wall collisions are still unclear.
The shot peening process, which involves impacting a metal surface with a large number of shots (particles), is widely used in practical mechanical engineering processes. When the particles collide with the metal surface, a compressible residual stress is generated over its surface [7]. The important parameter of this high-quality process is coverage level, which is defined as the percentage ratio of the total indentation area to the total treated surface area [8]. Kopp et al. [9] investigated the coverage level by noting the number of impressions. Garipy et al. [10] observed peen forming in experiments and numerical simulations. However, these studies focused on the plate, without adequately considering the interactions of the rebounding particles. Kato et al. [11] investigated the behavior of particles in experiments and multi-body dynamics simulations, however, they largely ignored the influence of the flow structure. Nguyen et al. [7] investigated the location of particle–surface impacts in the multiphase flow simulation. They employed the Euler–Lagrange approach and Reynolds-averaged Navier–Stokes equations, which cannot sufficiently model the particle–flow interactions and the detailed flow structures.
Among the Cartesian mesh methods, the immersed boundary method (IBM) developed by Mittal et al. [12], has been widely used for its simplicity and applicability to multiple moving objects. We have developed an IBM–based two- and three-dimensional Euler–Euler compressible flow solver that analyzes the interaction between the particles and turbulence in a gas-particle flow [13,14]. In the present study, we developed IBM–based three-dimensional incompressible flow solver [15] for exploring the structures and behaviors of particles undergoing multiple particle–wall collisions. This present flow solver directly performs a numerical simulation using the Euler–Euler approach. This simulation can capture the particle–flow interactions and the detailed flow structures.
The aim of this paper is to investigate the accuracy of the present IBM flow solver and to examine the flows around multiple particle–wall collisions to elucidate the interaction between the flow and particles using the Euler–Euler approach. To investigate the accuracy of the IBM flow solver, we computed the flow structure and the drag coefficient around a fixed sphere using different schemes, and compared the results of the solver with those of existing methods. We analyzed the flow when the moving particles impinge on a wall. Finally, for examining the interaction between the flow and a lot of moving particles, we compared the two-way coupled simulation with the one-way simulation that is generally applied in clarifying the particle kinematics in industry and in investigating the flow around particle–wall collisions.

2. Numerical Methods

2.1. Governing Equations

The governing equations of the present flow simulations are the three-dimensional incompressible Navier–Stokes equations and the equation of continuity:
u t + u u x + v u y + w u z = 1 ρ p x + ν ( 2 u x 2 + 2 u y 2 + 2 u z 2 ) , v t + u v x + v v y + w v z = 1 ρ p y + ν ( 2 v x 2 + 2 v y 2 + 2 v z 2 ) , w t + u w x + v w y + w w z = 1 ρ p z + ν ( 2 w x 2 + 2 w y 2 + 2 w z 2 ) ,
u x + v y + w z = 0 ,  
where u, v and w are the components of fluid velocity, and p, ρ and ν are the pressure, density and kinematic viscosity, respectively. The fractional step method was applied for time marching. The mesh employed is an equally spaced three-dimensional Cartesian grid. The convection term was evaluated by the second-order skew-symmetric scheme [16], and the diffusion term was discretized using the second-order central-difference scheme. The pressure and diffusion terms were calculated by the second-order finite-difference method. The Poisson equation of the pressure was calculated using the successive over-relaxation (SOR) method.

2.2. Immersed Boundary Method

Our flow solver defined objects using the level set and ghost-cell methods [13,14]. The level set function φ was defined as the signed minimum distance between whole cells and the object boundary. In the present study, flows around moving multiple objects were solved using multiple level set functions based on the simple minimum–distance approach [17]. The level set function of particle and wall was defined by the position of the particle’s center and of the wall’s surface, respectively. Each cell was classified as a fluid cell (FC), a ghost cell (GC) or an object cell (OC) using the level set function:
0 < ϕ FC , 2.25 Δ x ϕ GC 0 , ϕ OC < 2.25 Δ x .
The ghost cells, which behave as guard cells between the fluid and object regions, were assigned in one or two layers (Figure 1). The flow quantities in a ghost cell are determined by the flow variables of the image point within the region occupied by the fluid cells. The image point is addressed at the edge of a probe extended from the ghost cell through the object boundary in the direction normal to the surface. To avoid recursive references, the probe length was set to 1.75 times the mesh size Δx. The primitive variables on the image point were interpolated from their values at points in the surrounding fluid. Finally, the value of a ghost cell was defined by the value of the image point. To determine the velocity components of the ghost cells, linear extrapolations were implemented with the non-slip boundary conditions on the object surface.
The pressure for the ghost cell was defined by the value of the image point as follows:
u GC = u IP d IP + | ϕ GC | d IP ( u IP u IB ) , v GC = v IP d IP + | ϕ GC | d IP ( v IP v IB ) , w GC = w IP d IP + | ϕ GC | d IP ( w IP w IB ) , P GC = P IP .

2.3. Force Evaluations

The aerodynamic pressure and friction forces acting on the object surface were calculated on the cell face between the fluid and ghost cells. In the present method, the forces were estimated by a simple algorithm without surface polygons [18].

2.4. Motion of Object

The particles movement is described by the equations of motion for xyz-transportations and the angular momenta of a rigid body as follows:
d ( m p u p ) d t = S f d S + m p g ,  
d X p d t = u p ,  
I p d ω p d t = T ,  
d θ p d t = ω p ,  
where mp and Ip denote the particles mass and inertial moment, respectively. up = (up, vp, wp) and Xp = (xp, yp, zp) represent the velocity and position of the particle’s center of mass, ωp = (ωpx, ωpy, ωpz) and θp = (θpx, θpy, θpz) are the angular velocity and orientation of the particle. f and T express the aerodynamics forces and torque acting on the particle by the fluid. S is the cell face between the fluid and ghost cells, and g denotes the acceleration due to gravity. The distribution of the level set function changes by the position of particle’s center moving. The velocities of two particles (labeled 1 and 2) after their collision are respectively given by:
u p , 1 = m p , 2 m p , 1 + m p , 2 ( 1 + e ) [ ( u p , 2 u p , 1 ) c ] c + u p , 1 , u p , 2 = m p , 1 m p , 1 + m p , 2 ( 1 + e ) [ ( u p , 1 u p , 2 ) c ] c + u p , 2 ,
where e is the coefficient of restitution, and c is a standardization vector [19,20]. In this solver, the collision is applied to the perfectly elastic collision; e = 1. The collision detection of particles 1 and 2 was determined using an inequality involving Pythagoras formula as follows (see Figure 2),
( x 2 x 1 ) 2 + ( y 2 y 1 ) 2 + ( z 2 z 1 ) 2 ( r 1 + r 2 ) 2 ,  
where r is the particle radius.
After a particle–wall collisions, the particle velocity becomes:
u p = ( 1 + e ) [ ( u p ) c ] c + u p .  
To detect a collision between a particle and the wall, the central position of the particle and the normal vector were obtained from the level set function. When the image point appeared in the ghost cell of the other object, the velocity and the pressure components of the ghost cell were not updated. The velocity and the pressure of the object cell were constantly defined as the initial conditions.

3. Results

3.1. Validation around a Fixed Particle

The accuracy of the flow solver was determined by comparing the calculated flow structure and the drag coefficient around a fixed sphere with those of previous studies and drag models [21,22,23,24]. The convection term was evaluated using two schemes: U, the first-order upwind finite-difference scheme and S, the second-order skew-symmetric scheme. The Reynolds numbers was set to Re = 300 and 400 depending on the freestream and particle diameter values. A comparison was made using two mesh resolutions 0.05D (fine) and 0.1D (coarse), where D is the particle diameter. The computational conditions are summarized in Table 1. The computational domain (see Figure 3) is 20D × 10D × 10D. The boundary values of the velocity and pressure were defined by Dirichlet boundary conditions at the inlet and outlet boundaries, and all variables were subject to Neumann conditions at the other boundaries. All variables were normalized by the freestream values of the density, velocity and the reference length (here taken as D).
Figure 4 plots the mean drag coefficient versus Reynolds number. The drag models of Clift et al. [21] and Wen et al. [22] are respectively:
C D = 24 R e ( 1 + 0.15 R e 0.687 + 0.0175 R e 1 + 4.25 × 10 4 R e 1.16 ) ,  
C D = 24 R e ( 1 + 0.15 R e 0.687 ) .  
To show the adaptability of the scheme, the drag coefficients in schemes U and S were compared at Re = 300. The difference between these two schemes became small at high grid resolutions. Moreover, the difference between scheme S and the previous models was smaller than that of scheme U. The present results captured the trends produced by previous drag models and the drag coefficients obtained agreed well with those of previous numerical results. Figure 5 and Figure 6 summarize the nondimensional time histories of the drag and the lift coefficients at Re = 300, respectively. The coefficients oscillated in all cases except Re300D010A. The amplitudes of the oscillations were higher for a fine-mesh than for a coarse-mesh and were almost twice as high in scheme S than in scheme U. From the distributions of the time-averaged pressure coefficients on the center plane (Figure 7); the time-average was processed in five cycles of the steady wake vortex. We observed the same non-axisymmetric flows as in a previous study [23]. We saw a weak vortex in the wake of scheme U instead of scheme S because of numerical dissipation. Furthermore, a smooth contour distribution was established as the grid resolution increased. The instantaneous wake structure was visualized using the second invariant of the velocity tensors Q (Q-criterion) in Figure 8. At Re = 300, Mittal et al. [23] observed a hairpin vortex in the wake of the particle. In the present study, all cases except Re300D010A showed a hairpin vortex in the wake structure. In scheme U on fine mesh (e.g., see Re300D005A in Figure 8b), the hairpin vortex was distorted. In scheme S, however, the vortex was highly resolved (see Figure 8c,d). The wake structure was missing in scheme U because of the convection term by the first-order upwind finite-difference scheme, which cannot properly resolve the unsteady phenomena because of the large numerical dissipation. The same trend was observed at Re = 400 (see Figure 8e,f).
In the present flow solver, the drag coefficient and the unsteady phenomena were resolved by the second-order skew-symmetric scheme for the convection term.

3.2. Collision of a Moving Particle with a Flat Wall

To validate the present flow solver, the flow structure obtained from the collision of a moving particle with a flat wall was compared with that from the experiment and numerical simulation by Eames et al. [1] and Vanella et al. [2]. The flow and particle conditions were the same as the numerical simulations of Vanella et al. [2]. The simulation was normalized by the initial velocity of the particle and its diameter. The computational mesh was fixed at 0.05D (fine) and 0.1D (coarse). The computational domain (Figure 9) was set to 10D × 10D × 10D. The wall was fixed at z = 1D. Dirichlet boundary conditions were imposed on the velocity and pressure for the upper and side boundaries, whereas Neumann boundary conditions were imposed on the upper boundary for the pressure and side boundaries for velocity.
Figure 10 shows the instantaneous vorticity distributions at the timing of the collision, with Figure 10a,b pertaining to results on the coarse and fine meshes, respectively. The distributions in the wake of the particle and between the particle and the wall qualitatively agreed with previous results [1,2]. Visually, the adhesion between the particle and the wall had no effect on the flow phenomena. This is because the visualization of the object surface uses just the isosurface of the level set function. Figure 11 shows the instantaneous vorticity distributions of the impacted (Figure 11a) and rebounding (Figure 11b) particle at the same nondimensional time t*, Figure 11a,b pertaining to the coarse and fine meshes, respectively. In all instances, a wake vortex appears from the rebound after the collision. The present distribution in the wake of the rebounding particle was consistent with previous results [1,2]. After the particle had rebounded, the generation of a flow of opposite vorticity was clearly observed in the fine mesh. In the present flow solver, the accurate and stable simulation for the collision between moving particle and the flat wall was conducted.

3.3. Collision of a Moving Particle with a Curved Wall

Additionally, the flow distribution when a moving particle collides with a curved wall was evaluated. The present algorithm was applied in the calculation of the flow for the collision of a moving particle with a curved wall as the collision detection is performed using the normal vector obtained from the level set function. The initial particle position was fixed at z = 6D (Figure 12), and the computational mesh size was 0.05D. Given the freestream value and particle diameter, the Reynolds number was set to 400. Dirichlet boundary conditions were imposed on the velocity and pressure for the upper and side boundaries, whereas the Neumann boundary conditions were imposed on the upper boundary for the pressure and side boundaries for velocity.
Figure 13 shows the instantaneous vorticity distributions at the instant of collision (nondimensional time t* = 0.0, Figure 13a), after the collision (t* = 0.1, Figure 13b) and during the rebound (t* = 1.0, Figure 13c). In Figure 13a, vorticity form around the particle and the curved wall from the freestream. In Figure 13b, the vortex forming around the particle is reversed. With a flat wall, a similar flowfield can be seen in Figure 13c. The present flow solver can simulate the flow with the collision between the moving particle and the curved wall.

3.4. Collision of Two Moving Particles

The flow around two moving colliding particles was compared with those of a previous study [3]. In the computational domain (Figure 14), the computational mesh was fixed at 0.05D (fine) and 0.1D (coarse). The Reynolds number was set to the value given in a previous study by setting the diameter and initial velocity of the particle.
Figure 15a,b show the instantaneous vorticity distributions, on the coarse and fine meshes, respectively. During the impact, twin vortices were formed in the wake of each particle. The present results agreed well with those of the previous numerical simulation [3]. Figure 16 shows the instantaneous vorticity distributions at the instant of contact (nondimensional time t* = 0.0, Figure 16a), immediately after the collision (t* = 0.1, Figure 16b) and during the rebound (t* = 1.0, Figure 16c). After the impact, the wake vortex moved forward along the surface of the particle. From these simple tests, the present flow solver could calculate flows during the collision and rebound of two moving particles.

3.5. Collision of Multiple Particles with a Flat Wall

As a practical application, the present flow solver was applied to the flow around multiple particles colliding with a flat wall. Given the particle diameter and the relative velocity between the freestream and the particle after its impact with the wall, the Reynolds number was set to 400. The grid size was fixed at 0.05D. The particle was assumed to be made of hard steel and have same diameter D. Adiabatic conditions and non-slip boundary conditions were imposed on the particle surfaces. The particles were assigned random initial positions outside the computational domain. From the start of the simulation, many particles entered into the computational domain and were defined by the level set function. The velocity of each particle was constant outside the computational domain but varied under gravitational and aerodynamics forces in the domain. The initial angular velocity of the particle was zero. The number of particles Np was set to 50, 100, 200 or 500. The size of the computational domain was 25.6D × 25.6D × 25.6D (Figure 17), and the wall was fixed at z = 1D. Dirichlet boundary conditions for the velocity and pressure were set on the upper and outer side boundaries, whereas Neumann boundary conditions are set on the upper boundary for the pressure and side boundaries for the velocity. The initial flow field was a steady flow without particles.
Two coupling schemes were compared in this simulation: a one-way (A) and a two-way (B) scheme. The computational conditions are summarized in Table 2. In scheme A, the flow field was a steady flow and the aerodynamic forces for particle were calculated based on this steady flow. In scheme B, one the other hand, the flow field was influenced by the moving particle and the aerodynamic forces were calculated based on the flow conditions. In this simulation, the lubrication force [25] was not considered, because the difference between the one-way and two-way scheme was focused on. The CPU times are shown in Appendix A.
The instantaneous wake structure of the particle in scheme B was visualized by the second invariant of the velocity tensors (Q-criterion). The results for 50, 100, 200 and 500 particles are displayed in Figure 18, Figure 19, Figure 20 and Figure 21, respectively. The nondimensional time t* was defined by the particle diameter and freestream values. At t* = 40, multiple particles collided with the flat wall and rebound (panels (a) in Figure 18, Figure 19, Figure 20 and Figure 21). At t* = 50, they rebounded and collided with other particles (panels (b) in Figure 18, Figure 19, Figure 20 and Figure 21). After collision with the wall, a wake structure from the particle was observed as a hairpin vortex and developed with the change in relative velocity. When the number of particles became large, the vortices frequently interfered with the particles and other vortices. Moreover, many particles moved not only in the direction of the falling particles, but also in all other directions, being scattered by the freestream and in collisions with particle–particle.
Figure 22 shows the instantaneous distributions of the velocity magnitudes at the center of the computational domain. As for scheme A in Figure 22a, the steady flow field was maintained because the one-way scheme has been often used in the Lagrangian method as the momentum of the fluid acts on the particle surface unidirectionally. The flow decelerated as approaching the wall. The flow was fastest in the center of the freestream and slowed down by the influence of the wall as it was going to the outside domain. In scheme B in Figure 22b, the flow field was complicated by the interference of the particles; nevertheless, the flow was determined. Although the initial particle positions were the same in both schemes, the particle distributions were clearly different. The simulations using scheme A were unable to predict the movement of particles due to the lack of the interaction.
Figure 23 shows the number of rebounding particles Np2 at observation points z = 5D, 10D and 15D in the computational domain (Figure 17), respectively. In all instances, the number of rebounding particles was smaller than those that had fallen, because particles sometimes moved outside the computational domain. Moreover, the number of rebounding particles of the higher observation point became smaller compared to those that had fallen at a lower observation point. At z = 5D–10D, the number of rebounding particles was half than the number of falling particles. At z = 15D, the number of rebounding particles in the computational domain was less than half the number of falling particles. The initial particle position and initial flow field of Scheme A was the same as that of Scheme B; however, Scheme A was unable to predict the movement particles.
Figure 24 shows the kinetic energy along with the normal direction to the flat wall of a rebounding particles normalized by that of the falling (pre-collision; subscript 1) particles at the observation point z = 5D, 10D and 15D in schemes A and B, where, along the z-axis, the energy was en = ∑0.5ρp(wp2). After the collision between the particles and the wall, the energy of particles decreased along the z–axis because the particles moved in many directions. The energy of the higher observation point was smaller than that at the lower observation point because the particles moved horizontally because of the freestream. Scheme A shows a different trend than scheme B because the flow was more complex in the former. When the number of particles was large, the particle energy was reduced by the frequent particle–particle collisions.
Figure 25 shows the kinetic energy of the rebounding (post–collision; subscript 2) particles at the observation point z = 5D, 10D and 15D for schemes A and B, where in the x-y plane, the energy was et = ∑0.5ρp(up2 + vp2). After the collision, the energy of particles increased because the particles moved laterally with the freestream and the collisions. The energy at the low observation point was larger than that at the high observation point and tended to be opposite to en. When the number of particle was large, the energy increased because the flow became complex and particle–particle collisions occurred more frequently; the gap between the schemes A and B is larger. Scheme A was unable to produce the same result as scheme B because the number of rebounding particles obtained from Scheme A was different from the one obtained from Scheme B (Figure 23).
From schemes A and B, Figure 26 plots the number of particle–wall collisions as functions of particle number. The number of collisions was double the number of falling particles in each scheme. However, the results of scheme A became progressively higher than those of scheme B as particle number increased. Multiple particles near the wall moved laterally in scheme A, because these particles interacted stronger with the freestream than in scheme B. As a result, the laterally moving particles increased and falling particles collided with these particles more frequently. Therefore, with a large number of particles, the estimate in scheme B was difficult to obtain. The kinetic energy of the rebounding particle in each scheme (Figure 24 and Figure 25) was almost the same; however, the number of particle–wall collisions yielded different results. In the particulate flow simulation with the wall, the interaction between the flow and the moving particles can be significant to capture more realistic characteristics.
Figure 27 visualizes the distribution of the collision points on the wall in the one cell painted. The irregular distribution was attributed to the initially random particle dispositions. Although the initial particle positions were the same in both schemes, the distributions were clearly different. For schemed A200 and B200, the numbers of collisions between particle and wall were almost the same in Figure 26, however, the locations of collision points were different.
In the shot peening process, the evaluation of the flow field using scheme B was important because the location and number of collisions between particle and wall influenced the accuracy of predictions of the process.

4. Conclusions

A three-dimensional flow solver based on IBM was developed and applied to the flows around multiple particles colliding with a wall. The performance of the present flow solver was compared with those of previous studies of the two types of collisions; a moving particle colliding with a flat wall, and collision between two moving particles. Differences between the two-way and one-way schemes were identified for multiple particles colliding with the wall. The main results are summarized below:
(1)
The drag coefficient of a fixed particle computed by the proposed solver agreed well with the drag coefficient of previous studies. The skew–symmetric scheme could capture the unsteady flow characteristics such as the wake structure.
(2)
The wake structures of the moving particle colliding with the flat wall, the curved wall and another moving particle exhibited the same trends as the wake structures computed in previous studies. We demonstrated that the present flow solver using a simple collision algorithm appropriately solves the collision problem.
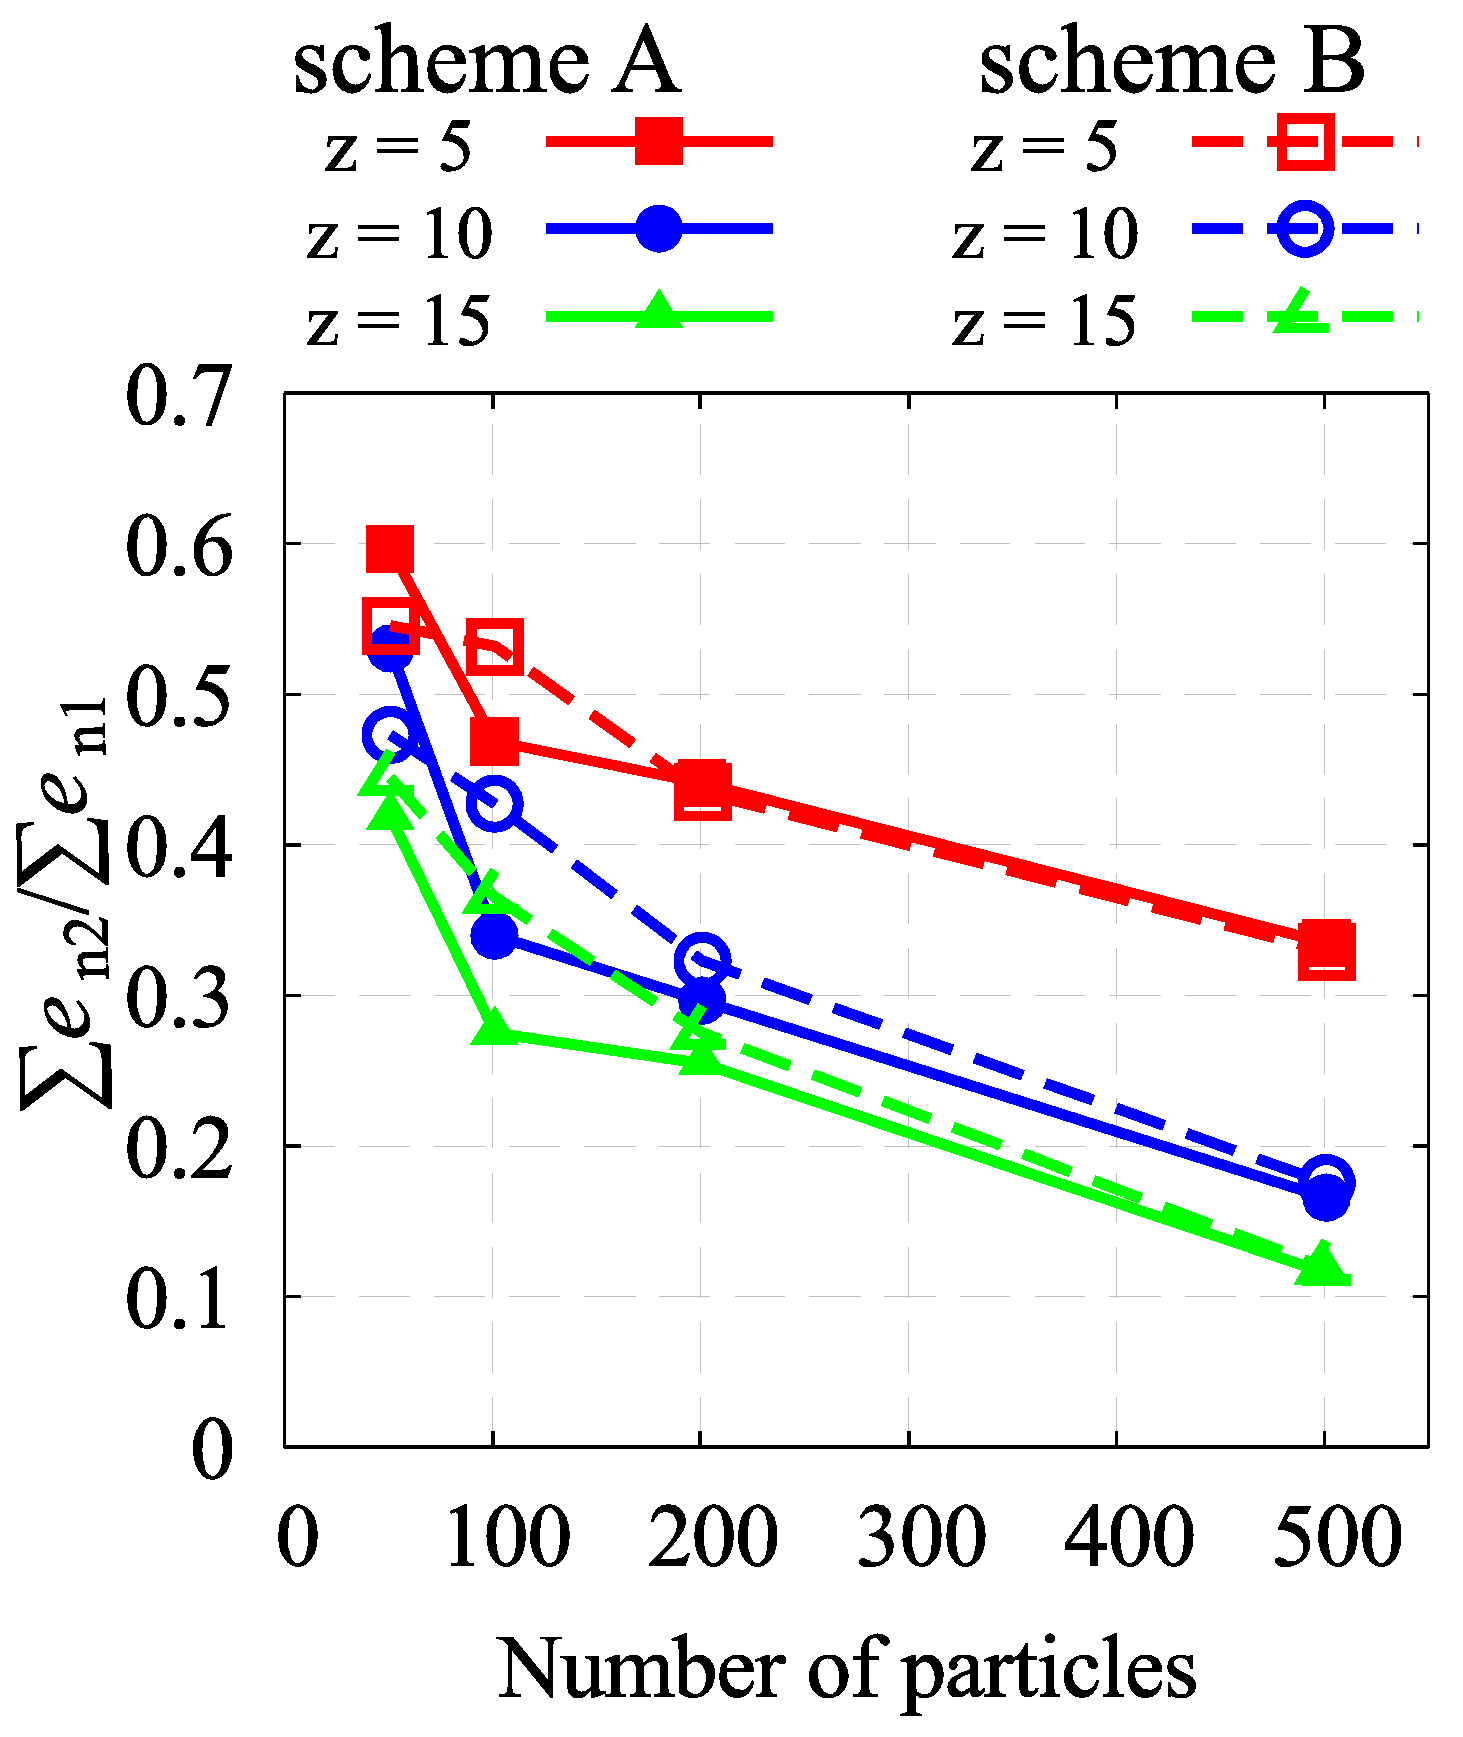
(3)
When the number of particles is large, the flow structure becomes complex because particle–particle collisions caused frequent lateral movements of the particles.
(4)
For many particles, the one-way scheme could not accurately predict the flows, because it overestimated the number of collisions and ignored the influence of the particles on the fluid, which altered the flow phenomena.
The interaction of a fluid and multiple colliding particles remains as an open problem, requiring more details to be able to compare the results with experimental results in a large region. Moreover, the difference of the flow characteristics between the particles–flat wall and particles–curved wall collisions will need to be investigated in the case of the large number of particles.

Author Contributions

Conceptualization, Y.M, and S.T.; Methodology, S.T.; Software, Y.M. and S.T.; Formal analysis, Y.M.; Investigation, Y.M.; Resources, S.O.; Project Administration, S.T., K.F. and S.O.

Funding

The research received no external funding.

Acknowledgments

Part of the present simulations were implemented by the High Performance Computer Infrastructure (HPCI) hp150130, hp160150 and hp170111. This work was supported by JSPS KAKENHI Grant Number 16K18018, 17K06167 and 18K03937. Part of the work was carried out under the Collaborative Research Project J15052 “Study for accurate prediction of unsteady aerodynamic characteristics around moving objects” with the Institute of Fluid Science, Tohoku University. This study was partially supported by the Research Project of Tokai University “Development of measurement system for unsteady flows around moving objects by numerical simulations and experiments”.

Conflicts of Interest

The authors declare no conflict of interest.

Appendix A

Table A1 shows the CPU times of test cases in Section 3.5. These simulations were carried out by SX-ACE of Cyberscience Center Tohoku University. The CPU time increased with the number of particles. However, there was no big difference between the computational time of the scheme A and B.
Table A1. CPU times.
CaseCPU Time (s)
A05024,966.707
A10024,538.322
A20026,742.404
A50026,214.485
B05021,369.633
B10023,787.872
B20025,996.342
B50026,384.007

References

  1. Eames, I.; Dalziel, S.B. Dust resuspension by the flow around an impacting sphere. J. Fluid Mech. 2000, 403, 305–328. [Google Scholar] [CrossRef] [Green Version]
  2. Vanella, M.; Balaras, E. A moving–least–squares reconstruction for embedded–boundary formulations. J. Comput. 2009, 228, 6617–6628. [Google Scholar] [CrossRef]
  3. Griffith, D.M.; Schouveiler, L.; Thompson, C.M.; Hourigan, K. Dynamics of the flow around colliding spheres. J. Fluids Struct. 2011, 27, 1349–1356. [Google Scholar] [CrossRef]
  4. Kajishima, T. Influence of particle rotation on the interaction between particle clusters and particle-induced turbulence. Int. J. Heat Fluid Flow 2004, 25, 721–728. [Google Scholar] [CrossRef]
  5. Deen, N.G.; Peters, E.A.J.F.; Padding, J.T.; Kuipers, J.A.M. Review of direct numerical simulation of fluid–particle mass, momentum and heat transfer in dense gas–solid flows. Chem. Eng. Sci. 2014, 116, 710–724. [Google Scholar] [CrossRef]
  6. Di Sarli, V.; Russo, P.; Sanchirico, R.; Di Benedetto, A. CFD simulations of the effect of dust diameter on the dispersion in the 20 L bomb. Chem. Eng. Trans. 2013, 31, 727–732. [Google Scholar] [CrossRef]
  7. Nguyen, B.V.; Poh, J.H.; Zhang, W.Y. Predicting shot peening coverage using multiphase computational fluid dynamics simulations. Powder Technol. 2004, 256, 100–112. [Google Scholar] [CrossRef]
  8. Kirk, D.; Abyaneh, M.Y. Theoretical basis of shot peening coverage control. Shot Peener 1995, 9, 28–30. [Google Scholar]
  9. Kopp, R.; Wustefeld, F. Modern Simulation and Optimization of Peen Forming Processes. In Proceedings of the International Conferences on Shot Peening, Tokyo, Japan, 1990; pp. 561–572. [Google Scholar]
  10. Garipy, A.; Larose, S.; Perron, C.; Bocher, P.; Levesque, M. On the effect of the peening trajectory in shot peen forming. Finite Elem. Anal. Des. 2013, 69, 48–61. [Google Scholar] [CrossRef]
  11. Kato, Y.; Omiya, M.; Hoshino, H. Modeling of Particle Behavior in Shot Peening Process. J. Mech. Eng. Autom. 2014, 4, 83–91. [Google Scholar]
  12. Mittal, R.; Iaccarino, G. IMMERSED BOUNDARY METHODS. Fluid Mech. 2005, 37, 239–261. [Google Scholar] [CrossRef]
  13. Mizuno, Y.; Takahashi, S.; Nonomura, T.; Nagata, T.; Fukuda, K. A Simple Immersed Boundary Method for Compressible Flow Simulation around a Stationary and Moving Sphere. Math. Probl. Eng. 2015, 2015, 1–17. [Google Scholar] [CrossRef]
  14. Takahashi, S.; Nonomura, T.; Fukuda, K. A Numerical Scheme Based on an Immersed Boundary Method for Compressible Turbulent Flows with Shocks: Application to Two–Dimensional Flows around Cylinders. J. Appl. Math. 2014, 2014, 1–21. [Google Scholar] [CrossRef]
  15. Mizuno, Y.; Inoue, T.; Takahashi, S.; Fukuda, K. Investigation of A Gas–particle Flow with Particle–particle And Particle–wall Collisions by Immersed Boundary Method. Int. J. Comput. Meth. Exp. Meas. 2018, 6, 132–138. [Google Scholar] [CrossRef]
  16. Morinishi, Y. Skew–symmetric form of convective terms and fully conservative finite difference schemes for variable density low–Mach number flows. J. Comput. Phys. 2010, 229, 276–300. [Google Scholar] [CrossRef]
  17. Takahashi, S.; Monjugawa, I.; Nakahashi, K. Unsteady Flow Computations around Moving Airfoils by Overset Unstructured Grid Method. Trans. Jpn. Soc. Aeronaut. Space Sci. 2008, 51, 78–85. [Google Scholar] [CrossRef] [Green Version]
  18. Nonomura, T.; Onishi, J. A comparative Study on Evaluation Methods of Fluid Forces on Cartesian Grids. Math. Probl. Eng. 2017, 2017, 1–15. [Google Scholar] [CrossRef]
  19. Kosinski, P.; Hoffmann, A.C. Extension of the hard-sphere particle-wall collision model to account for particle deposition. Phys. Rev. 2009, 79, 1–11. [Google Scholar] [CrossRef] [PubMed]
  20. Kosinski, P.; Hoffmann, A.C. An extension of the hard–sphere particle–particle collision model to study agglomeration. Chem. Eng. Sci. 2010, 65, 3231–3239. [Google Scholar] [CrossRef]
  21. Clift, R.; Ganvio, H.W. Motion of entrained particles in gas streams. Can. J. Chem. Eng. 1971, 49, 439–448. [Google Scholar] [CrossRef]
  22. Wen, C.Y.; Yu, Y.H. A generalized method for predicting the minimum fluidization velocity. Chem. Eng. Prog. Symp. Ser. 1699, 6, 100. [Google Scholar] [CrossRef]
  23. Mittal, R.; Dong, H.; Bozkurttas, M.; Najjar, F.M.; Vargas, A.; von Loebbecke, A. A versatile sharp interface immersed boundary method for incompressible flows with complex boundaries. J. Comput. Phys. 2008, 227, 4825–4852. [Google Scholar] [CrossRef] [PubMed] [Green Version]
  24. Luo, K.; Wang, Z.; Fan, J. A modified immersed boundary method for simulations of fluid–particle interactions. Comput. Methods Appl. Mech. Eng. 2007, 197, 36–46. [Google Scholar] [CrossRef]
  25. Zhang, W.; Noda, R.; Horio, M. Evaluation of lubrication force on colliding particles for DEM simulation of fluidized beds. Powder Technol. 2005, 158, 92–101. [Google Scholar] [CrossRef]
Figure 1. Domain around an object.
Applsci 08 02387 g001
Figure 2. Collision detection.
Applsci 08 02387 g002
Figure 3. Computational domain. The red sphere is the object.
Applsci 08 02387 g003
Figure 4. Drag coefficients versus Reynolds number computed using the proposed model (red and blue symbols), drag model (black lines) and previous models (orange and green symbols).
Applsci 08 02387 g004
Figure 5. Variation of drag coefficient at Re = 300.
Applsci 08 02387 g005
Figure 6. Variation of lift coefficient at Re = 300.
Applsci 08 02387 g006
Figure 7. Time-averaged pressure coefficient distributions: (a) Re300D010U, (b) R300D005U, (c) R300D010S, (d) R300D005S, (e) R400D010S, (f) R400D005S.
Applsci 08 02387 g007aApplsci 08 02387 g007b
Figure 8. Instantaneous distributions of second invariant of velocity tensor. (Q = 1.0 × 10⁻³): (a) Re300D010U, (b) R300D005U, (c) R300D010S, (d) R300D005S, (e) R400D010S, (f) R400D005S.
Applsci 08 02387 g008
Figure 9. Computational domain. The white object and gray plate represent particle and flat wall, respectively.
Applsci 08 02387 g009
Figure 10. Vorticity distributions at the particle–flat wall collision: (a) coarse mesh, (b) fine mesh.
Applsci 08 02387 g010
Figure 11. Vorticity distributions, at the collision of the particle with the wall (a) and at the rebound of the particle (b): (a) coarse mesh, (b) fine mesh.
Applsci 08 02387 g011
Figure 12. Computational domain of a particle (small sphere) colliding with a curved wall.
Applsci 08 02387 g012
Figure 13. Vorticity distributions when a particle collides with a curved wall. (a) t* = 0.0, (b) t* = 0.1, (c) t* = 1.0.
Applsci 08 02387 g013
Figure 14. Computational domain of the particle–particle collision simulation.
Applsci 08 02387 g014
Figure 15. Vorticity distributions during a particle–particle collision: (a) coarse mesh, (b) fine mesh.
Applsci 08 02387 g015
Figure 16. Vorticity distributions during a particle–particle collision: (a) t* = 0.0, (b) t* = 0.1, (c) t* = 1.0.
Applsci 08 02387 g016
Figure 17. Computational domain used for the multiple-particle collisions with a flat wall (gray slab). Observation points are z = 5D, 10D and 15D.
Applsci 08 02387 g017
Figure 18. Instantaneous distribution of second invariant of velocity tensors (Q = 0.1) for scheme B050: (a) t* = 40, (b) t* = 50. The color of the isosurface represents the magnitude of the velocity.
Applsci 08 02387 g018
Figure 19. Instantaneous distribution of second invariant of velocity tensors (Q = 0.1) for scheme B100: (a) t* = 40, (b) t* = 50. The color of the isosurface represents the magnitude of the velocity.
Applsci 08 02387 g019
Figure 20. Instantaneous distribution of second invariant of velocity tensors (Q = 0.1) for scheme B200: (a) t* = 40, (b) t* = 50. The color of the isosurface represents the magnitude of the velocity.
Applsci 08 02387 g020
Figure 21. Instantaneous distribution of second invariant of velocity tensors (Q = 0.1) for scheme B500: (a) t* = 40, (b) t* = 50. The color of the isosurface represents the magnitude of the velocity.
Applsci 08 02387 g021
Figure 22. Flow distributions for schemes A050 (a) and B050 (b). The color map indicates the magnitude of the velocity.
Applsci 08 02387 g022
Figure 23. Number of passes of the multiple particles.
Applsci 08 02387 g023
Figure 24. Kinetic energy of rebounding particles, where the energy is en = 0.5ρp(wp2).
Applsci 08 02387 g024
Figure 25. Kinetic energy of rebounding particles, where the energy is et = 0.5ρp(up2 + vp2).
Applsci 08 02387 g025
Figure 26. Number of collisions between the wall and the many particles. Red and blue plots pertain to scheme A and B, respectively.
Applsci 08 02387 g026
Figure 27. Distribution of collisions on the wall in schemes A050 (a), B050 (b), A100 (c), B100 (d), A200 (e), B200 (f), A500 (g) and B500 (h).
Applsci 08 02387 g027
Table 1. Test cases in the proposed model.
Reynolds NumberMesh SizeSchemeCase
3000.10D
0.05D
0.10D
upwind.Re300D010U
Re300D005U
Re300D010S
4000.05D
0.10D
0.05D
skew-sym.Re300D005S
Re400D010S
Re400D005S
Table 2. Test cases in the multiple particle–wall collision simulation.
SchemeNumber of ParticlesCase
one–way50A050
100A100
200A200
500A500
two–way50B050
100B100
200B200
500B500

