Effects of Long-Wavelength Track Irregularities Due to Thermal Deformations of Railway Bridge on Dynamic Response of Running Train


Abstract
:
1. Introduction
2. On-Site Measurements
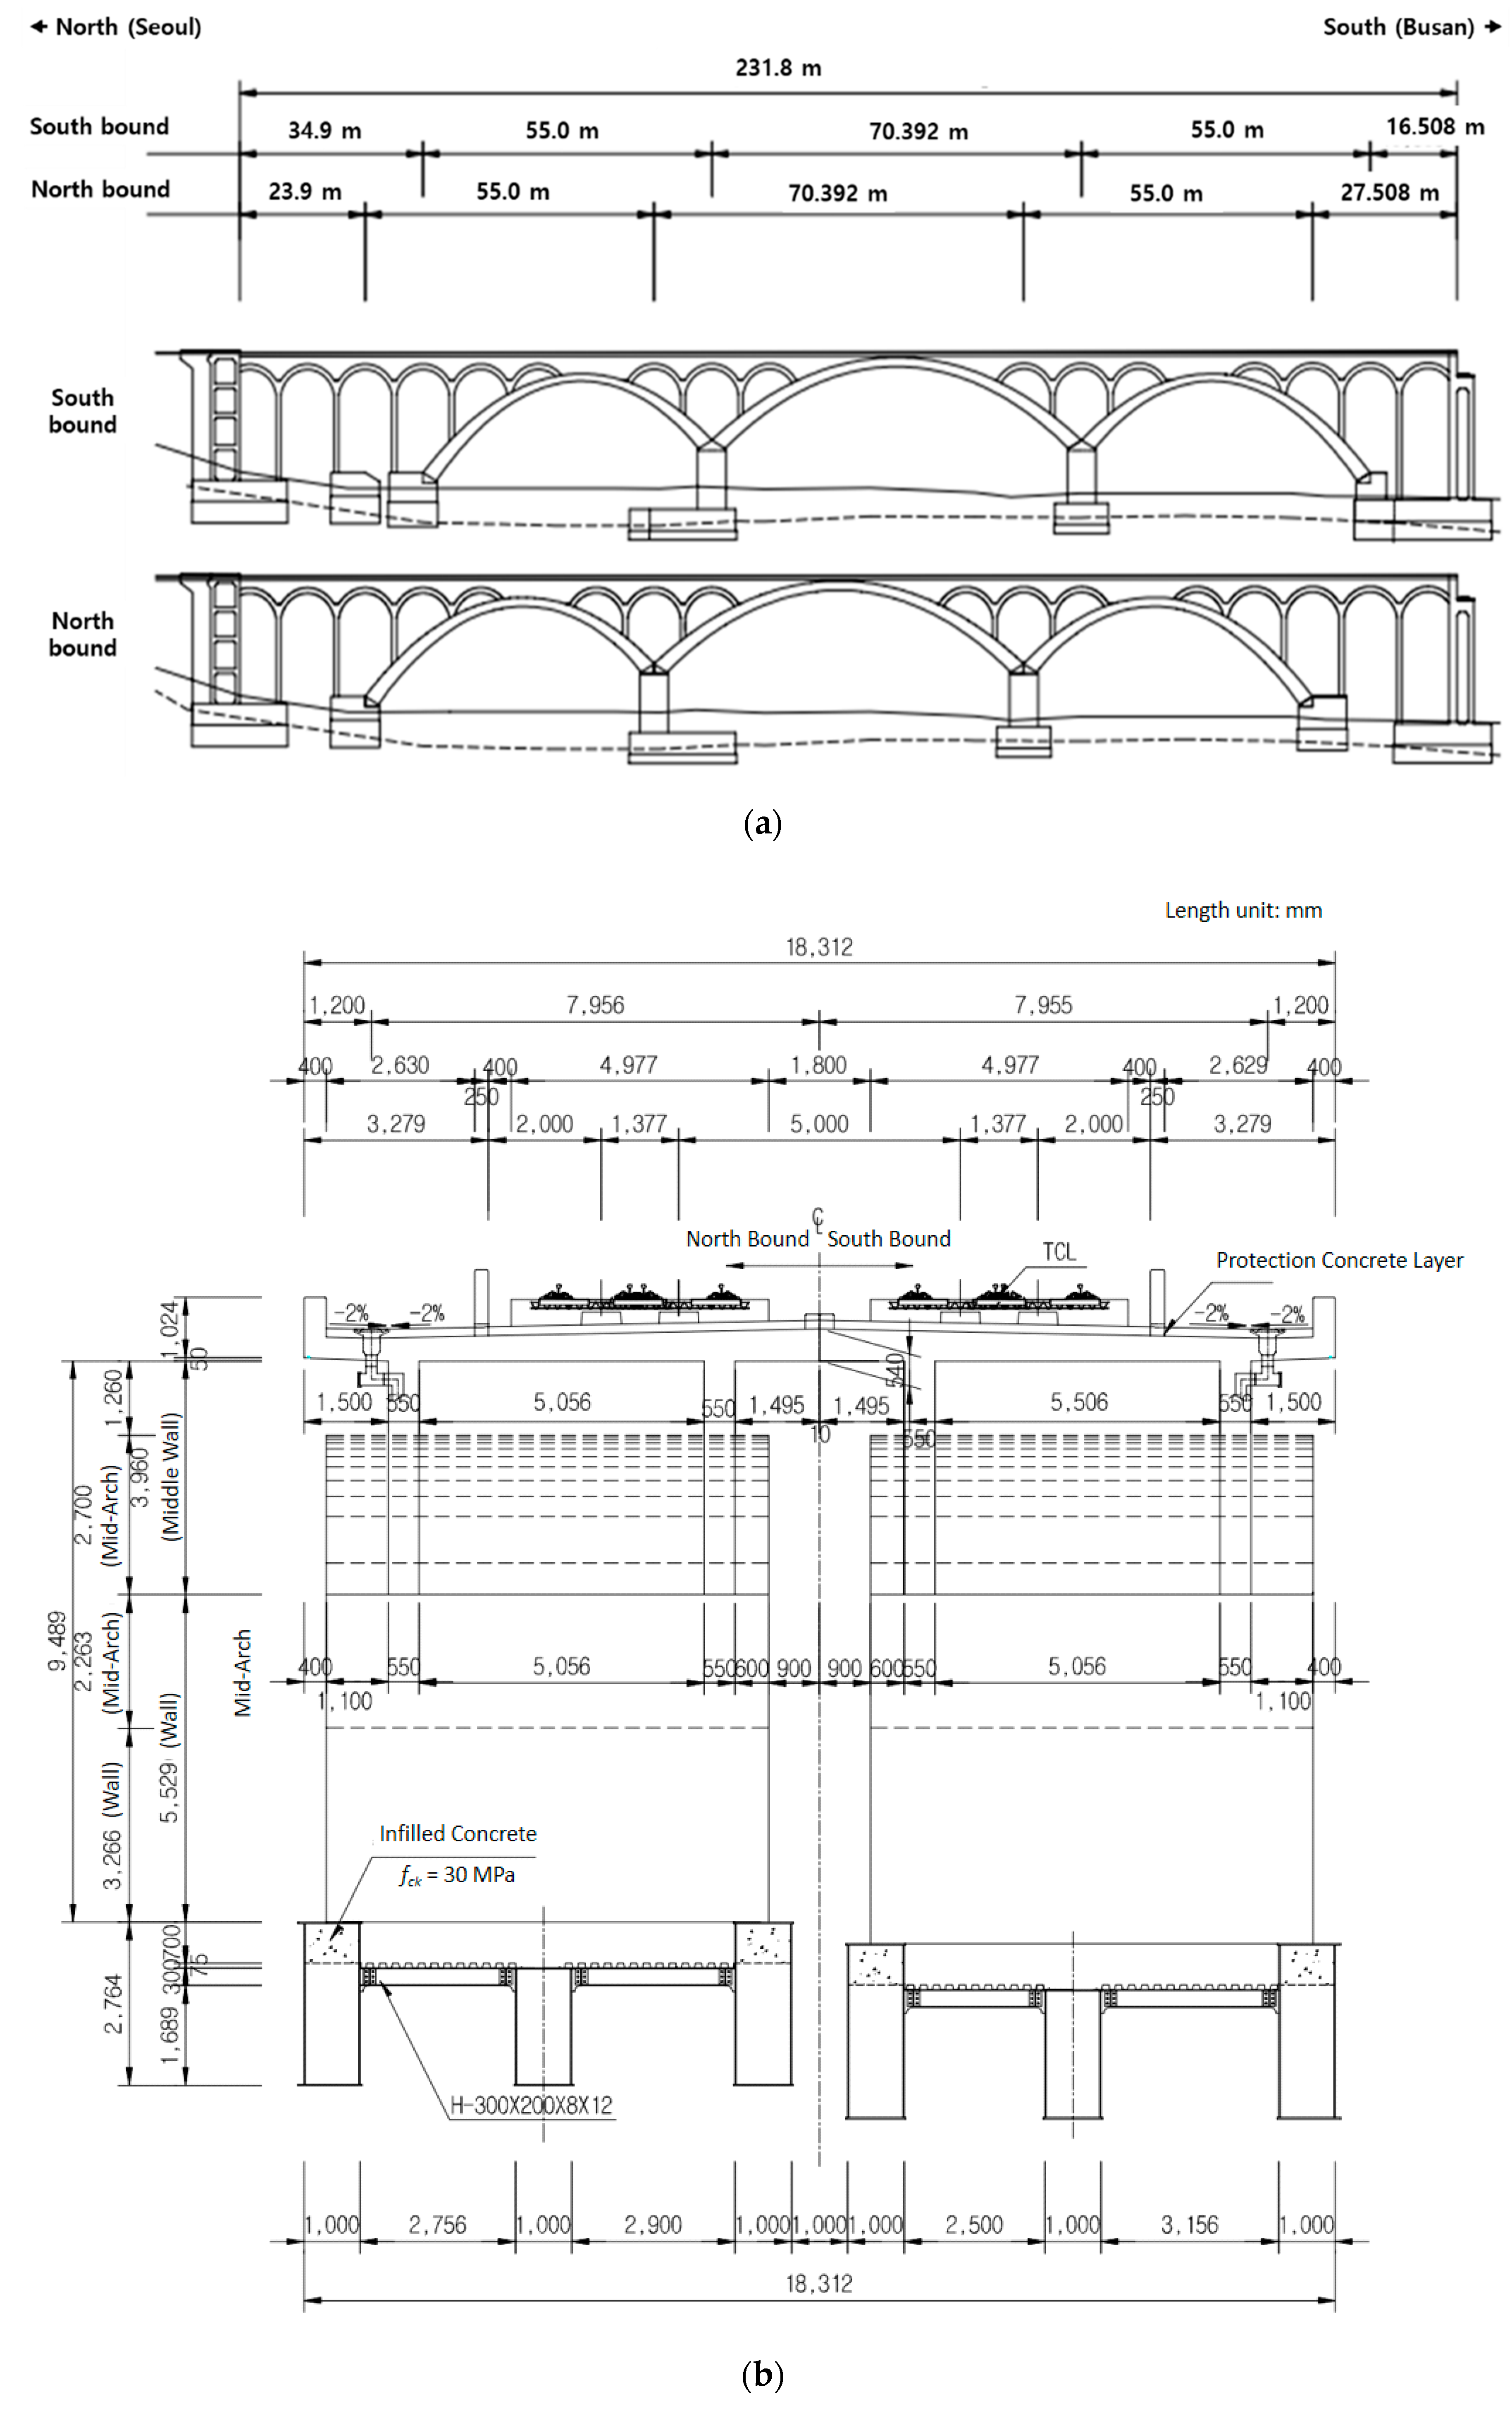
2.1. Test Bridge
2.2. Measurements
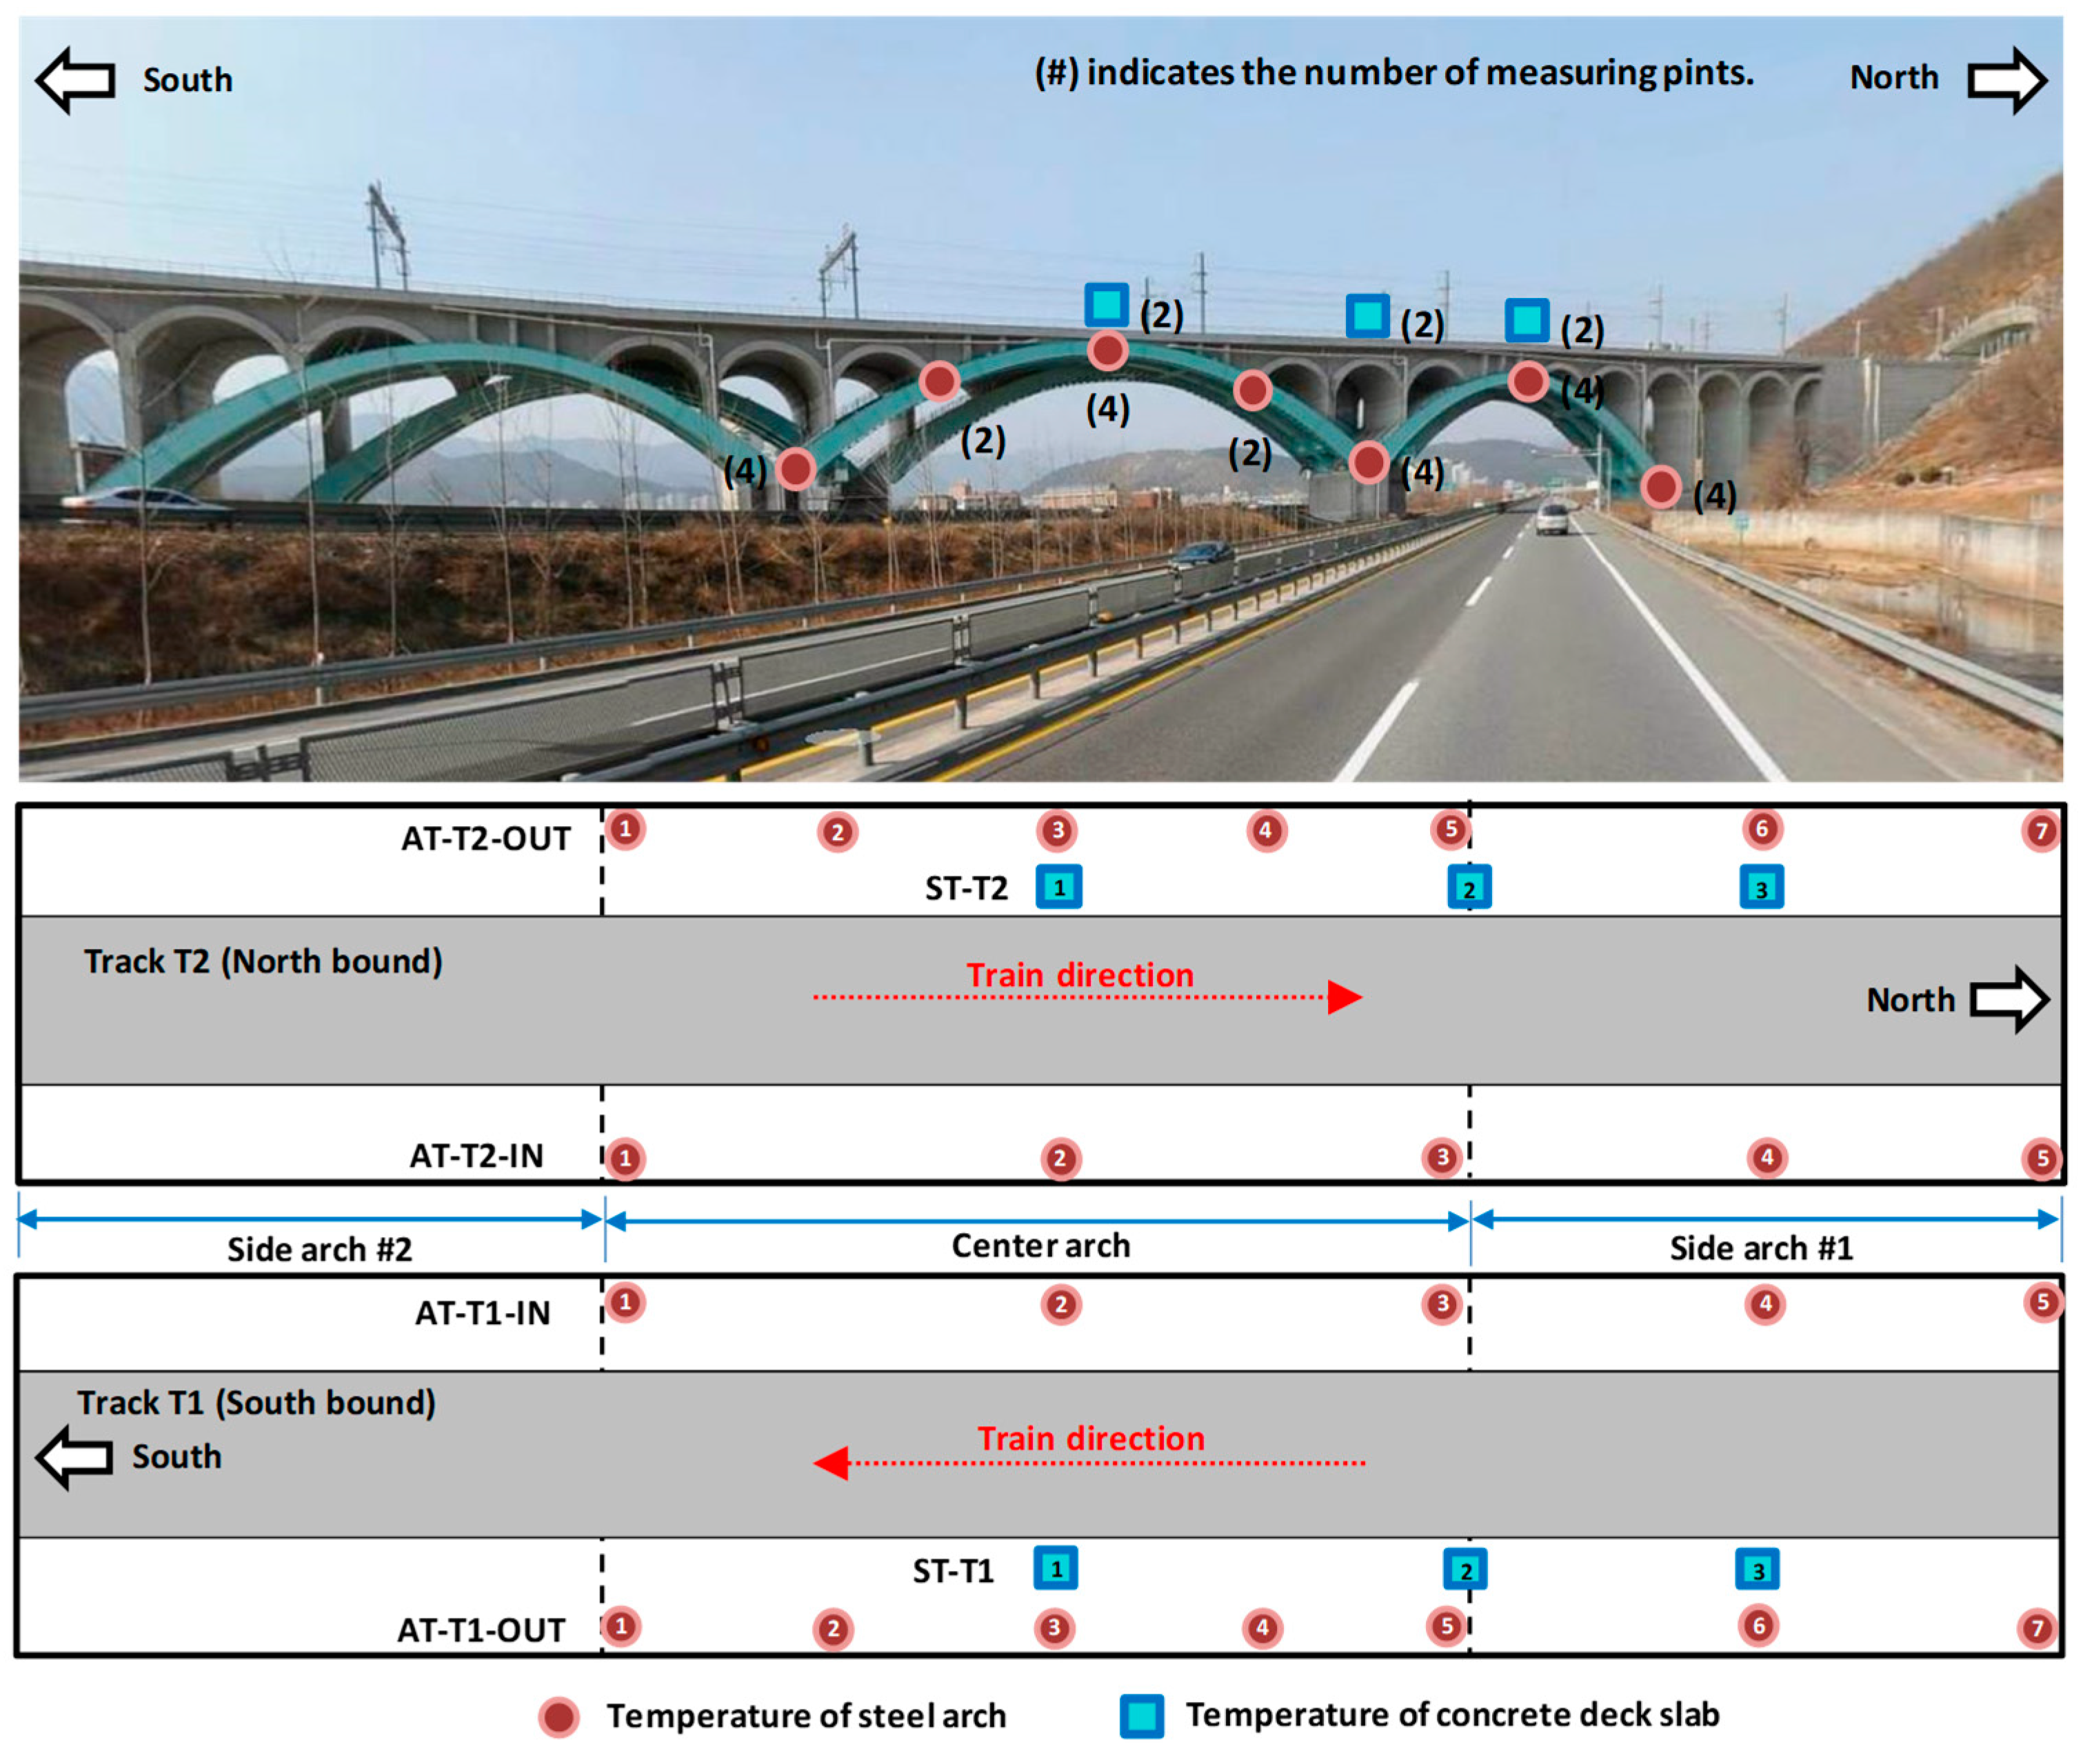
2.2.1. Temperature
2.2.2. Track Geometry
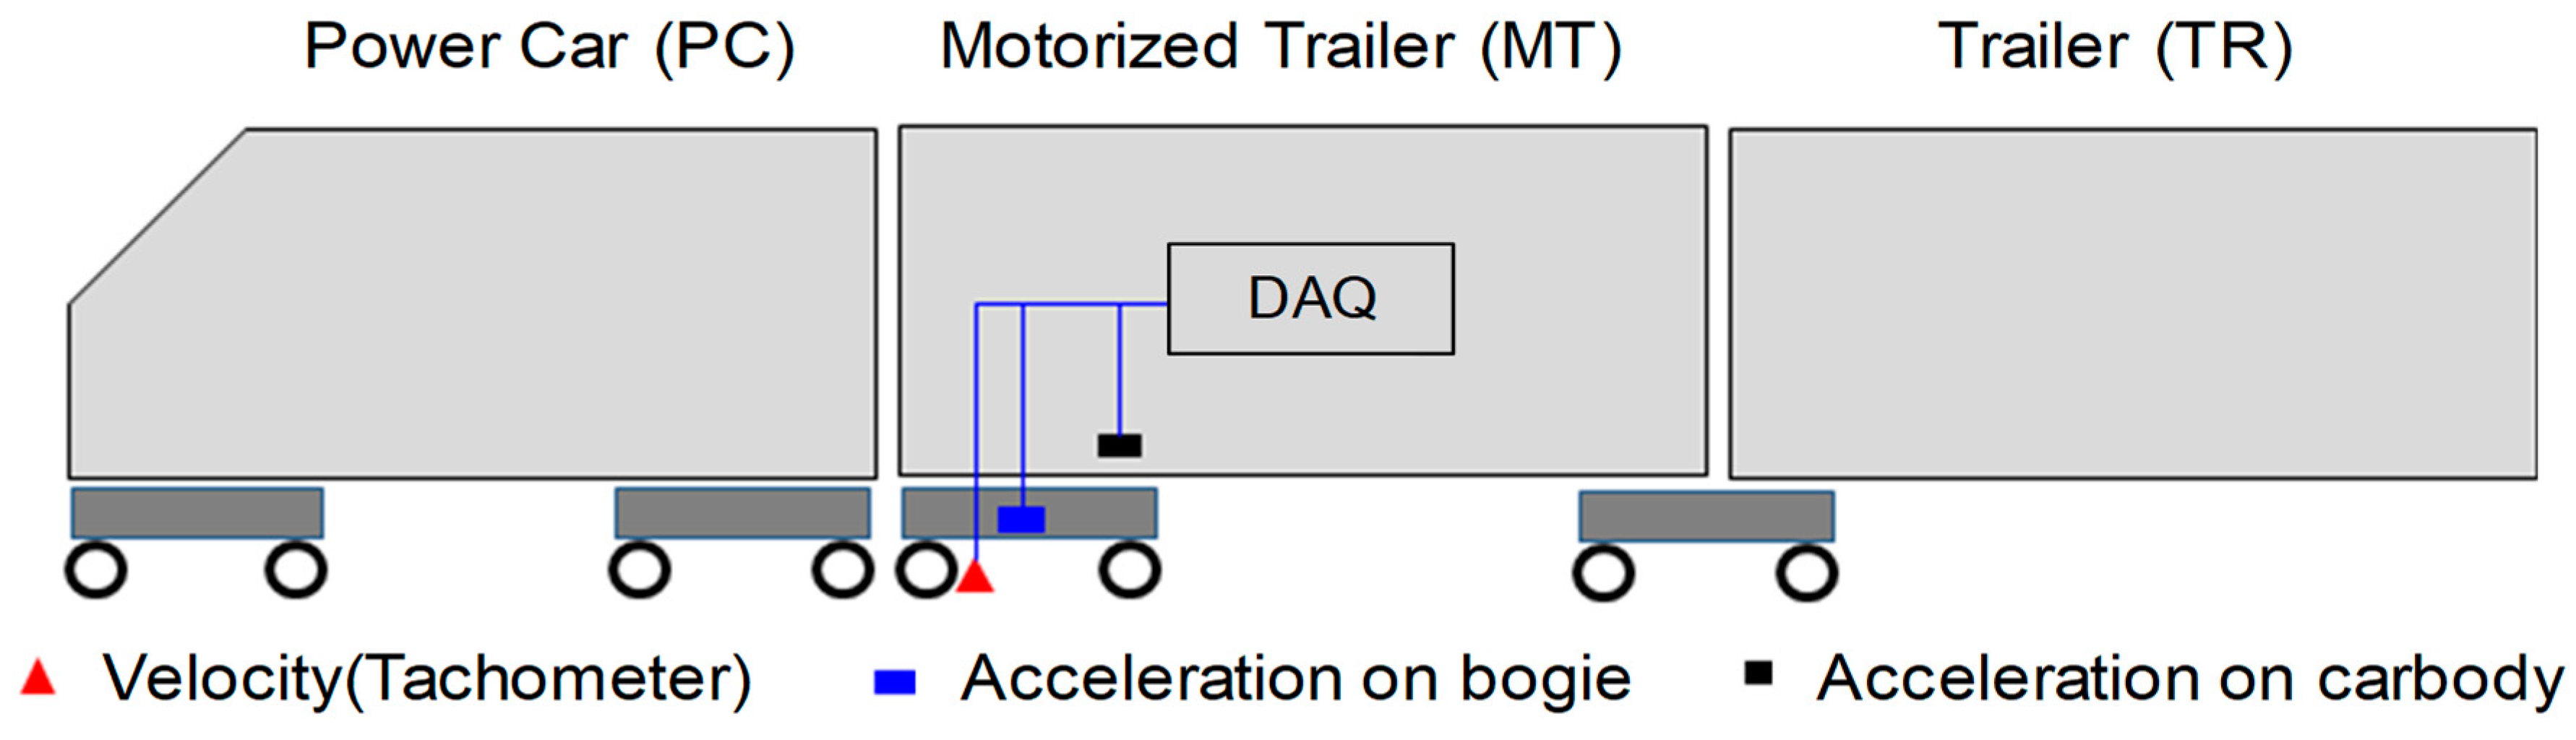
2.3. Accelerations of Running Trains and Bridge
3. Results
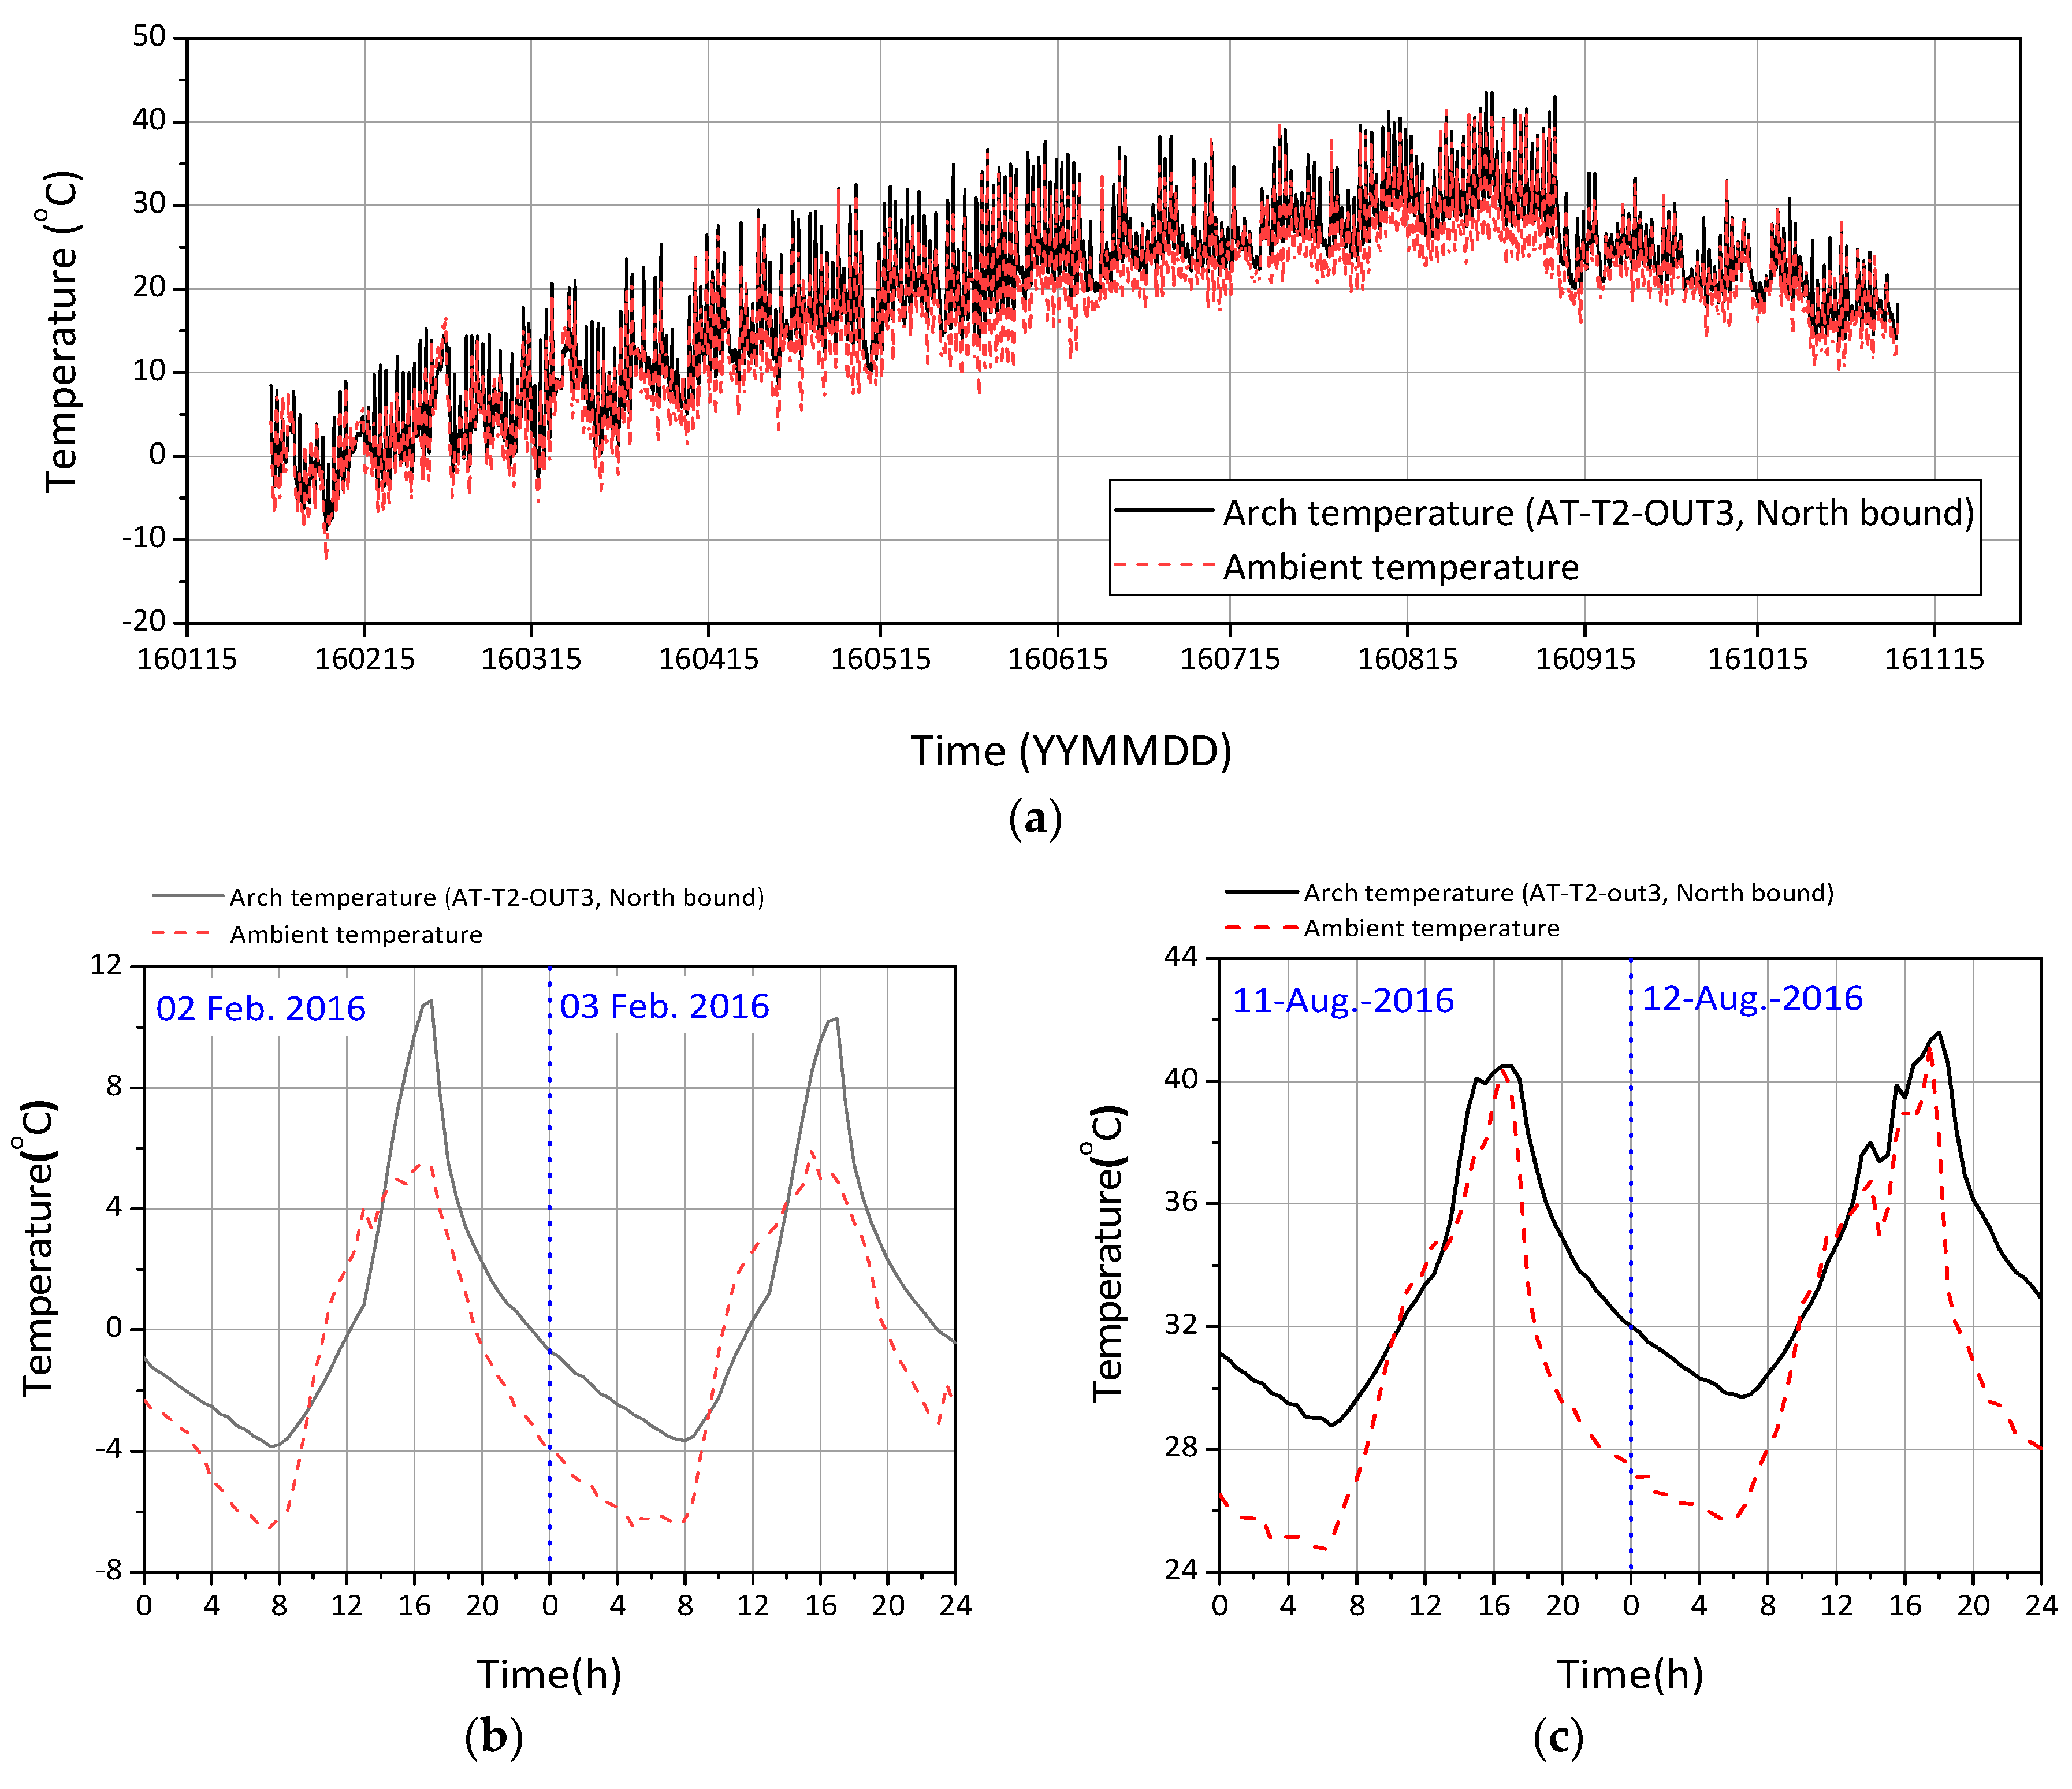
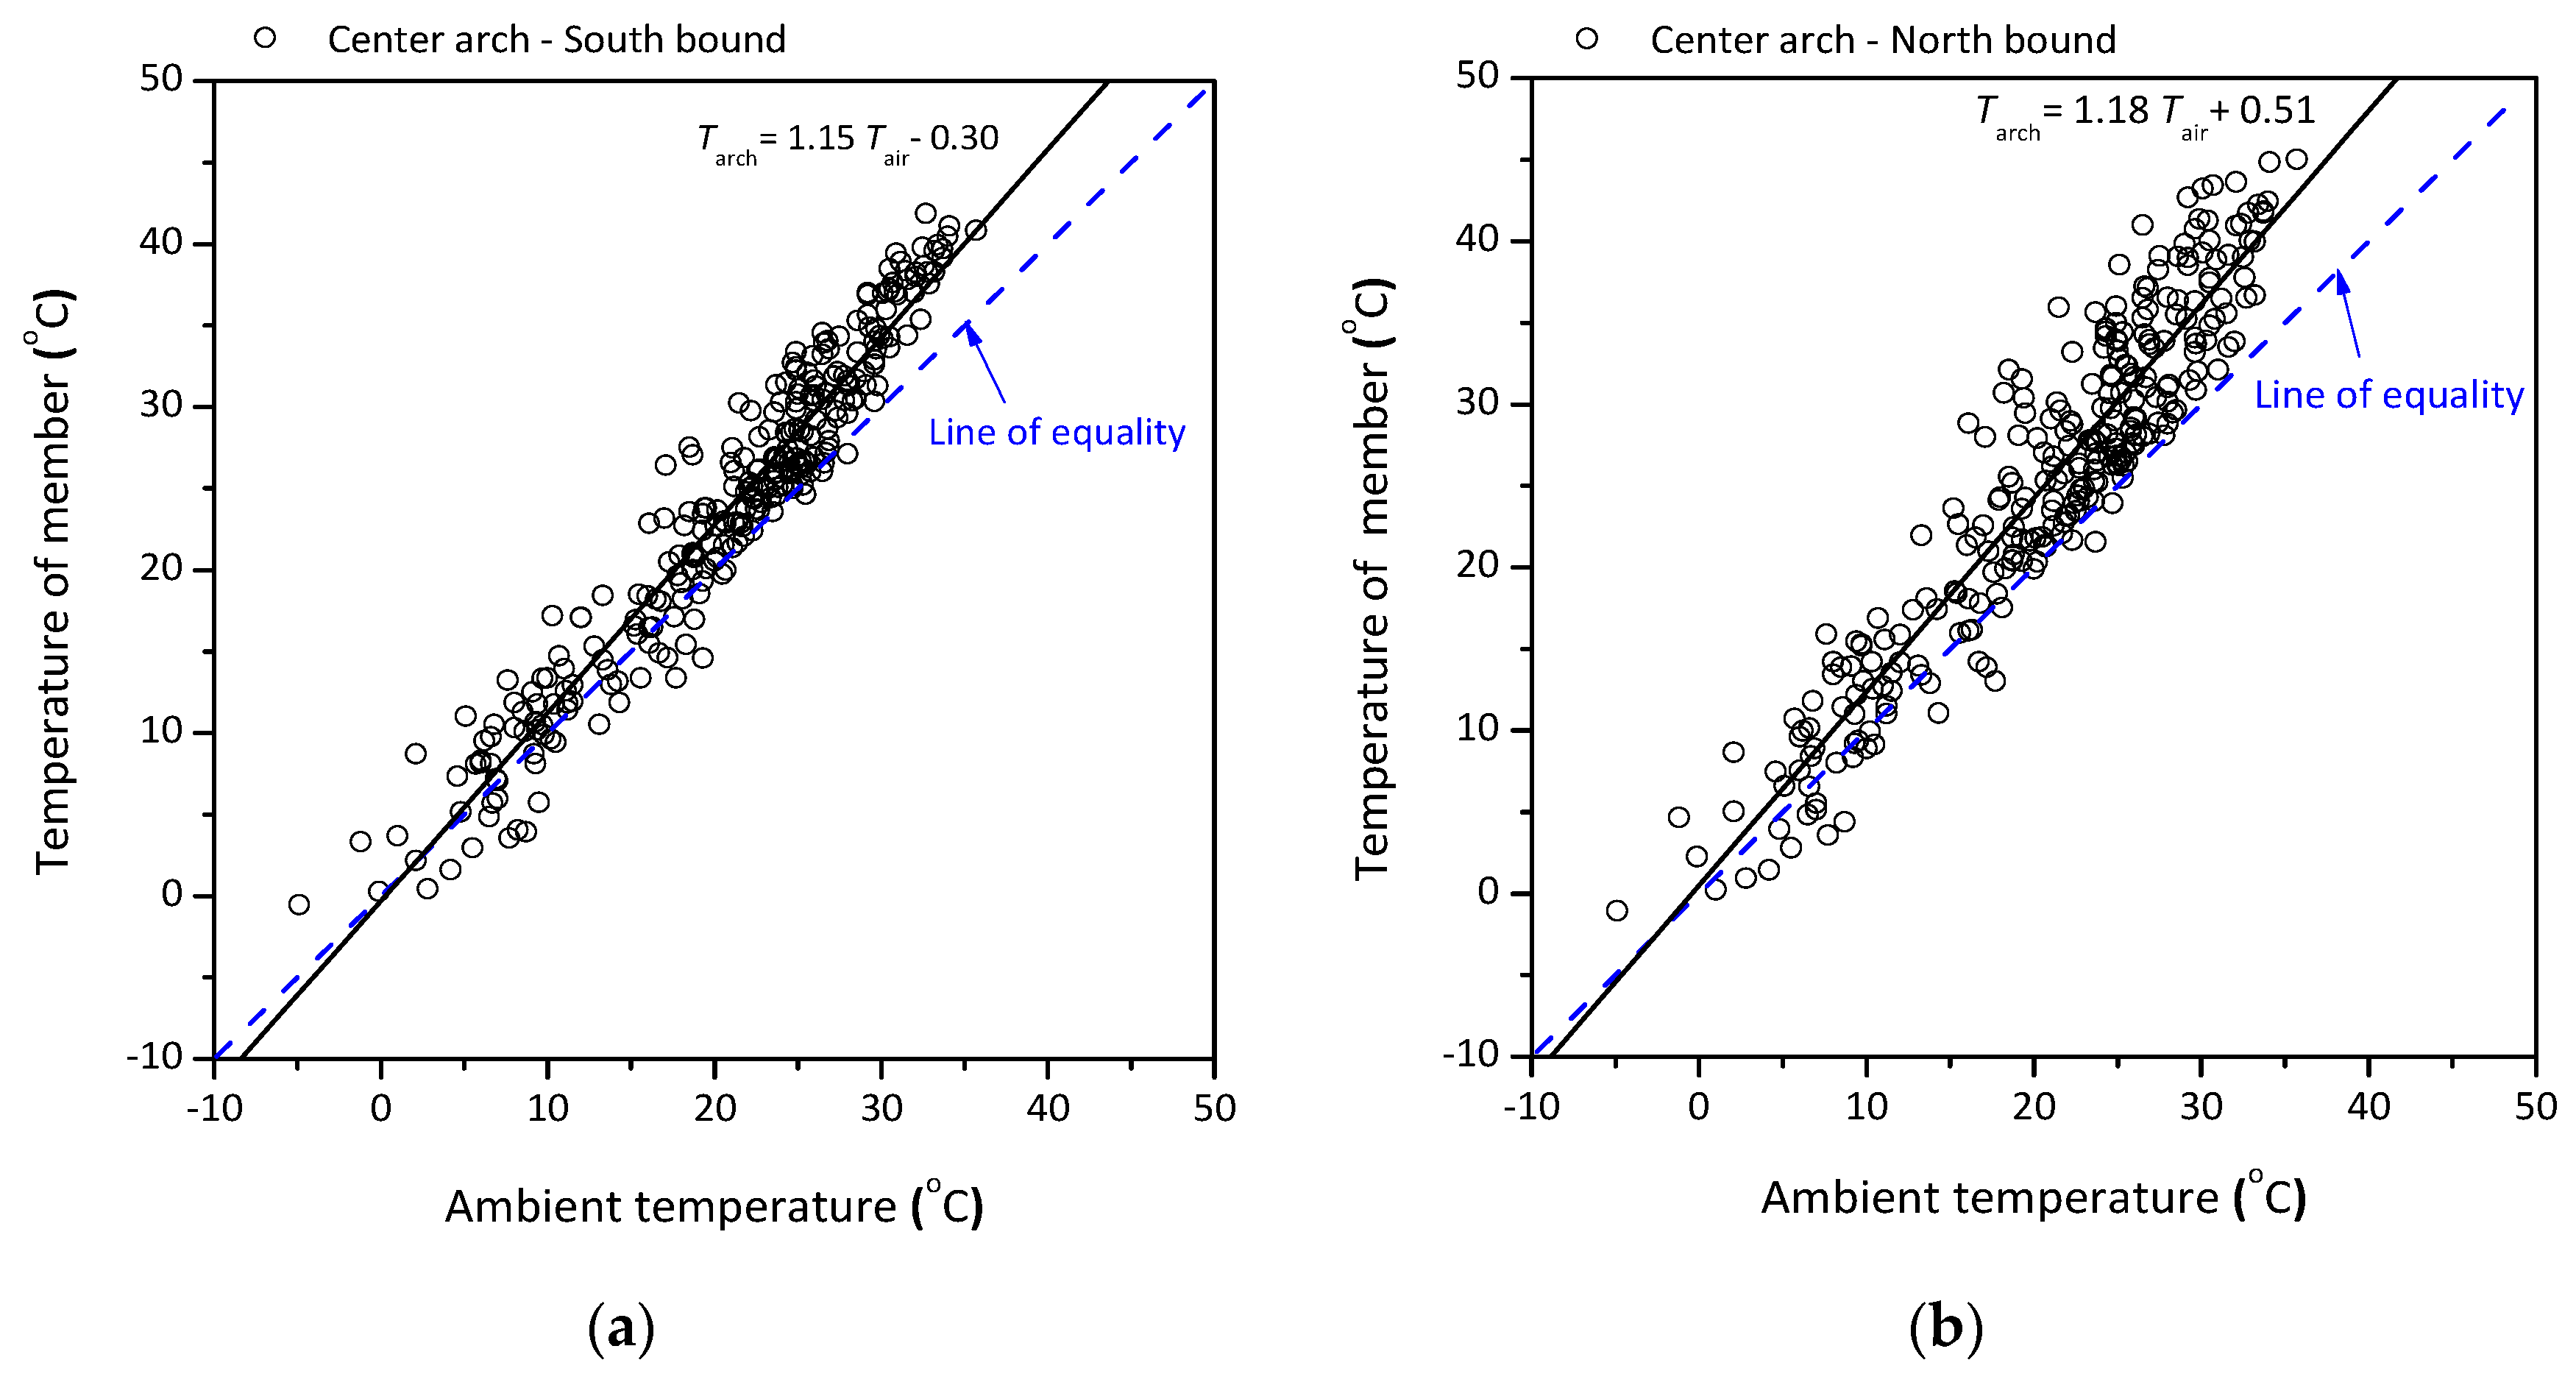
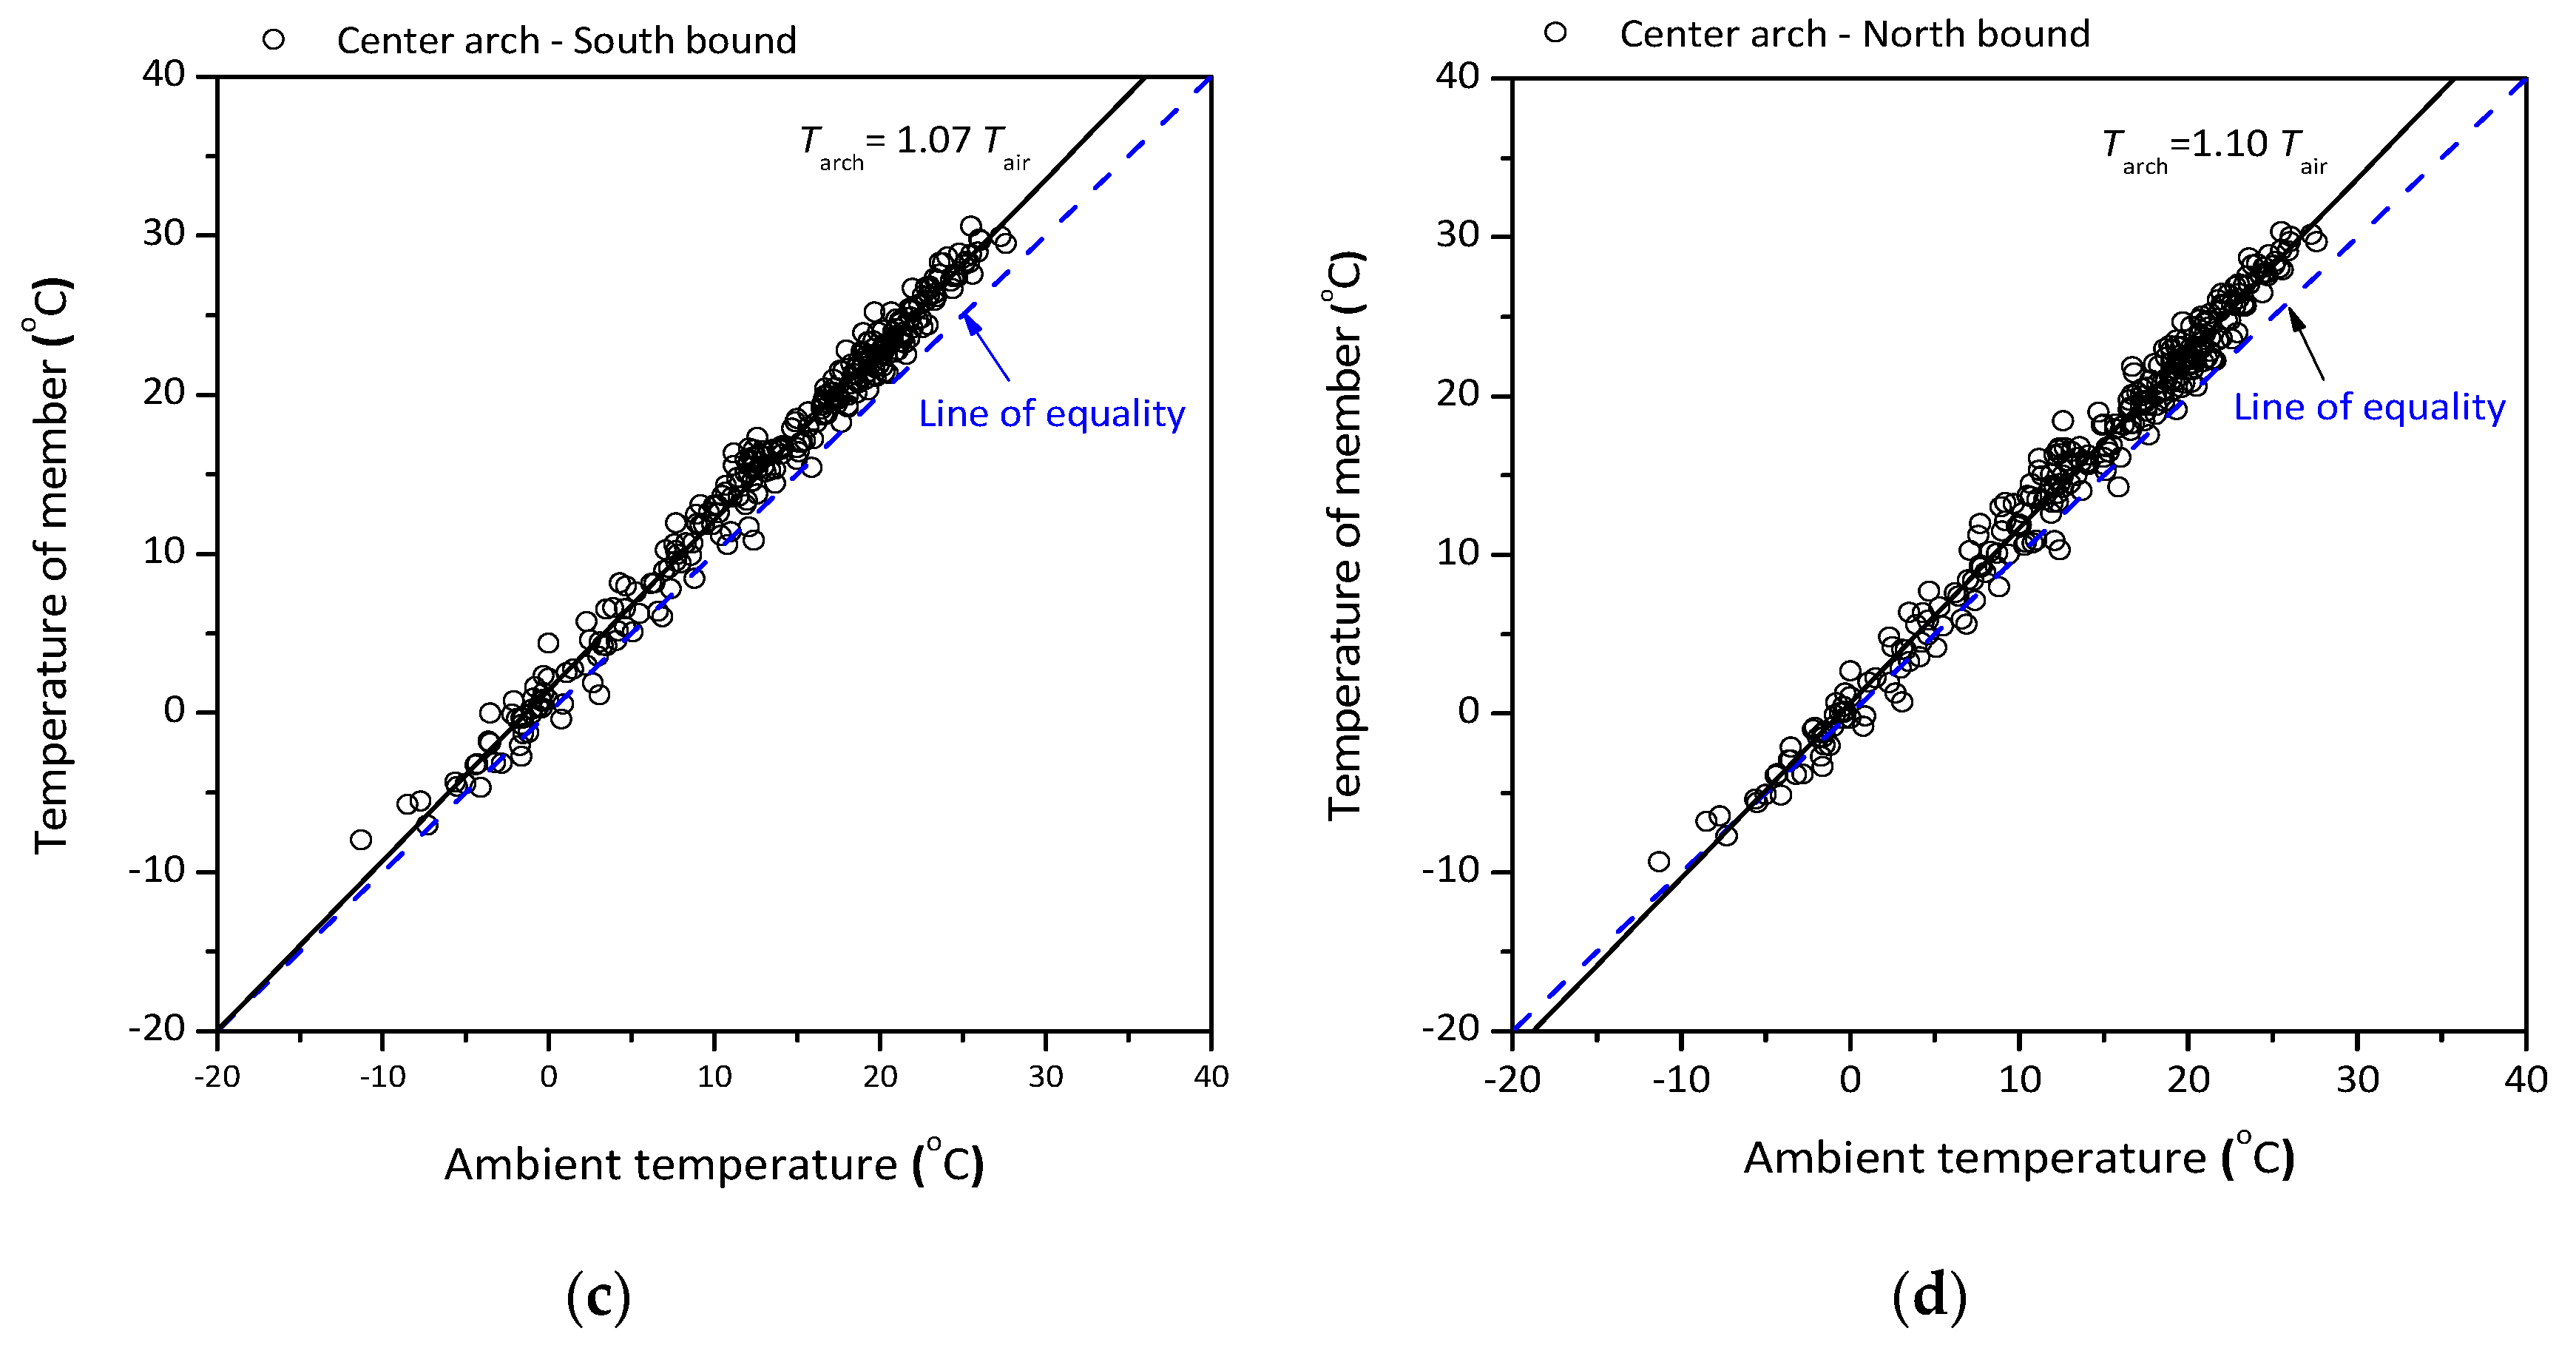
3.1. Temperature
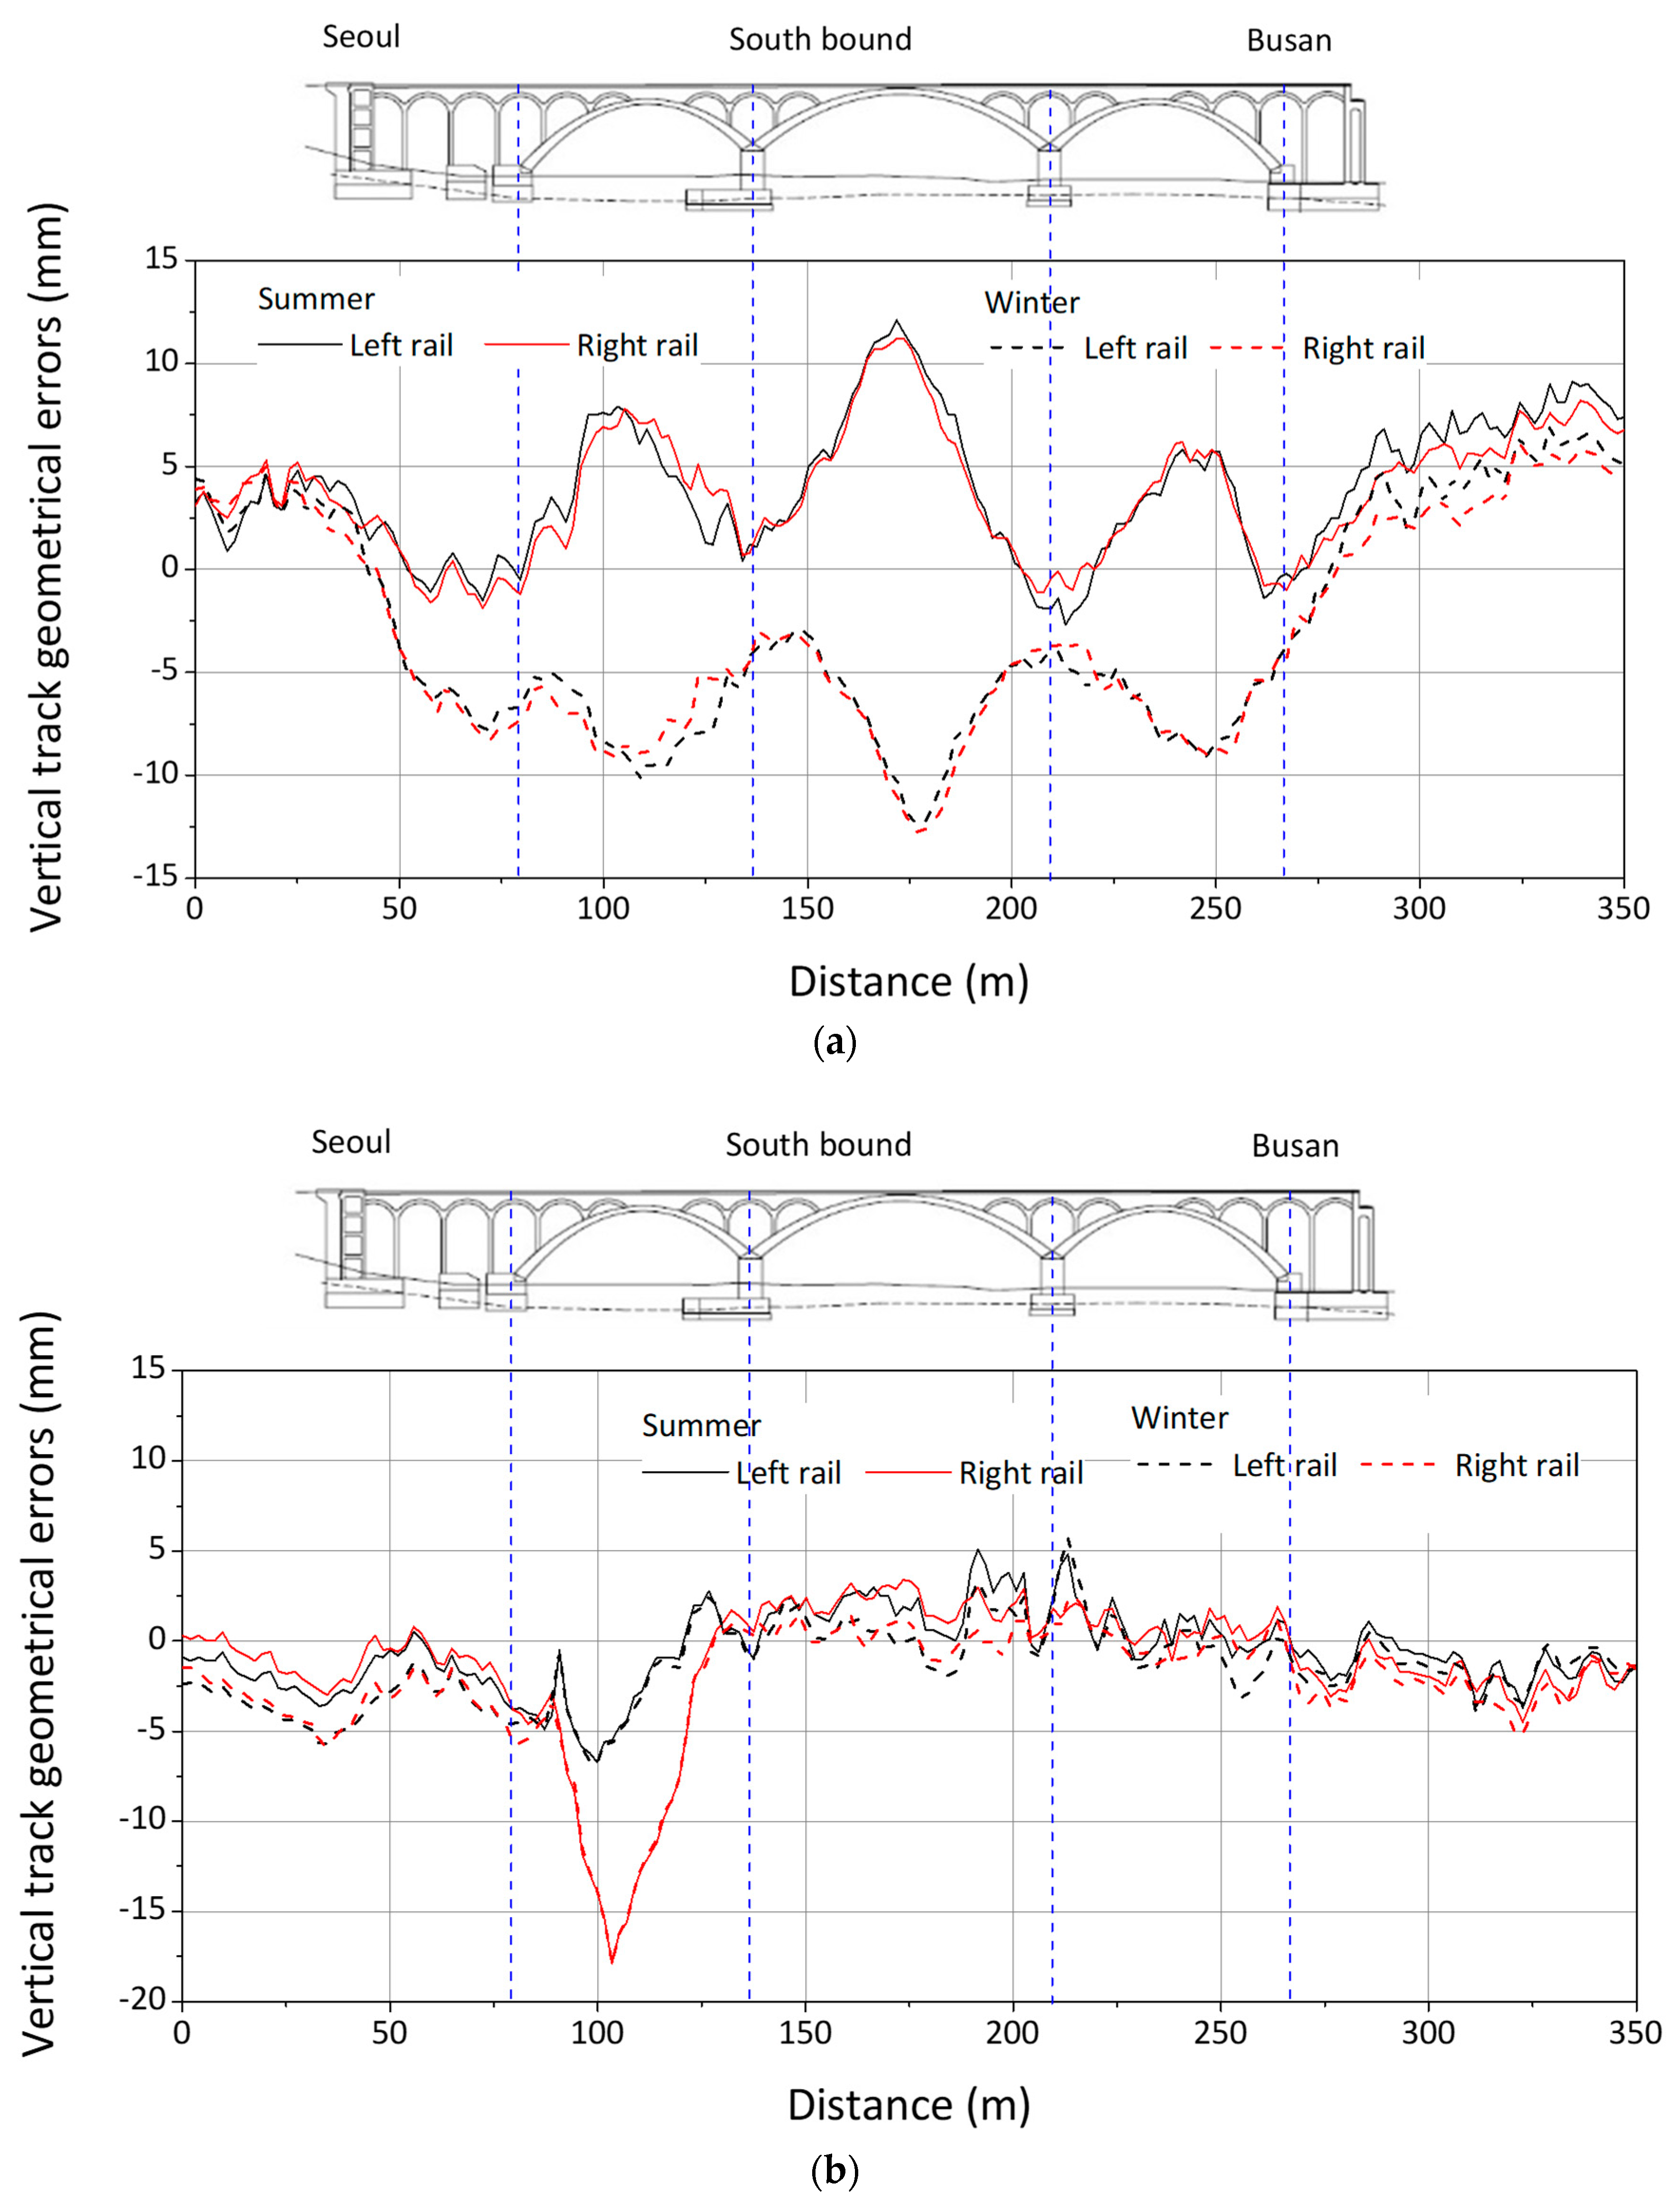
3.2. Track Geometry
3.3. Accelerations
4. Discussion
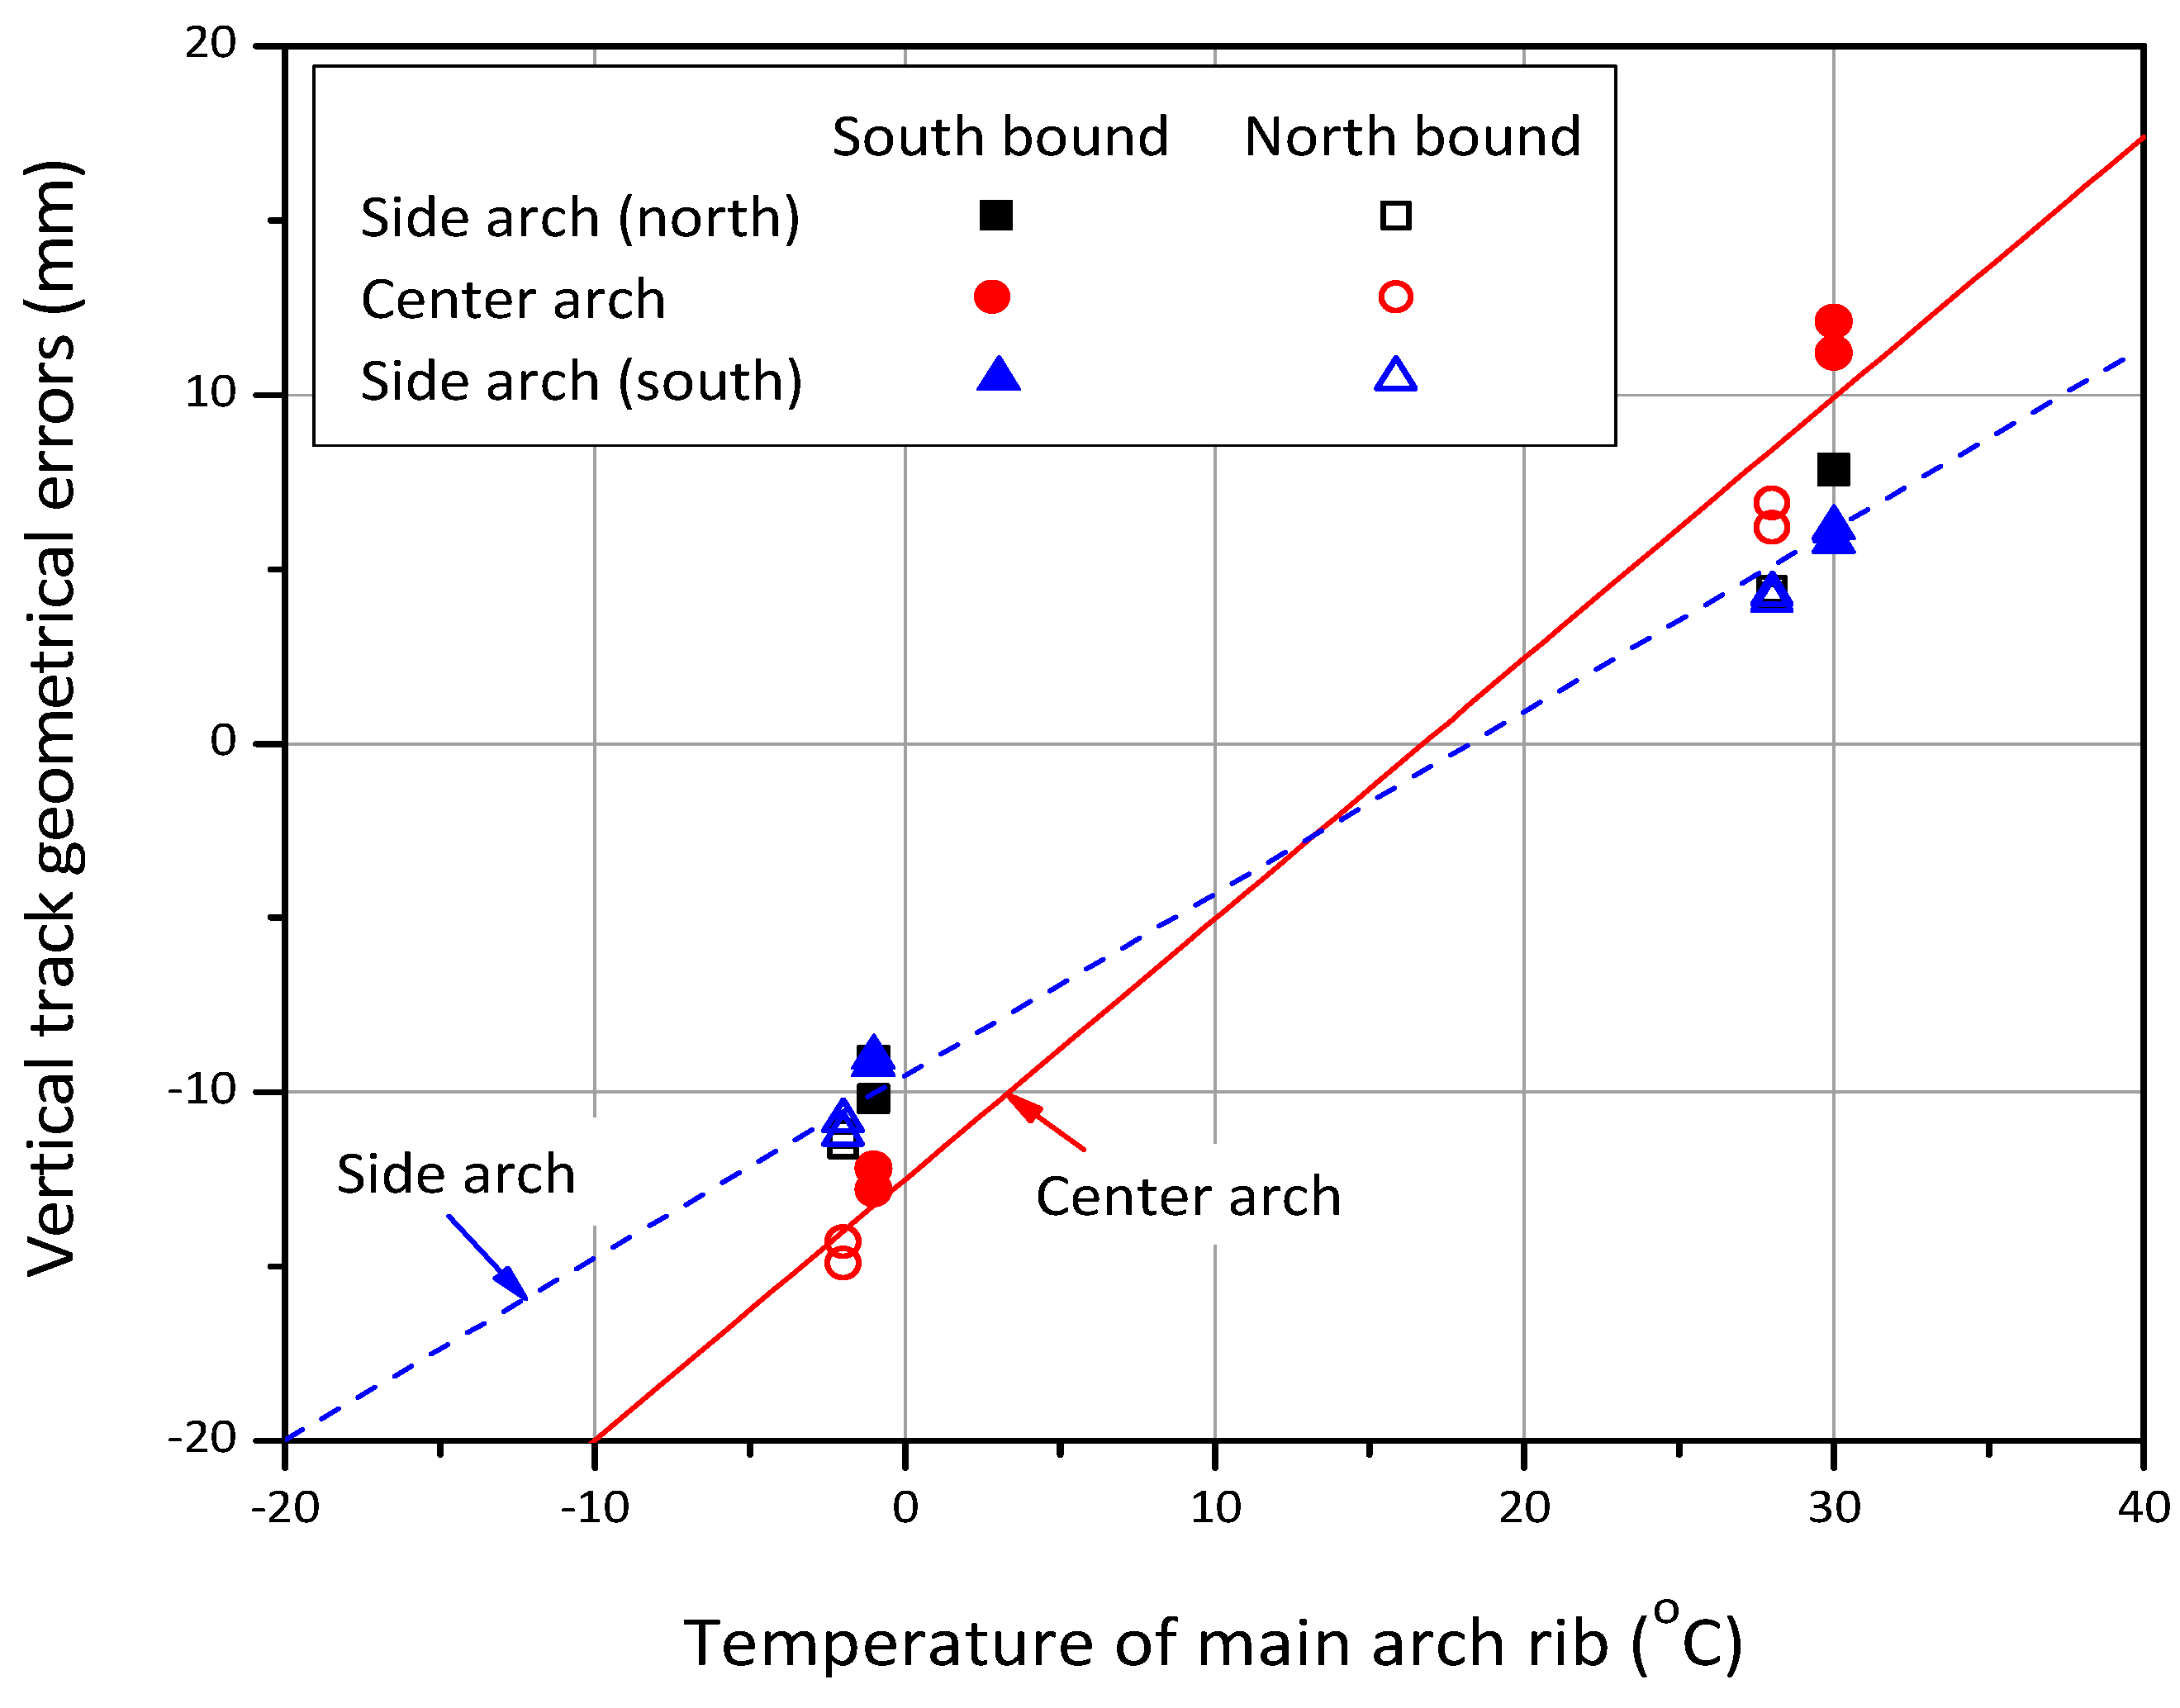
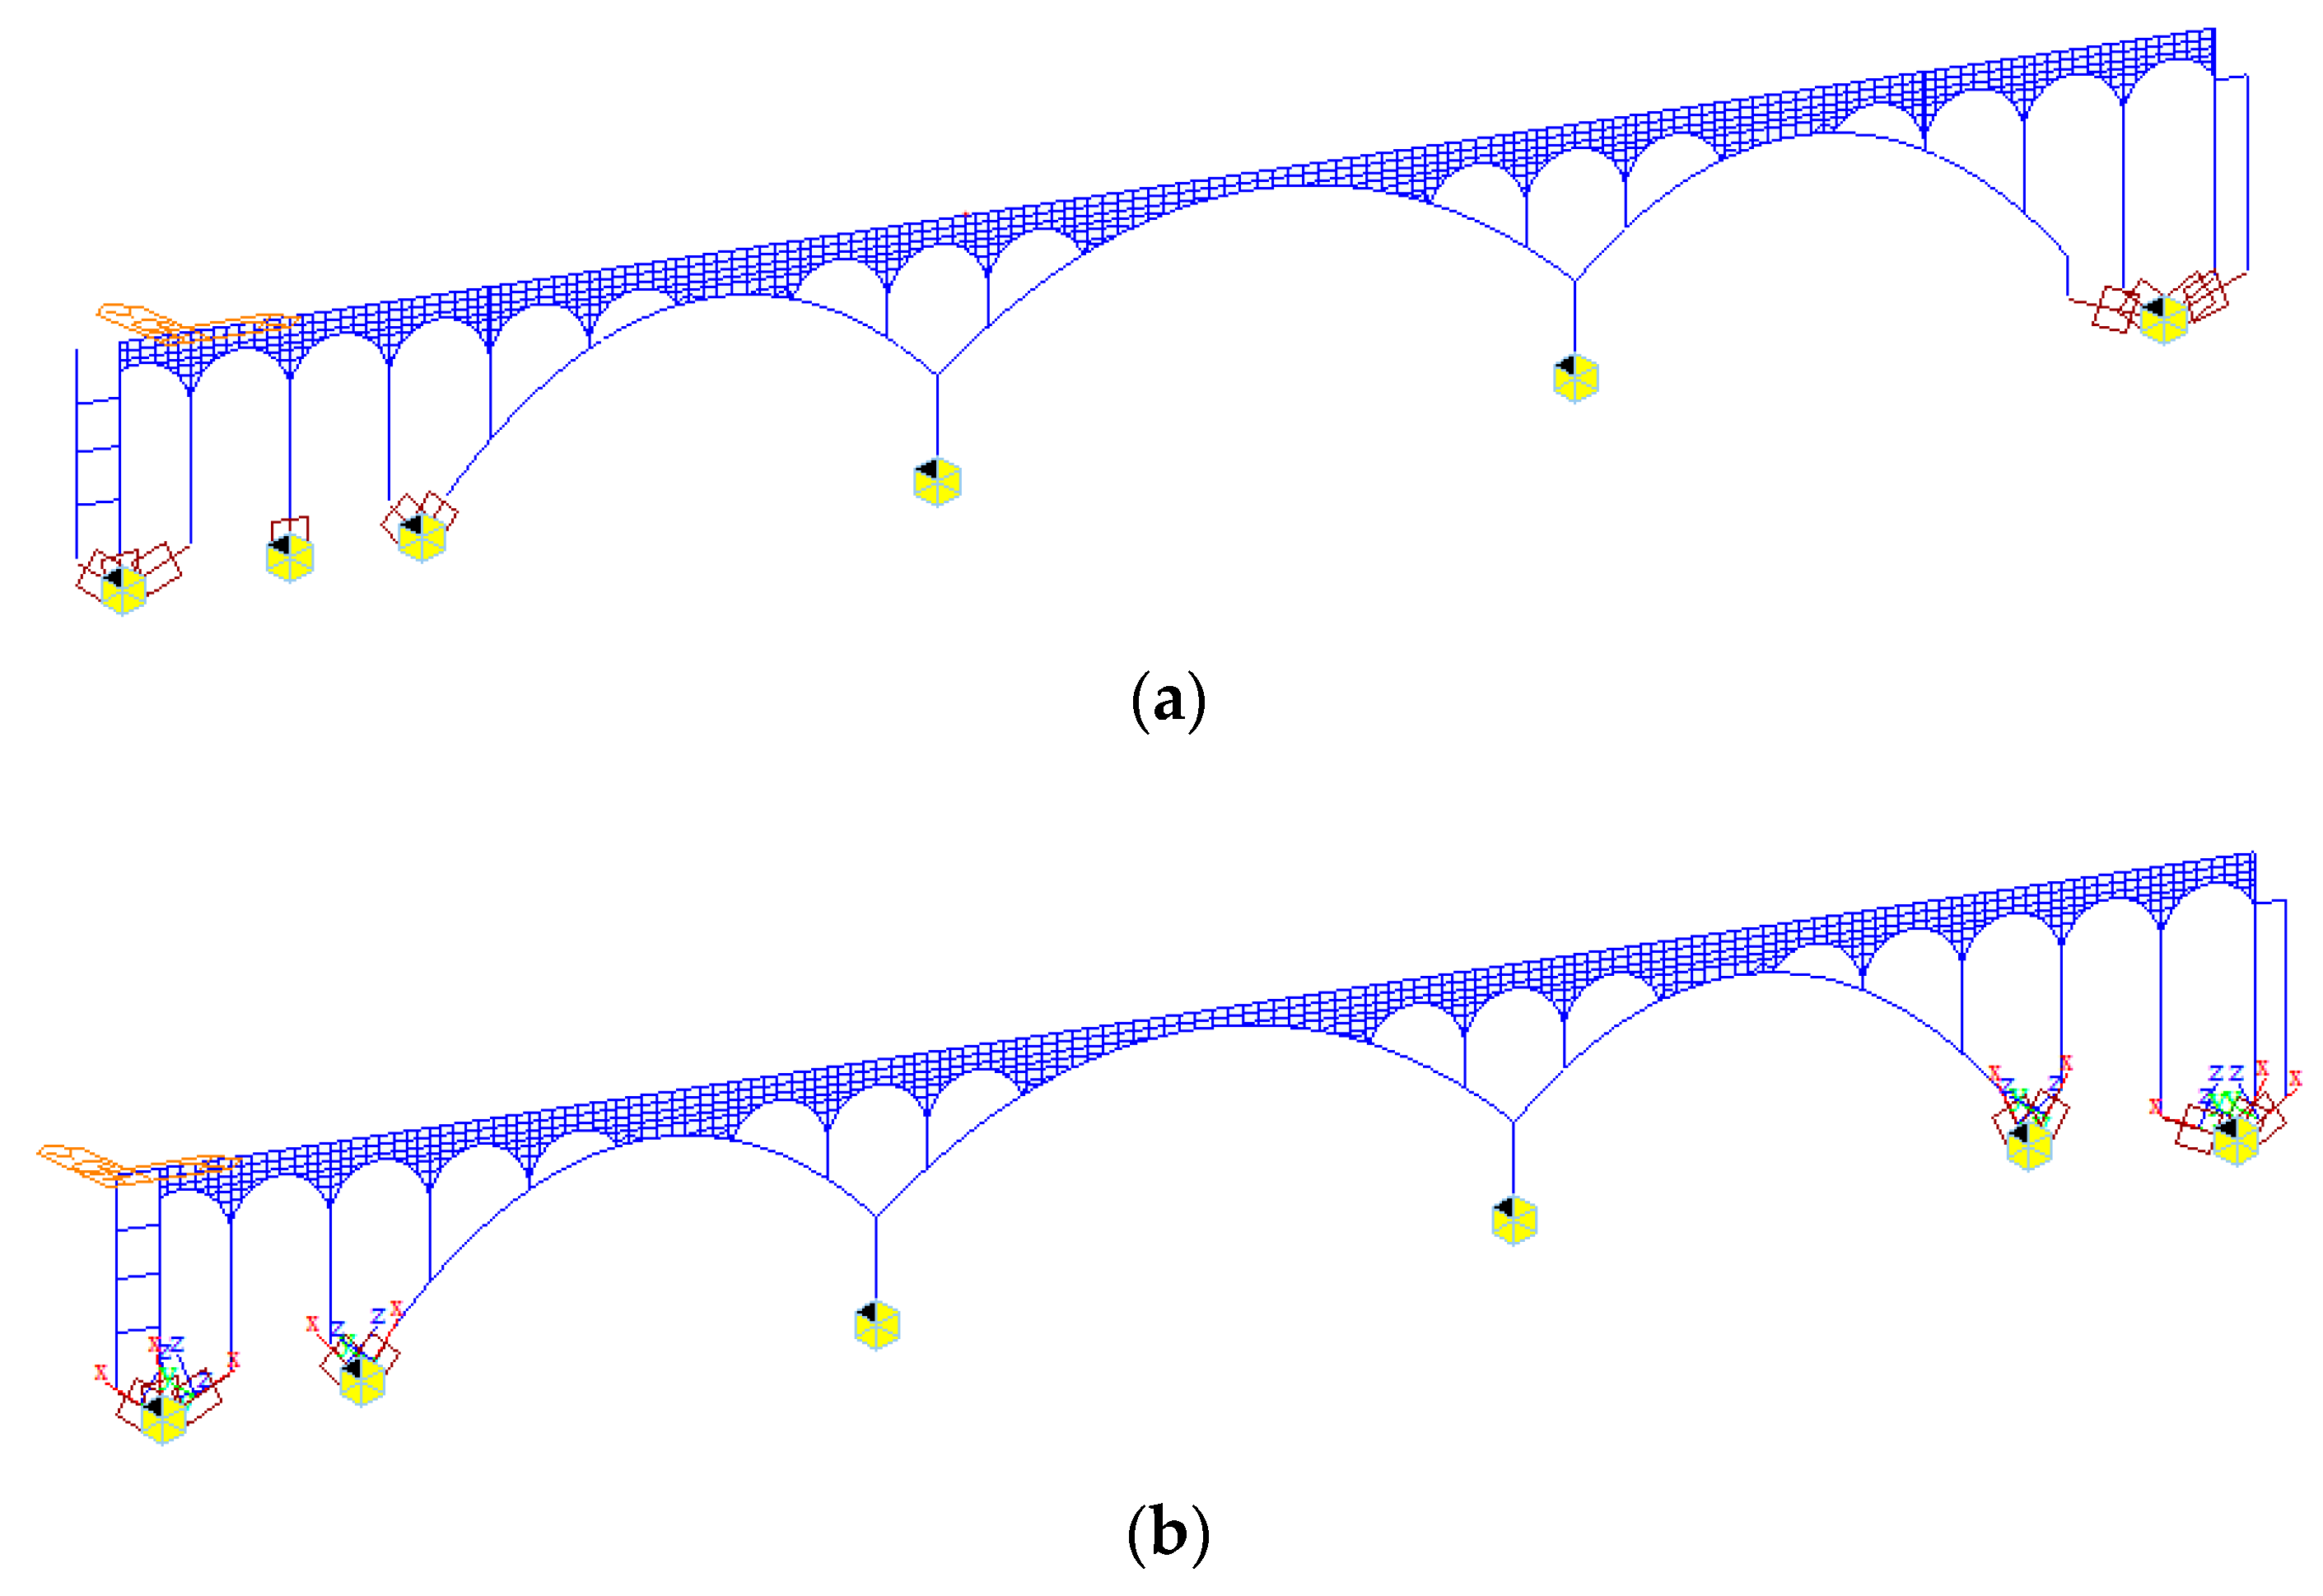
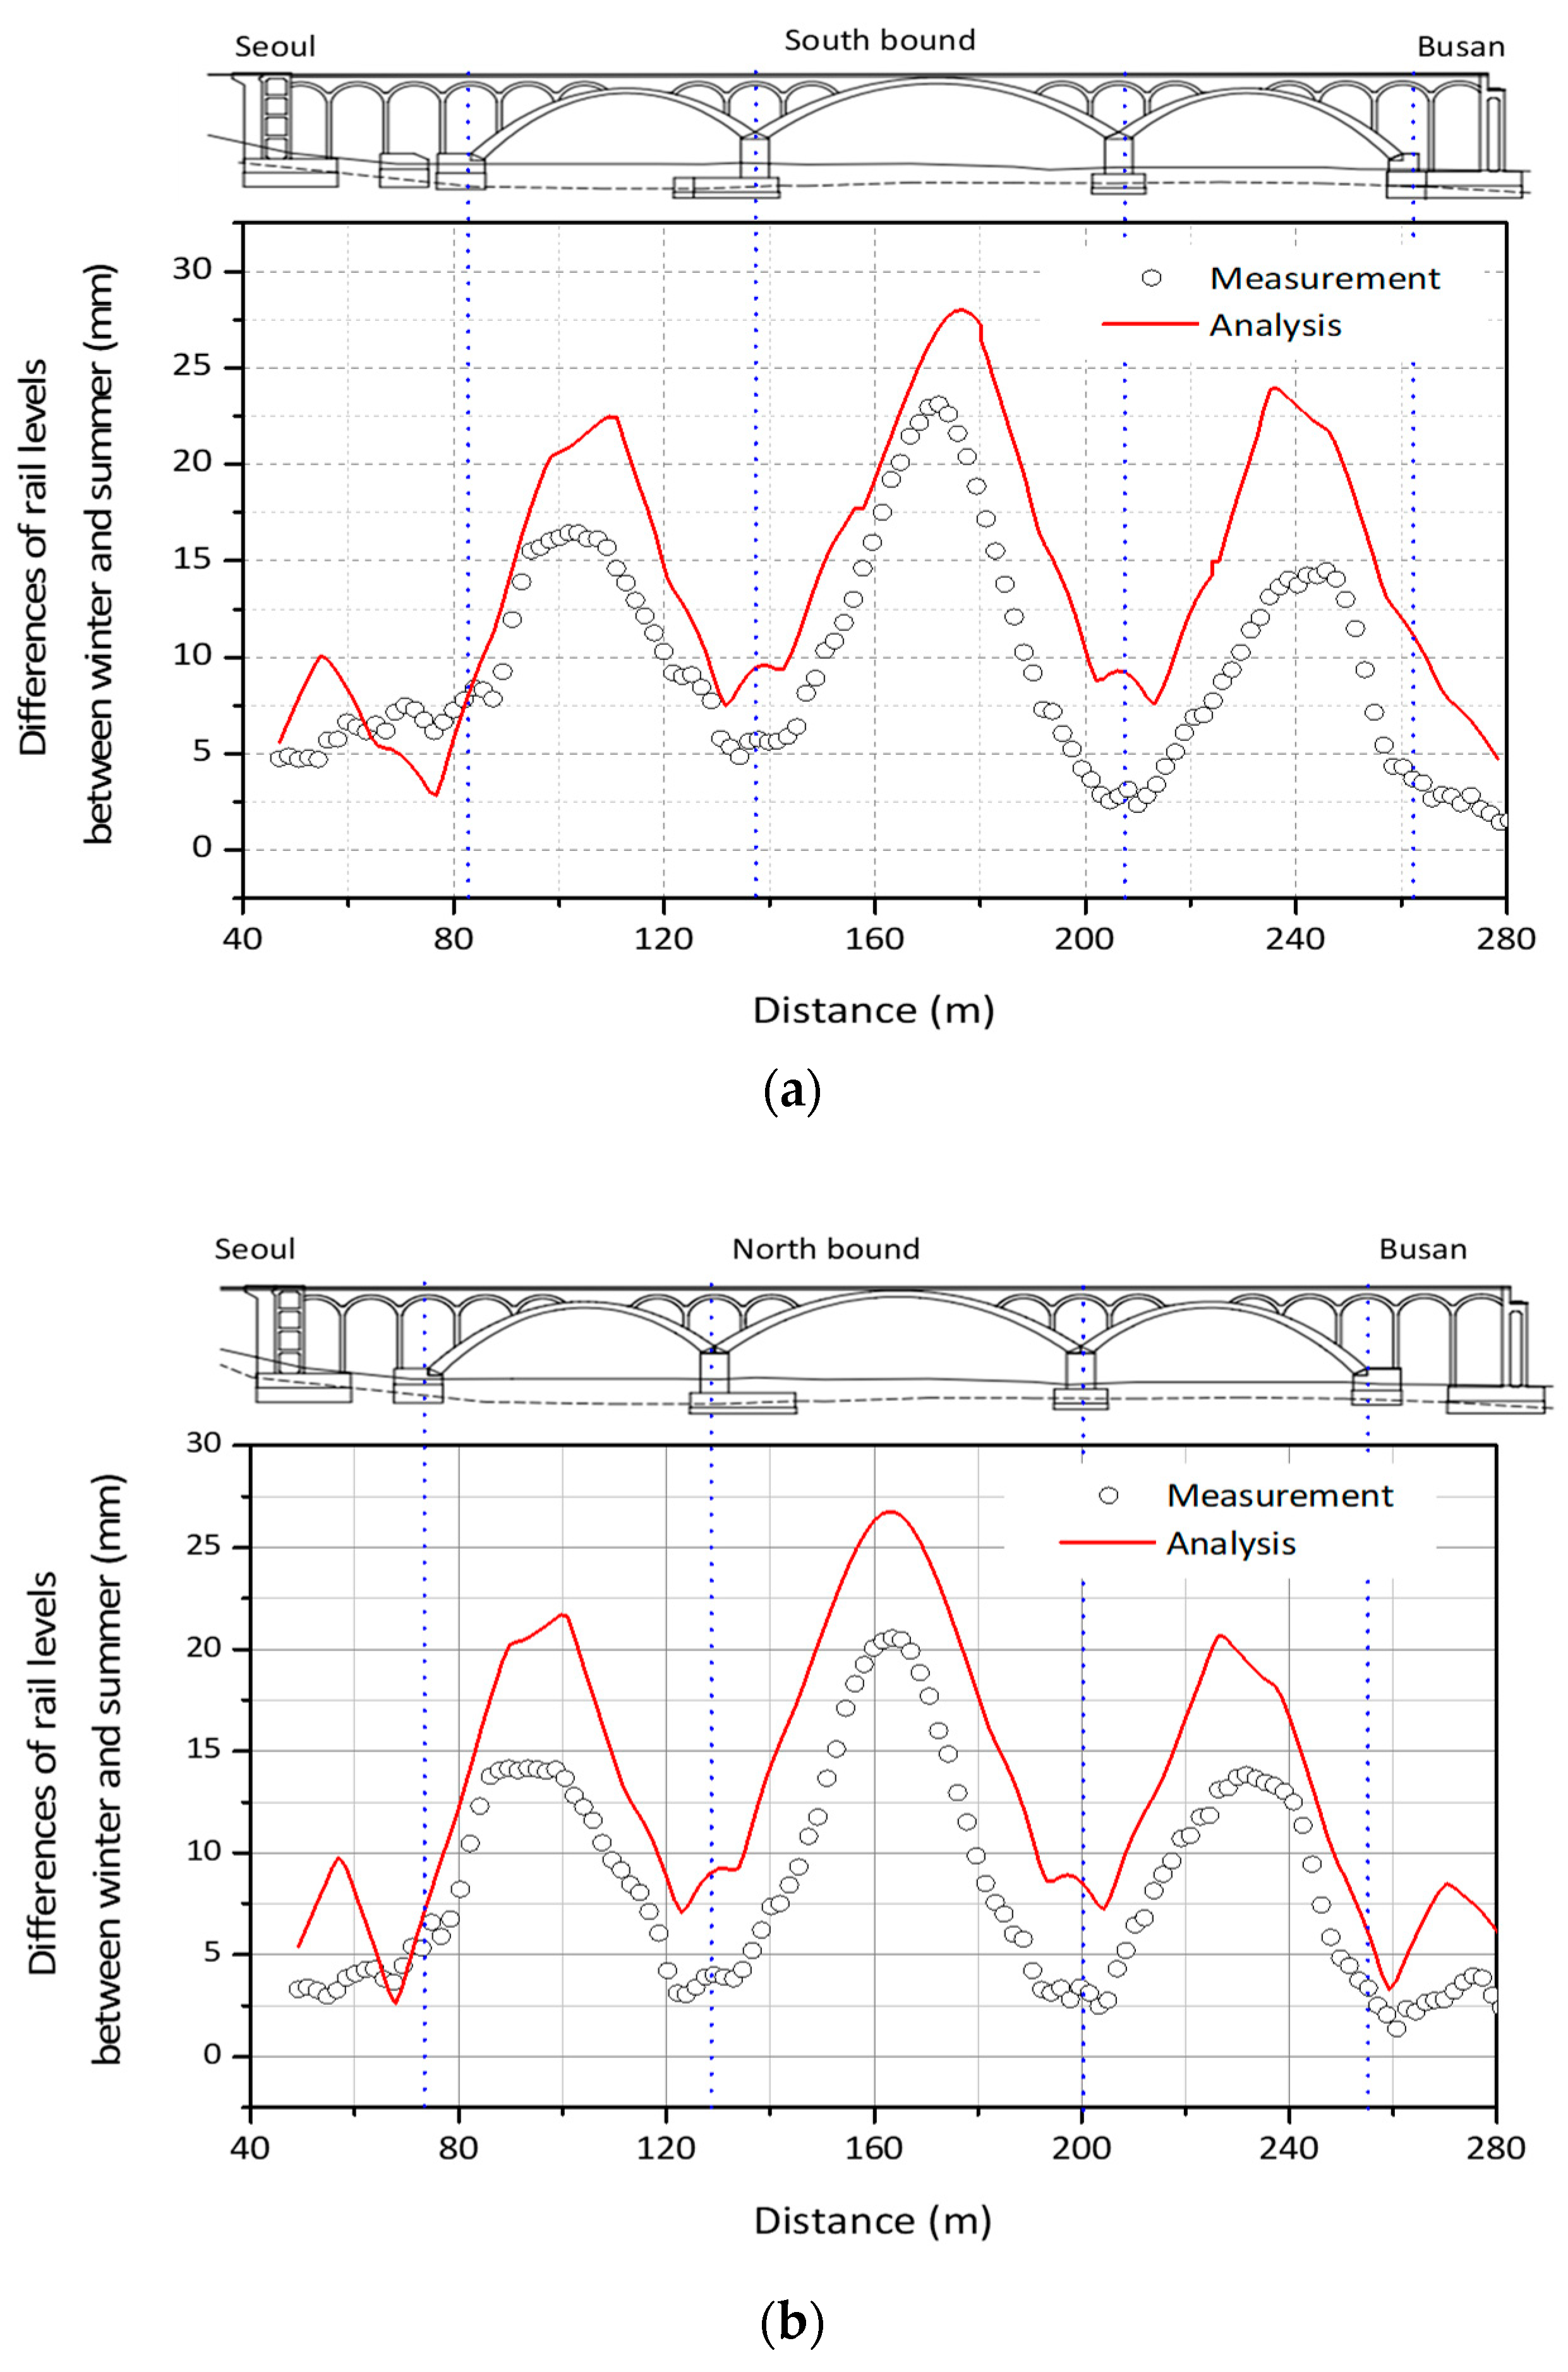
4.1. Validation of Causes of Vertical Deformation of Bridge Superstructure
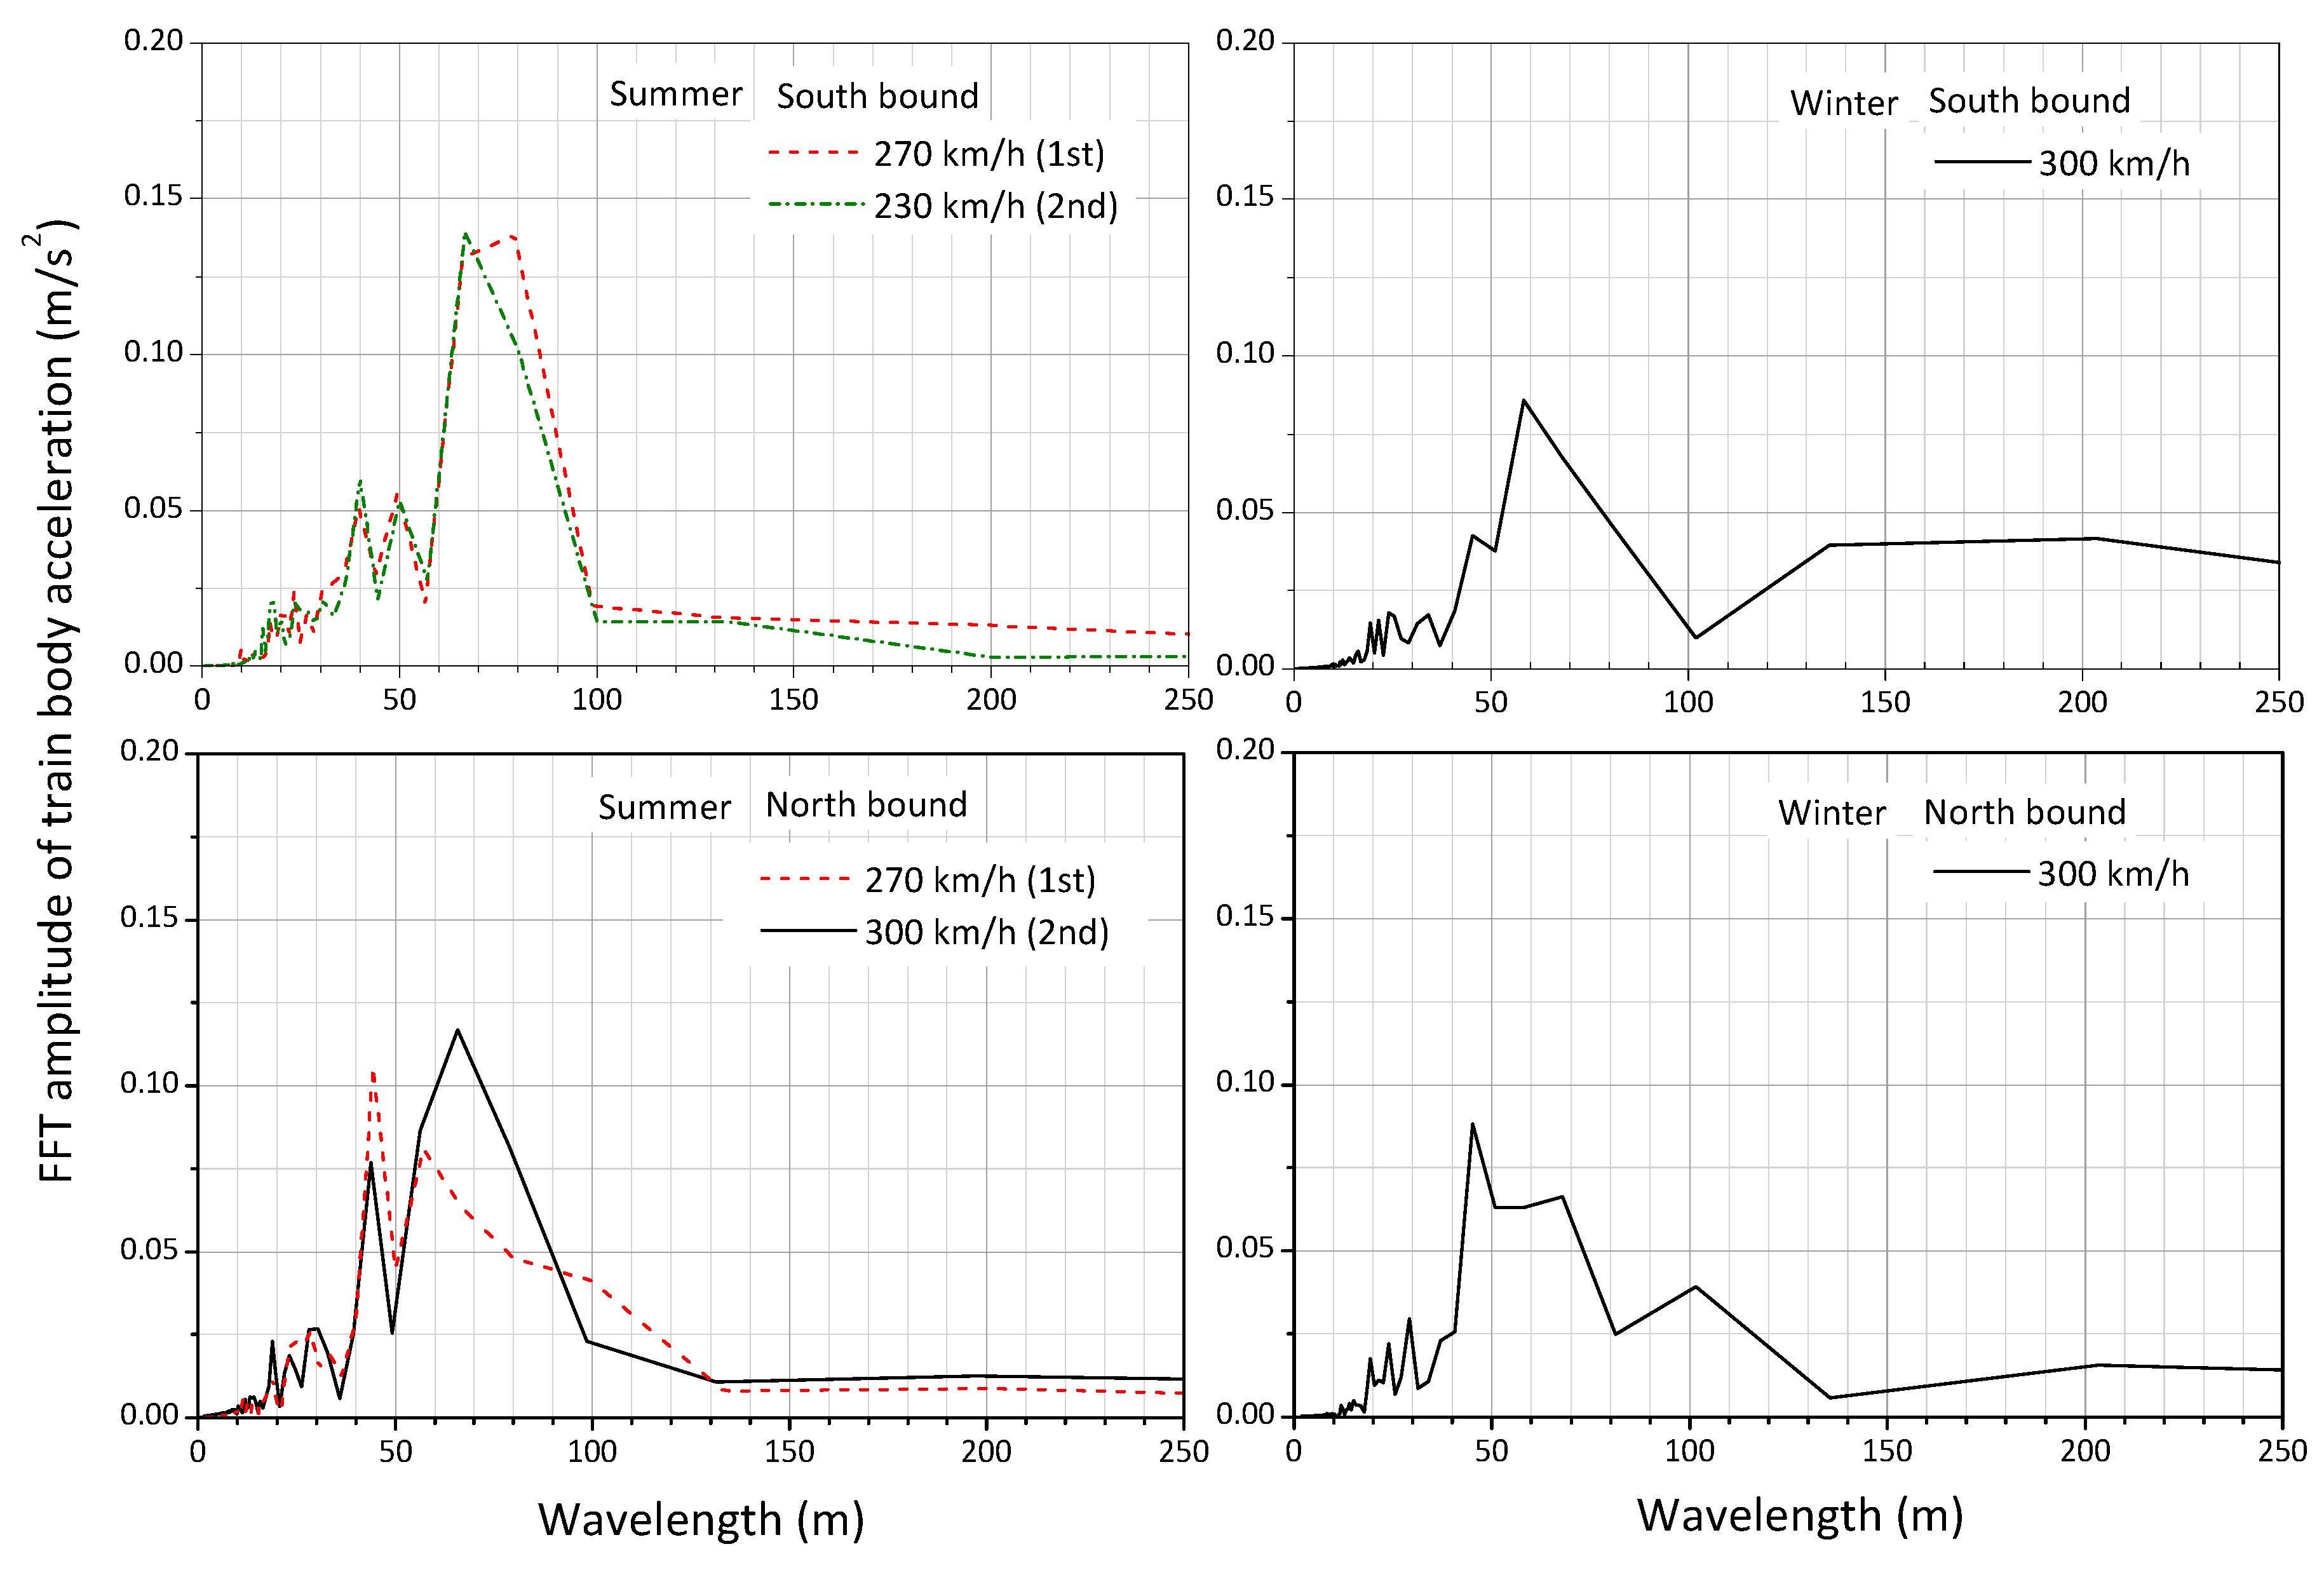
4.2. Effect of Vertical Track Irregularities on Train Body Accelerations
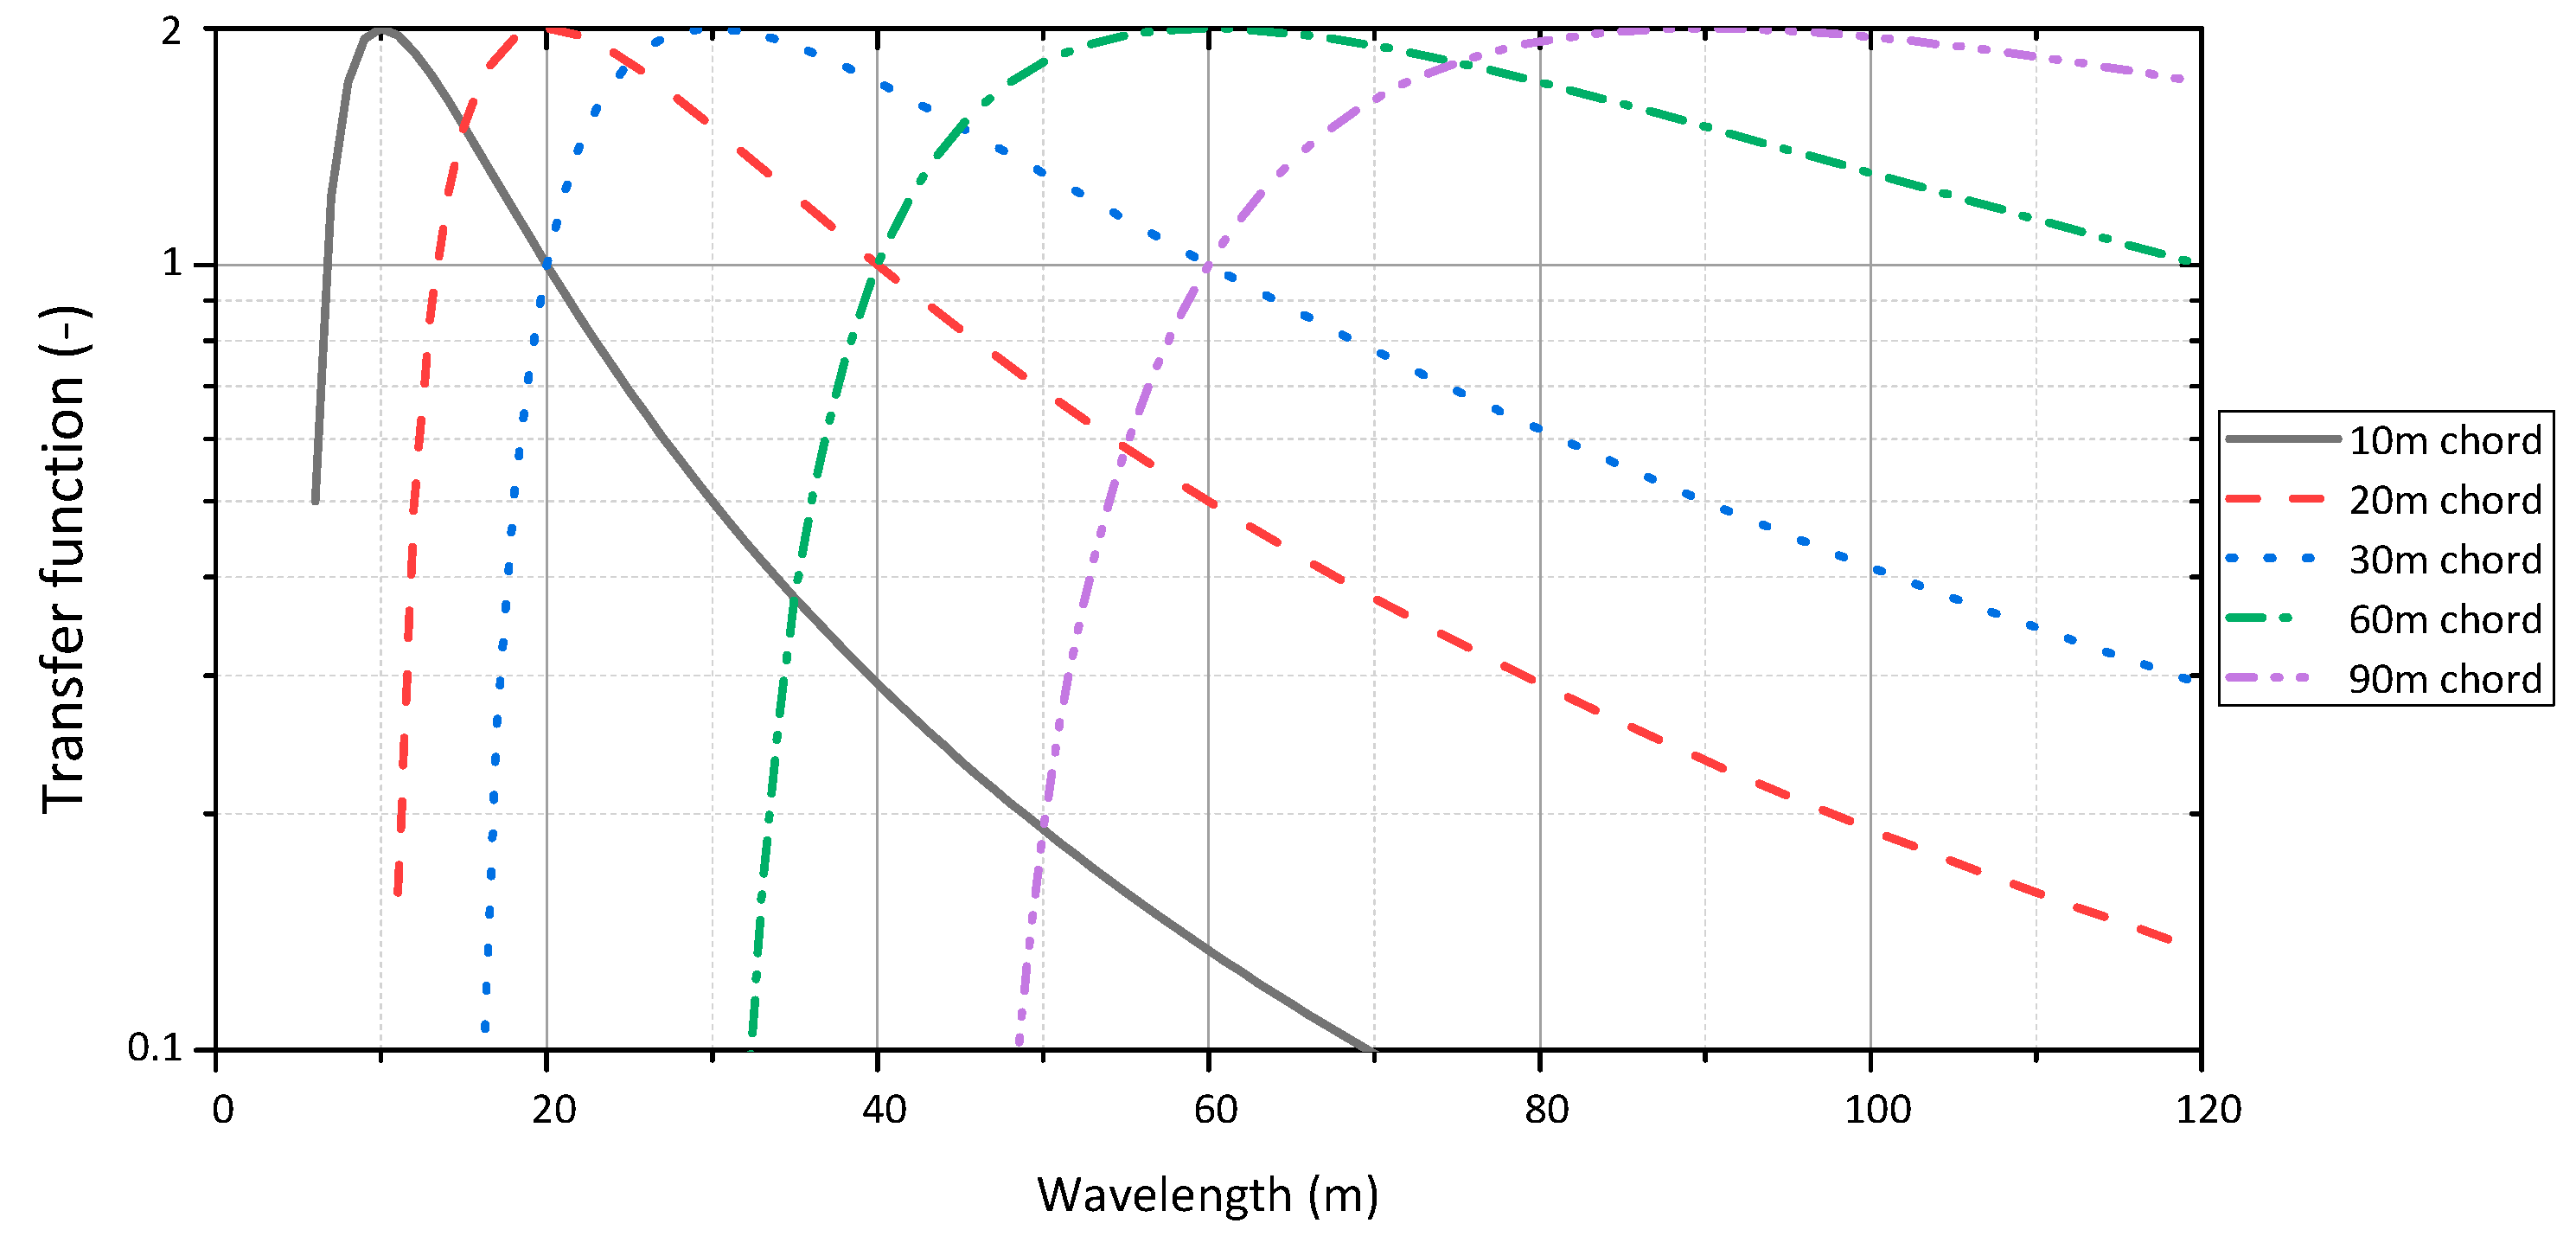
- Critical wavelengths causing car body bouncing:
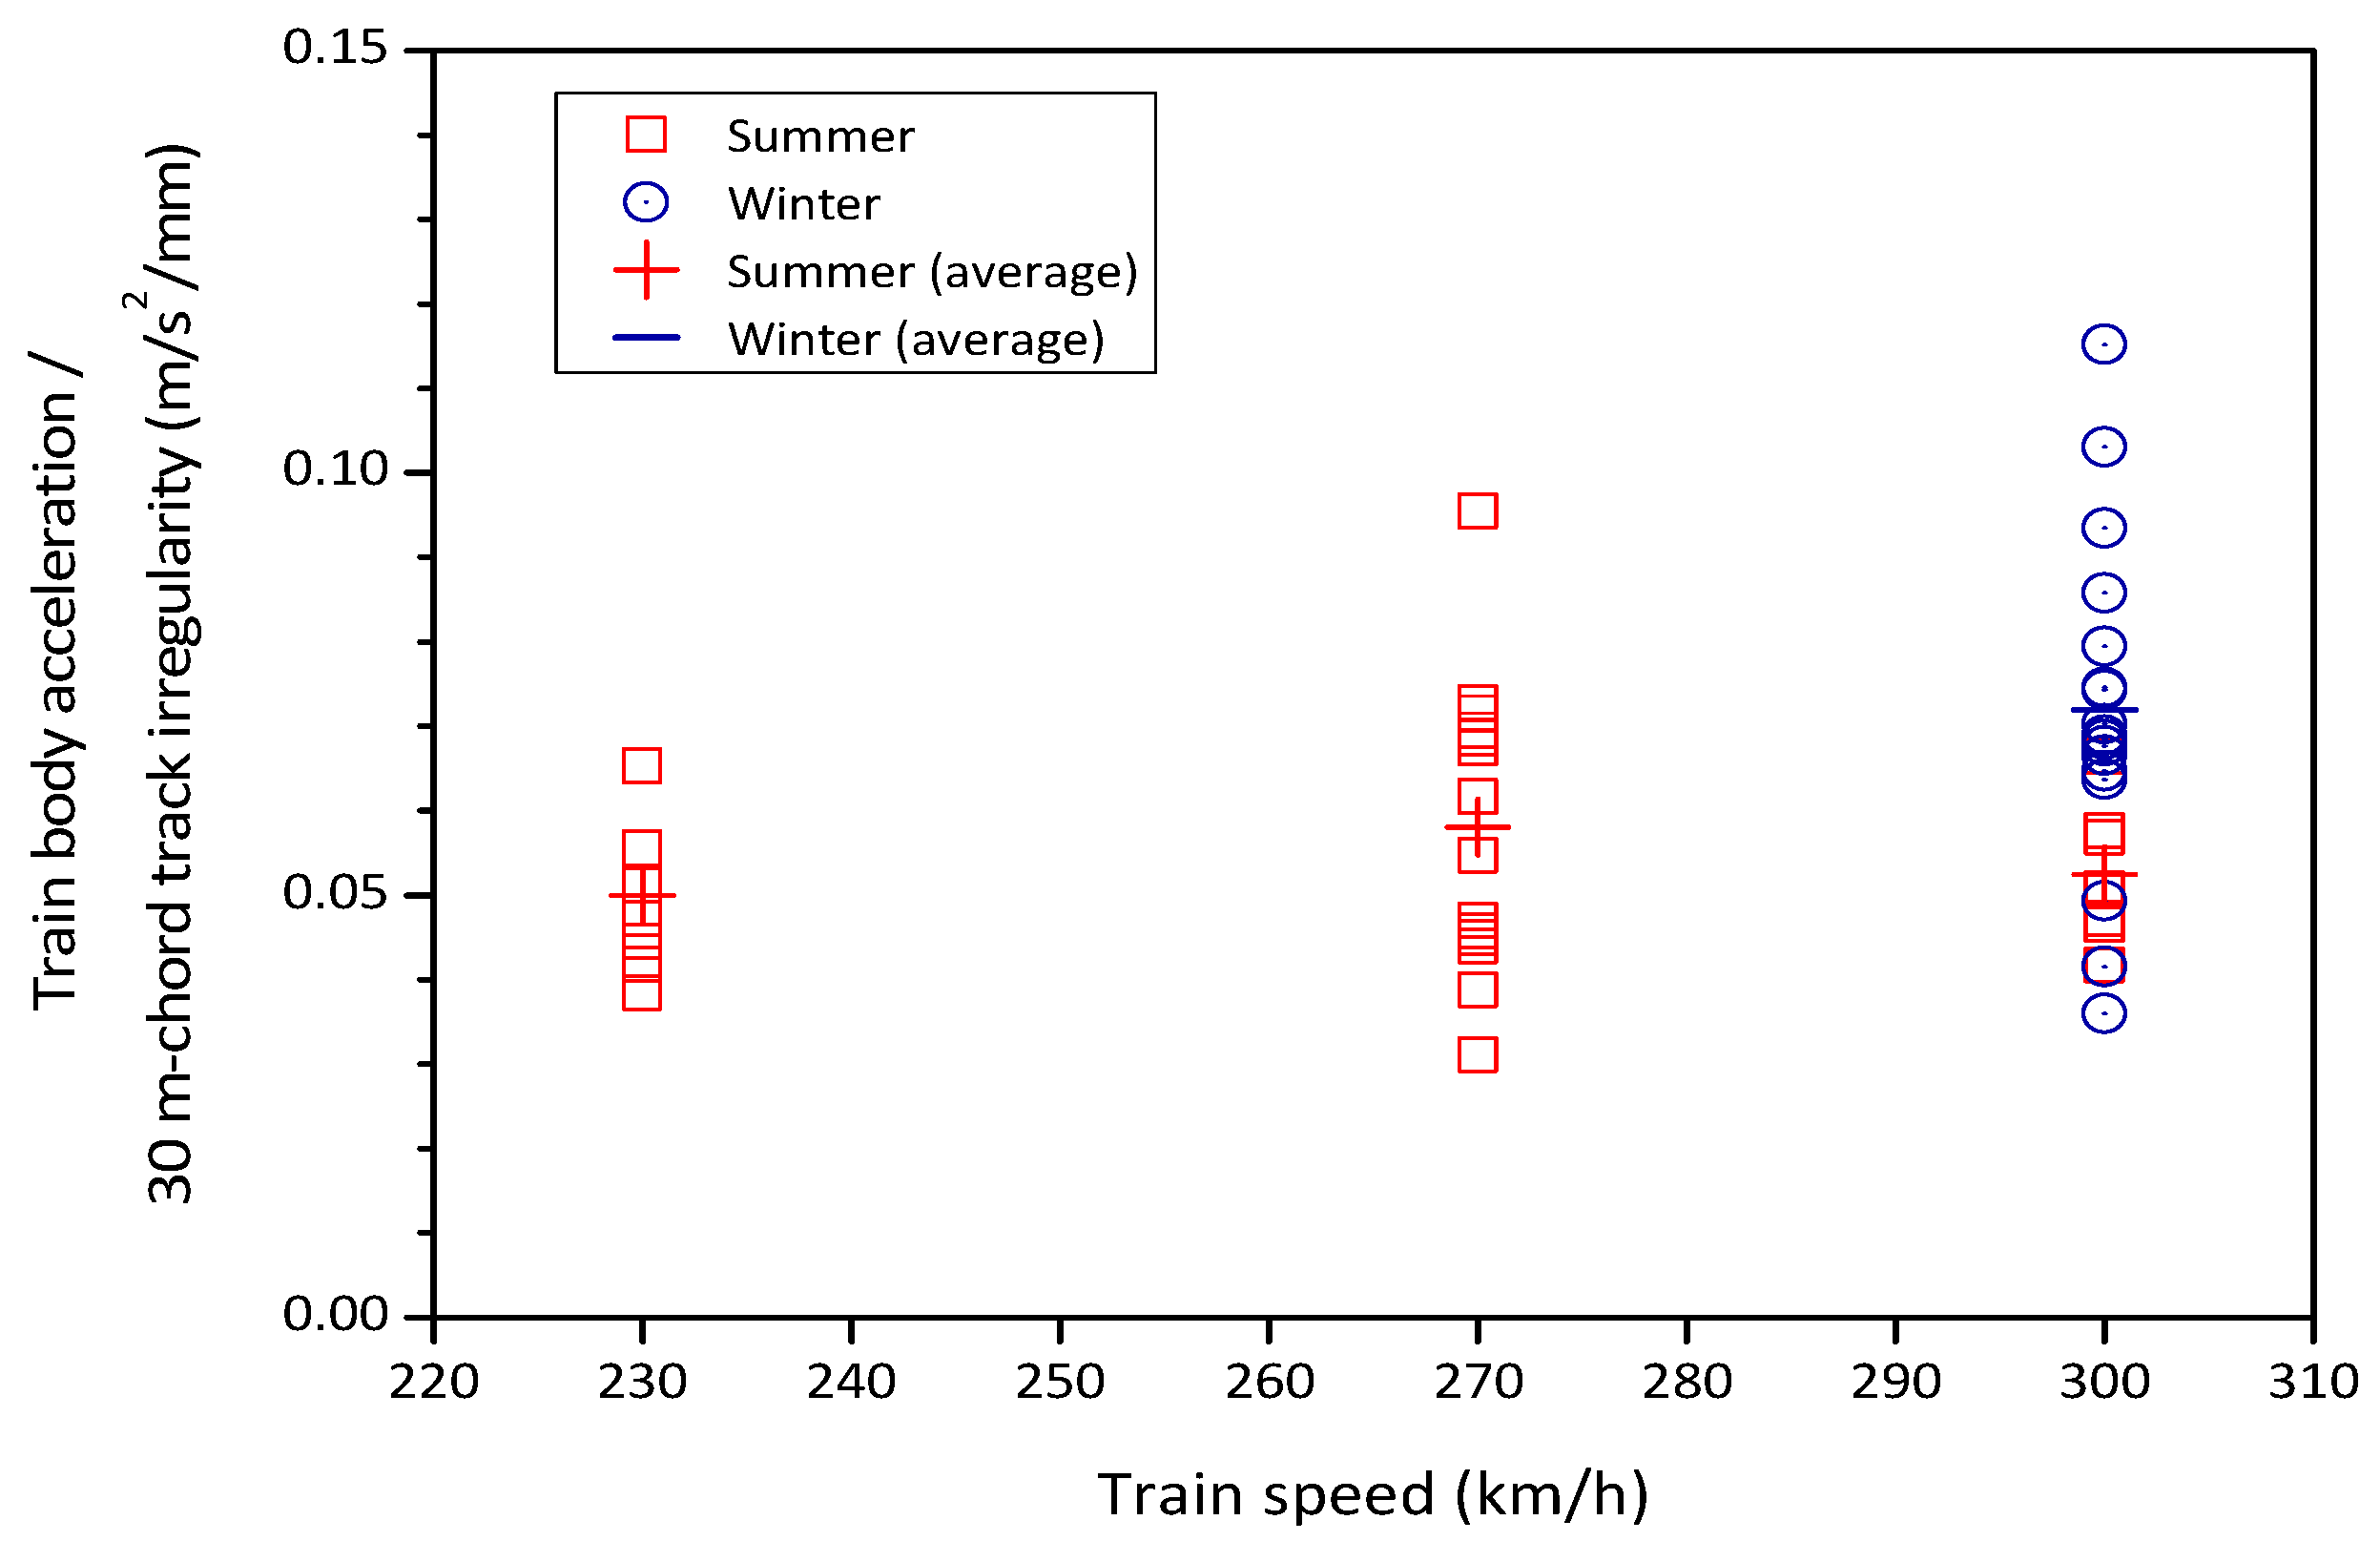
- Critical wavelengths causing car body pitching:where is the center-to-center distance of the bogies. Thus, the first critical wavelengths corresponding to the bogie distance of a Korean KTX high-speed train (18.7 m) are 18.7 m and 37.4 m for bouncing and for pitching, respectively. As can be seen in Figure 15, in the case of application of the 30-m chord at these critical wavelengths, the amplification ratio is close to 1 or more than 1. This is why the 30-m-chord track irregularity and train body acceleration are highly correlated.
4.3. Effect of Vertical Track Irregularities on Acceleration of Bridge
4.4. Suggestion for Design and Maintenance
5. Conclusions
- Field measurements and a numerical analysis were used to clarify the phenomenon by which large vertical long-wavelength track irregularity is periodically generated by the thermal expansion of the bridge arch rib fixed at both ends due to seasonal temperature changes in fixed-end arch bridges. As a result, the dominant wavelength of the track irregularity is determined by the span length of the main arch.
- Long-wavelength track irregularity increases the vertical acceleration of the train body, especially in the daytime on summer days when the track irregularity is the largest. On the other hand, in winter, the temperature increases during the daytime relative to nighttime, and track irregularity becomes smaller than at nighttime, the result being that the measured train acceleration is lower than that in summer, but is expected to increase in the early morning and at night.
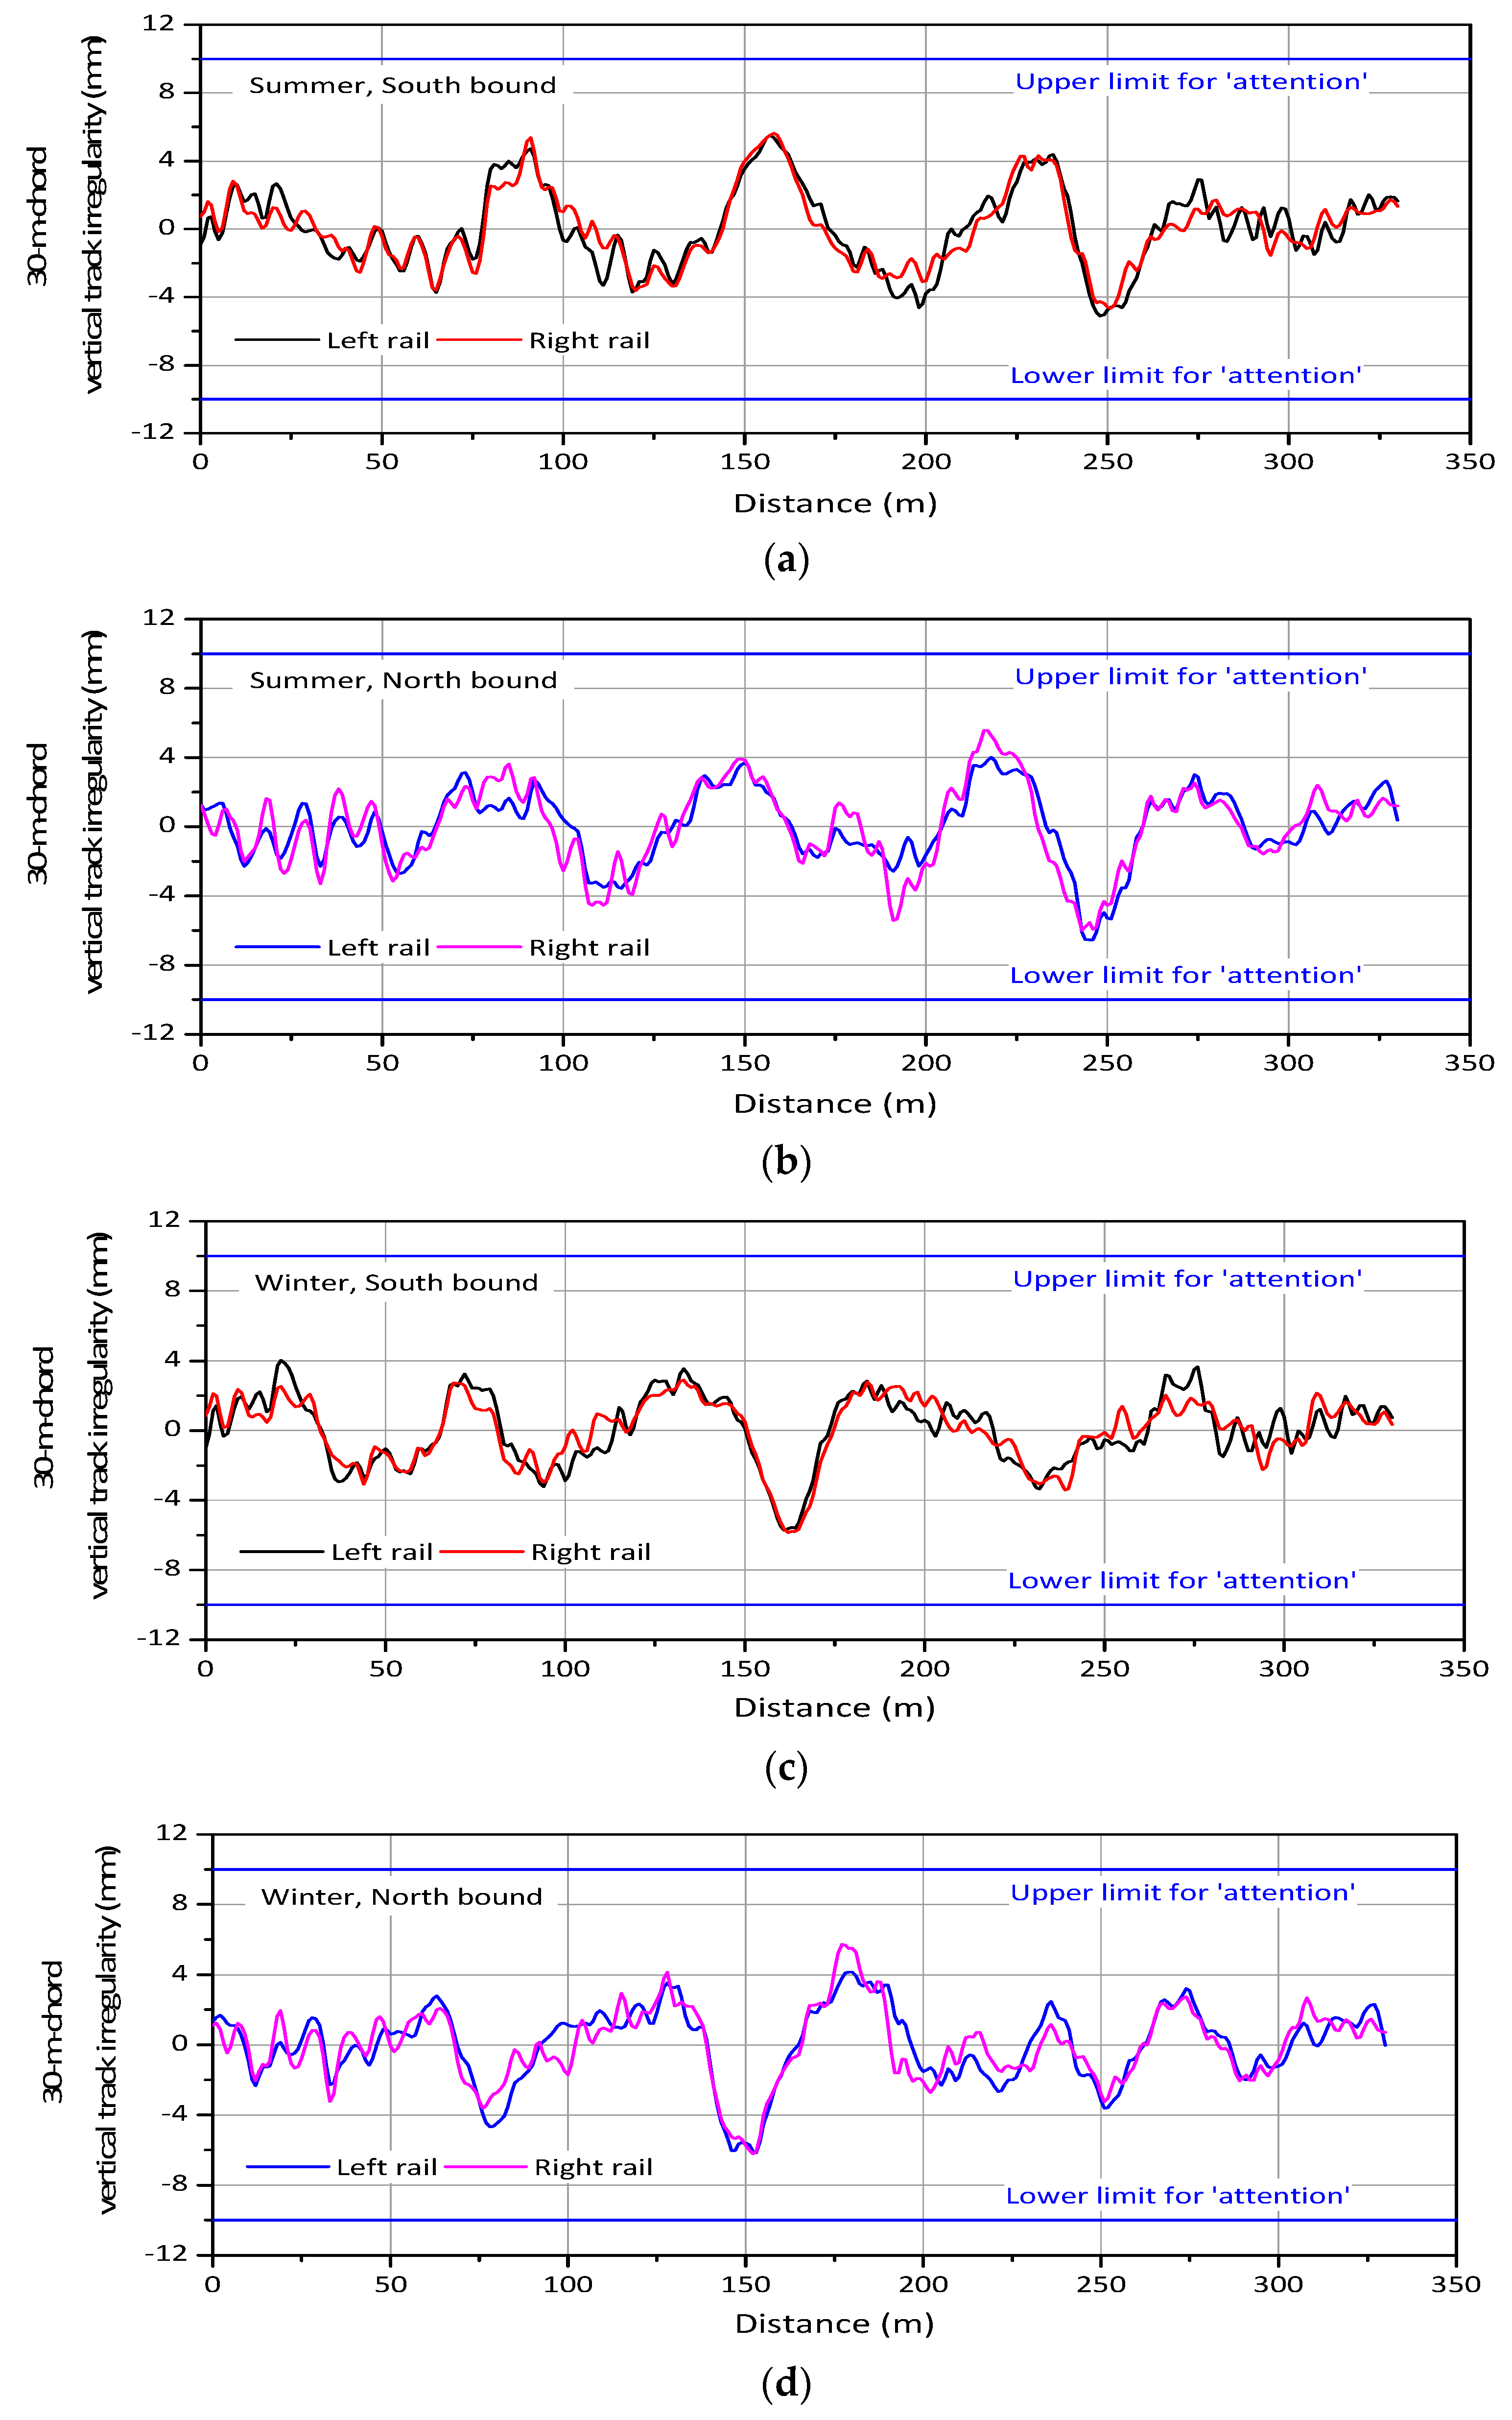
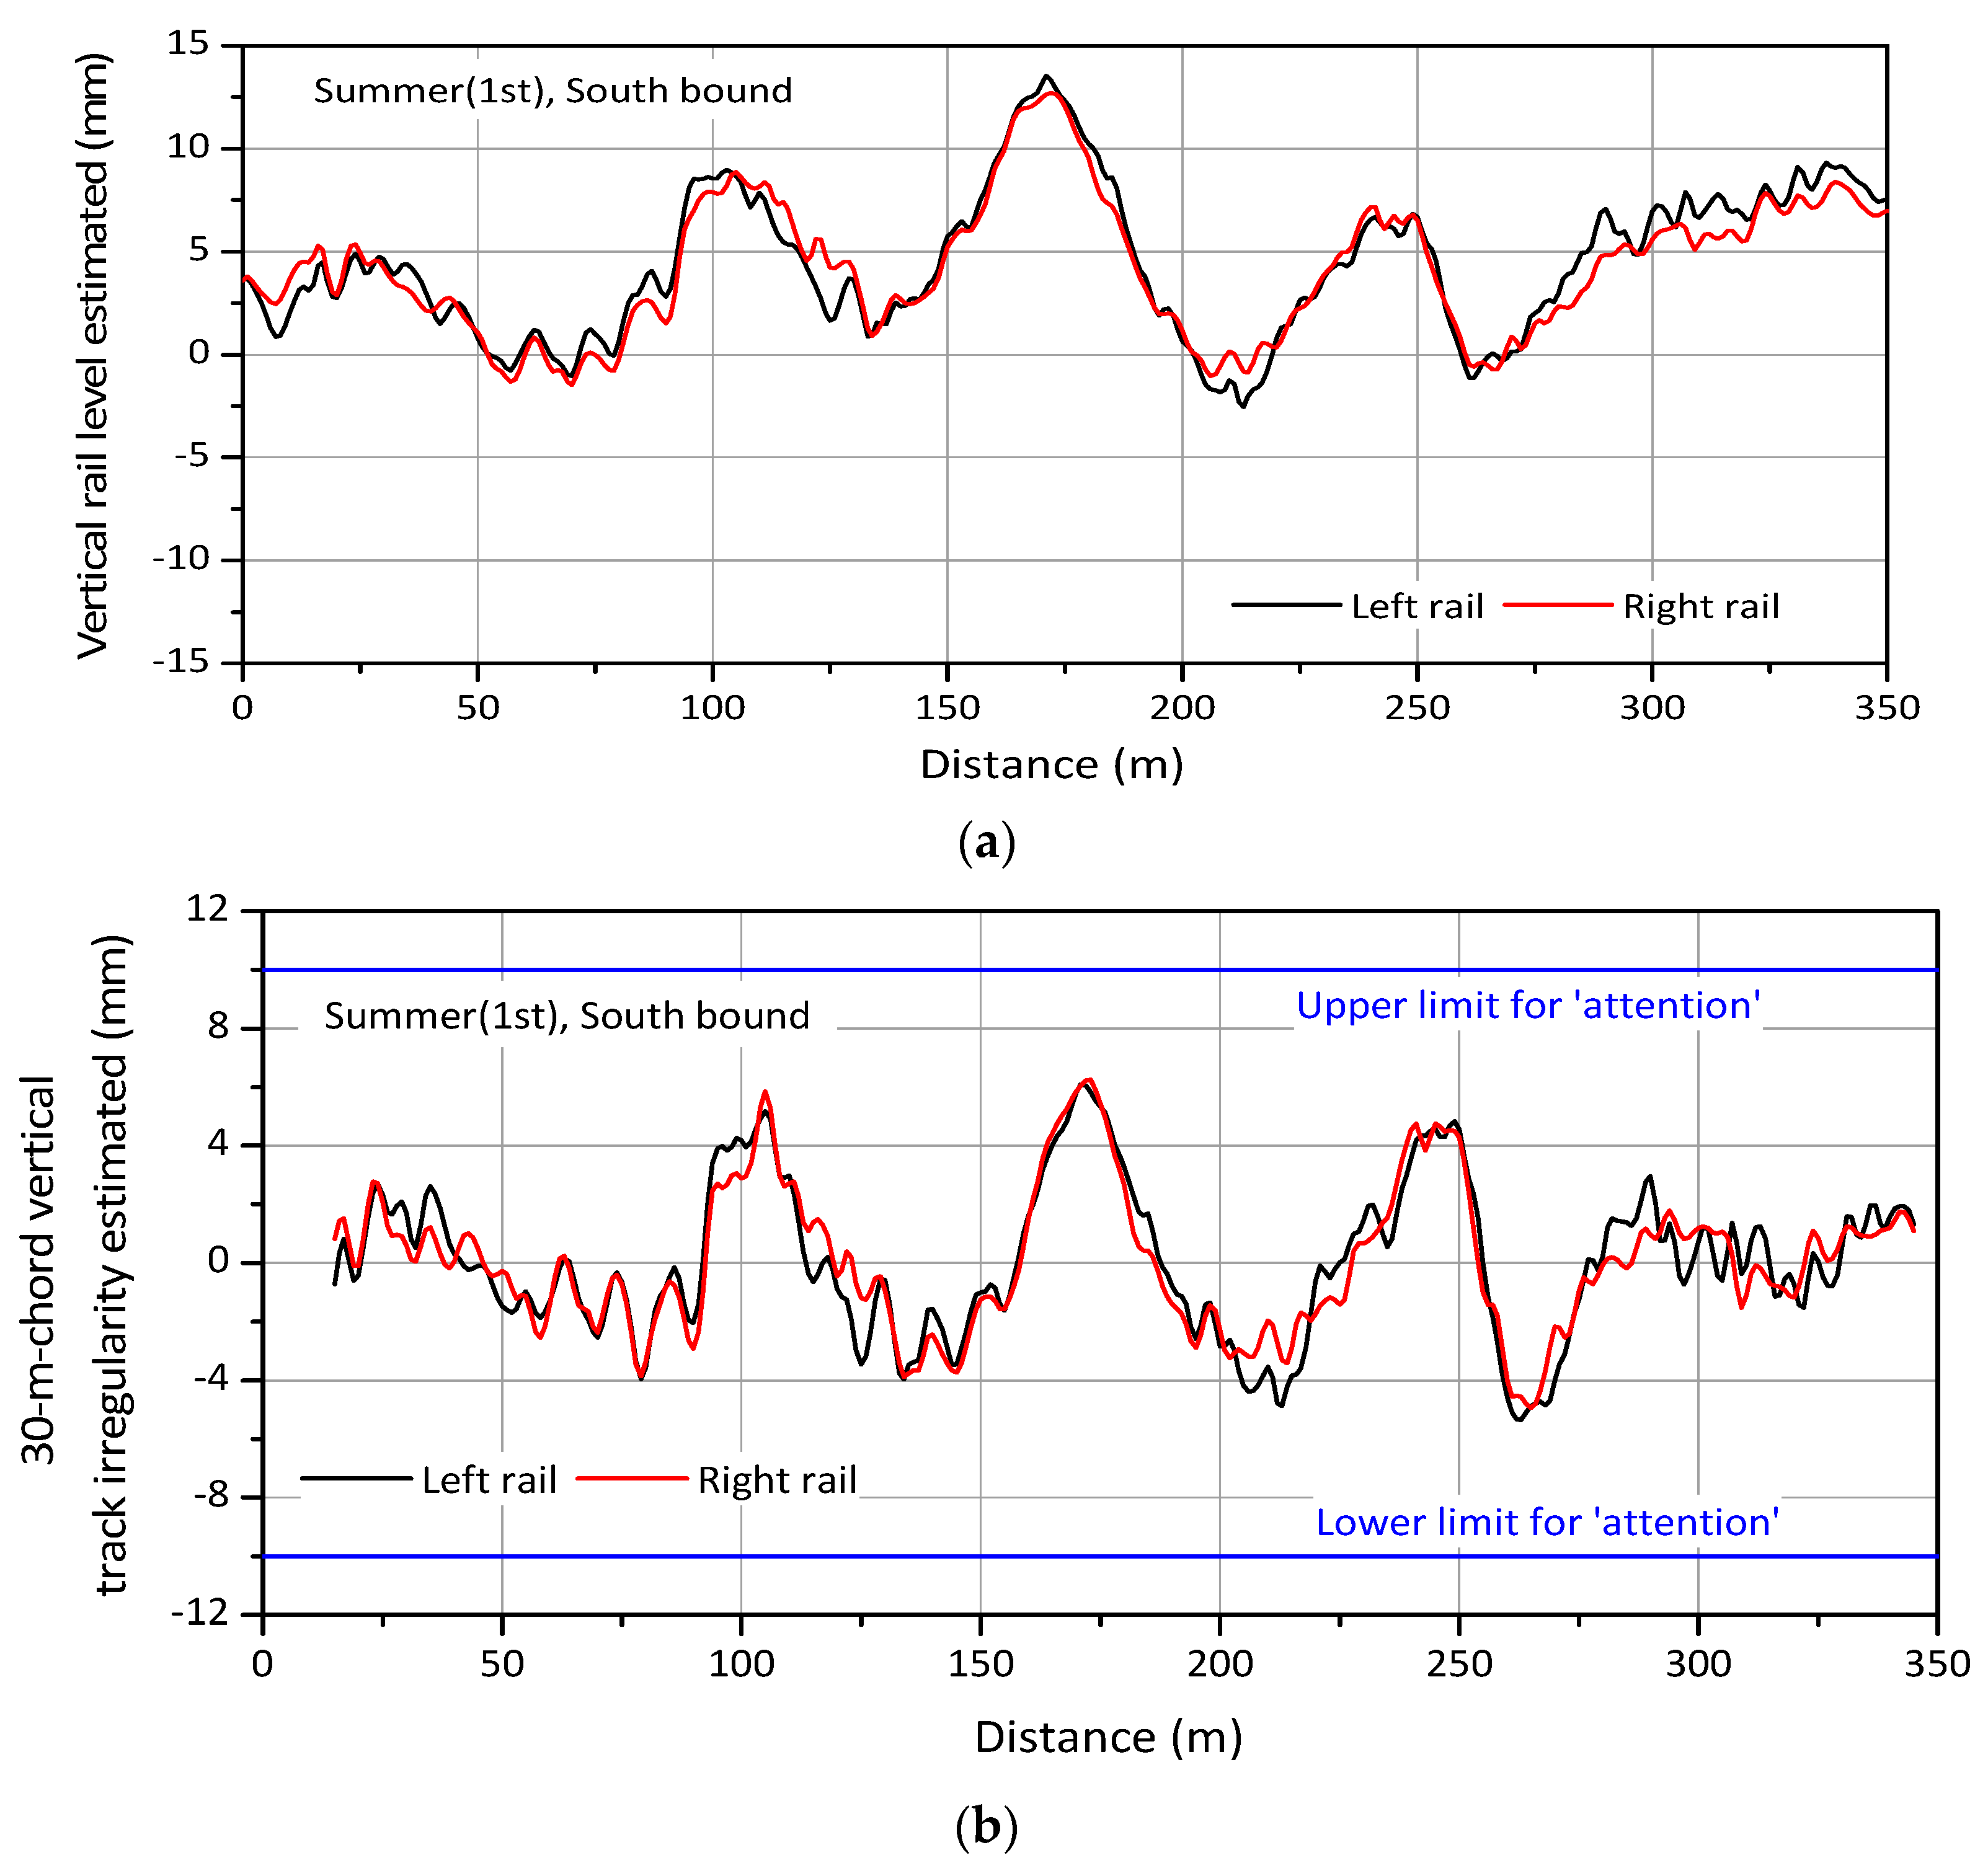
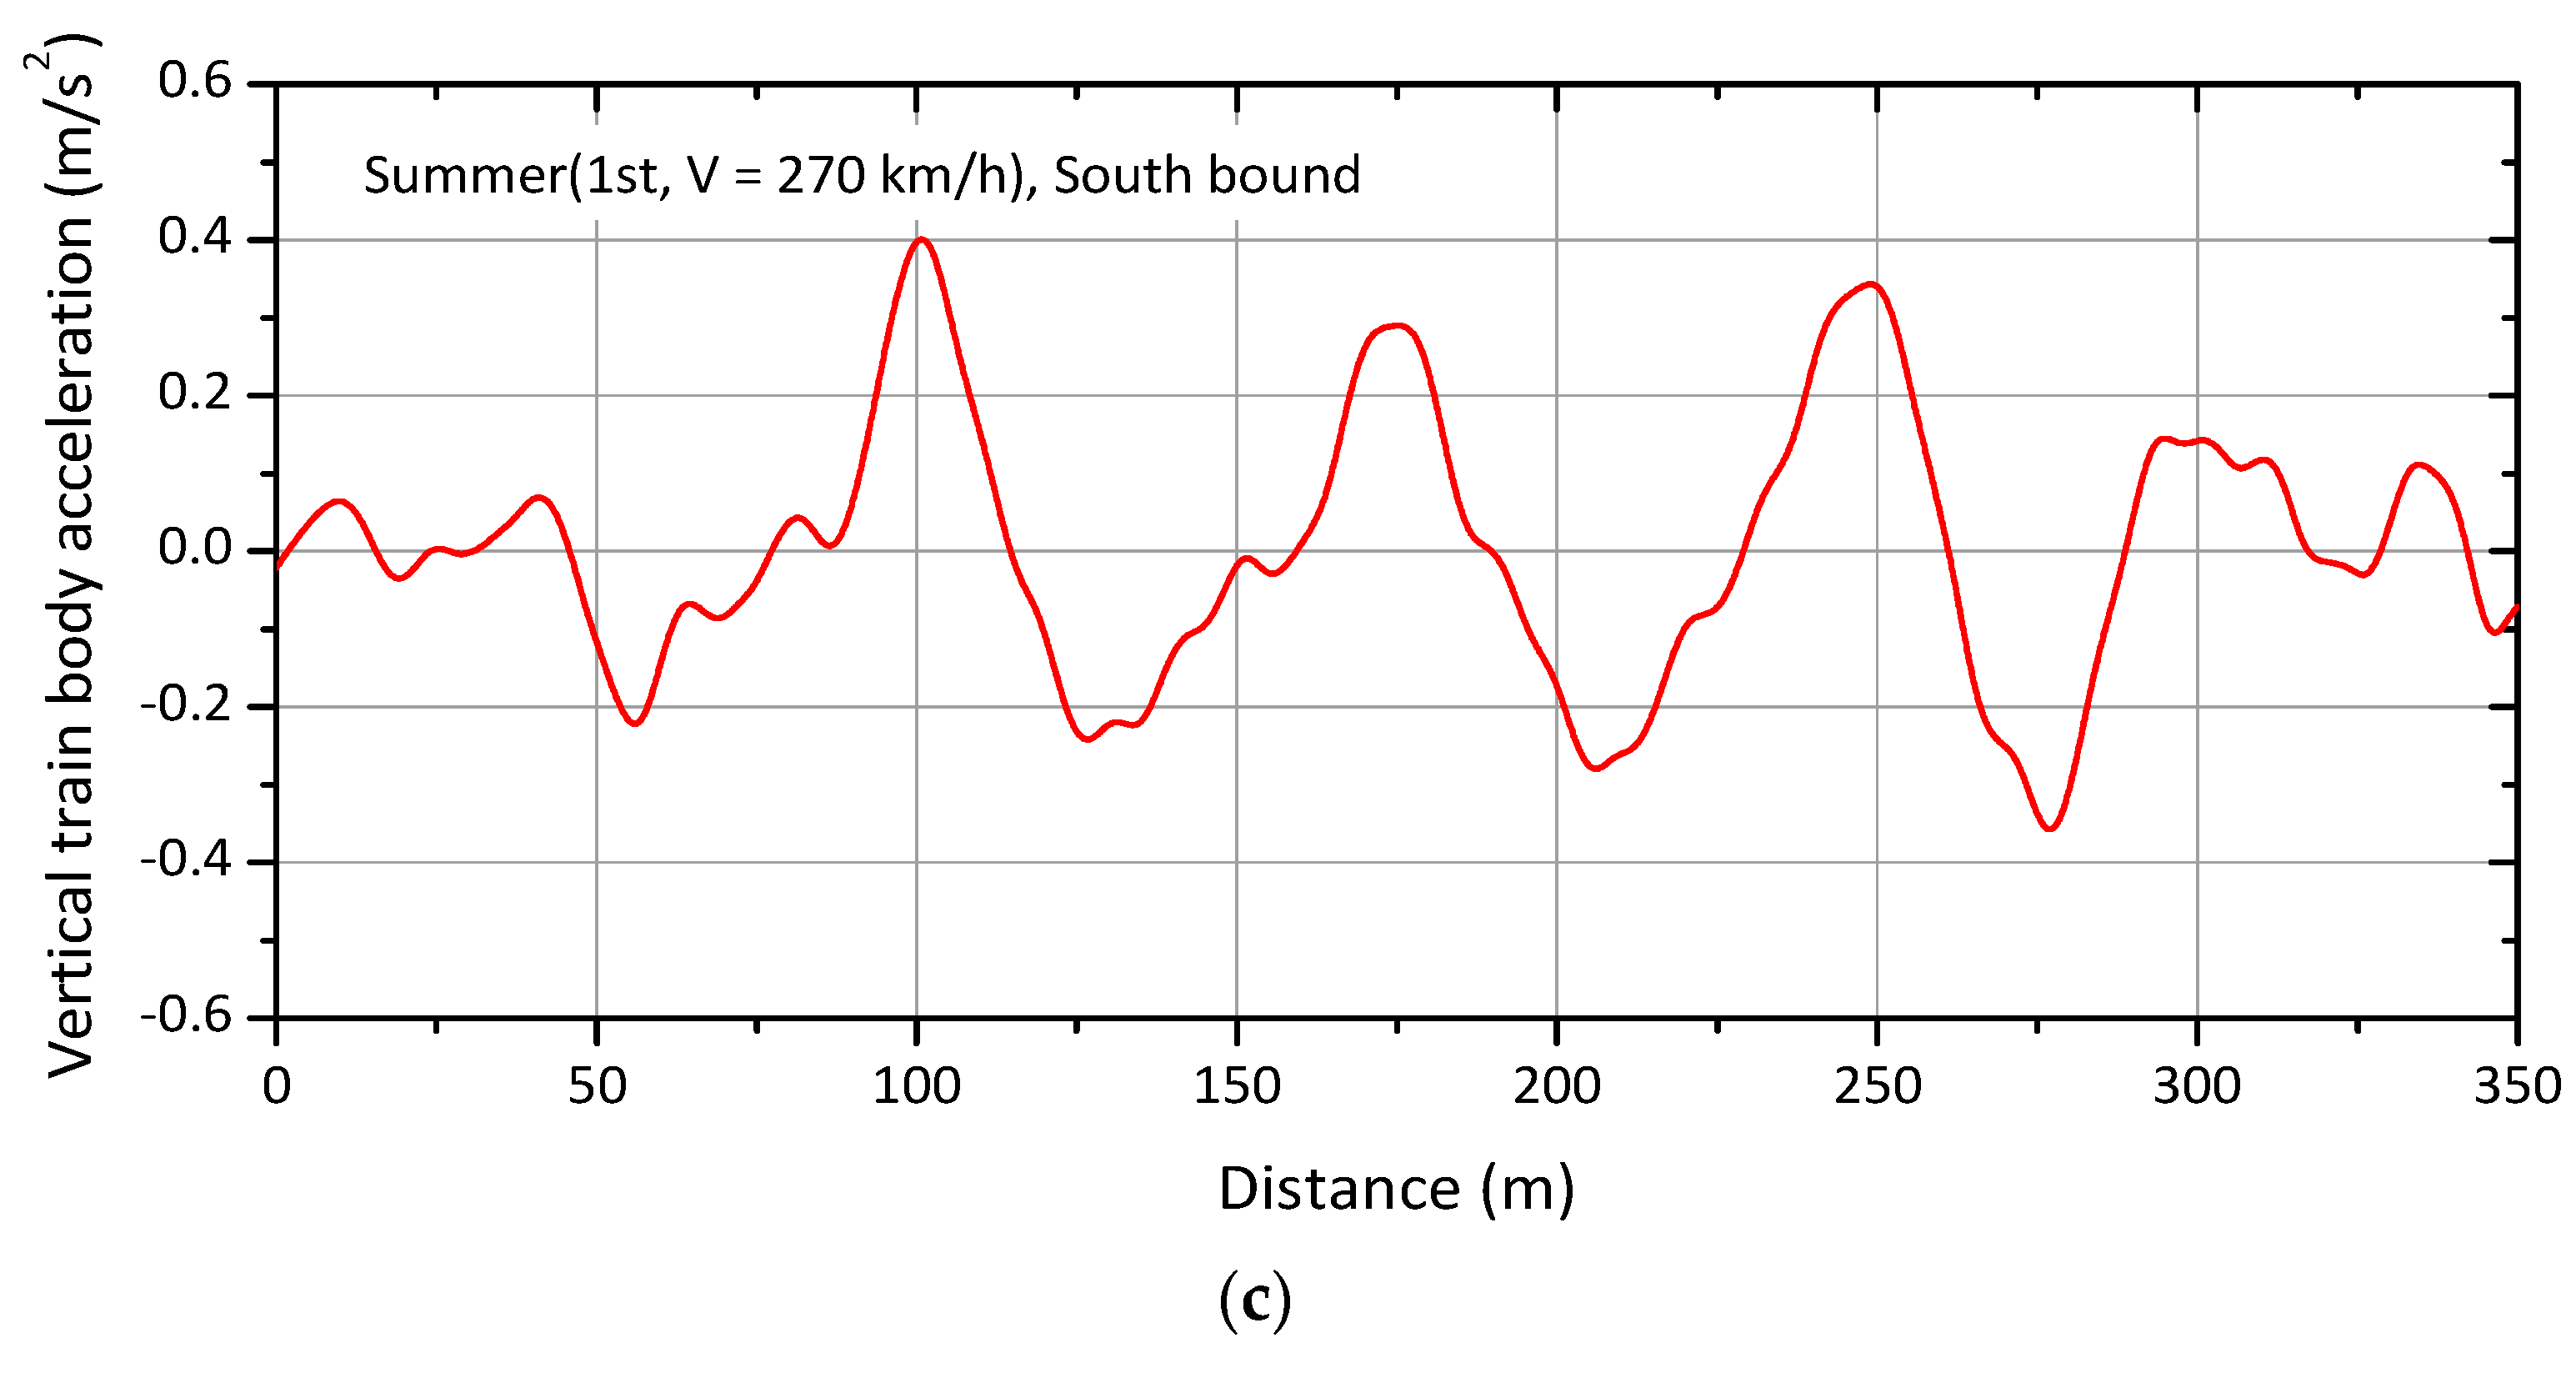
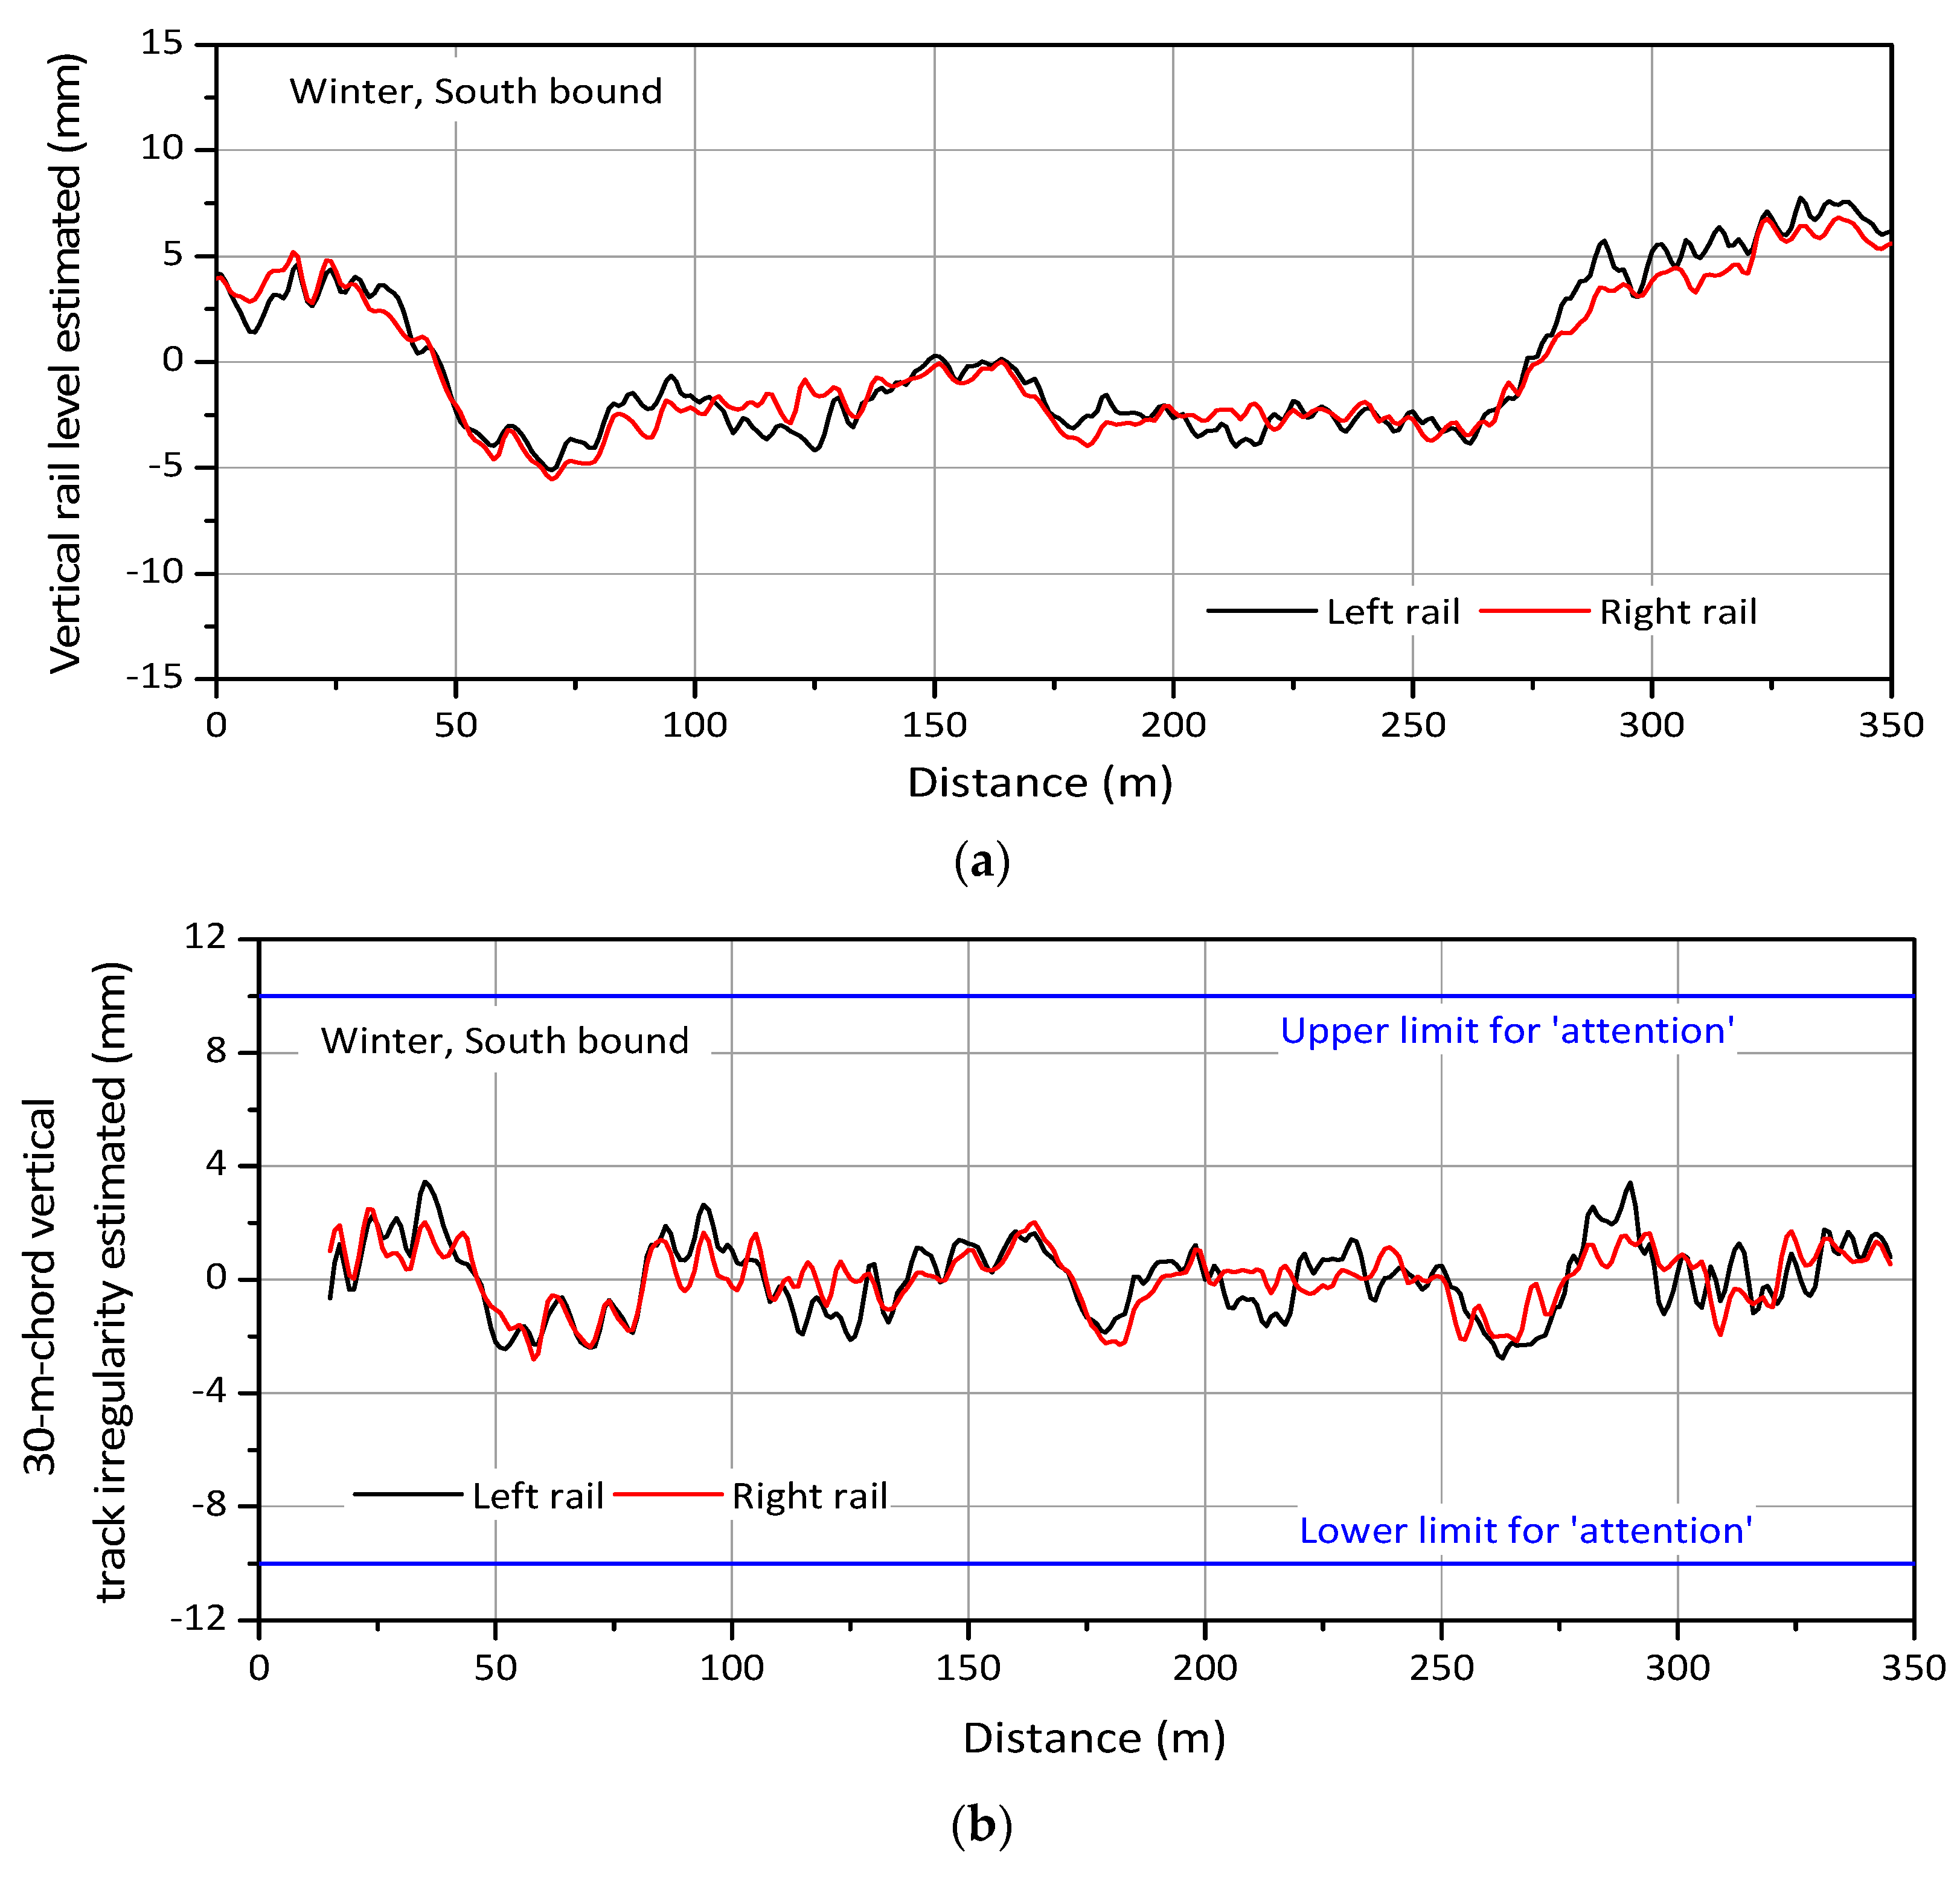
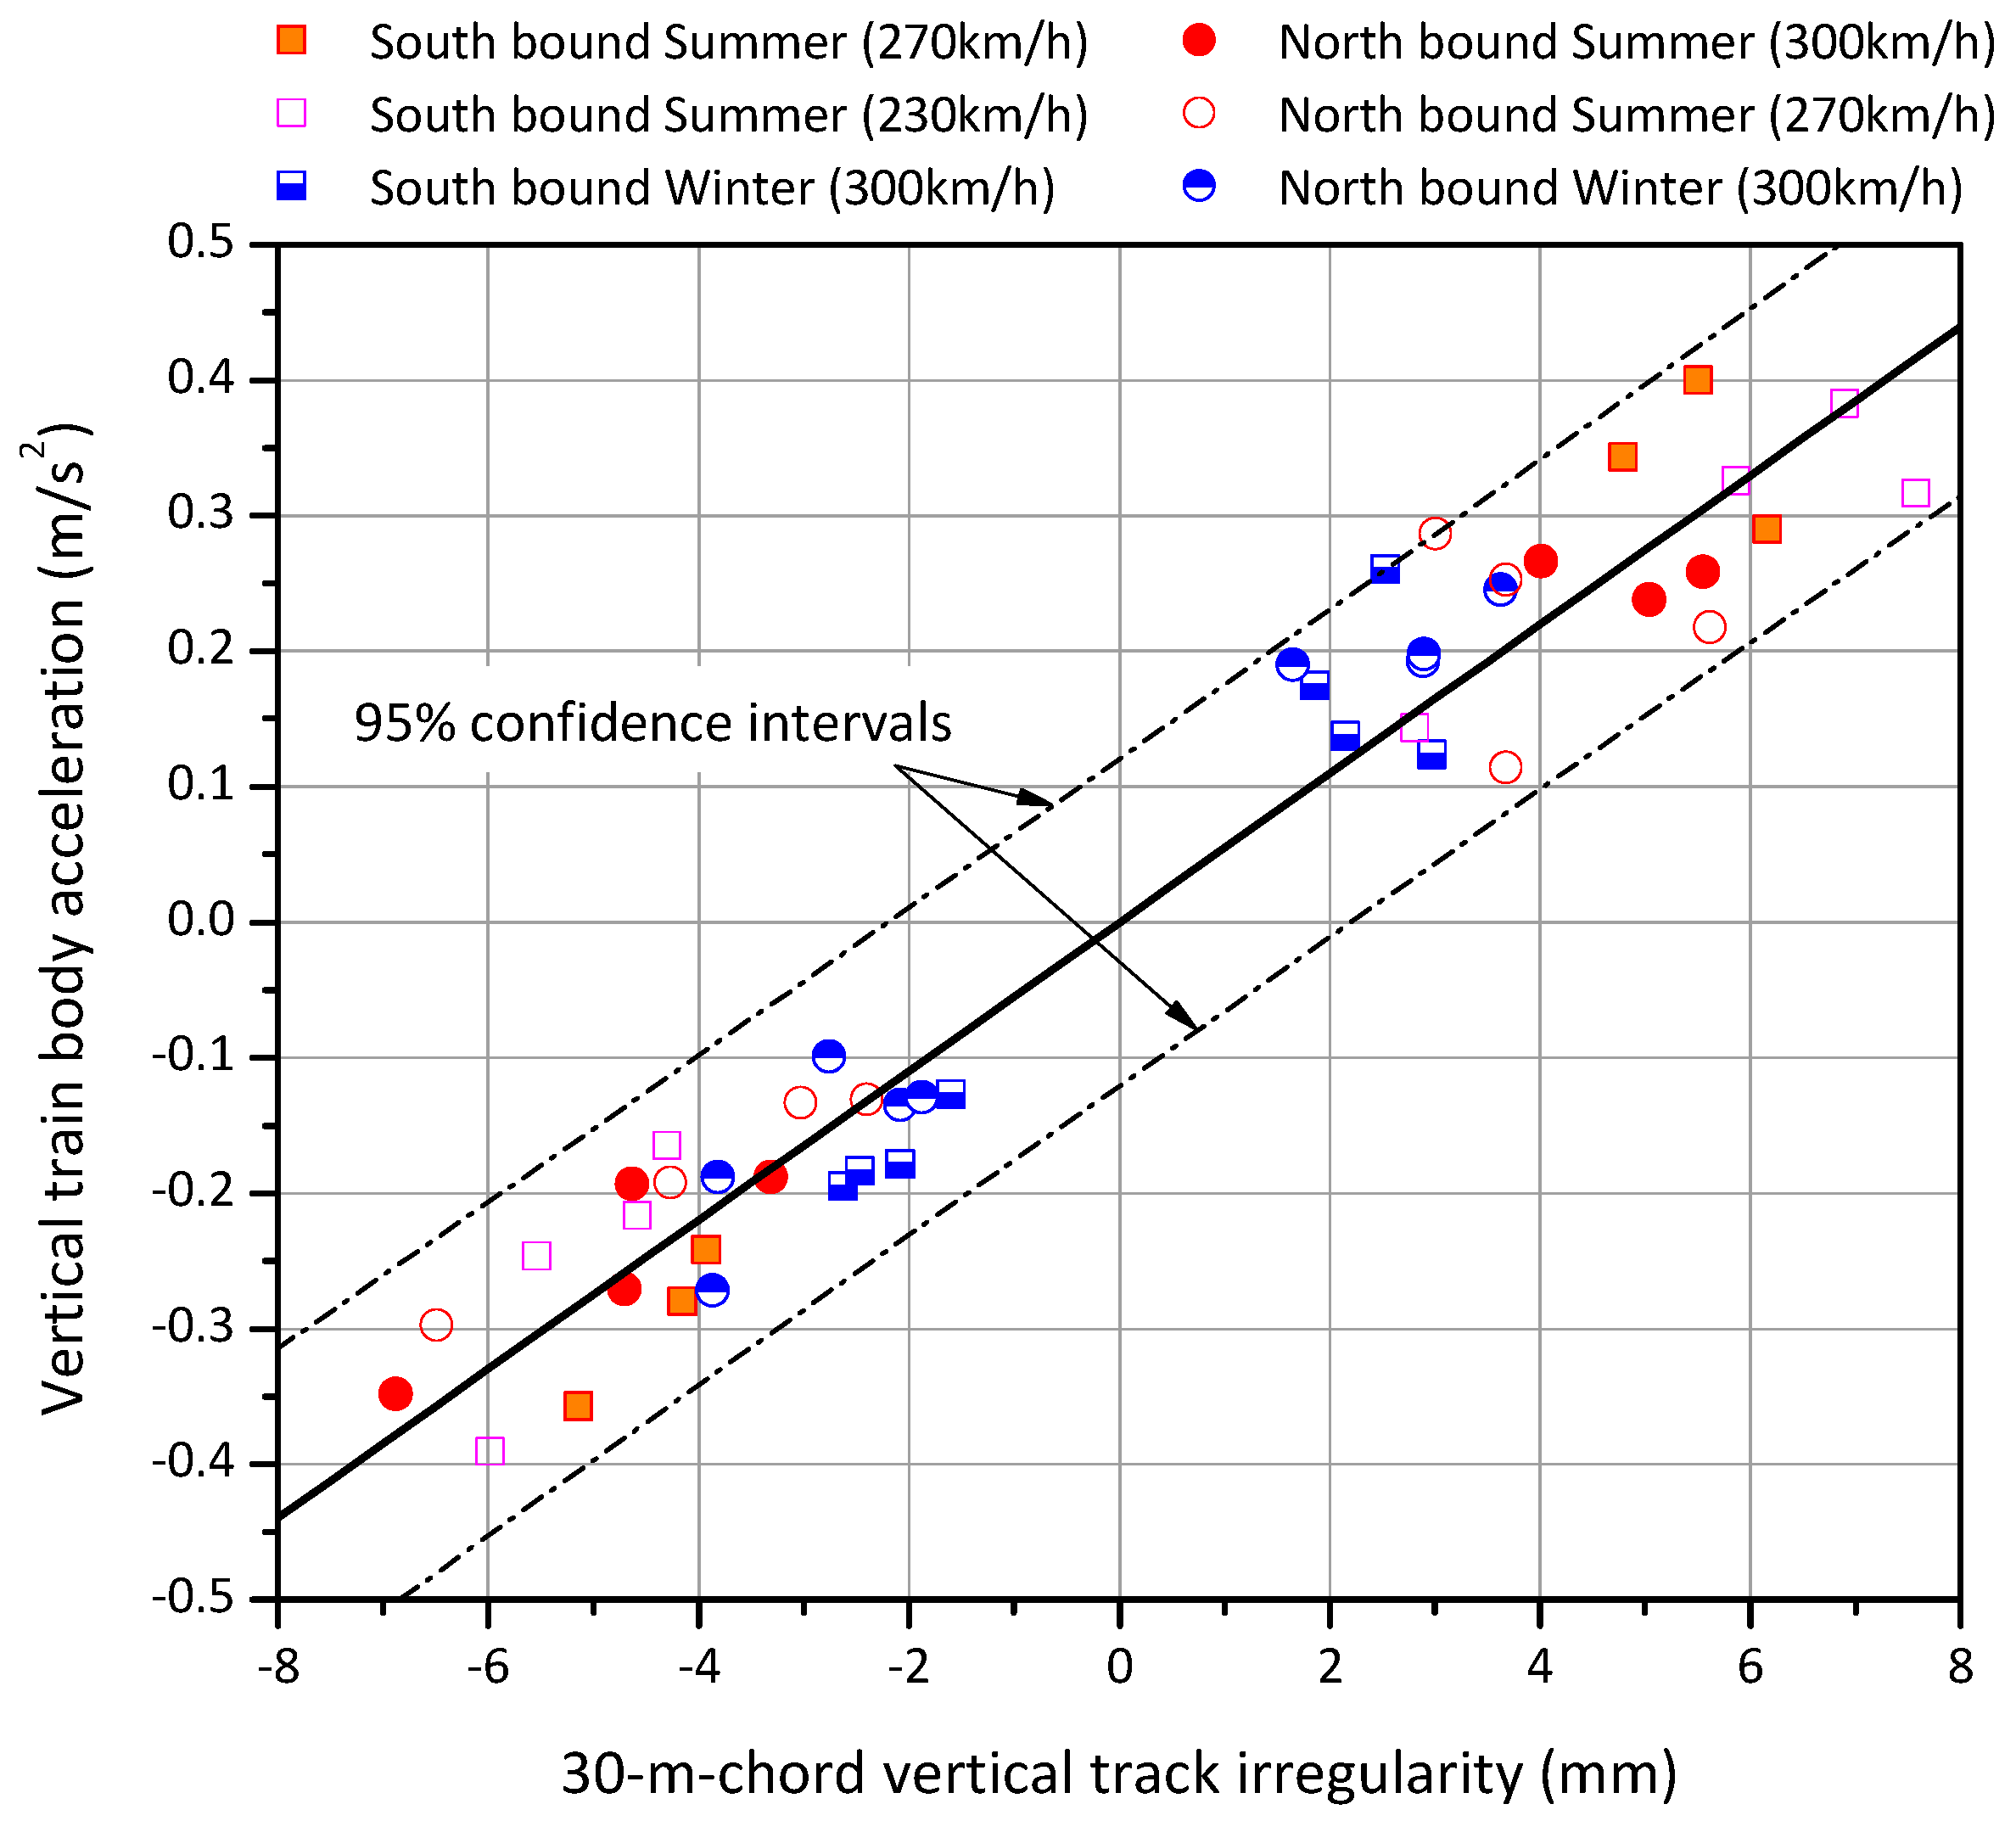
- When track irregularity is represented by the chord versine method with a 30-m chord, the waveform with the train body acceleration is very similar to that of the track irregularity, and the peak acceleration magnitude is also highly correlated with the peak value of the 30-m-chord track irregularity. It is considered that this is due to the fact that amplification factors of the 30-m chord in the critical wavelength band for the vertical train body acceleration are close to or larger than 1; it is also considered that it is appropriate to manage long-wavelength track irregularity with the 30-m chord when the bridge span length is less than 70 m. If the bridge span is longer than 70 m, the dominant wavelength of the track irregularity might, depending on the train speed, be close to the critical wavelength band corresponding to the natural frequency of the train suspension, and so it is necessary to further extend the chord length.
- Unlike train vibration, excitation frequency due to long-wavelength track irregularity to the bridge structure is very small compared with the natural frequency of the bridge, so that the acceleration of the bridge is hardly affected by track irregularity.
- To control long-wavelength track irregularity due to seasonal temperature changes and to prevent the degradation of passenger comfort, it is necessary during the design stage to predict vertical deformation of the bridge due to temperature change and the corresponding long-wavelength track irregularity. Also, it is preferable to determine the main span length in such a way that it does not coincide with the critical wavelength of the train.
- At the maintenance stage or before the start of train operation, readjustment of the rail height can be carried out to reduce long-wavelength track irregularity. To do so, it is recommended to measure track-geometrical errors at different temperatures and to obtain the correlation between long-wavelength track irregularity and train body acceleration from a test run.
Author Contributions
Funding
Acknowledgments
Conflicts of Interest
References
- UIC 776-3 R: Deformation of Bridges, 1st ed.; International Union of Railways: Paris, France, 1989.
- EN 1990, Eurocode—Basis of Structural Design; European Committee for Standards: Brussels, Belgium, 2002.
- UIC 774-3 R, Track/bridge Interaction. Recommendations for Calculations, 2nd ed.; International Union of Railways: Paris, France, 2001.
- Frýba, L. Vibration of Solids and Structures under Moving Loads; Noordhoff International: Groningen, The Netherlands, 1972. [Google Scholar]
- Matsuura, A. Study of dynamic behaviours of bridge girders for high-speed railway. J. JSCE 1976, 256, 35–47. [Google Scholar]
- Yang, Y.-B.; Lin, C.W. Vehicle–bridge interaction analysis by dynamic condensation method. J. Struct. Eng. 1995, 121, 1636–1643. [Google Scholar] [CrossRef]
- Frýba, L. Dynamics of Railway Bridges; Thomas Telford: London, UK, 1996. [Google Scholar]
- Wu, Y.S.; Yang, Y.-B. Steady-state response and riding comfort of trains moving over a series of simply supported bridges. Eng. Struct. 2003, 25, 251–265. [Google Scholar] [CrossRef]
- Ju, S.H.; Lin, H.T. Resonance characteristics of high-speed trains passing simply supported bridges. J. Sound Vib. 2003, 267, 1127–1141. [Google Scholar] [CrossRef]
- Yang, Y.-B.; Yau, J.D.; Wu, Y.S. Vehicle–Bridge Interaction Dynamics: With Application to High-Speed Railways; World Scientific: Singapore, 2004. [Google Scholar]
- Yang, Y.-B.; Lin, C.W. Vehicle–bridge interaction dynamics and potential applications. J. Sound Vib. 2005, 284, 205–226. [Google Scholar] [CrossRef]
- Xia, H.; Zhang, N.; Gao, R. Experimental analysis of railway bridge under high-speed trains. J. Sound Vib. 2005, 282, 517–528. [Google Scholar] [CrossRef]
- Xia, H.; Zhang, N.; Guo, W.W. Analysis of resonance mechanism and conditions of train–bridge system. J. Sound Vib. 2006, 297, 810–822. [Google Scholar] [CrossRef]
- Liu, K.; Reynders, E.; De Roeck, G. Experimental and numerical analysis of a composite bridge for high-speed trains. J. Sound Vib. 2009, 320, 201–220. [Google Scholar] [CrossRef]
- Yang, Y.-B.; Yau, J.D. Vertical and pitching resonance of train cars moving over a series of simple beams. J. Sound Vib. 2015, 337, 135–149. [Google Scholar] [CrossRef]
- Choi, I.Y.; Um, J.-H.; Lee, J.S.; Choi, H.-H. The influence of track irregularities on the running behavior of high-speed trains. Proc. Inst. Mech. Eng. Part F J. Rail Rapid Transit 2013, 227, 94–102. [Google Scholar] [CrossRef]
- Yang, S.C.; Hwang, S.H. Train-track-bridge interaction by coupling direct stiffness method and mode superposition method. J. Bridge Eng. 2016, 21, 04016058. [Google Scholar] [CrossRef]
- Hung, C.F.; Hsu, W.L. Influence of long-wavelength track irregularities on the motion of a high-speed train. Veh. Syst. Dyn. 2017, 56, 95–112. [Google Scholar] [CrossRef]
- Manterola, J.; Martinez, A.; Martin, B.; Navarro, J.A.; Gil, M.A.; Fuente, S.; Blanco, L. Long railway viaducts with special spans: Part I. Arch construction by balanced cantilever with auxiliary cable. In Proceedings of the International Conference on Multi-Span Large Bridges, Porto, Portugal, 1–3 July 2015; pp. 381–390. [Google Scholar]
- Manterola, J.; Martinez, A.; Bartin, B.; Gil, M.A.; Fuente, S.; Blanco, L. Railway arch Bridge over the Tajo River in the Alcantara Reservoir; IABSE Symposium Report; International Association for Bridge and Structural Engineering: Madrid, Spain, 2014; pp. 1228–1235. [Google Scholar]
- Amberg Technologies. Available online: http://www.ambergtechnologies.ch/en/products/rail-surveying/grp-system-fx/ (accessed on 2 September 2018).
- Lee, K.-C.; Kim, S.; Hur, H.-M.; Jeon, S.H. Evaluation of traffic safety and passenger comfort of KTX considering vertical deformation of steel-composite arch bridge due to temperature change. J. Korean Soc. Railway 2018, 21, 47–54. [Google Scholar] [CrossRef]
- UIC 518 OR: Testing and Approval of Railway Vehicles from The Point of View of Their Dynamic Behavior, 4th ed.; International Union of Railways: Paris, France, 2009.
- Voestalpine BWG GmBH. Available online: http://www.voestalpine.com/bwg/en/products/Kinematic-Gauge-Optimization-FAKOP/ (accessed on 8 August 2018).
- KS R 9216, Railway Rolling Stock—Test and Evaluation Method for Passenger Comfort; Korean Agency for Technology and Standards: Eumseong, Korea, 2015.
- KR. Guideline for Track Maintenance; Korea Railroad Network Authority: Daejeon, Korea, 2016. [Google Scholar]
- Ono, S.; Ukai, T. Development of a track management method for Shinkansen speed increases. JR East Tech. Rev. 2012, 12, 70–75. [Google Scholar]
- Iwnicki, S. Handbook of Railway Vehicle Dynamics; CRC Press: Boca Raton, FL, USA, 2006. [Google Scholar]
- Mao, L.; Lu, Y. Critical speed and resonance criteria of railway bridge response to moving trains. ASCE J. Bridge Eng. 2013, 18, 131–141. [Google Scholar] [CrossRef]


| Season | Date and Time | Track | Ambient Temperature (°C) | Average Temperature of Main Arch Ribs (°C) |
|---|---|---|---|---|
| Winter | February 03 2016 01:00 ~ 04:30 | South bound | −5 | −1 |
| February 02 2016 01:00 ~ 04:30 | North bound | −2 | −2 | |
| Summer | August 11 2016 01:00 ~ 04:30 | South bound | +25 | +30 |
| August 10 2016 01:00 ~ 04:30 | North bound | +23 | +28 |
| Season | Date | Track | Ambient Temperature (°C) | Average Temperature of Main Arch Ribs (°C) | Train Speed (km/h) |
|---|---|---|---|---|---|
| Winter | February 19 2016 | South bound | 12 | 12 | 300 |
| North bound | 10 | 6 | 300 | ||
| Summer | July 22 2016 (1st) | South bound | 37 | 32 | 270 |
| North bound | 26 | 28 | 270 | ||
| August 12 2016 (2nd) | South bound | 38 | 37 | 230 | |
| North bound | 34 | 32 | 300 |
| Season | Train Speed (km/h) | Location | Peak Acceleration of Train (m/s2) | Criteria 1 (m/s2) |
|---|---|---|---|---|
| Winter | 300 | South bound | 0.26 | 3.0 |
| 300 | North bound | 0.27 | ||
| Summer 1st | 270 | South bound | 0.40 | |
| 270 | North bound | 0.33 | ||
| Summer 2nd | 230 | South bound | 0.39 | |
| 300 | North bound | 0.35 |
| Season | Train Speed (km/h) | Location | Peak Acceleration of Bridge Deck (g) | Criteria 1 (g) | ||
|---|---|---|---|---|---|---|
| Side Arch (south) | Center Arch | Side Arch (north) | ||||
| Winter | 300 | South bound | 0.08 | 0.12 | 0.07 | 0.5 |
| 300 | North bound | 0.06 | 0.09 | 0.08 | ||
| Summer 1st | 270 | South bound | 0.09 | 0.10 | 0.07 | |
| 270 | North bound | 0.08 | 0.09 | 0.09 | ||
| Summer 2nd | 230 | South bound | 0.08 | 0.08 | 0.06 | |
| 300 | North bound | 0.07 | 0.10 | 0.09 | ||
| Track | Locations | Input Temperatures (°C) 1 | |
|---|---|---|---|
| Summer | Winter | ||
| North bound | Mid-arch | +28.5 | −1.8 |
| Side arch | +27.8 | −2.0 | |
| Deck slab (on mid-arch) | +29.9 | −3.6 | |
| Deck slab (on side-arch) | +25.8 | −3.1 | |
| South bound | Mid-arch | +29.8 | +2.4 |
| Side arch | +29.3 | +2.2 | |
| Deck slab (on mid-arch) | +26.9 | −0.2 | |
| Deck slab (on side-arch) | +31.0 | +0.1 | |
| Mode | Natural Frequencies (Hz) | Critical Wavelength (m) Corresponding to Natural Frequencies at Train Speed of V (km/h) | ||||||||
|---|---|---|---|---|---|---|---|---|---|---|
| Train Body | Bogie | Train Body | Bogie | |||||||
| V = 230 | V = 250 | V = 270 | V = 300 | V = 230 | V = 250 | V = 270 | V = 300 | |||
| Bouncing | 0.7 | 6.9 | 91.3 | 99.2 | 107.1 | 119.0 | 9.3 | 10.1 | 10.9 | 12.1 |
| Pitching | 1.0 | 9.3 | 63.9 | 69.4 | 75.0 | 83.3 | 6.9 | 7.5 | 8.1 | 9.0 |
| Source | Major Mode Direction | Natural Frequencies (Hz) |
|---|---|---|
| Numerical model | Transverse | 1.24, 1.42, 2.06, 3.05, 4.07 |
| Longitudinal | 3.46, 11.84 | |
| Vertical | 4.81, 6.71, 7.24, 8.33, 9.20 | |
| Measured deck acceleration from test run | Vertical | 4.4, 8.9 |
© 2018 by the authors. Licensee MDPI, Basel, Switzerland. This article is an open access article distributed under the terms and conditions of the Creative Commons Attribution (CC BY) license (http://creativecommons.org/licenses/by/4.0/).
Share and Cite
Hwang, S.H.; Kim, S.; Lee, K.-C.; Jang, S.Y. Effects of Long-Wavelength Track Irregularities Due to Thermal Deformations of Railway Bridge on Dynamic Response of Running Train. Appl. Sci. 2018, 8, 2549. https://doi.org/10.3390/app8122549
Hwang SH, Kim S, Lee K-C, Jang SY. Effects of Long-Wavelength Track Irregularities Due to Thermal Deformations of Railway Bridge on Dynamic Response of Running Train. Applied Sciences. 2018; 8(12):2549. https://doi.org/10.3390/app8122549
Chicago/Turabian StyleHwang, Sung Ho, Sungil Kim, Kyoung-Chan Lee, and Seung Yup Jang. 2018. "Effects of Long-Wavelength Track Irregularities Due to Thermal Deformations of Railway Bridge on Dynamic Response of Running Train" Applied Sciences 8, no. 12: 2549. https://doi.org/10.3390/app8122549