Article

Dryout and Replenishment of Bottom-Heated Saturated Porous Media with an Overlying Plain Water Layer

by
Montserrat Carbonell
1,
Luis Virto
2 and
Pedro Javier Gamez-Montero
2,*
1
Department of Fluid Mechanics, Universitat Politecnica de Catalunya, Av. Victor Balaguer 1, 08800 Vilanova i La Geltru, Spain
2
Department of Fluid Mechanics, Universitat Politecnica de Catalunya, Campus Terrassa, Colom 11, 08222 Terrassa, Spain
*
Author to whom correspondence should be addressed.
Appl. Sci. 2018, 8(12), 2607; https://doi.org/10.3390/app8122607
Submission received: 7 September 2018 / Revised: 5 December 2018 / Accepted: 10 December 2018 / Published: 13 December 2018
(This article belongs to the Section Mechanical Engineering)

Abstract

:
The aim of this paper is to elucidate the influence of the physical properties of both phases—solid matrix and saturating liquid—of bottom-heated porous media with an overlying plain water layer. The dryout, the stability of the system’s water layer-vapor region, and the thermal state evolution are studied. The porous media under study are a bronze powder saturated by water, and a solution of surfactant and coarse sand saturated by the same liquids. From the experimental data obtained, a theoretical approach is carried out to describe the dryout and rewetting process. The influence of the nature and physical properties of the solid and liquid phases is also analyzed, with special attention to the addition of surfactant in the saturating liquid.

1. Introduction

A review of the previous research regarding the dryout of bottom-heated saturated porous media shows, by the large number of published papers, the remarkable interest of researchers in this phenomenon over recent decades. However, there is a lack of publications related to the dryout/replenishment phenomena in porous media with an overlying liquid layer limited by a free surface.
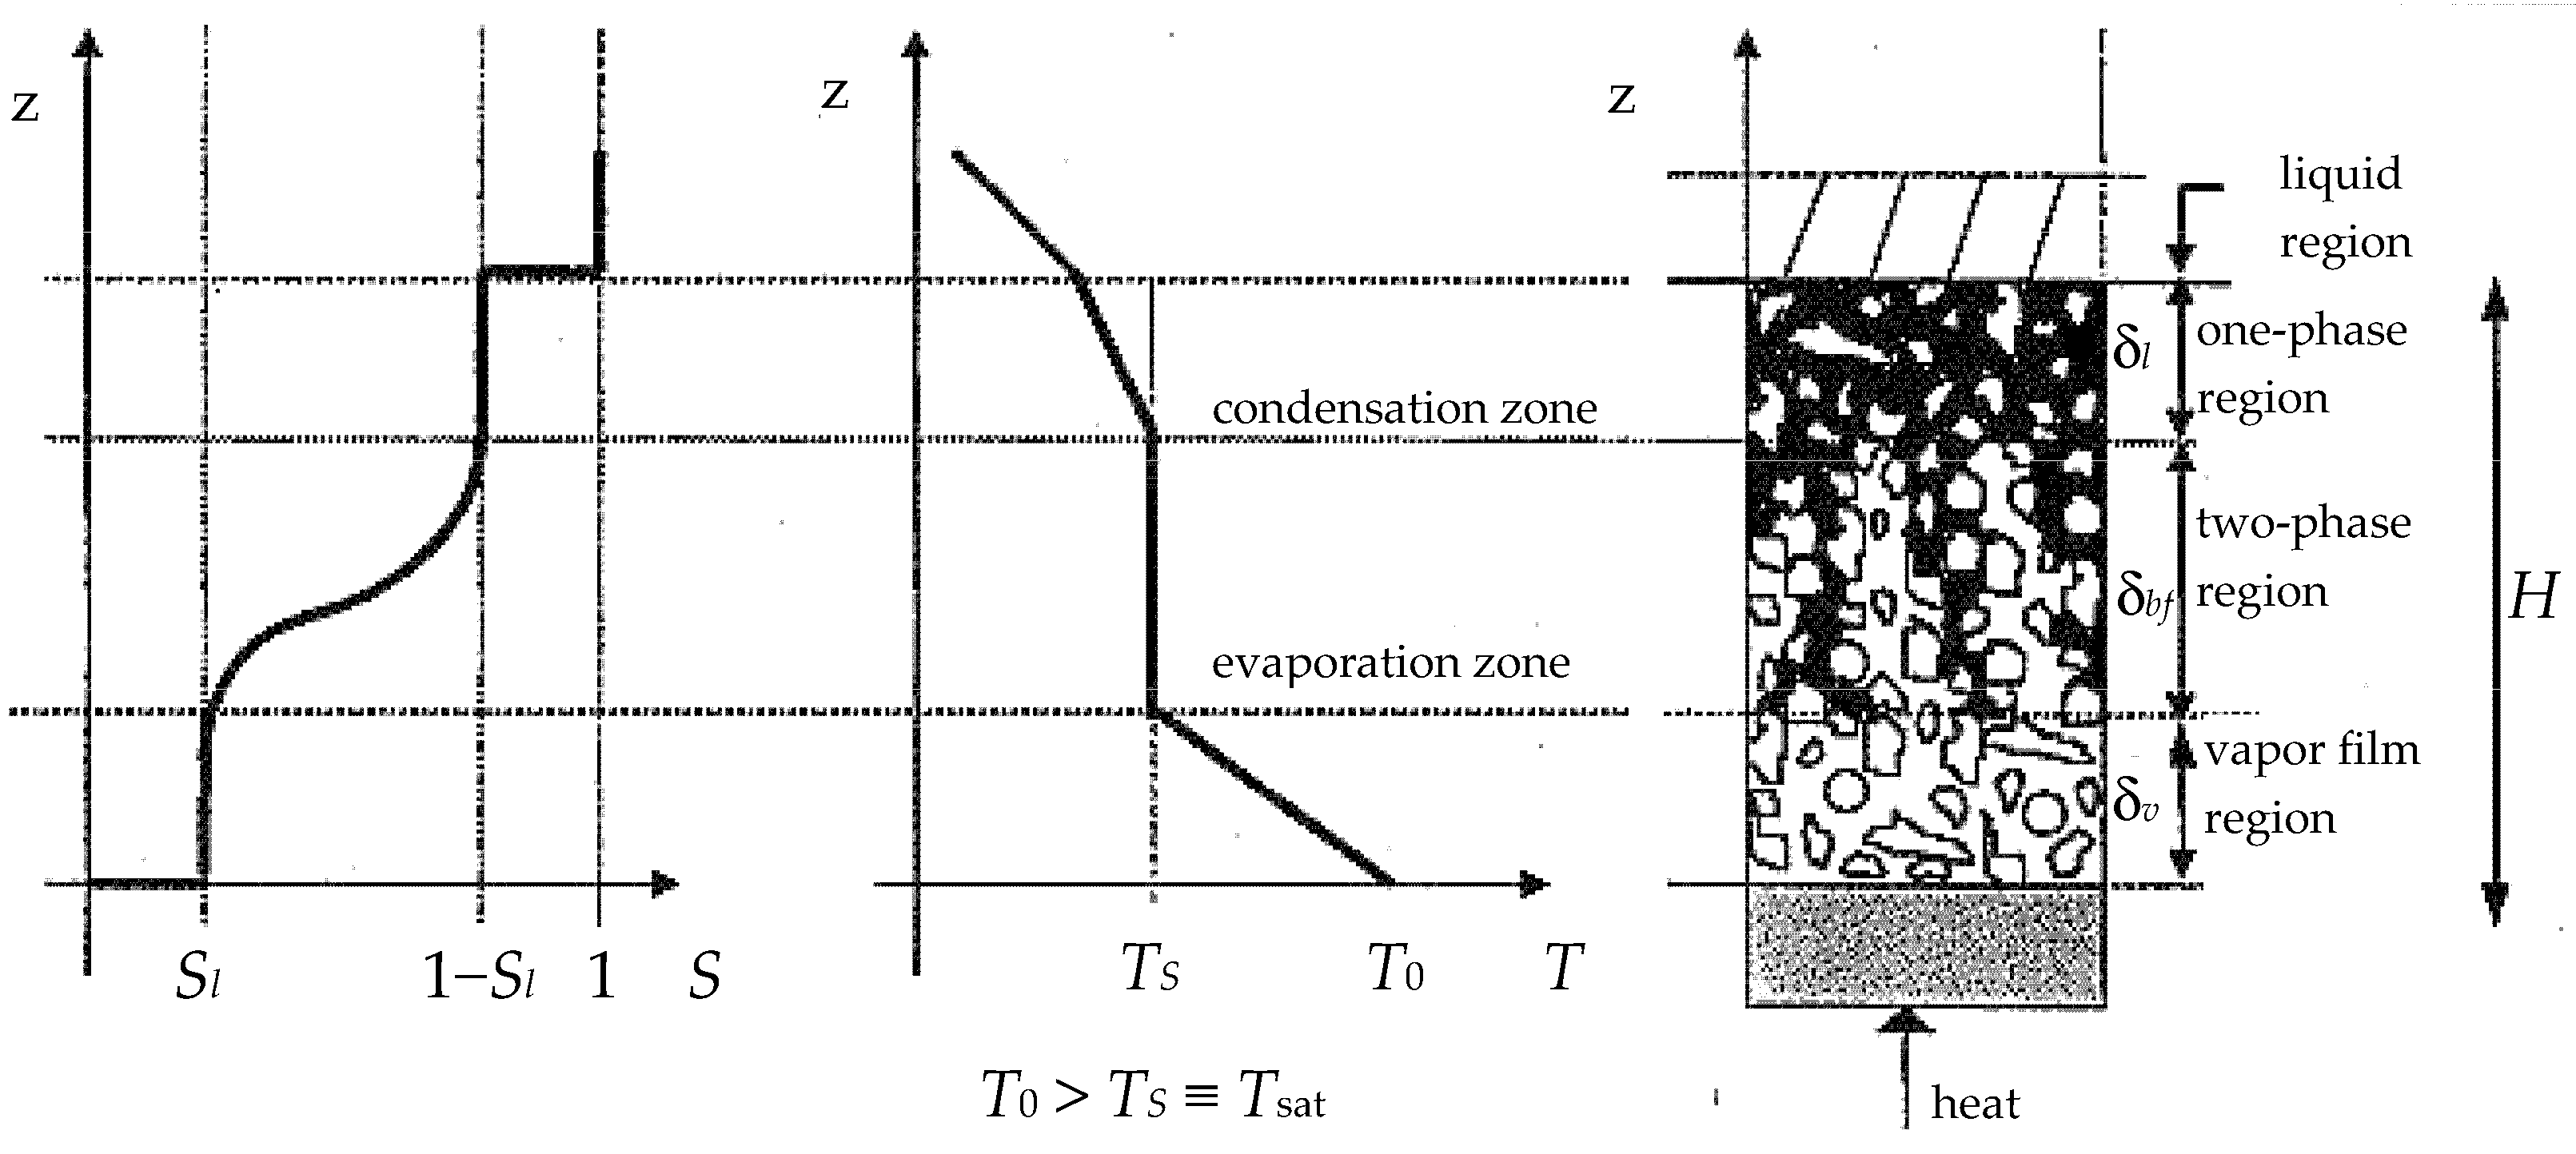
Dryout following boiling in porous media occurs in many engineering applications, such as geothermal systems, heat pipes, and post-accident analyses of liquid-cooled nuclear reactors. Since uncertainties exist about many aspects of the boiling process, experimental studies intend to elucidate the heat transfer process from the heating surface to the porous medium. A thin liquid layer in contact with the heating surface, a vapor layer, and a layer with both regions—vapor and liquid—can exist during this process. Experimental studies report the formation of an isothermal two-phase zone above the bottom whenever the temperature there exceeds saturation.
The dryout condition requires accurate knowledge of how the vapor condenses on the capillary surface of the two-phase region in the porous media, and how the interface of the two-phase plain liquid saturated regions moves upward. In this regard, the works of the researchers Leverett [1], Philip and DeVries [2], Ecker and Faghri [3], Su [4], Stemmelen et al. [5], Shahraeeni [6,7] and many others have contributed to better knowledge of the aforementioned phenomena.
The transport of heat from the liquid–vapor countercurrent in a two-phase liquid layer region was studied by Sondergeld and Turcotte [8]. When boiling occurs, an almost isothermal two-phase zone forms near the bottom. Bau and Torrance [9] reported experimental observations of boiling in a vertical circular cylinder heated from below and cooled from above. A simple one-dimensional model is used to predict the high of this zone, the necessary condition for its formation, and the dryout heat flux.
The effects of gravity, capillarity, multiphase flow, and phase change in a fluid-filled porous media were studied by Udell [10,11] by means of one-dimensional analysis considering steady-state conditions. If a critical heat flux is exceeded, a vapor zone will occur at the heated surface. In this study, Udell established the criteria for determining the heat flux at the dryout.
The dryout heat flux in particulate beds heated through the base has also been studied. Jones et al. [12], in a laboratory study, discussed the role of capillary forces in bed dryout. Then, Ramesh and Torrance [13] reviewed the interaction between boiling and convection phenomena in a fluid-saturated porous layer heated from below and cooled from above. They used a stability diagram to provide a qualitative understanding of the experimental results.
With regards to model boiling and dryout in particle beds, and concurrent with the experimental research, significant efforts have been made to develop understanding in this area. The aim of most of these models is to predict the incipient dryout power, namely the necessary power level to cause the appearance of a dry area in the bed. Dhir and Catton [14] presented a model based on their experiments. A step forward was made by Hardee and Nilson [15] when they considered the combined resistances of liquid and vapor flow and developed their dryout criterion based on the conservation laws for mass, momentum, and energy. Shires and Stevens [16] extended the Hardee-Nilson model to include the effect of capillary forces and Lipinski [17,18] went further in the same direction, assuming a capillary force and using the relative permeability to express two-phase friction. For the dryout in channeled porous beds, the modeling efforts for determining the heat flux refer only to shallow beds. Most of the related studies, such as those by Jones et al. [12], Dhir and Catton [14], and Dhir and Barleon [19], involved bottom-heated cases.
On the other hand, the studies of heat transfer, boiling, and dryout in porous media, with and without channels and surfactant addition to the saturating liquid phase, are limited. Tzan and Yang [20], Carbonell [21] and Cheng et al. [22] have studied the effects of surfactant solutions on critical heat flux under boiling conditions.
The work presented in this paper is also intended to study the replenishment phenomenon of the porous media occurring immediately after dryout. The discharge of liquid from the overlaying layer to the porous medium should be interpreted as a result of the gravitational instability of a layer of water on steam. This interface instability has attracted much attention in the scientific community because of its wide applicability in the fields of geothermal reservoirs. The papers published by Schubert and Straus [23], Eastwood and Spanos [24], Pestov [25], Hager and Whitaker [26], and Tsypkin and Il’icher [27] are examples.
Finally, the thermal instability in a porous medium of a non-Newtonian fluid is also attracting much attention. As a recent example, Celli et al. [28] presented a two-dimensional analysis of thermal convective instability of a power-law fluid flowing in a horizontal porous layer. They compare and contrast the theoretical results with experimental work.
The aim of this paper is to elucidate the influence of the physical properties of both phases—solid matrix and saturating liquid—of bottom-heated porous media with an overlying plain water layer. Then, the main contribution of this work is in theoretical and experimental studies that lead us to a better understanding of the particle diameter and surface tension roles; in particular, the roles that they play in the thermal state evolution on the dryout and stability of the system water layer-vapor region of porous medium heated from below with an overlying water layer limited by a free surface.

2. Nature of Porous Media and Their Physical Properties

In this work, two porous media are studied: bronze (B) powder (88–90% Cu, 10–12% Sn-C90700) and sand (S). In the first case, both saturated by distilled water (W), (B+W and S+W, respectively) are used; in the second case, both saturated by an aqueous solution of 0.8 g/L of the non-ionic surfactant (DS) Nonilfenol 30-OE (B+DS and S+DS, respectively) are used. This concentration guarantees do not exceed the critical micelle concentration (CMC) of the surfactant.

2.1. Physical Properties of Each Phase

The physical properties of each phase of the porous medium that influence the phenomena studied are: particle size, specific surface, density, specific heat and thermal conductivity of the solid phase, density, kinematic viscosity, surface tension, specific heat, and thermal conductivity of the liquid phase. These physical properties are shown in Table 1 and Table 2 for the solid and liquid phases, respectively.

2.2. Saturated Porous Media Characteristics

The saturated porous media are most often characterized by its porosity, intrinsic permeability, and effective thermal conductivity. The relative uncertainty of porosity and intrinsic permeability were 0.28% and 0.26%, respectively. The relative uncertainty of the effective thermal conductivity was 0.16% (B+W, B+DS) and 0.31% (S+W, S+DS). The experimental methodology can be found in [21] and Table 3 shows the main results.

3. Heating Experimental Study to Dryout

3.1. Experimental Set-Up

Figure 1 depicts the mechanism of evaporation in a porous media limited by an overlying water-free surface due to the heat addition from below at temperatures above the saturation (Carbonell [21], Kaviany [29]), and Figure 2 shows a photograph and a drawing of the experimental set-up used to study the response of porous media to bottom heating. The porous medium was placed in a cylindrical stainless steel cell (boiling cell) of 15 cm in internal diameter and 14 cm in height. The interior of the cell was painted to prevent galvanic corrosion. An aluminum plate of 14.8 cm in diameter and 4 cm in height was located at the bottom of the cell, with 3 cm inside. For the electric heating of the aluminum plate, a DC power supply was used with voltage and current ranges of 220 V and 5 A, respectively. The instrumental error for voltage and intensity were 1.0 V and 0.01 A, respectively. Several layers of insulating material to prevent heat losses as much as possible covered the ensemble.
A tray for collecting the liquid displaced from the porous medium during the heating process was placed above the cell. A non-deformable layer of nylon fabric was placed between the cell and tray to avoid the displacement of the solid matrix of the porous medium as a consequence of the boiling process of the fluid phase.
The boiling cell was equipped with various T-type thermocouples, as shown in Figure 2. The measurement of the temperature on the heating plate was carried out with three thermocouples at different heights, one of which was located at the center (T7) and the other two at 1.5 cm on both sides of the center (T6 and T8). The temperature of the porous medium measured with five thermocouples at different heights and radii, from T2 to T5, and the liquid accumulated in the cuvette with one thermocouple (T1). The thermocouples of the heating plate were introduced through small holes of different lengths, and finally sealed with heat-conductive adhesive. After the calibration of the T-type thermocouples, the accuracy in the measurement of the temperature was ±1.0 °C.
The measurement of pressure was carried out with four piezometric probes with a precision of ±2.45 N/m2 (±0.25 mm.w.c.). They were located inside the porous medium, at different heights and distances from the plate (P1 to P4). The level of liquid in the tray was measured by using a limnimeter (with an accuracy of ±0.5 mm). In addition, temperature and humidity data were also collected.
The power supplied to the porous media was 300 W ± 5 W. The pressure and temperature measurements were taken every 60 s during a period of 4 h in each of the porous media studied and recorded by a data acquisition system (Figure 3).

3.2. Experimental Results

Figure 4 shows the temperature distribution of the bottom-heated porous media.
Figure 5 shows the volume of the liquid accumulated in the tray.

4. Discussion

4.1. Heating Process to Dryout-Replenishment

Figure 4 shows that the temperature distribution in the bronze powder porous media is very different from the temperature distribution in sand porous media. Moreover, the influence of the nature of the saturating liquid in sand porous media is very important.
To clarify the causes of such differences, the value of the Rayleigh number and the Bond number were calculated for the temperature difference between the ends of the porous medium when the heating plate reaches the temperature of 100 °C. (Table 4): ΔT = 70 °C for B+DS and B+W, and ΔT = 35 °C in the S+DS and S+W). The uncertainty values of Rayleigh and Bond numbers shown in Table 4, as in the rest of tables, were obtained by propagation of error analysis according to Coleman and Steele [30].
The values obtained from the Rayleigh number for the porous media B+W and B+DS, are much lower than the limit for instability to appear, set at 27.10 according to Nield and Bejan [31]. Nevertheless, the values for the sand-based porous media significantly exceed the limit of instability; consequently, the process of heat transfer in this medium is conduction driven by convection/advection, while in the former it is practically by conduction (Fourier). On the other hand, the value of the Bond number is less than 1 in all porous media; therefore, the flow is dominated by capillarity.
A more detailed analysis allows us to elucidate that the process of heating the porous media consists of several stages with notable differences between them. For this purpose, the temperature ratios of the thermocouples T5/T6 and T4/T6 are depicted in Figure 6.
By observing Figure 6, the process of heating to dryout-replenishment is characterized by several thermic stages. The peculiarities of each stage are as follows:
  • Stage A–B. Heating of the porous medium essentially by non-stationary conduction (B+DS), or by conduction/convection/non-stationary advection (S+DS) until the surface temperature of the heating plate reaches 100 °C.
  • Stage B–C. Progressive increase of the temperature in the porous medium until boiling occurs at the plate-porous medium interface, keeping the plate temperature constant at approximately 102 °C.
  • Stage C–D. Boiling extends throughout the porous medium, which is maintained at a constant temperature slightly higher than 100 °C until the beginning of the dryout. Subsequently, continuous rising of the temperature of the plate above 100 °C occurs while the porous medium keeps its temperature slightly higher than 100 °C.
  • Stage D–E–F. For the sand-based porous media only, the relative evolution of the temperature porous medium-plate when the dryout-replenishment occurs is seen. From the beginning of the process to the end of the CD stage, displacement of liquid from the porous medium to the tray takes place. Liquid displacement results in the formation of a two-phase zone in a porous medium.

4.2. Heat Transfer from the Heating Plate to the Porous Medium

The magnitude of the temperature difference in the heating plate interface (T6) and the porous medium (T5) informs us about the process of heat transfer. In the boiling stage the temperature difference is 2 °C in the S+DS, and approximately 3 °C in the B+DS. At the end of this stage, the dryout starts in the S+DS and finishes with a temperature difference in the interface of 14 °C. A pronounced temperature rise occurs at the plate, then the B+DS is kept boiling. This is possibly due to the formation of a vapor layer with very low thermal conductivity at the interface.
The calculation of the heat transfer between the heating plate and the porous medium has been carried out by the energy balance method, according to the following equation:
W ˙ t f = W ˙ e l e c W ˙ c , p l
where W ˙ t f is the power transferred by the heating plate to the porous medium, W ˙ e l e c is the electrical power supplied to the heating plate and W ˙ c , p l is the power dissipated for the heating of the plate. This power is calculated by the equation:
W ˙ c , p l = 0 e ρ c p T ( T t ) z , t A d z ρ A i = 1 n [ c p T ( T t ) z , t Δ z ] i
where A is the area of the surface of the plate in contact with the porous medium, e is its thickness, ρ and cp are the density and the specific heat of the aluminum, and ( T / t ) z , t is the temperature variation per unit of time at the point z of the plate and instant t of the heating process. Figure 7 shows the results obtained for all the porous media studied throughout the experimentation.

4.3. Liquid Evaporation from the Tray

For the calculation of the evaporation rate of the liquid phase in the free surface of the tray, the equation proposed by Shah [32] was adopted:
e ˙ = 9.72 × 10 3 ρ w ( ρ r ρ w ) 1 / 3 ( W w W r )
where e ˙ is the evaporation rate, ρw and Ww are the density and specific humidity of the air at the saturated water temperature, and ρr and Wr are the density and specific humidity of the air at ambient temperature and humidity.
The calculation of e ˙ involves knowing the water temperature at the free surface. To carry out this calculation, the method developed by Chu and Goldstein [33] has been applied. The method derives a relationship between the temperature distributions in dimensionless form θ = | T z T m | / 1 2 Δ T and a dimensionless distance η = z / δ , where z is the distance to the bottom of the liquid tray at temperature Tz. Moreover, δ is the thickness of the boundary layer as δ = h c / 2 N u , while hc is the water layer thickness and the Nusselt number has the following expression in function of the Rayleigh number:
N u = 0.183 R a 0.278
The value of ΔT corresponding to the thickness of the liquid layer in the tray (2, 3, 3, 4 and 5 cm) has been calculated by a successive approximation procedure from the value of the Rayleigh number Ra < 1708, which ensures a stable regime, and from the value of the temperature of the liquid at the bottom of the tray, measured by thermocouple 1 (T1). The results obtained that the entire liquid layer is practically at the same temperature as the one measured by thermocouple 1, corresponding to the bottom of the tray.
Once the value of this temperature is known, the evaporation rate can be calculated by means of Equation (3). From these values, the evaporative volumetric rate e ˙ v = e ˙ A c b / ρ l is calculated and, afterwards, the volume of liquid evaporated Vev versus time by the integral:
V e v = t i t f e v ˙ d t
The results are shown in Figure 8.

4.4. Total Volume of Liquid Displaced from Porous Medium to the Tray

The real total volume (referred to as the initial state) of liquid displaced from each porous medium during the heating process, Vdt, is the sum of the accumulated volume in the tray Vac (calculated from the limnimeter measurements) and the evaporated volume, Vev, subtracting the volume due to thermal expansion, Vet, using (Figure 9):
V d t ( t ) = V a c ( t ) + V e v ( t ) V e t ( t )

4.5. Power Required for the Evaporation of the Total Volume of Liquid

Assuming that the total volume of liquid displaced from the porous medium per unit of time is previously evaporated at the interface of the plate and porous medium, the required thermal power is expressed as:
W ˙ e v ( t ) = ρ l d d t ( V d t ) { Δ h l , v + c p Δ T }
At all times, the values of t, T ,   Δ T   and   V d t , and thus ρ l ,   c p and Δ h l v are known. The value of d ( V d t ) / d t is calculated from the function V d t = V d t ( t ) . Having neglected the term c p Δ T because it is much smaller than Δ h l v , the use of Equation (7) in relation to the porous media B+DS and S+DS gives the results shown in Figure 10.
In Figure 10, the curves W ˙ t f = W ˙ t f ( t ) of Figure 6 have also been drawn to identify the intervals of t in which the thermal power transferred to the porous medium by the heating plate, W ˙ t f , is lower than that required for the evaporation of the total volume of liquid displaced from the porous medium per unit of time.
The thermal power required to evaporate the total volume of liquid displaced per unit of time is much higher than the power available during practically all the heating time of the porous medium. This means that the displacement of liquid is almost entirely due to a piston effect created by capillary action.
The vapor generated by the thermal power that the plate transfers at each instant to the porous medium at the interface produces an increase in the pressure in the two-phase region. This pressure promotes the displacement of liquid from the saturated region until, by expansion, it reaches a new state of equilibrium. This displacement occurs as soon as the following condition is satisfied:
p c g ( 0 e c s ρ d z + 0 h ρ d h ) + Δ p R
where pc is the capillary pressure, ecs is the thickness of the saturated layer, h is the height of the liquid layer in the tray, and ΔpR is the resistance to flow in the capillary defined by Rumpf-Gupte’s law.

4.6. Power Required for the Evaporation of the Liquid in the Tray

The power required at each instant to evaporate liquid from the tray is calculated by the equation:
W ˙ e v , c b ( t ) = e ˙ ( t ) A c b Δ h l v
where Acb is the area of the free surface of the liquid in the tray, and ė is defined by Equation (3). Figure 11 shows the results.

4.7. Heating the Porous Media

The heat accumulated by the porous medium at time t, once the temperature field is known, is very difficult to determine due to the following reasons: it is a non-stationary process, specific heats of both phases are a function of temperature, and the ignorance of the value of the interstitial heat transfer coefficient.
However, even if the existence of these factors is accepted, one can ask whether, given the slowness with which the temperature varies, the application of the Fourier law or the methods developed for the non-stationary regime, such as those by Price [34] and Nozad et al. [35], can be accepted as a good approximation assuming the local thermal equilibrium condition.
This question can be answered by determining the values of the characteristic time of conduction and the value of the Biot number of the porous media being studied. The characteristic time of conduction is defined as t c = L c 2 / α f , and the Biot number as B i = h s f L c / λ f , where L c = d ¯ p / 2 , αf is the thermal diffusivity, λf is the thermal conductivity and hsf is the interstitial heat transfer coefficient, the value of which is calculated by applying the Wakao and Kaguei [36] correlation for spherical particles, as follows:
h s f d ¯ p λ f = 2 + 1.1 R e 0.6 P r 1 / 3
where R e = v D d ¯ p / ν = ε v p o d p ¯ / ν and P r = ν / α f . Once the values of tc and Bi are calculated, Table 5 and Table 6 show magnitude values and the results corresponding to the condition of maximum velocity of the liquid to the tray, together with the residence time tr. The uncertainty in each of the fluid properties was estimated to be 1%.
From the results, it can be seen that the characteristic time is greater than the residence time in all the porous media studied. Then, at the interface of the solid and boundary layer of the liquid flow, the temperature variation of the solid shows a large delay with respect to the liquid. Therefore, the local thermal equilibrium is far from being reached.
Owing to the values of tc/tr and the Biot number, the calculation of the heating rate of the porous medium over time cannot be carried out with the two-temperature model. Instead, an approximate indirect procedure—the thermal power balance approach—is used:
W ˙ c , m p ( t ) = W ˙ e l c ( t ) ( W ˙ c , p l + W ˙ e v , c + W ˙ c , l + W ˙ p ) ( t )
In this equation, the terms W ˙ c , l (increase of the sensible heat of the liquid of the tray and the evaporated liquid in the interface plate-porous medium) and W ˙ p (losses due to insulation failure and increase in the temperature of the metallic cover of the porous medium) can be neglected, and then the equation results in:
W ˙ c , m p ( t ) W ˙ e l c ( t ) ( W ˙ c , p l + W ˙ e v , c ) ( t ) = W ˙ t f ( t ) W ˙ e v , c ( t )
By taking into account the previous Equations (1) and (9), the results are shown in Figure 12.

4.8. Formation of the Two-Phase Region

4.8.1. Thickness and Hydrostatic Pressure

As a result, of the displacement of liquid from the porous medium to the tray, its saturation progressively decreases, causing the formation of a two-phase region in which thickness increases over time. This thickness, zbf, is calculated as a function of time by means of the equation:
z b f ( t ) = V d t ( t ) A ε
and Equation (6). The thickness of the saturated layer of the porous medium, hsat, is calculated as:
h s a t ( t ) = h m p z b f ( t )
where hmp is the initial thickness. Figure 13 shows the values of the thickness of the saturated layer of the porous media.
The hydrostatic pressure Phs in this region can be evaluated as:
p h s = z p l h m p ρ ( T m p ) g d z + 0 h c b ρ ( T c b ) g d z
where zpl is the distance to the plate of the interface between the two-phase region and the saturated region of the porous medium. By knowing the density values at the temperature of the liquid in the saturated region ρ ( T m p ) and in the tray ρ ( T c b ) , Equation (15) is applied to the porous media studied, giving the results shown in Figure 14.
We proceed now to compare the vapor pressure corresponding to the surface temperature of the plate in contact with the porous medium, Pv(Tpl), with pressure at the temperature at the interface, (Psat)d, and the hydrostatic pressure, Phs. The saturation vapor pressure in the thin layer of capillary condensation, assuming negligible solute effects, is calculated by the Kelvin equation (Carey [37]):
( P s a t ) δ P s a t ( T δ ) = e 2 σ r m ρ l R T δ
where Psat(Tδ) is the saturated water vapor pressure at the vapor absolute temperature Tδ; σ is the surface tension of liquid water in contact with its own vapor, ρl is the liquid density, and rm is the mean meniscus radius. Figure 15 shows the results of these magnitudes.
By observing Figure 15, it is verified that the vapor pressure in the interface is higher than the hydrostatic pressure. The pressure difference, or capillary pressure, promotes its displacement and, consequently, the displacement of liquid to the tray, meanwhile the vapor expands to reach a new state of equilibrium.

4.8.2. Temporal Evolution of the Saturation in the Porous Media

The saturation value is calculated by the following this equation:
S ( t ) = ( V s a t V d , t ( t ) ) V s a t
where Vsat is the initial saturated liquid volume in the porous medium (1007.5 cm3 for the sand-based medium and 954.4 cm3 for those based on bronze powder), and Vd,t(t) is the total volume of liquid displaced from the porous medium at time t. Figure 16 shows the results obtained corresponding to the state of dryout prior to the replenishment of the porous medium.

4.8.3. Interface Displacement and Capillary Liquid Velocities

The interface displacement velocity between the two-phase and saturated zones has been approximately calculated by dividing the derivative of Vdt(t) by Ae. The results are shown in Figure 17.
This method of calculation is a rough approximation. The average velocity of liquid displacement by the capillaries in the saturated region of the porous medium must be calculated with the following equation:
v ¯ = k r l k μ ¯ [ z { p c ρ g β ( T s i T s c ) } ]
where pc is the capillary pressure in the interface between the two-phase and saturated zones, and Tsi and Tsc are the liquid temperatures in the interface and the upper end of the porous medium, respectively. The capillary pressure is calculated by using Equation (8) and its gradient as:
( p c ) / z = σ c o s θ ϕ / k J ( S ) τ h h s t
where τ is the capillary tortuosity and hhst is the distance to the interface from the free surface of the liquid in the tray. It is possible to relate the capillary pressure in the two-phase zone with the global saturation measured as propose by Stubos [38,39]. The form proposed by Lipinski [18], to fit the data given by Scheidegger on sands, is:
J = ( s e f 1 1 ) 0 , 175 5 ,   s e f = s s r 1 s r
By knowing the value of Sef for the porous media at any time t, the pressure gradient is calculated by means of Equation (19) and the average velocity of the liquid displaced to the tray by using Equation (18), but only if Darcy’s law and the Boussinesq approximation are accomplished.
As an example, the velocity of the liquid has been calculated through the saturated layer of the porous medium B+DS at time 5220 s, obtaining a velocity of 0.03 mm·s−1. The same order of magnitude obtained from the experimental results is 0.02 mm·s−1.

4.9. Dryout and Replenishment

The dryout occurs in all porous media studied but appears earlier and more frequently in sand-based media than in bronze media. Replenishment only occurs in sand media and is more pronounced in those saturated by a surfactant solution.
The dryout process is progressive: the drying of the porous medium in contact with the heating plate occurs gradually. From the experimental results, several conditions of the dryout process concur, such as cessation of the saturation liquid displacement of the porous media to the tray, minimum saturation value of the porous medium, progressive elevation of the surface temperature of the heating plate in contact with the porous medium, and the maximum value of the vapor pressure in the two-phase zone.
Table 7 includes the values of the magnitudes corresponding to the state of total dryout: the maximum volume of liquid displaced to the tray (Vdt), maximum temperature reached by the surface of the plate in contact with the porous medium (Tpl), and maximum vapor pressure in the two-phase zone (Pvbf). The time corresponding to the state of total dryout (tdr) and the degree of saturation (S) have also been included.
Regarding the phenomenon of replenishment, it occurs when total dryout is reached. Figure 18 shows the significant magnitudes in the phenomenon of dryout-replenishment corresponding to the porous media S+W in a time interval between the replenishment and the dryout.
With regards to the influence of the vapor pressure, it is observed that once boiling occurs throughout the porous medium, the absolute pressure in the two-phase zone is 1.023 ≤ pv ≤ 1.036 bar. These limits represent an overpressure of 0.009 ≤ Δpv ≤ 0.022 bar, where the maximum value is measured in the piezometer 4 (0.022 ± 0.001 bar), corresponding to a time prior to the dryout-replenishment in the S+DS porous medium. Figure 19 and Figure 20 depict the correlations between three of the magnitudes that identify the dryout-replenishment phenomena.

5. Modeling the Specific Critical Flow of Heat and Replenishment

The porous media studied reach the state of total dryout progressively. The drying begins in the areas of capillaries of greater diameter, ending where their diameter is smallest. Therefore, the thermal power generated by the dryout depends on the pore size distribution.

5.1. Dryout Model

The dryout model proposed in this work is based on the fact that it is a progressive phenomenon bounded by two limits: the beginning and end of the process. The beginning of the process occurs as soon as a vapor bubble forms on the heated plate-saturated porous medium interface. The end occurs when the flow of liquid displaced to the tray tends to zero. The thermal power needed to produce total dryout is formed by two terms: the term required to lead the porous medium to the state prior to the bubble formation, and the term required to generate it.

5.1.1. Beginning of the Process

Once the previous thermal state has been reached, the formation of the first vapor bubbles will occur in those parts of the heated plate-saturated porous medium interface where the larger diameter capillaries are located. The bubble radius is calculated as a function of the superheating ΔT to be approximately:
r 2 σ T p c ρ v Δ h v Δ T
Bubbles of radius r* > r are in liquid that is superheated, and they can continue to grow. The thermal power at onset of dryout is calculated as:
W ˙ d r , i = C ε A v D v ρ v Δ h l v ( T p c )
where C is the fraction of the pore surface area of greatest diameter through which the flow of liquid displaced to the tray occurs by capillary action, and vDv is the Darcian velocity of the vapor through the two-phase zone, defined as:
v D v = k r v · k μ v d p c d z
where p c = 2 σ c o s θ / r p and r p > r > r = 2 σ T s ρ v Δ h l v Δ T e f , which is the Thomson equation for nucleated boiling bubble formation.
For particles with a diameter greater than 1 mm, the equation proposed by Wu [40] is used:
r p = 1 2 e x p ( 0.01 N i l n d p , i )
where Ni is the percent of the total mass of particles with a diameter equal to less than dp,i. Additionally, d p c / d z = p c / e c s where ecs is the thickness of the saturated layer of the porous medium.
As an example, the conditions of the process when the dryout begins for the B+DS porous medium are as follows:
t i , d r = 2400   s ,   T p l = 102   ° C ,   T m p = 100   ° C ,   T c b = 19   ° C ,   V d = 1.4 × 10 4   m 3 ,
e c s = 0.12   m ,   S = 85 % ,   W ˙ e v 0 ,   W ˙ c p l = 43   W ,   W ˙ t f 232   W ,   W ˙ e l 275   W   ,
σ = 46.415 0.13124   T ( ° C )   mNm 1 ,
k = 3.92 × 10 11   m 2 ,   k r v = 0.62 ,   μ v = 12.3 × 10 6   m 2 s 1
By substituting these values, the results are:
σ = 33.3 × 10 3   Nm 1 ,   Δ T e f = 2   ° C ,   r = r p 3 × 10 6   m , d d z p c = 0.573 1 r p
Now, the calculation of W ˙ d r , i requires adopting values of C and rp, taking into account the conditions imposed for Ni and rp. It is known that the smallest significant diameter of a particle is 161.9 × 10⁻⁶ m and the minimum porous radius is 0.034 mm (evaluated by using r p , m i n 0.21 d p , Faghri [41]) greater than 0.003 mm. By introducing these values to Equation (23), vDv = 0.0336 ms−1 is obtained. Afterwards, these values are substituted in Equation (22) and W ˙ d r , i = 288 C W. The thermal power transferred by unit area of the heating surface is 16 , 650 C Wm−2; this value is in the region of nucleate boiling of water at 100 °C from a horizontal heated surface, according to Jacob et al. [42].
Taking C ≈ 1, W ˙ d r , i = 288 W is obtained. This power must be the sum of the required power to increase the temperature of the porous medium, W ˙ m p = 232 W, and bubble generation, of which the value should be 56 W. The theoretical calculation gives 57 W.

5.1.2. End of the Process

The end of the dryout process is reached when the time variation of the volume of liquid displaced from the porous medium to the tray is zero; that is d V d / d t = 0 . This is equivalent to the limit of the thermal power required for the formation of a vapor bubble from the smallest pores; that is lim W t f , r p 0 . These conditions also imply:
Δ T e f = lim r p 0 1 r p 2 σ T p l ρ v Δ h l v
Once rp and Tpl are known, ΔTef is calculated; subsequently:
W ˙ d r , f = C 1 ε A α Δ T e f
where C1 is the fraction of the minimum diameter pore surface area and α is the heat transfer coefficient at the plate-porous medium interface.
The experimental results indicate that the porous media based on bronze powder reach dryout when the volume of liquid accumulated in the tray is at maximum; however, the temperature of the plate continues to increase monotonically, which is explained by the evolution r p 0 and Δ T e f .
Actually, r p , m i n > 0 and the state of the system, when condition (25) is reached, is defined by the following values of the significant magnitudes of the problem:
t = 7800   s ,   T p l = 256   ° C ,   T m p = 101   ° C ,   Δ T e f = 155   ° C ,   T c b = 57   ° C   ,
V d t = 609 × 10 6   m 3 , e c s = 5.4 × 10 2   m ,   S = 36 % ,
σ = 33.2 × 10 3   Nm 1 , ρ v = 23.25   kgm 3 ,   Δ h v = 1676.25 × 10 3   Jkg 1 ,
W ˙ e l = 350   W ,   W ˙ c , p l = 35   W ,   W ˙ t f = 316   W
By substituting these values in Equation (21), the results are:
r p , m i n 0.4 × 10 6   m 0.0004   mm
This value of the minimum pore radius is lower than the value determined by the Faghri relation, which explains why the final state of dryout in the B+DS porous medium corresponds to a high saturation value. Now, it is necessary to calculate the fraction of the active pore area when the final state of dryout has been reached.
The use of Equation (26) with a value of α greater than 2000 Wm−2K−1 (lower limit of nucleated boiling) gives W ˙ d r , f 1978 C 1 W. The value 314 W is obtained by using the thermal power balance approach with a corresponding power per unit of heating surface area of 17,793 Wm−2 and α ≅ 2500 Wm−2K−1. According to this new value, a power of W ˙ d r , f 2472 C 1 W is obtained which corresponds to the balance value of C1 = 0.127; in other words, the fraction of the pore area that corresponds to a state of total dryout is 12.7%.
From the state of the system and the calculated pore radius value, it can be concluded that the plate-porous medium interface is a superheated steam layer from which heat is transferred to the porous medium practically only by thermal radiation. The range of values of thermal power applied to the porous media corresponding to the beginning of the dryout (i) and the total dryout state (f), calculated by the thermal power balance approach, are shown in Table 8.

5.2. Replenishment

The replenishment of the porous medium with liquid from the tray is the result of the gravitational instability of water on vapor, known as Rayleigh-Taylor instability [43,44]. In the present work, the replenishment occurs as soon as the capillary pressure is greater than the hydrostatic pressure in the interface of the saturated layer and the two-phase zone of the porous medium when the thickness tends to zero. This condition is expressed by Equation (8). The reduction in the surface tension of the saturating liquid favors the appearance of this phenomenon.

6. Conclusions

The dryout process studied here is different from the processes carried out by Dhir and Catton [45], Barleon and Werle [46], and Turland and Moore [47], among others. The investigations of these authors concern the safety of fast nuclear reactors, and study how to extract the heat from beds of fuel particles after an accident. The work presented investigates how dryout occurs in bottom-heated saturated porous media, behavior during and after the dryout, evolution and temperature, the value of the heat flow, and the influence of the physical properties of the solid matrix and the saturating liquid phase.

6.1. Influence of the Nature and Physical Properties of the Solid Phase

There are five physical properties of the solid phase that influence the fluid-thermal response of the porous medium: size of the particles, specific surfaces of the particles, density, thermal capacity, and thermal conductivity of the material.
Comparing the experimental results obtained with porous media based on sand and based on bronze saturated with the same liquid, the following conclusions can be drawn:
  • A larger particle size ensures a higher value of the intrinsic permeability for the same value—practically, the volume of the pore. The value of the Bond, Reynolds, and Rayleigh numbers of the porous medium increases, causing a change in mass flow rate and heat transfer.
  • The greater particle size, the lower value of the specific surface, capacity, and thermal conductivity, producing a state of thermal non-equilibrium.
  • The heating intensity of the porous medium decreases with the particle size and with a greater difference of the thermal conductivity between the liquid phase and the solid matrix.

6.2. Influence of the Surfactant

The addition of surfactant to the liquid phase of a porous medium is characterized by:
  • An important modification of the properties of the solid–liquid interface, and in the phase transition. In a granular porous medium (sand), it is manifested by a considerable increase in intrinsic permeability, which can be explained by the decrease of the surface tension that facilitates the desorption of gas on the surface of the solid phase. This result contradicts those obtained by Miller et al. [48] and Allred and Brown [49], among other researchers. However, it is known from Slattery et al. [50] that reducing the tension value at the interface increases the number of pores in which the displacement takes place by activating it.
  • A considerable decrease in the evaporation rate in the free surface of the water in the tray. This observed reduction would agree with some studies, such as that by Hightower and Brown [51], pointing out that the formation of a surfactant film on the free surface has a significant effect on the reduction of natural evaporation. However, in the most recent studies on the effects on subcooled boiling evaporation, such as that by Lehman [52], no relationship was detected between evaporation and surface tension reduction.
  • The condition of dryout-replenishment is reached more quickly the lower the capillary pressure and the greater the intrinsic permeability. The value of the liquid phase flow displaced from the porous medium to the tray increases significantly.
  • The heat transfer at the heating plate-porous medium interface increases as a result of better wetting. In addition, improvement in boiling heat transfer by surfactants is associated with lowering of interfacial tension at the heated surface, which allows smaller bubbles to release from the surface (Elghanam et al. [53]).

Author Contributions

M.C. and L.V. conceived and designed this study; M.C. carried out the experiments; L.V. modeled and analyzed the data; Writing-Original Draft Preparation, L.V. and P.J.G.-M.; Writing-Review and Editing, P.J.G.-M.

Funding

This research received no external funding.

Conflicts of Interest

The authors declare no conflict of interest.

Nomenclature

Aarea, m2
BiBiot number B i = h s f L c / λ f
BoBond number B o ( ρ l ρ v ) g d p 2 4 σ = ( ρ l ρ v ) g k σ ε
cpconstant pressure heat capacity, J·kg−1K−1
dpmean particle diameter, m
ethickness, m
e ˙ evaporation rate, kg·m−2s−1
hefdistance from the heating plate to the vapor—liquid interface, m
hlvlatent heat of evaporation, m2s−2
hsfinterstitial heat transfer coefficient, W·m−2K−1
J(s)capillary pressure function
k’intrinsic permeability, m2
krrelative permeability
LCcharacteristic length, m
NuNusselt number
ppressure, Nm−2
pCcapillary pressure, Nm−2
phshydrostatic pressure, Nm−2
rradius, m
Runiversal gas constant, J·mol−1K−1
RaRayleigh number R a = k g β l Δ T h ν l λ e / ( ρ c p ) l
ReReynolds number R e p = V d p ¯ / ν ( 1 ε )
Ssaturation
Sespecific surface, m−1
srresidual saturation
ttime, s
tccritique time, s
trresidence time, s
Ttemperature, °C or K
Vvolume, m3
vvelocity, ms−1
vDDarcy’s velocity, m·s−1
W ˙ power, W
Zbfthickness of two-phase region, m

Greek Symbols

αthermal diffusivity, m2s−1
βthermal expansion coefficient, K−1
Δincrement
εporosity
θcontact angle, deg
λthermal conductivity, W·m−1K−1
μdynamic viscosity, Pa s
νcinematic viscosity, m2s−1
ρdensity, kg·m−3
σsurface tension, Nm−1
τtortuosity

Subscripts

bftwo-phase region
lliquid property
vvapor property
mpporous medium
cbtray
satsaturated region
efeffective property
pparticle
drdryout
plplate

References

  1. Leverett, M.C. Capillary behavior in porous solids. Trans. AIME 1941, 142, 152–169. [Google Scholar] [CrossRef]
  2. Philip, J.R.; DeVries, D.A. Moisture movement in porous material under temperature gradients. Trans. Am. Geophys. Union 1957, 38, 222–232. [Google Scholar] [CrossRef]
  3. Eckert, F.R.G.; Faghri, M. A general analysis of moisture migration caused by temperature differences in an unsaturated porous medium. Int. J. Heat Mass Transf. 1980, 23, 1613–1623. [Google Scholar] [CrossRef]
  4. Su, H.J. Heat Transfer in Porous Media with Fluid Phase Change. Ph.D. Thesis, University of California, Berkeley, CA, USA, 1981. [Google Scholar]
  5. Stemmelen, D.; Dominiak, P.; Moyne, C. Ébullition en milieu poreux: Analyse expérimentale de la stabilité du front liquide-zone diphasique. Int. J. Therm. Sci. 1999, 38, 572–584. [Google Scholar] [CrossRef]
  6. Shahraeeni, E. Thermo-Evaporative Fluxes from Porous Media from Pore to Continuum Scale. Ph.D. Thesis, ETH Zürich, Zürich, Switzerland, 2010. [Google Scholar] [CrossRef]
  7. Shahraeeni, E.; Or, D. Pore-scale analysis of evaporation and condensation dynamics in porous media. Langmuir 2010, 26, 13924–13936. [Google Scholar] [CrossRef] [PubMed]
  8. Sondergeld, C.H.; Turcotte, D.L. An experimental study of two-phase convection in a porous medium with application to geological problems. J. Geophys. Res. 1997, 82, 2045–2053. [Google Scholar] [CrossRef]
  9. Bau, H.; Torrance, K.E. Boiling in low-permeability porous materials. Int. J. Heat Mass Transf. 1982, 25, 45–55. [Google Scholar] [CrossRef]
  10. Udell, K.S. Heat transfer in porous media heated from above with evaporation, condensation and capillary effects. J. Heat Transf. 1983, 105, 485–492. [Google Scholar] [CrossRef]
  11. Udell, K.S. Heat transfer in porous media considering phase change and capillarity—The heat pipe effect. Int. J. Heat Mass Transf. 1985, 28, 485–495. [Google Scholar] [CrossRef]
  12. Jones, S.W.; Epstein, M.; Bankoff, S.G.; Pedersen, D.R. Dryout heat fluxes in particulate beds heated through the base. J. Heat Transf. 1984, 106, 176–183. [Google Scholar] [CrossRef]
  13. Ramesh, P.S.; Torrance, K.E. Boiling in a porous layer heated from bellow: Effects of natural convection and a moving liquid/two-phase interface. J. Fluid Mech. 1993, 257, 289–309. [Google Scholar] [CrossRef]
  14. Dhir, V.; Catton, I. Dryout heat fluxes for inductively heated particulate beds. J. Heat Transf. 1977, 99, 250–256. [Google Scholar] [CrossRef]
  15. Hardee, H.C.; Nilson, R.H. Natural convection in porous media with heat generation. Nucl. Sci. Eng. 1977, 63, 119–132. [Google Scholar] [CrossRef]
  16. Shires, G.L.; Stevens, G.F. Dryout During Boiling in Heated Particulate Beds; AEE Winfrith Report AEEW-R 1779; UKAEA Atomic Energy Establishment: Winfrith, UK, 1980. [Google Scholar]
  17. Lipinski, R.J. A particle-bed dryout model with upward and downward boiling. Trans. Am. Nucl. Soc. 1980, 35, 358–360. [Google Scholar]
  18. Lipinski, R.J. A Model for Boiling and Dryout in Particles Beds; Report SAND 82-0765 (NUREG/CR-2646); Sandia National Laboratories: Albuquerque, NM, USA, 1982. [Google Scholar]
  19. Dhir, V.K.; Barleon, L. Dryout heat fluxes in a bottom heated porous layer. Trans. Am. Nucl. Soc. 1981, 38, 385–386. [Google Scholar]
  20. Tzan, Y.L.; Yang, Y.M. Experimental study of surfactant effects on pool boiling heat transfer. ASME J. Heat Transf. 1990, 112, 207–212. [Google Scholar] [CrossRef]
  21. Carbonell, M. Estudio Experimental del Proceso de Calentamiento de Medios Porosos Saturados Hasta Ebullición-Dryout de su Fase Líquida. Ph.D. Thesis, Universitat Politècnica de Catalunya, Barcelona, Spain, 1999. [Google Scholar]
  22. Cheng, L.; Mewes, D.; Luke, A. Boiling phenomena with surfactants and polymeric additives: A state-of-the-art review. Int. J. Heat Mass Tranf. 2007, 50, 2744–2771. [Google Scholar] [CrossRef]
  23. Schubert, G.; Straus, J.M. Gravitational stability of water over steam in vapor-dominated geothermal systems. J. Geophys. Res. 1980, 85, 6505–6512. [Google Scholar] [CrossRef]
  24. Eastwood, J.E.; Spanos, T.J.T. Stability of a stationary steam-water front in a porous medium. Transp. Porous Media 1984, 14, 1–21. [Google Scholar] [CrossRef]
  25. Pestov, I. Stability of vapor-liquid counter flow in porous media. J. Fluid Mech. 1998, 364, 273–295. [Google Scholar] [CrossRef]
  26. Hager, J.; Whitaker, S. Vapor-liquid jump conditions within a porous medium: Results for mass and energy. Transp. Porous Media 2000, 40, 73–111. [Google Scholar] [CrossRef]
  27. Tsypkin, G.; Il’ichev, A. Gravitational stability of the interface in water over steam geothermal reservoirs. Transp. Porous Media 2004, 55, 183–199. [Google Scholar] [CrossRef]
  28. Celli, M.; Barletta, A.; Longo, S.; Chiapponi, L.; Ciriello, V.; Di Federico, V.; Valiani, A. Thermal instability of a power-law fluid flowing in a horizontal porous layer with an open boundary: A two-dimensional analysis. Transp. Porous Media 2017, 118, 449–471. [Google Scholar] [CrossRef]
  29. Kaviany, M. Principles of Heat Transfer in Porous Media; Springer: New York, NY, USA, 1991; pp. 1–626. ISBN 978-1-4684-0412-8. [Google Scholar]
  30. Coleman, H.W.; Steele, W.G. Experimentation and Uncertainty Analysis for Engineers; John Wiley & Sons: New York, NY, USA, 1999; pp. 1–271. ISBN 0-471-12146-0. [Google Scholar]
  31. Nield, D.A.; Bejan, A. Convection in Porous Media; Springer International Publishing: New York, NY, USA, 2017; pp. 1–988. ISBN 978-3-319-49561-3. [Google Scholar]
  32. Shah, M.M. Methods for calculation of evaporation from swimming pools and other water surfaces. ASHRAE Trans. 2014, 120, 3–17. [Google Scholar]
  33. Chu, T.Y.; Goldstein, R.J. Turbulent convection in a horizontal layer of water. J. Fluid Mech. 1973, 60, 141–159. [Google Scholar] [CrossRef]
  34. Price, W.L.V. The calculation of thermal conductivity and thermal diffusive from transient heating measurements. Build. Environ. 1983, 18, 219–222. [Google Scholar] [CrossRef]
  35. Nozad, I.; Carbonell, R.G.; Whitaker, S. Heat conduction in multiphase systems—II: Experimental methods and results for three-phase systems. Chem. Eng. Sci. 1985, 40, 857–863. [Google Scholar] [CrossRef]
  36. Wakao, N.; Kaguei, S. Heat and Mass Transfer in Packed Beds; Gordon and Breach Science Pub: New York, NY, USA, 1982; pp. 1–359. ISBN 0-677-05860-8. [Google Scholar]
  37. Carey, V.P. Liquid-Vapor Phase-Change Phenomena: An Introduction to the Thermophysics of Vaporization and Condensation Processes in Heat Transfer Equipment; CRC Press: New York, NY, USA, 2007; pp. 1–600. ISBN 978-1-59169-035-1. [Google Scholar]
  38. Stubos, A.K. Experimental and Theoretical Investigation of Boiling in Liquid Saturated Porous Media; PR 1985-25; Von Karman Institute: Brussels, Belgium, 1985. [Google Scholar]
  39. Stubos, A.K.; Buchlin, J.M. Modeling of vapour channeling behaviour in liquid saturated debris beds. J. Heat Transf. 1988, 110, 968–975. [Google Scholar] [CrossRef]
  40. Wu, L.; Vomocil, J.A. Relationship between Particle Size, Aggregate Size, Pore Size and Water Characteristics. Master’s Thesis, Oregon State University, Corvallis, OR, USA, 1988. [Google Scholar]
  41. Faghri, A. Heat Pipe Science and Technology; Taylor and Francis: Washington, WA, USA, 1995; pp. 1–908. ISBN 978-1560323839. [Google Scholar]
  42. Jakob, M.; Linke, W. Der Wärmeübergang von einerwaagerechten Platte an seidendes Wasser. Forschung Auf Dem Gebiet Des Ingenieurwesens A 1933, 4, 75–81. [Google Scholar] [CrossRef]
  43. Rayleigh, L. Investigation of the character of the equilibrium of an incompressible heavy fluid of variable density. Proc. Lond. Math. Soc. 1883, 14, 170–177. [Google Scholar] [CrossRef]
  44. Taylor, G.I. The instability of liquid surfaces when accelerated in a direction perpendicular to their planes. Proc. R. Soc. Lond. A 1950, 201, 192–196. [Google Scholar] [CrossRef]
  45. Dhir, V.K.; Catton, I. Study of the Dryout Heat Flux in Beds on Inductively Heated Particles; NUREG-0262 USNRC; University of California: Oakland, CA, USA, 1977. [Google Scholar]
  46. Barleon, L.; Werle, H. Dependence of dryout heat flux on particle diameter for volume- and bottom-heated debris beds. Transf. Am. Nucl. Soc. 1981, 13, 1–37. [Google Scholar]
  47. Turland, B.D.; Moore, K.A. One-Dimensional Models of Boiling and Dryout. In Post Accident Debris Cooling; Braun: Karlsruhe, Germany, 1983; pp. 192–197. [Google Scholar]
  48. Miller, W.W.; Valoras, N.; Letey, J. Movement of two nonionic surfactants in wetable and water-repellent soils. Soil Sci. Soc. Am. J. 1975, 39, 11–16. [Google Scholar] [CrossRef]
  49. Allred, B.; Brown, G. Surfactants-induced reduction of saturated hydraulic conductivity and unsaturated diffusivity. ACS Symp. Ser. 1995, 594, 216–230. [Google Scholar] [CrossRef]
  50. Slattery, J.C.; Sagis, L.; Oh, E.-S. Interfacial Transport Phenomena; Springer US: Boston, MA, USA, 2007; pp. 1–828. ISBN 978-0-387-38438-2. [Google Scholar]
  51. Hightower, M.; Brown, G. Evaporation Suppression Research and Applications for Water Management. Identifying Technologies to Improve Regional Water Stewardship; North-Middle Rio Grande Corridor; Sandia National Laboratories: Albuquerque, NM, USA, 2004. [Google Scholar]
  52. Lehman, M.J. Study of Surface Tension, Natural Evaporation, and Subcooled Boiling Evaporation of Aqueous Surfactant Solutions. Ph.D. Thesis, Embry-Riddle Aeronautical University, Daytona Beach, FL, USA, 2016. [Google Scholar]
  53. Elghanam, R.I.; Fawal, M.E.; Abdel Aziz, R.; Skr, M.H.; Hamza Khalifa, A. Experimental study of nucleate boiling heat transfer enhancement by using surfactant. Ain Shams Eng. J. 2011, 2, 195–209. [Google Scholar] [CrossRef]
Figure 1. Evaporation in a porous media limited by an overlying water-free surface due to the heat addition from below at temperatures above the saturation.
Applsci 08 02607 g001
Figure 2. Scheme and photography of the boiling cell and radial position of the instrumentation.
Applsci 08 02607 g002
Figure 3. Scheme of the experimental set-up.
Applsci 08 02607 g003
Figure 4. Temperature distribution: (a) S+W, (b) S+DS, (c) B+W and (d) B+DS.
Applsci 08 02607 g004
Figure 5. Volume of liquid accumulated in the tray.
Applsci 08 02607 g005
Figure 6. T5/T6 and T4/T6 values vs. non-dimensional time t/240 (240 min heating interval): (a) S+DS; (b) B+DS.
Applsci 08 02607 g006
Figure 7. Time history of the power transfer.
Applsci 08 02607 g007
Figure 8. Volume of liquid evaporated from the tray.
Applsci 08 02607 g008
Figure 9. Total volume of liquid displaced from the porous media to the tray. Porous media based on sand (time up to 500 s after dryout). Porous media based on bronze (all experimental time).
Applsci 08 02607 g009
Figure 10. Power required for the evaporation of the total volume of liquid.
Applsci 08 02607 g010
Figure 11. Power required for the evaporation of the liquid in the tray.
Applsci 08 02607 g011
Figure 12. Heating power in the porous media.
Applsci 08 02607 g012
Figure 13. Thickness of the saturated layer.
Applsci 08 02607 g013
Figure 14. Hydrostatic pressure in the porous media.
Applsci 08 02607 g014
Figure 15. Comparison of vapor pressure corresponding to the surface temperature of the plate in contact with the porous medium, Pv(Tpl), with the pressure at temperature at the interface, (Psat), and the hydrostatic pressure, Phs, in the S+DS porous medium.
Applsci 08 02607 g015
Figure 16. Saturation of the porous media corresponding to the state of dryout prior to the replenishment.
Applsci 08 02607 g016
Figure 17. Interface displacement velocity between the two-phase and saturated zones.
Applsci 08 02607 g017
Figure 18. (a) Volume of liquid displaced to the tray (Vdt); (b) Effective vapor pressure at the plate-porous medium interface (Pvpl-mp); (c) Surface temperature of the plate (Tpl), temperature of the porous medium in contact with the plate (Tmp) and the temperature of liquid in the tray (Tcb) of the S+W porous medium in a time interval between the replenishment and the dryout.
Applsci 08 02607 g018
Figure 19. Plate temperature and pressure in the S+DS porous medium: z = 3.364 cm to the heating plate, piezometer 4.
Applsci 08 02607 g019
Figure 20. Volume of liquid accumulated in the tray and pressure in the S+DS porous medium: z = 3.364 cm to the heating plate, piezometer 4.
Applsci 08 02607 g020
Table 1. Physical properties of the solid phase.
Property/Material d ¯ p (m)ρ (kg·m−3)Se (m−1)cp (J·kg−1K−1) 20 °Cλ (W·m−1K−1) 20 °C
Bronze2.355 × 10−48614.0525,443.56376.0071.00
Sand2.960 × 10−32613.952027.03527.9031.39 × 10−2
Table 2. Physical properties of the liquid phase.
Property/Liquidρ (kg·m−3) 20 °Cν (m2s−1) 40 °Ccp (J·kg−1K−1) 20 °Cλ (W·m−1K−1) 20 °Cσ (mN·m−1)
Distilled water998.20.661 × 1064182.80.59875.83 − 0.1477 × T(°C)
Nonilfenol solution998.20.751 × 1064182.80.59846.41 − 0.13124 × T(°C)
Table 3. Saturated porous media characteristics.
Porous Mediumεk’ (m2)λef (W·m−1K−1)
B+W0.360 3.92 × 10117.44
B+DS0.360 3.92 × 10116.95
S+W0.380 4.41 × 10100.357
S+DS0.380 8.41 × 10100.330
Table 4. Rayleigh and Bond number of each porous medium.
Porous MediumΔT (°C)RaBo
B+W70 ± 30.60 ± 0.031.67 × 10−5 ± 3 × 10⁻⁷
B+DS70 ± 31.9 ± 0.13.06 × 10−5 ± 6 × 10⁻⁷
S+W35 ± 2115 ± 61.78 × 10⁻⁴ ± 3 × 10⁻⁶
S+DS35 ± 2826 ± 466.25 × 10⁻⁴ ± 1 × 10⁻⁵
Table 5. Magnitude values.
Porous Mediumε d ¯ p × 106 (m)vpo (m·s−1)ν × 106 (m2s−1)αf × 106 (m2s−1)λf × 103 (W·m−1K−1)
B+W0.36235.540.0390.3090.167677.3
B+DS0.36235.540.0350.3090.167677.3
S+W0.3829600.0330.3090.167677.3
S+DS0.3829600.0590.3090.167677.3
Table 6. Results obtained on the condition of maximum velocity of the liquid in the tray.
Porous MediumRePrhsf (W·m−2K−1)tc (s)Bitr (s)
B+W10.8 ± 0.21.85 ± 0.0321,937 ± 3730.083 ± 0.0023.81 ± 0.080.006 ± 0.001
B+DS9.6 ± 0.11.85 ± 0.0320,833 ± 3540.083 ± 0.0023.62 ± 0.080.007 ± 0.001
S+W119 ± 21.85 ± 0.035884 ± 10013.12 ± 0.2912.86 ± 0.280.090 ± 0.001
S+DS215 ± 31.85 ± 0.038204 ± 13913.12 ± 0.2917.93 ± 0.390.050 ± 0.001
Table 7. Total dryout magnitudes.
Porous Mediumtdr (s)Tpl (°C)Vdt (cm3)S (%)Pvdf (Pa)
B+W6960242 ± 1635 ± 833 ± 1 101,901 ± 2
B+DS7800256 ± 1619 ± 835 ± 1101,901 ± 2
S+W9300115 ± 11007 ± 13» 097,766 ± 2
S+DS5580114 ± 1896 ± 1211 ± 197,765 ± 2
Table 8. Thermal power values corresponding to the beginning of the dryout (i) and the total dryout state (f).
Porous Mediumtdr (s) W ˙ d r   ( W )
B+W2280 (i)290 ± 9
6960 (f)307 ± 13
B+DS2400 (i)288 ± 9
7800 (f)314 ± 14
S+W9000 (i)320 ± 10
9300 (f)212 ± 9
S+DS5460 (i)362 ± 11
5580 (f)328 ± 14

