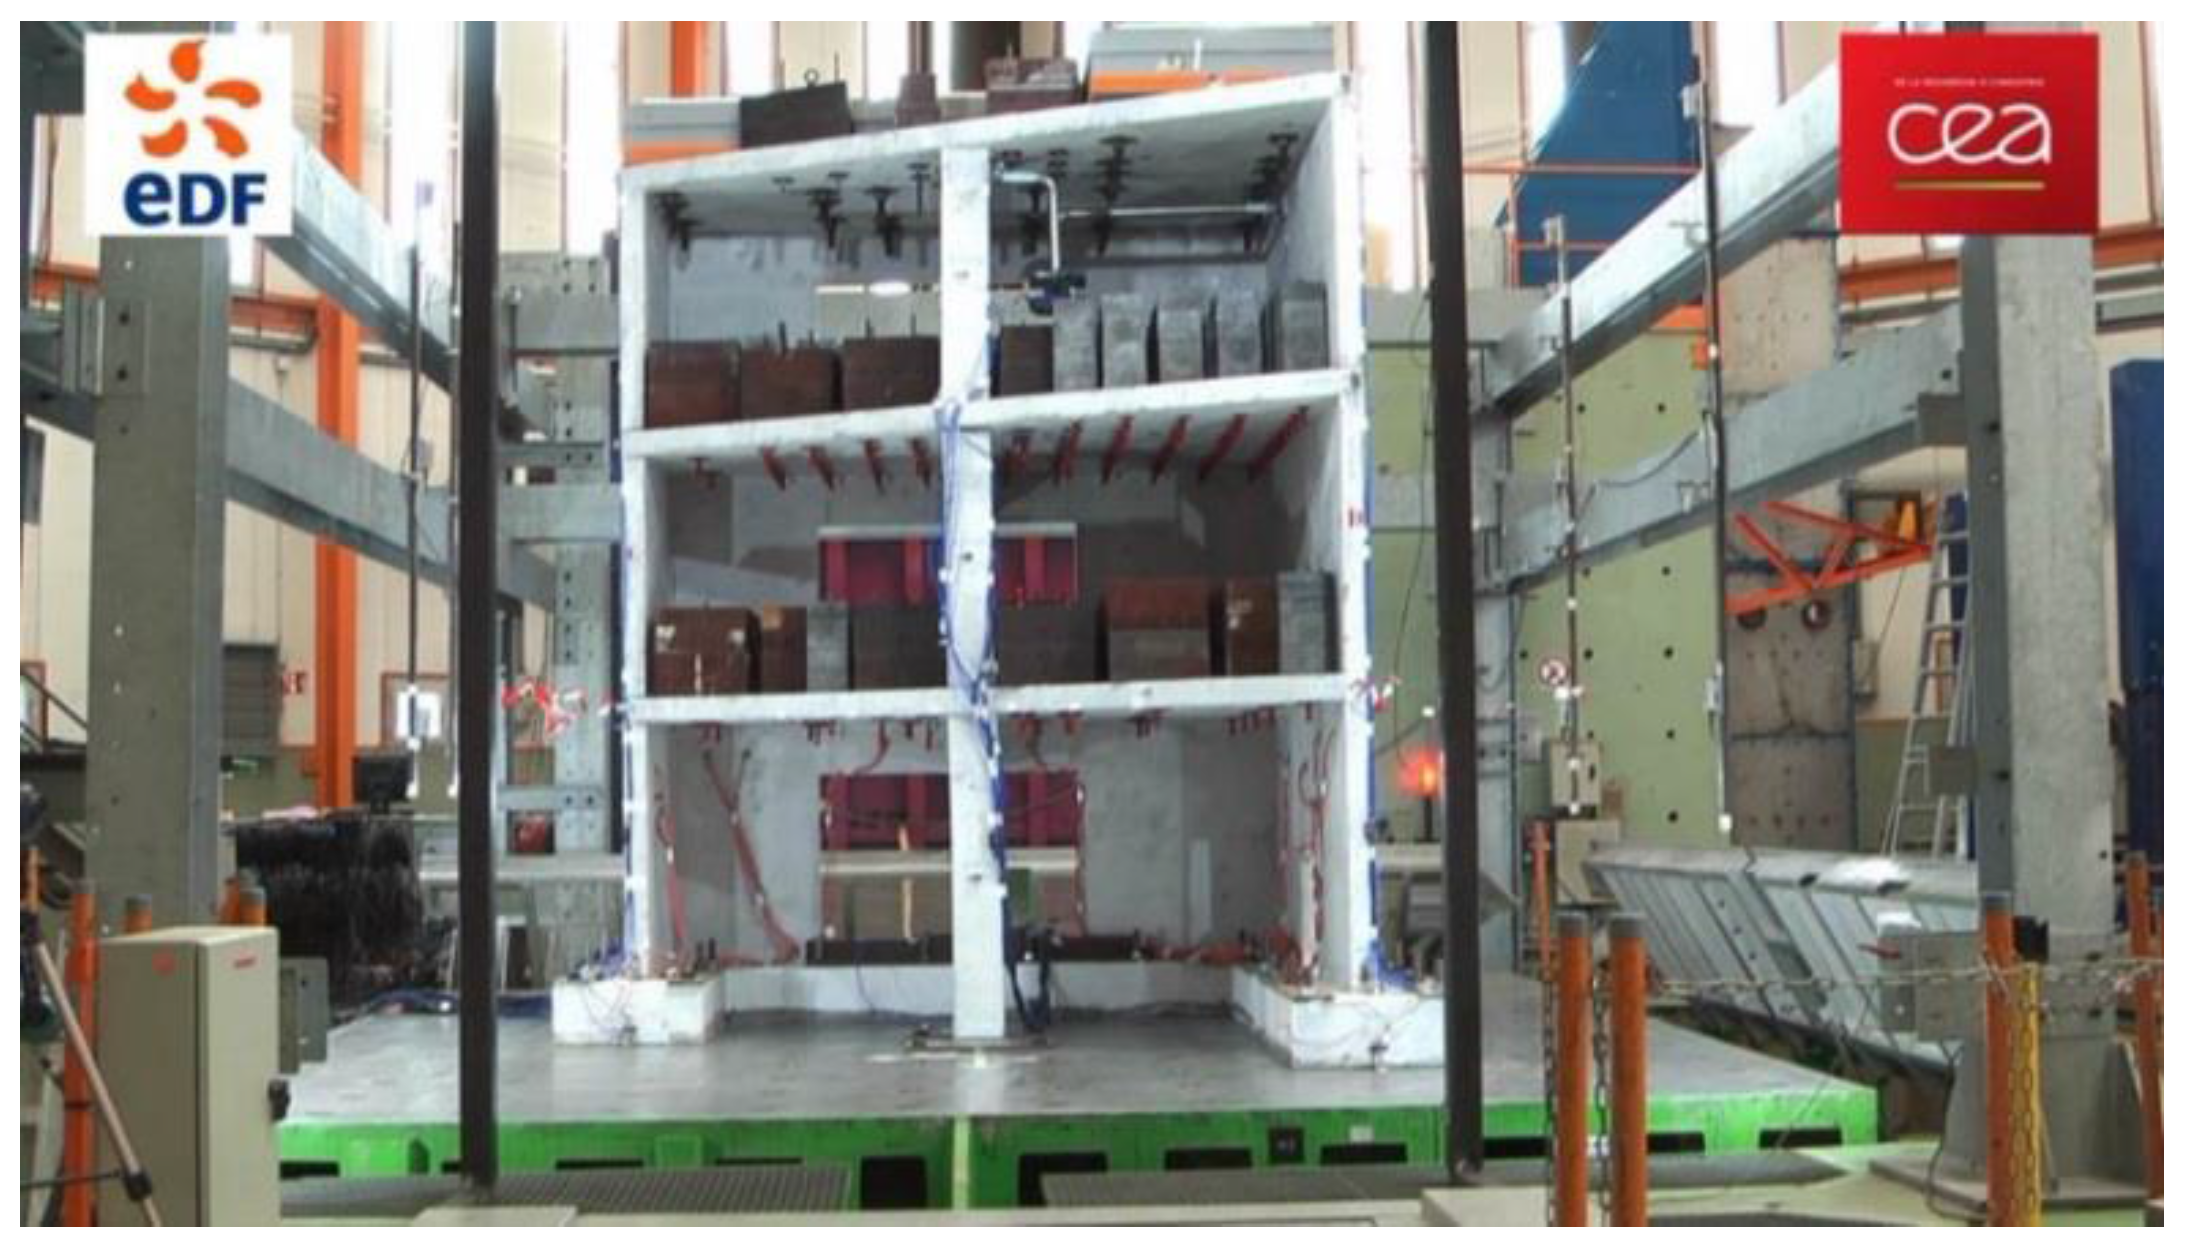
Figure 1.
The asymmetric three-storey reinforced concrete building used for the SMART (Seismic design and best-estimate Methods Assessment for Reinforced concrete buildings subjected to Torsion and nonlinear effects) 2013 international benchmark campaign.
Figure 1.
The asymmetric three-storey reinforced concrete building used for the SMART (Seismic design and best-estimate Methods Assessment for Reinforced concrete buildings subjected to Torsion and nonlinear effects) 2013 international benchmark campaign.
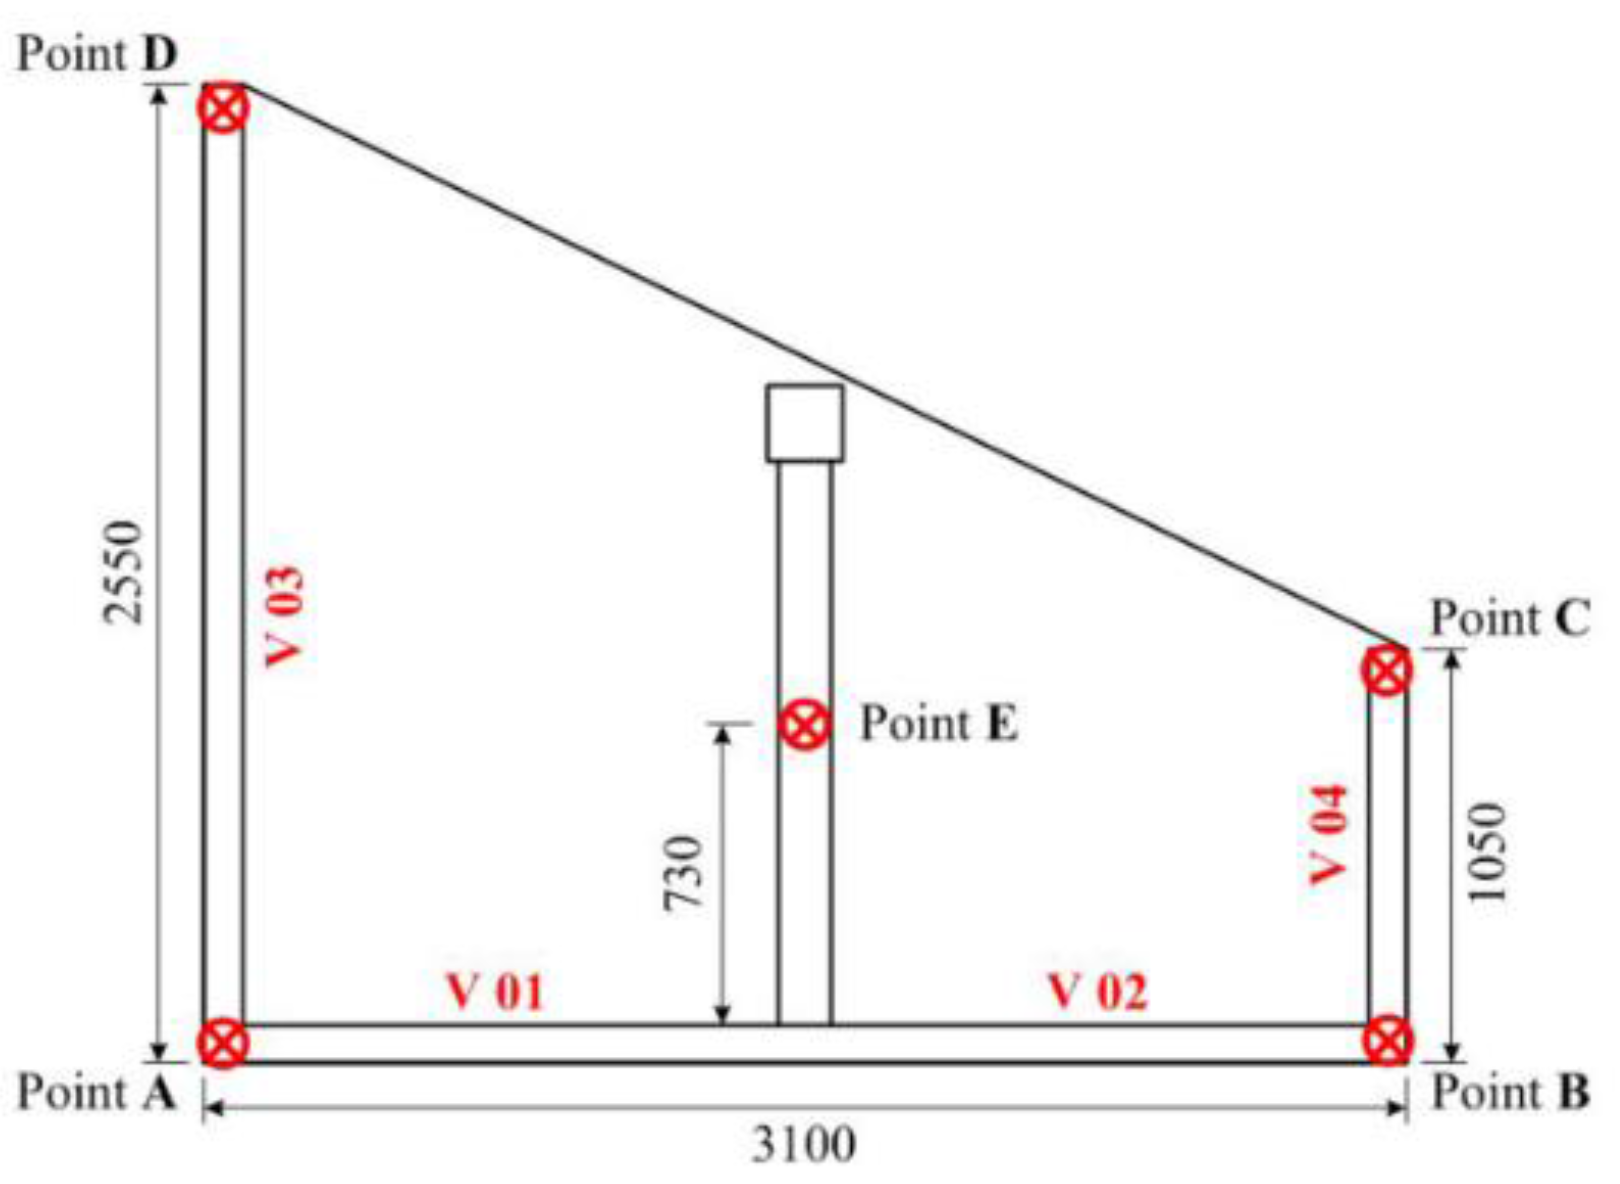
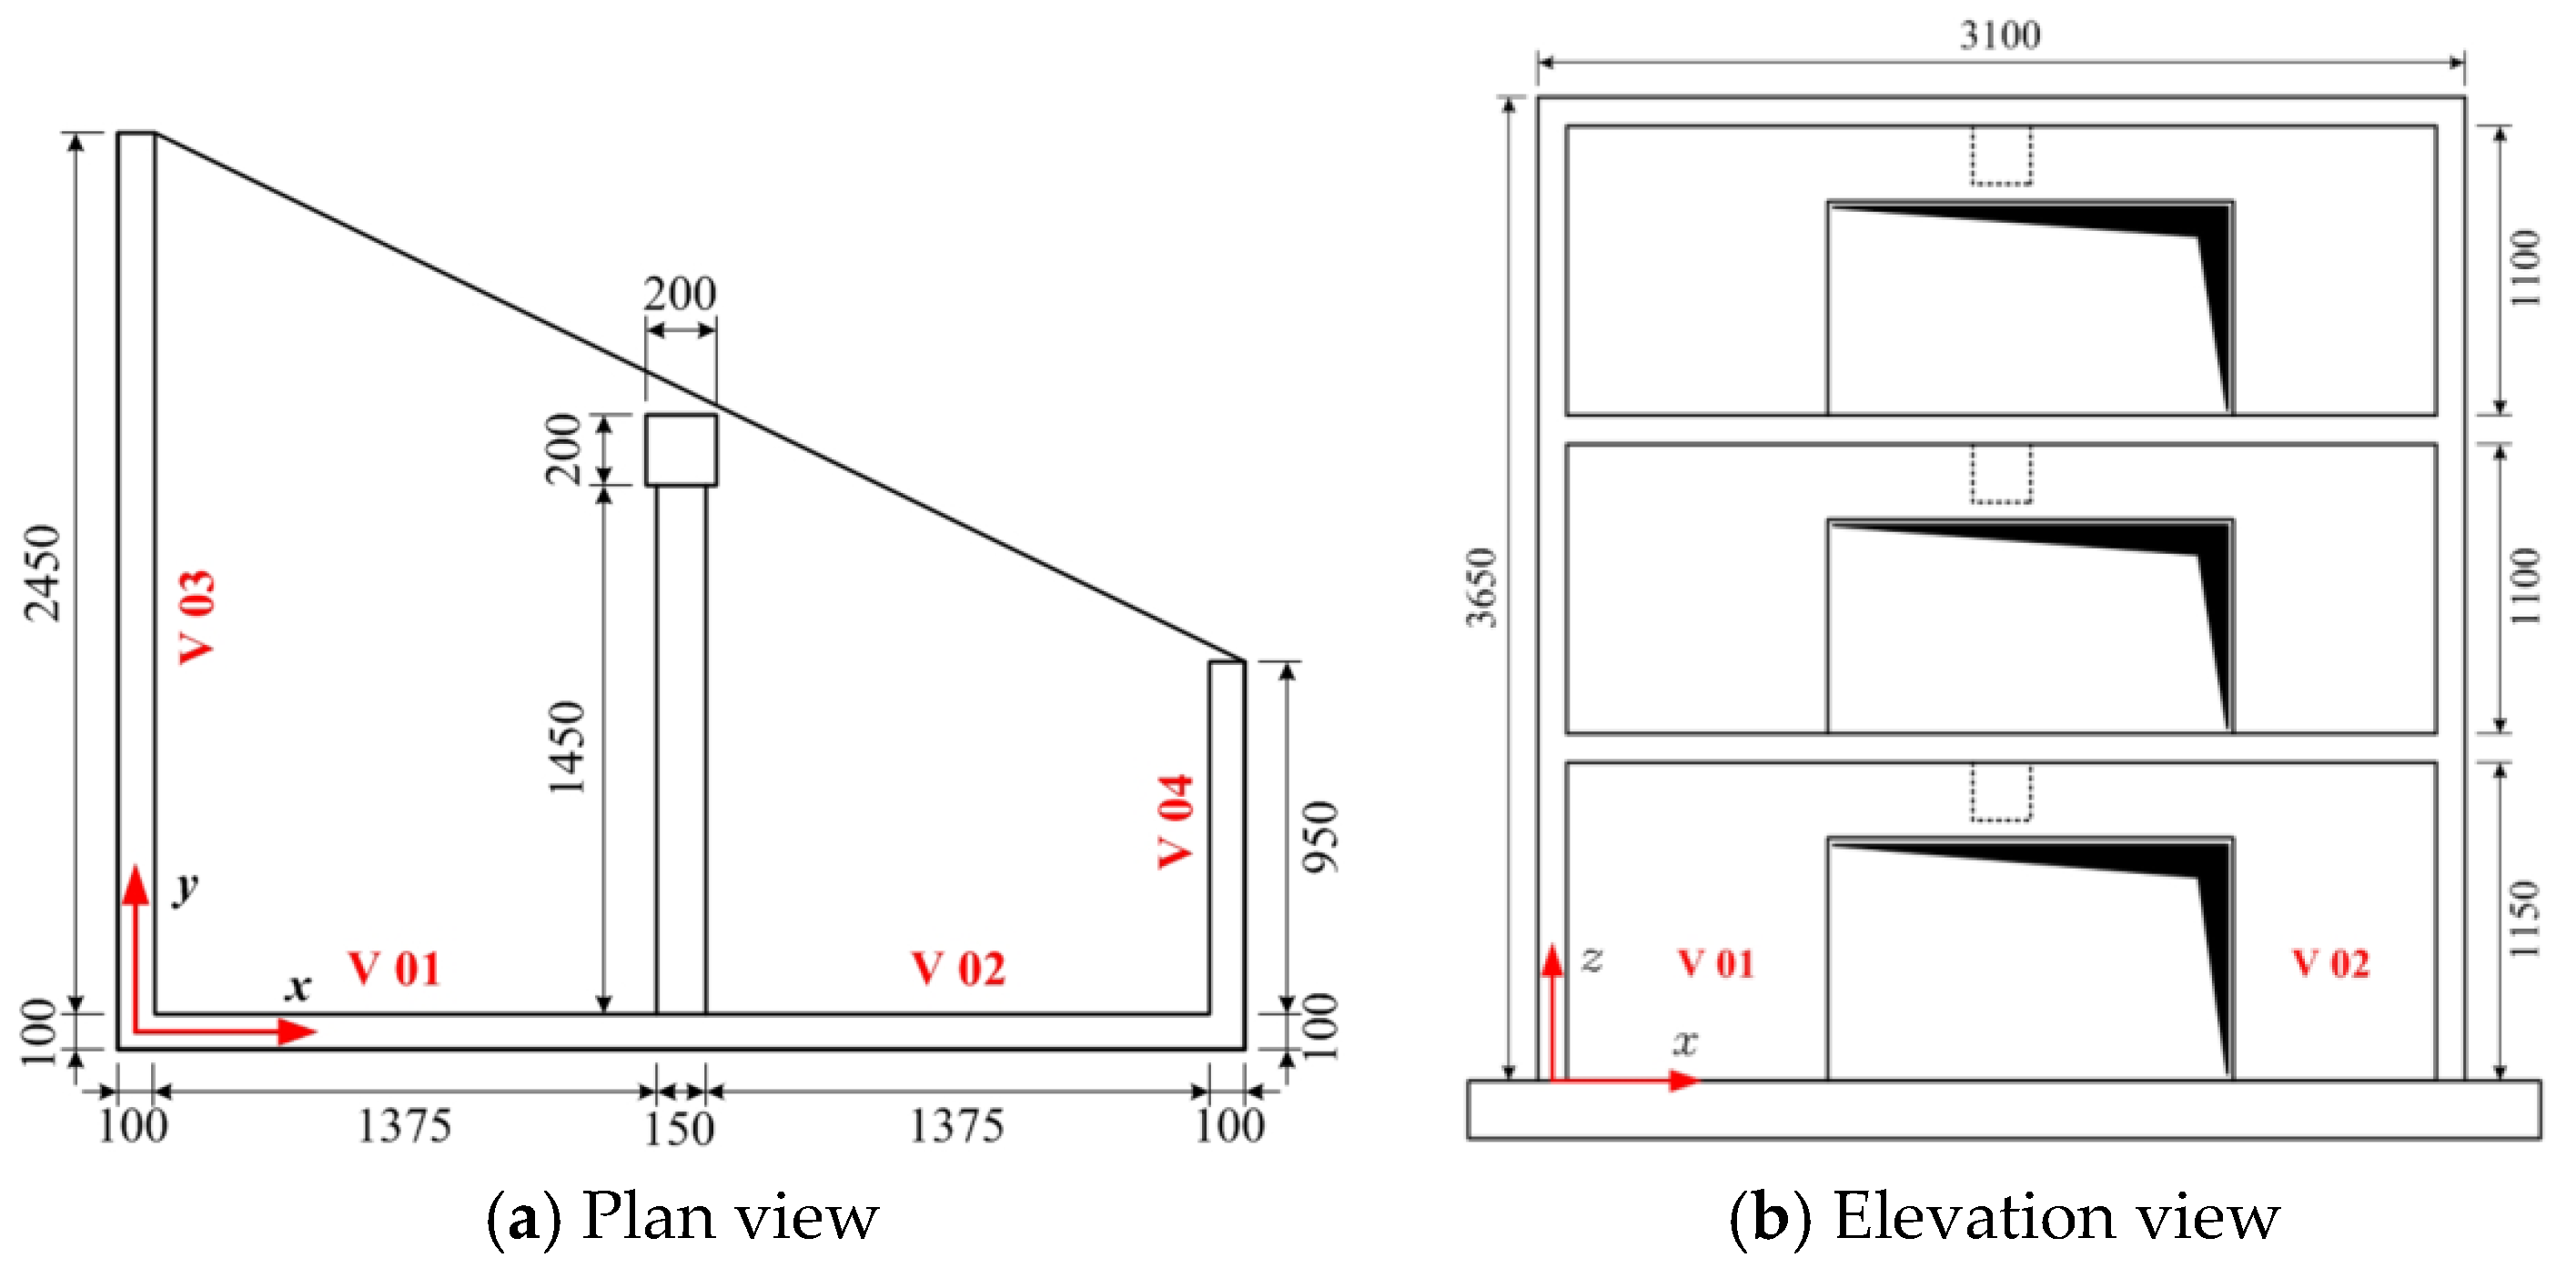
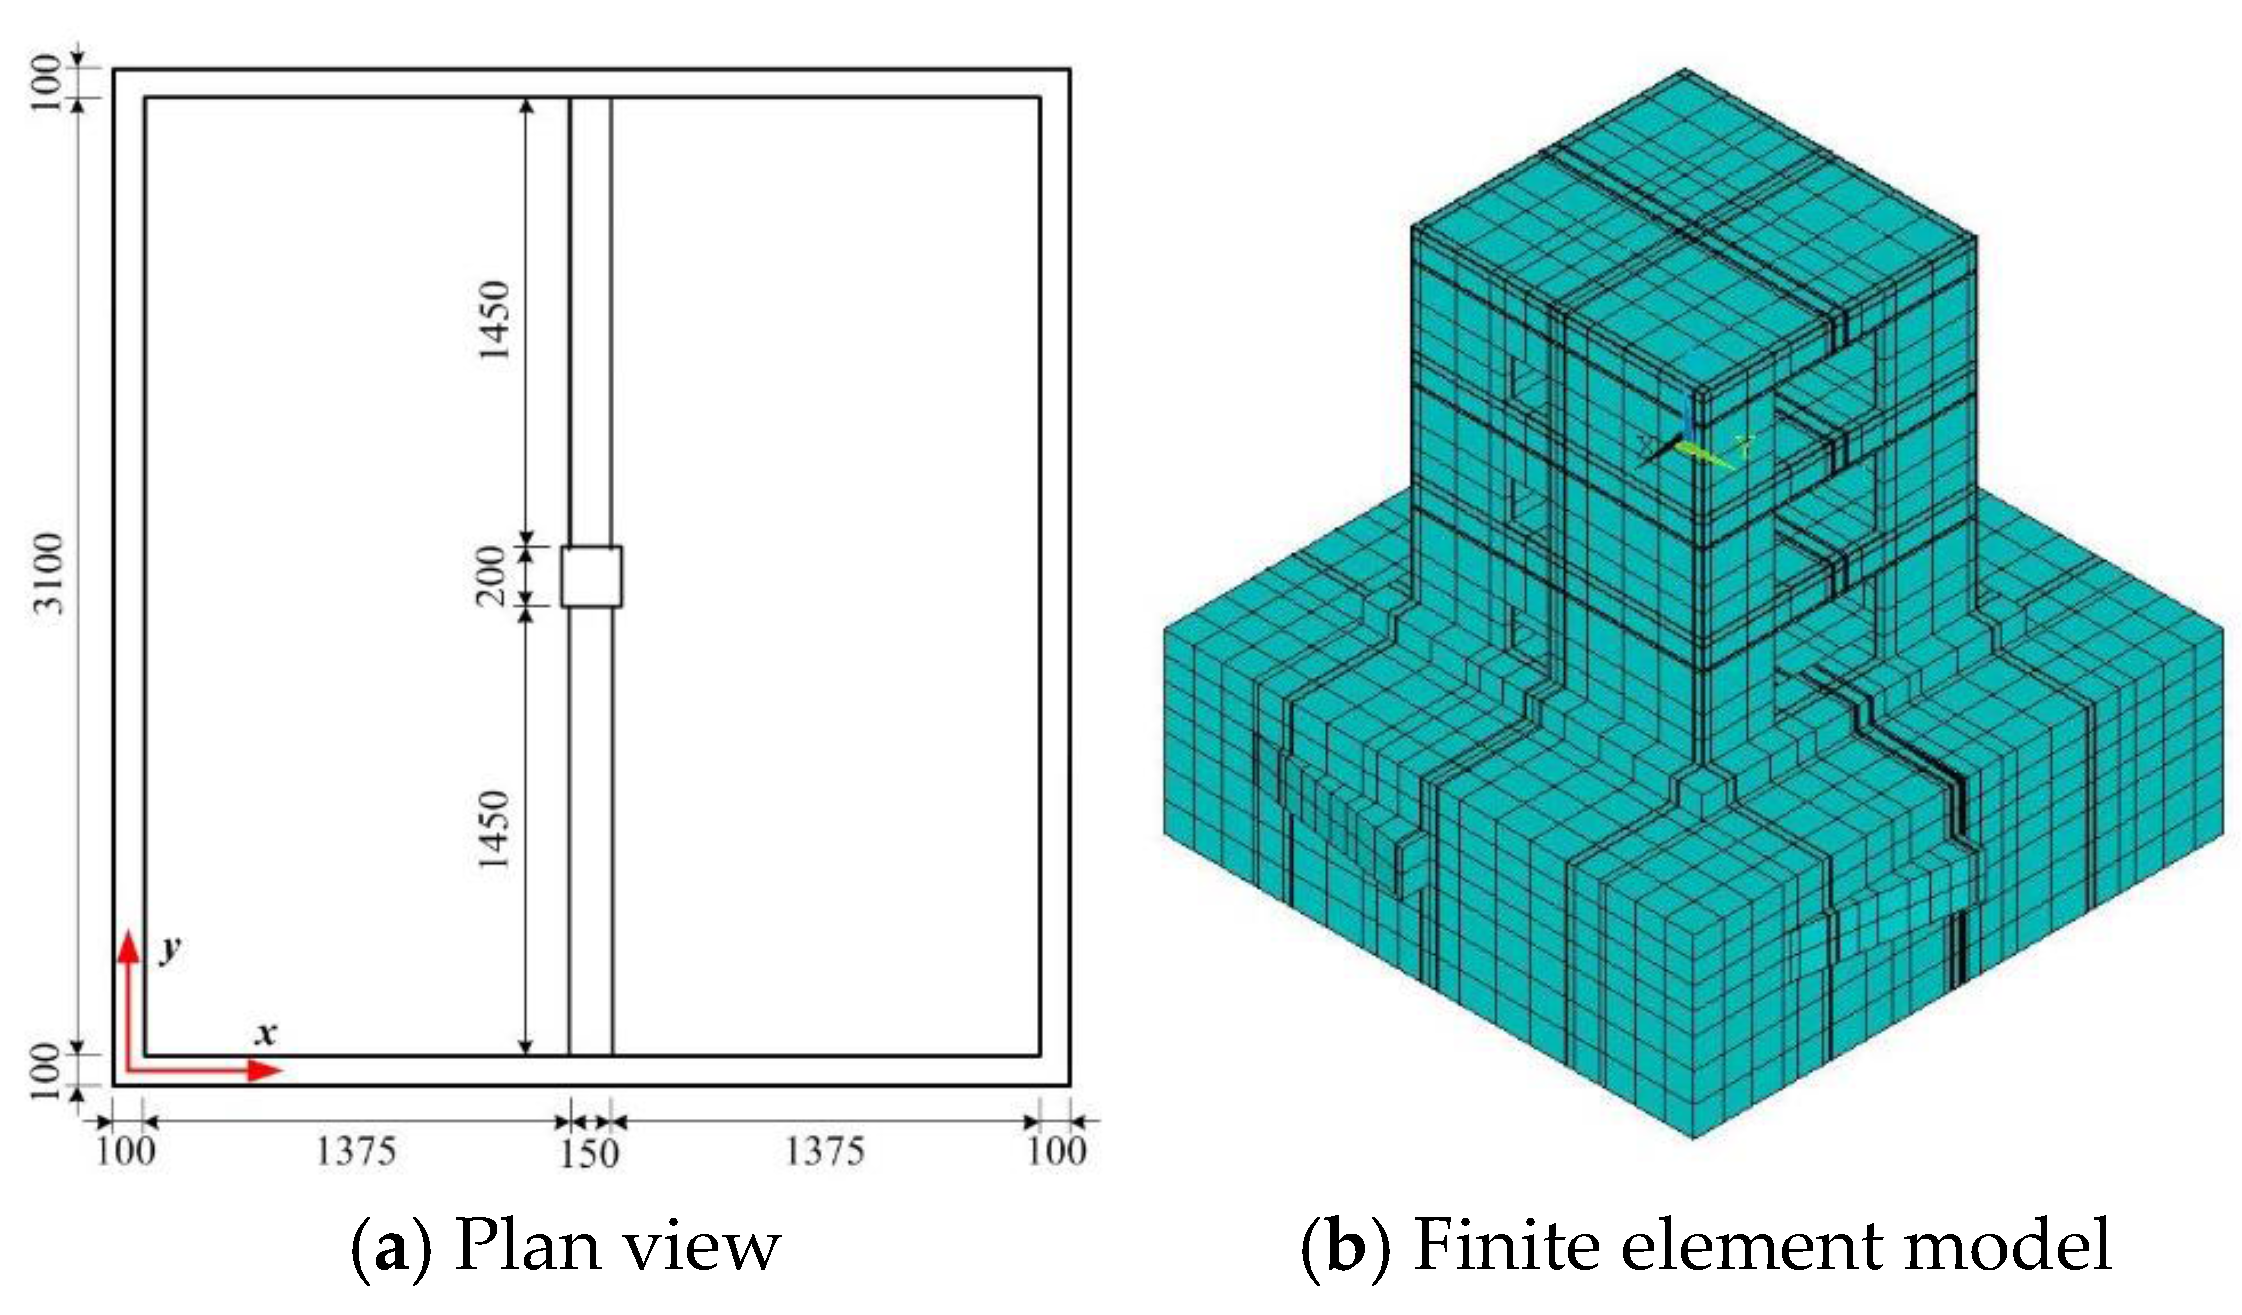
Figure 2.
Plan and elevation views of the SMART 2013 reinforced concrete (RC) structure (unit: mm).
Figure 2.
Plan and elevation views of the SMART 2013 reinforced concrete (RC) structure (unit: mm).
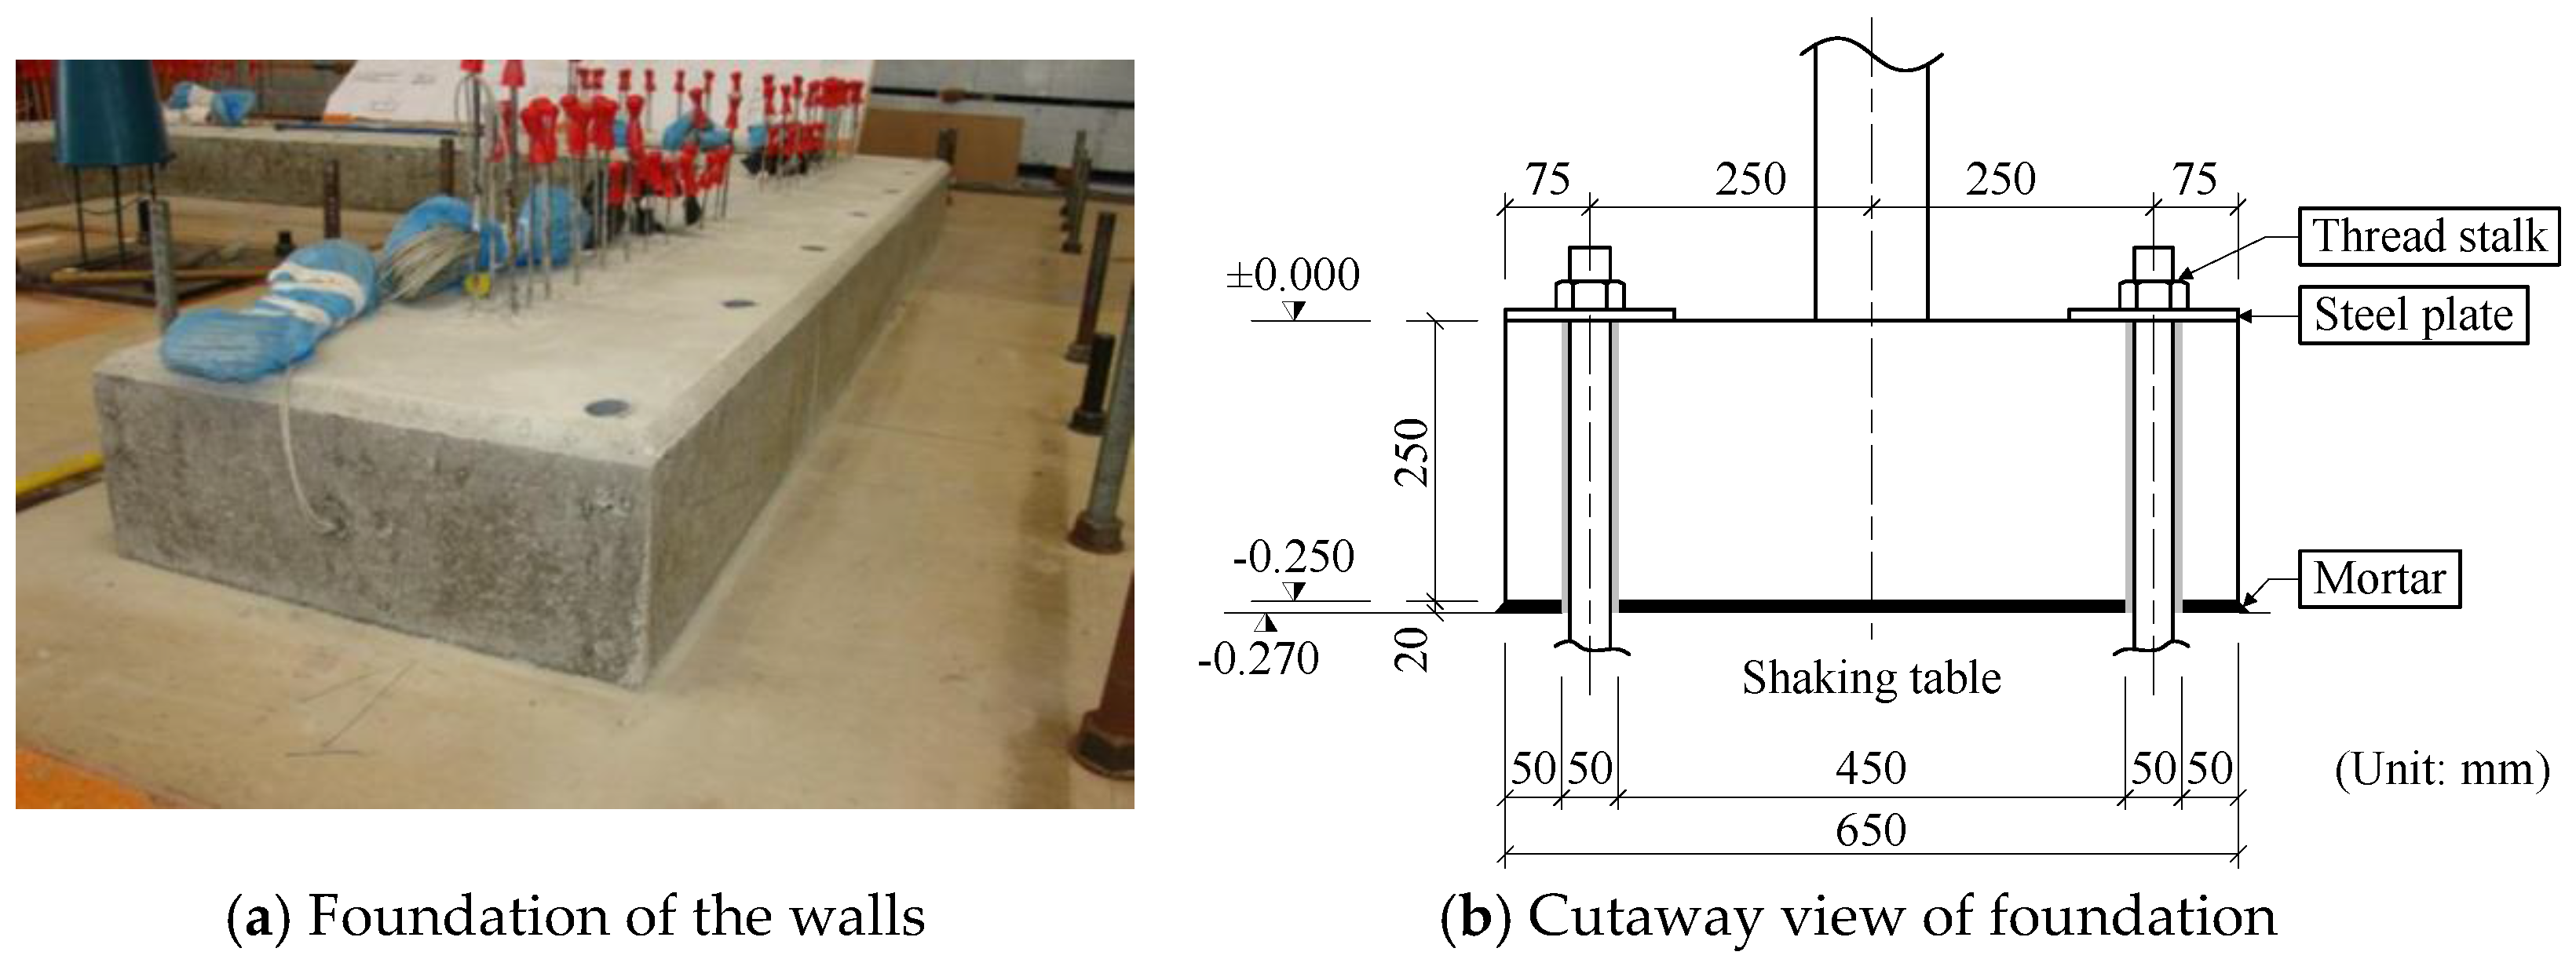
Figure 3.
Wall foundation of the SMART 2013 RC structure [
23]; (
a) RC footing; (
b) cutaway view.
Figure 3.
Wall foundation of the SMART 2013 RC structure [
23]; (
a) RC footing; (
b) cutaway view.
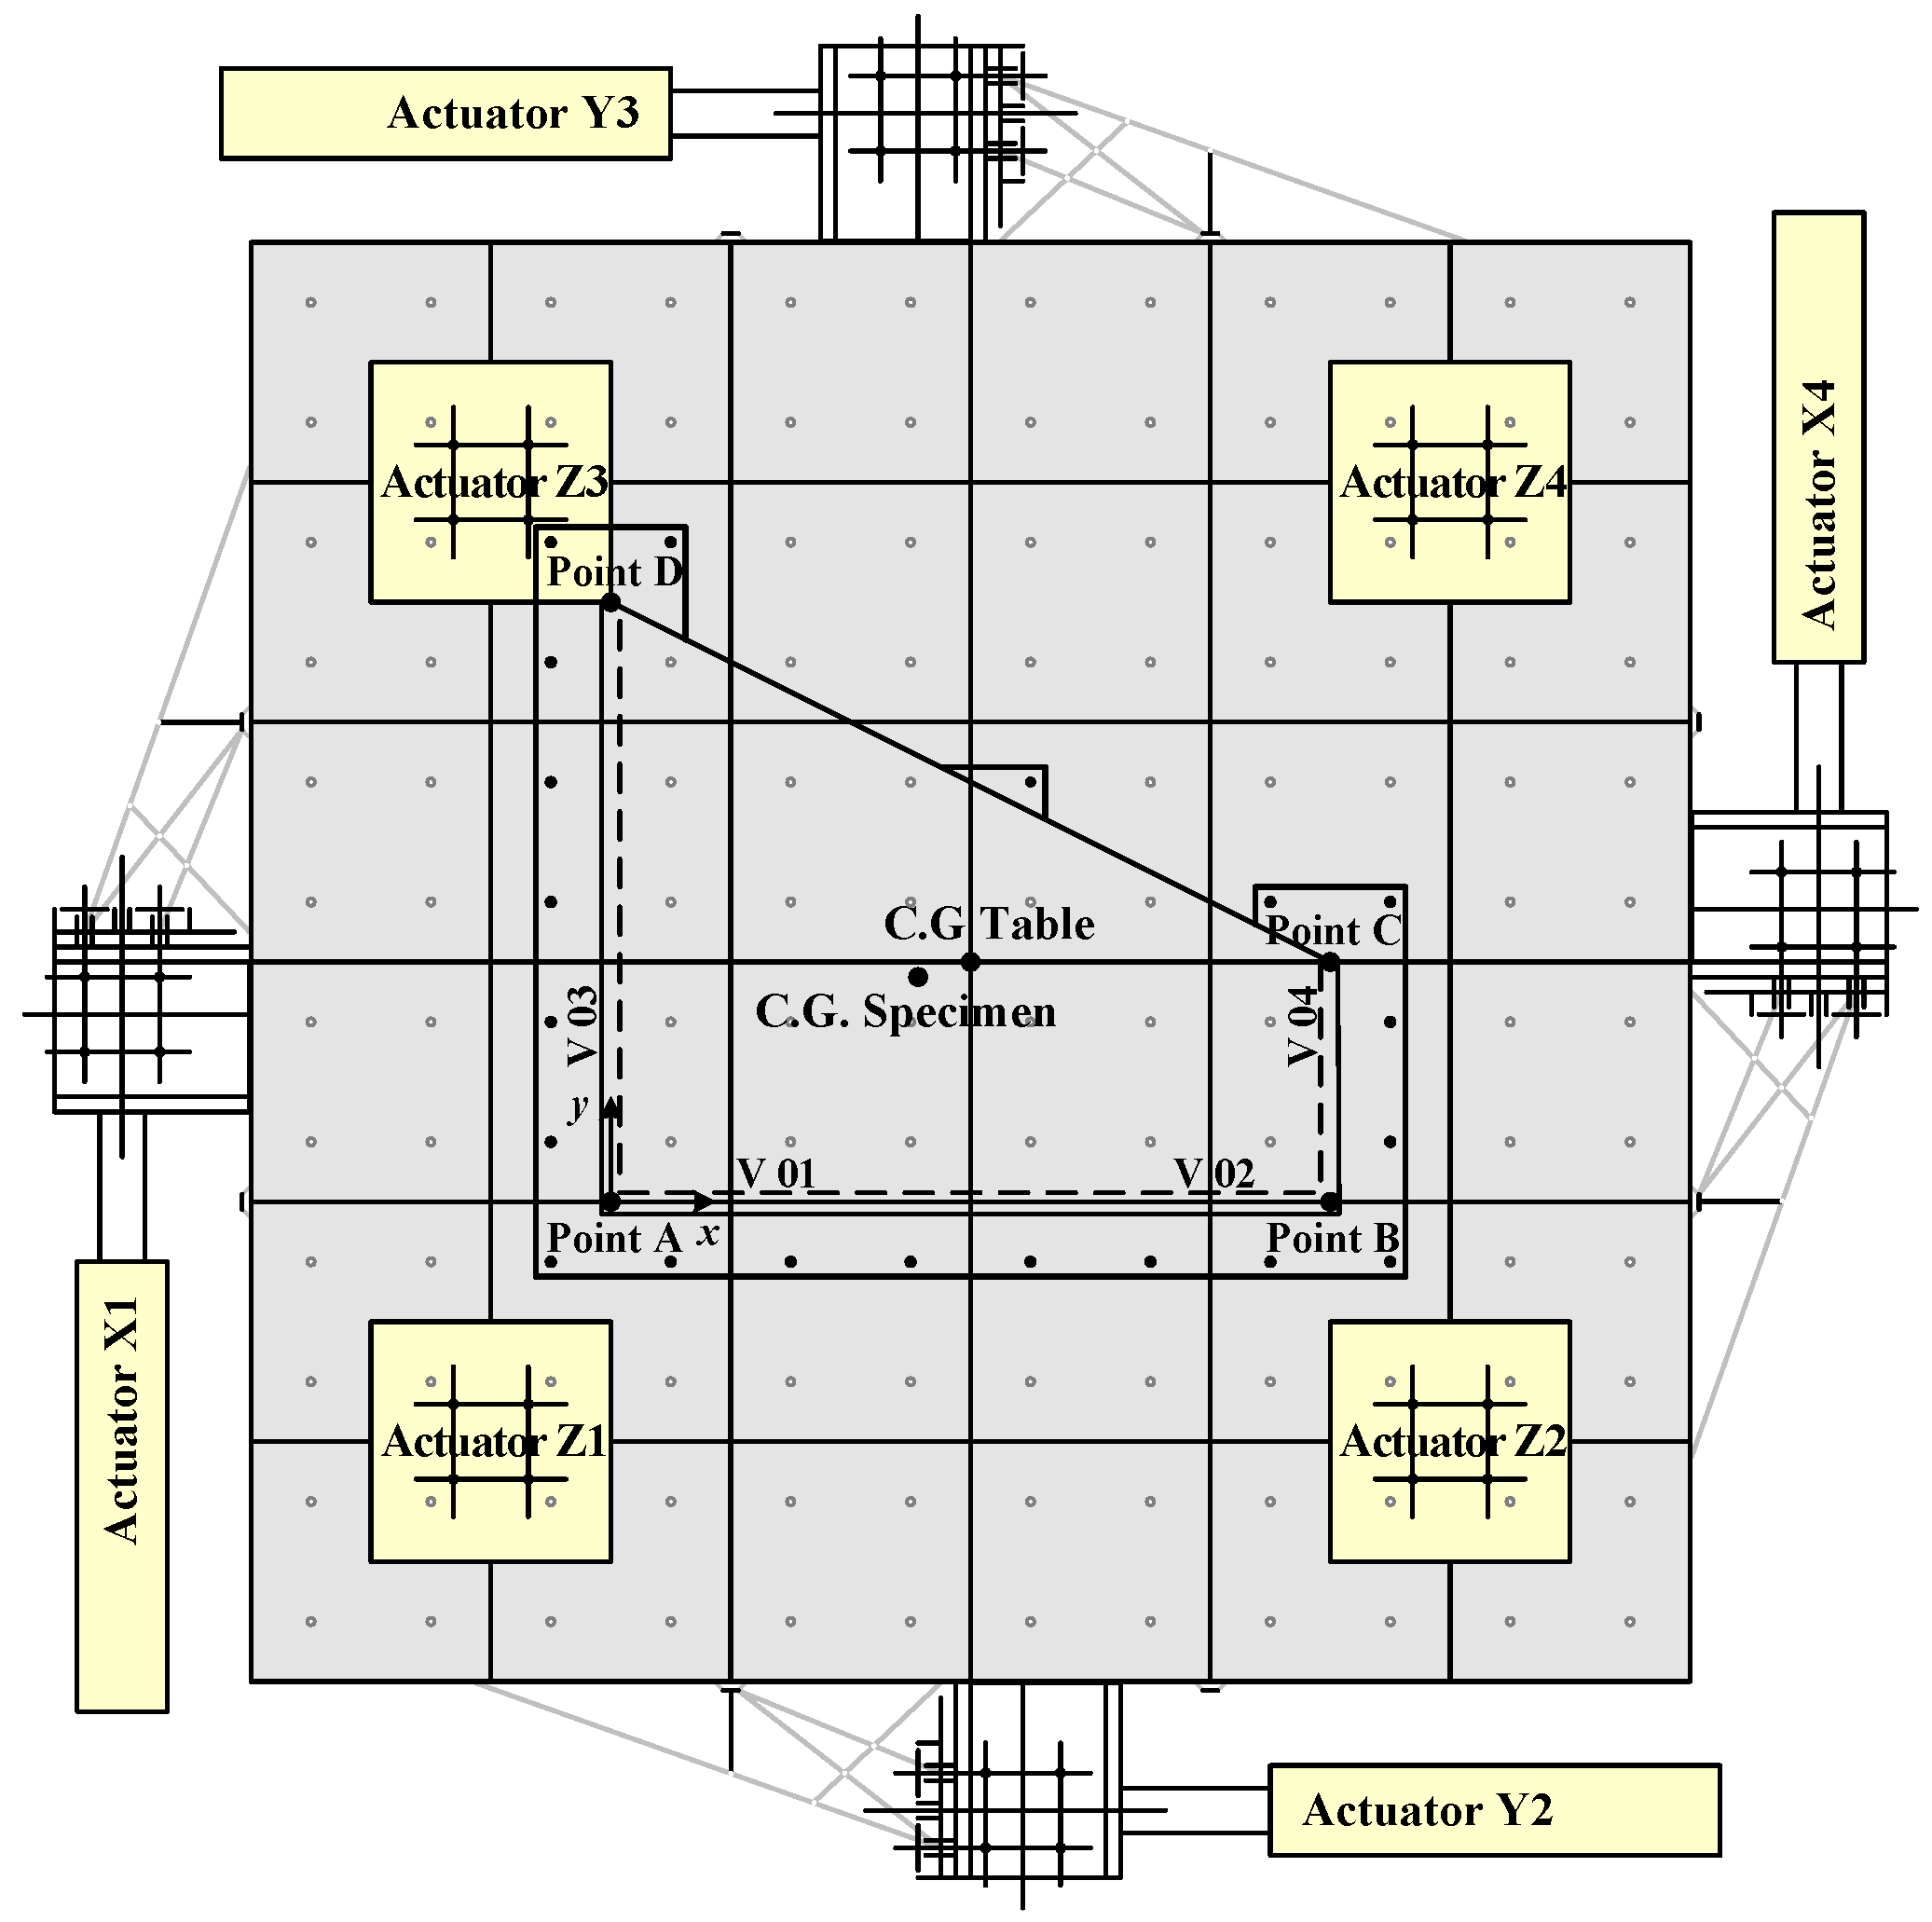
Figure 4.
Plan view of the SMART 2013 structure positioned on the shaking table [
23]; four hydraulic actuators (X1, X4, Y2, Y3) are placed in a horizontal direction, and the other four (Z1, Z2, Z3, Z4) are laid in a vertical direction.
Figure 4.
Plan view of the SMART 2013 structure positioned on the shaking table [
23]; four hydraulic actuators (X1, X4, Y2, Y3) are placed in a horizontal direction, and the other four (Z1, Z2, Z3, Z4) are laid in a vertical direction.
Figure 5.
Response sampling points on each floor (unit: mm).
Figure 5.
Response sampling points on each floor (unit: mm).
Figure 6.
Strain–stress curves for concrete and steel reinforcement.
Figure 6.
Strain–stress curves for concrete and steel reinforcement.
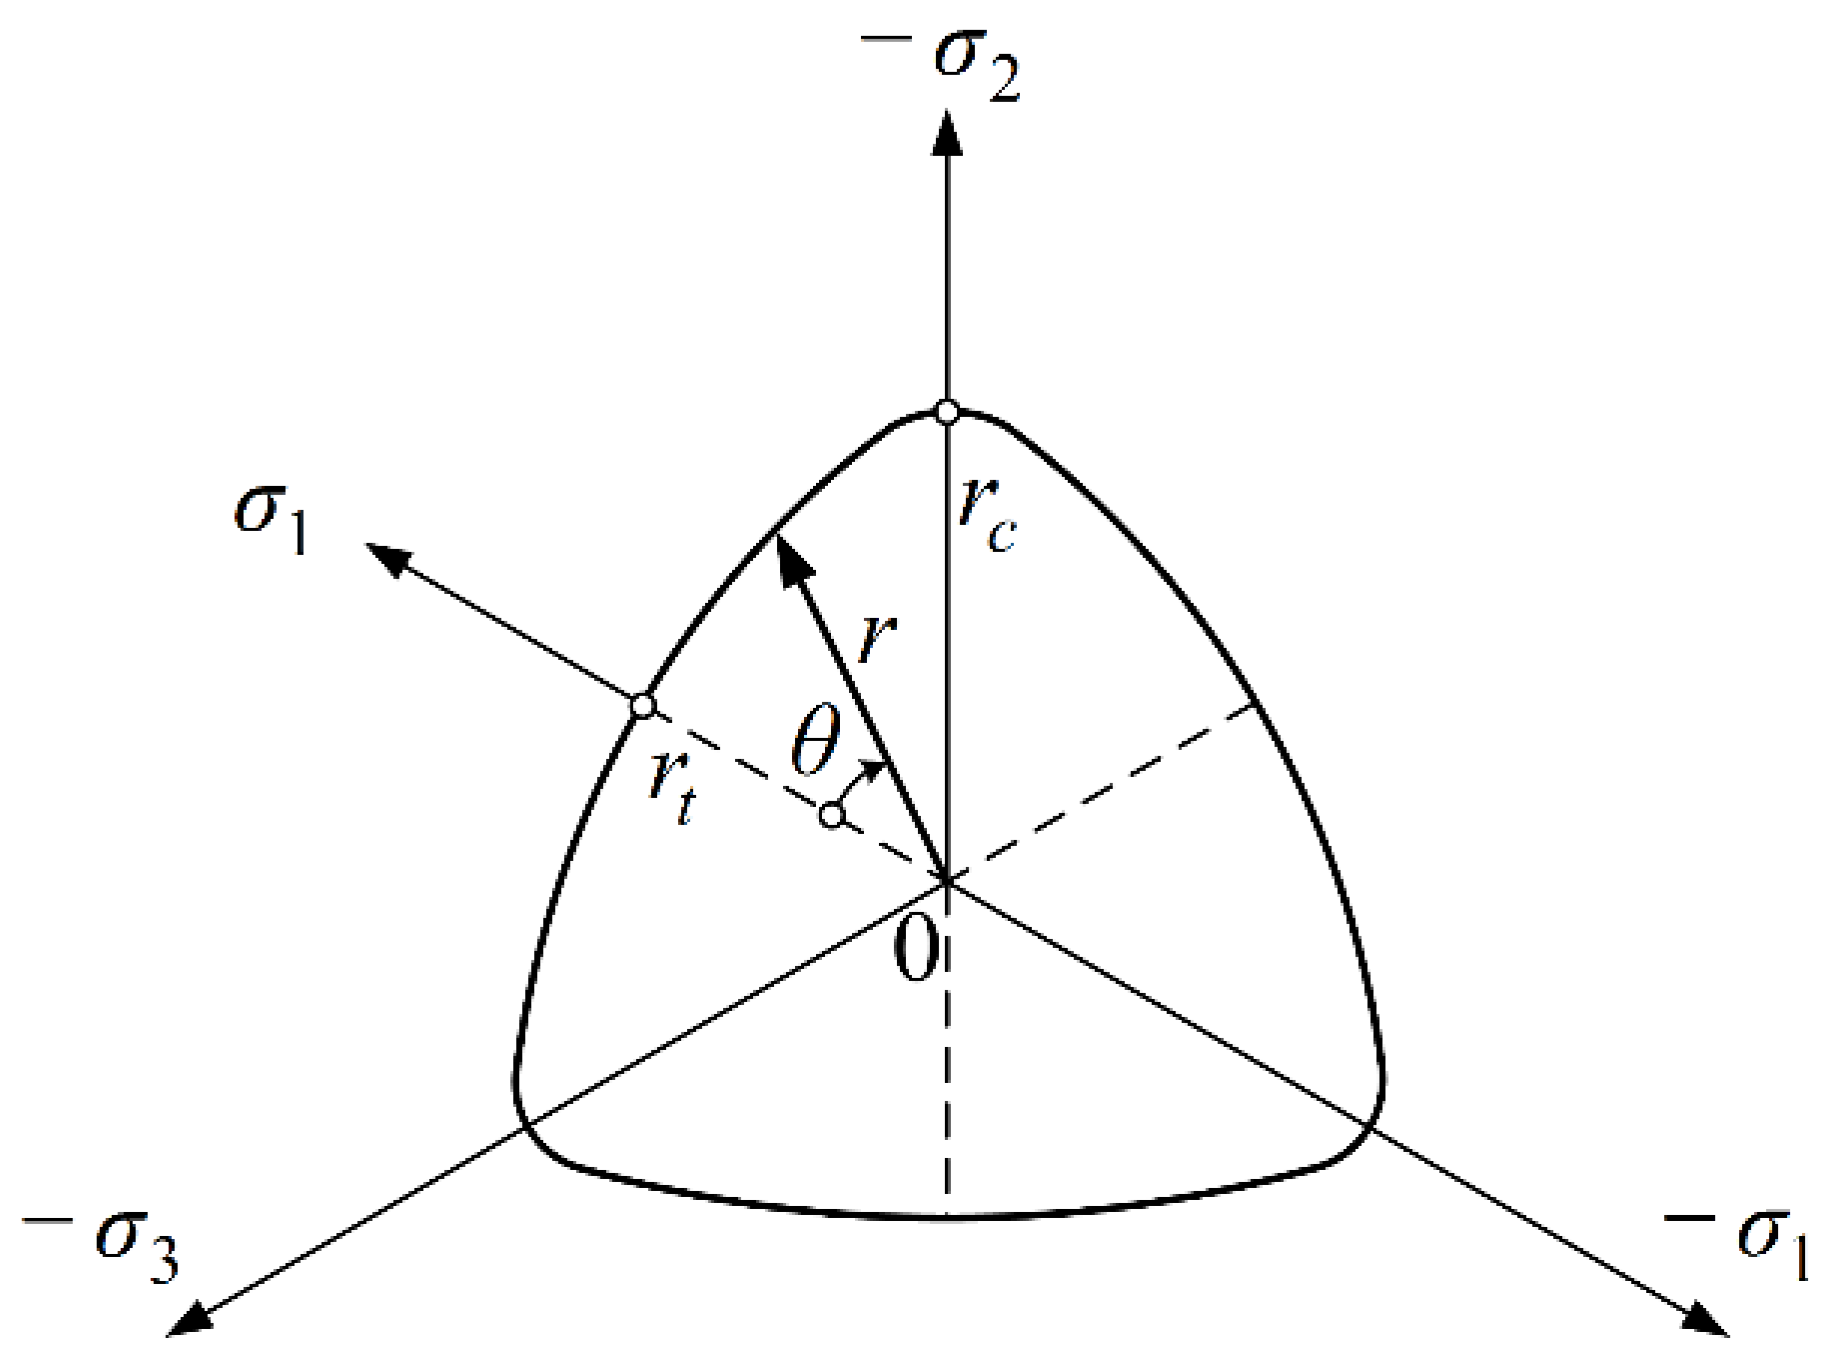
Figure 7.
Deviatoric section of the Willam–Warnke failure surface.
Figure 7.
Deviatoric section of the Willam–Warnke failure surface.
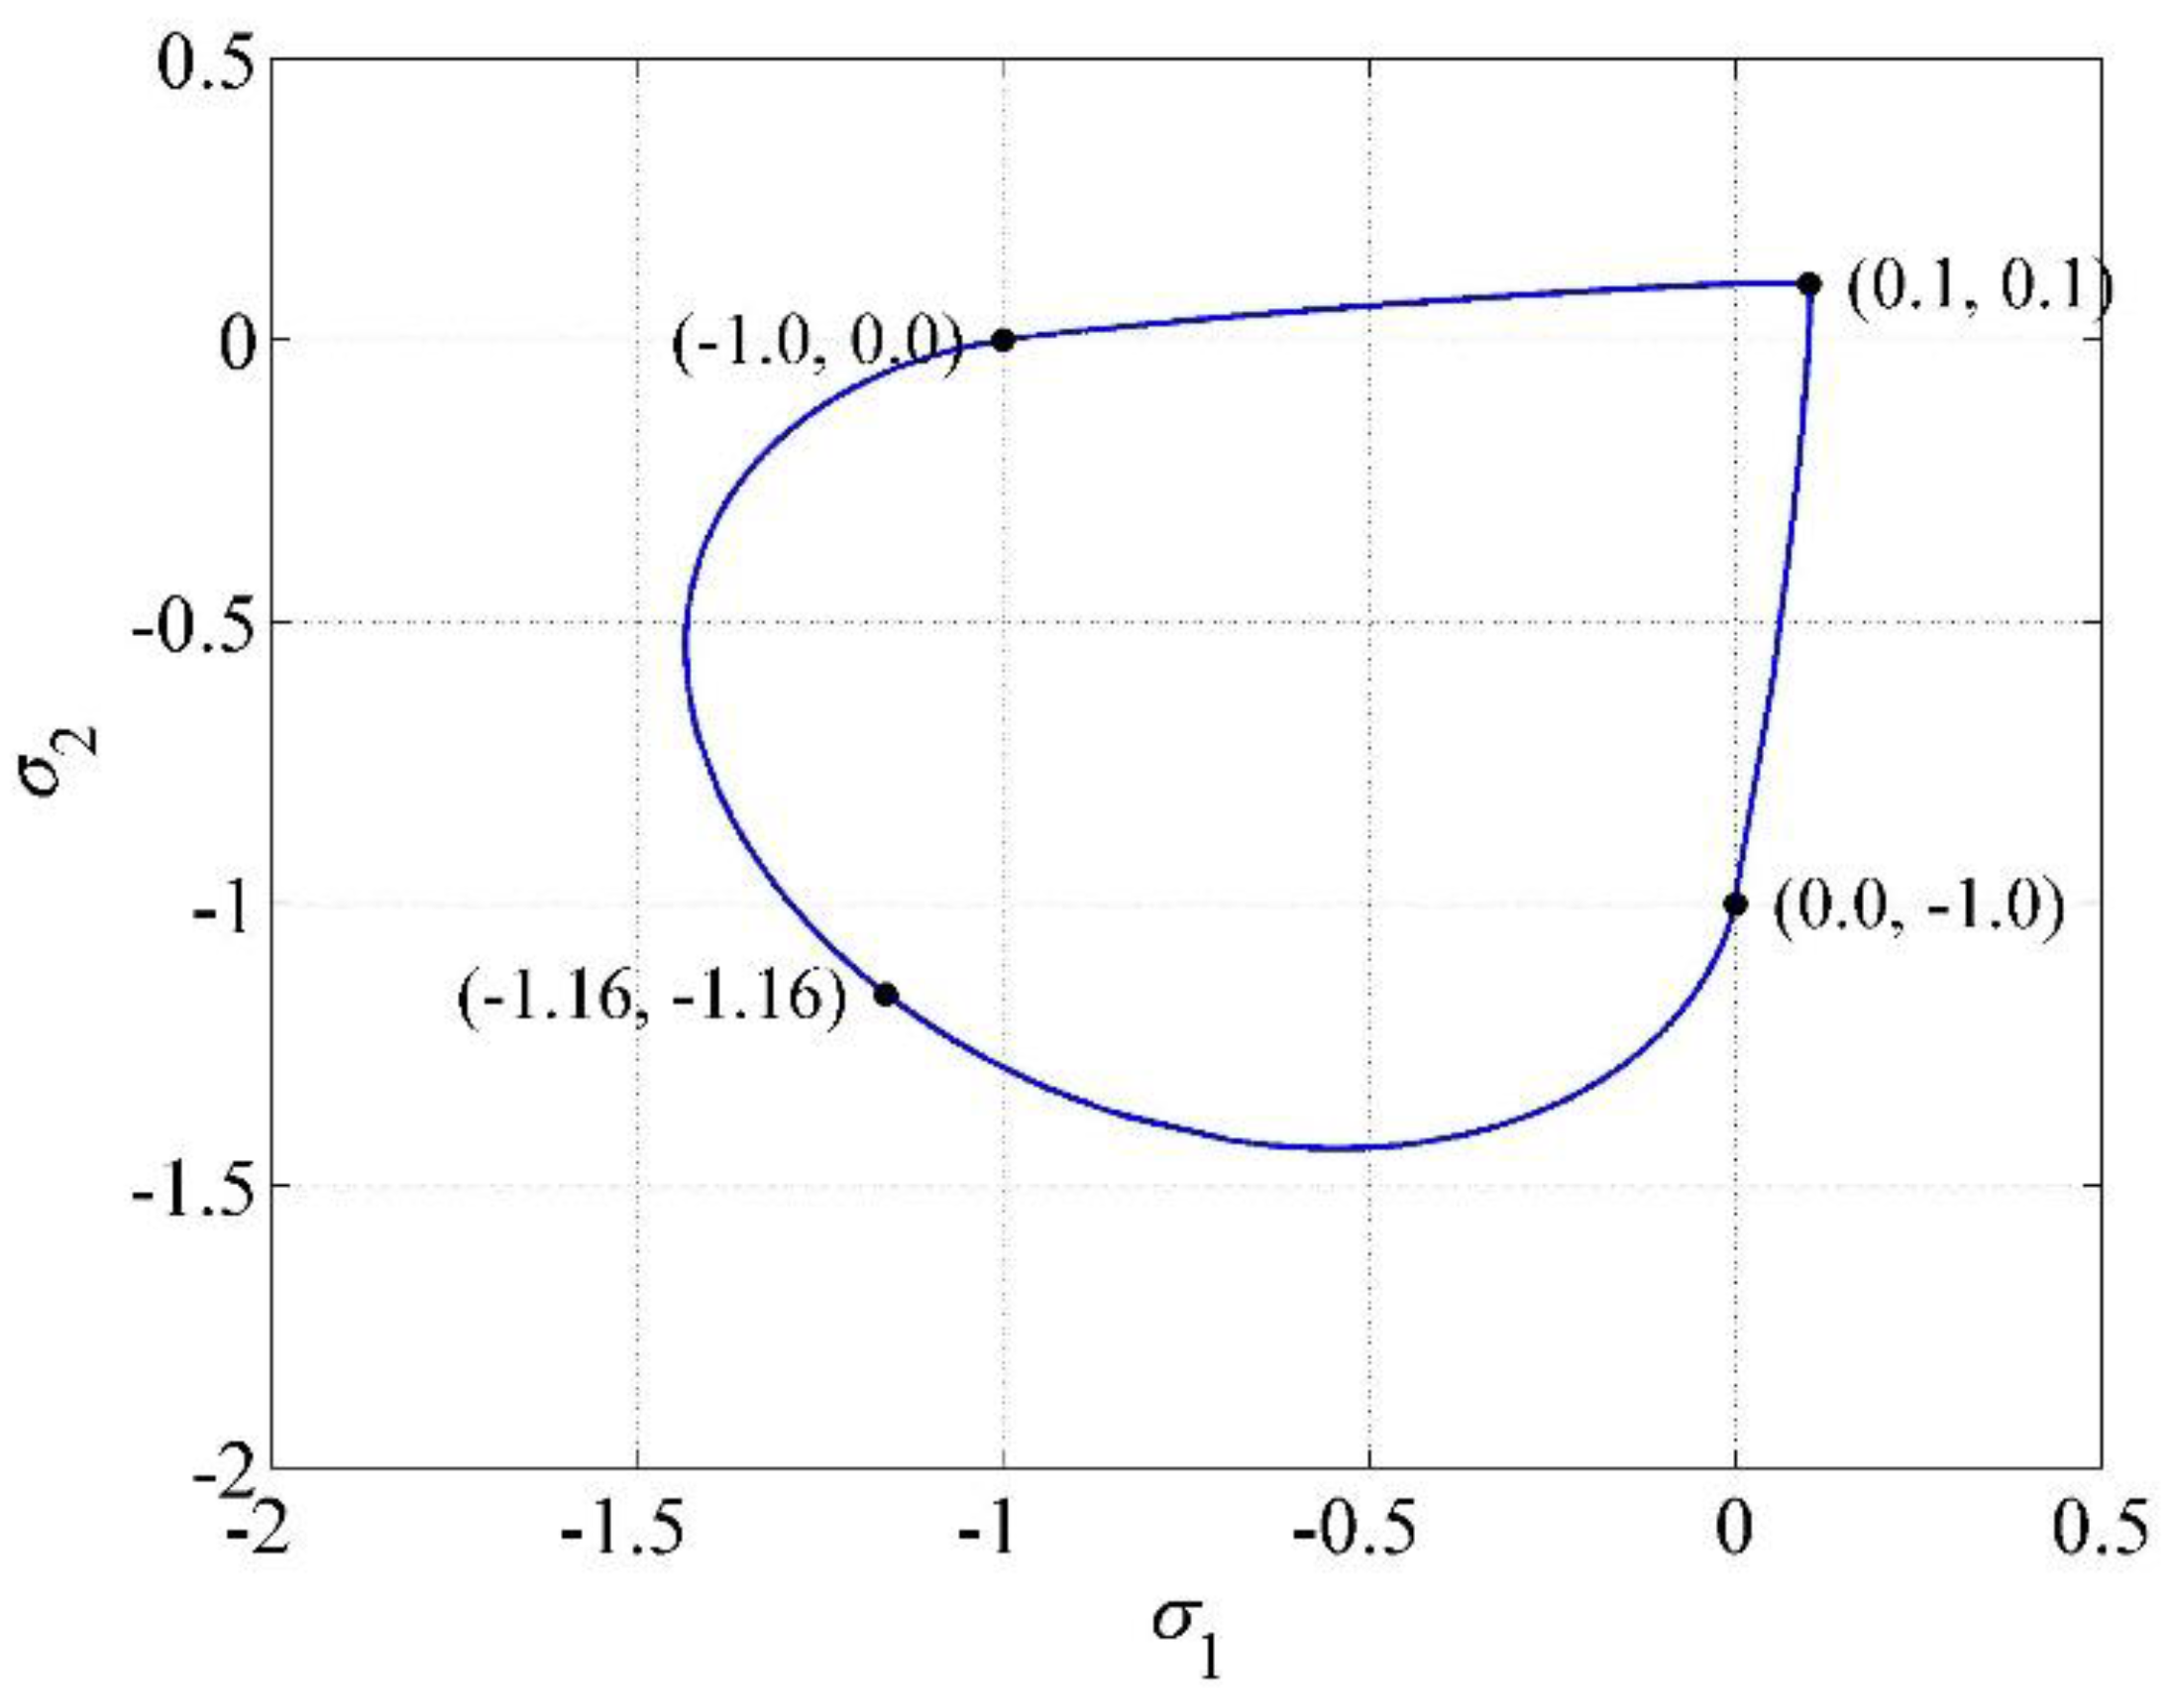
Figure 8.
Trace of the three-parameter Willam–Warnke yield surface in the - plane for and .
Figure 8.
Trace of the three-parameter Willam–Warnke yield surface in the - plane for and .
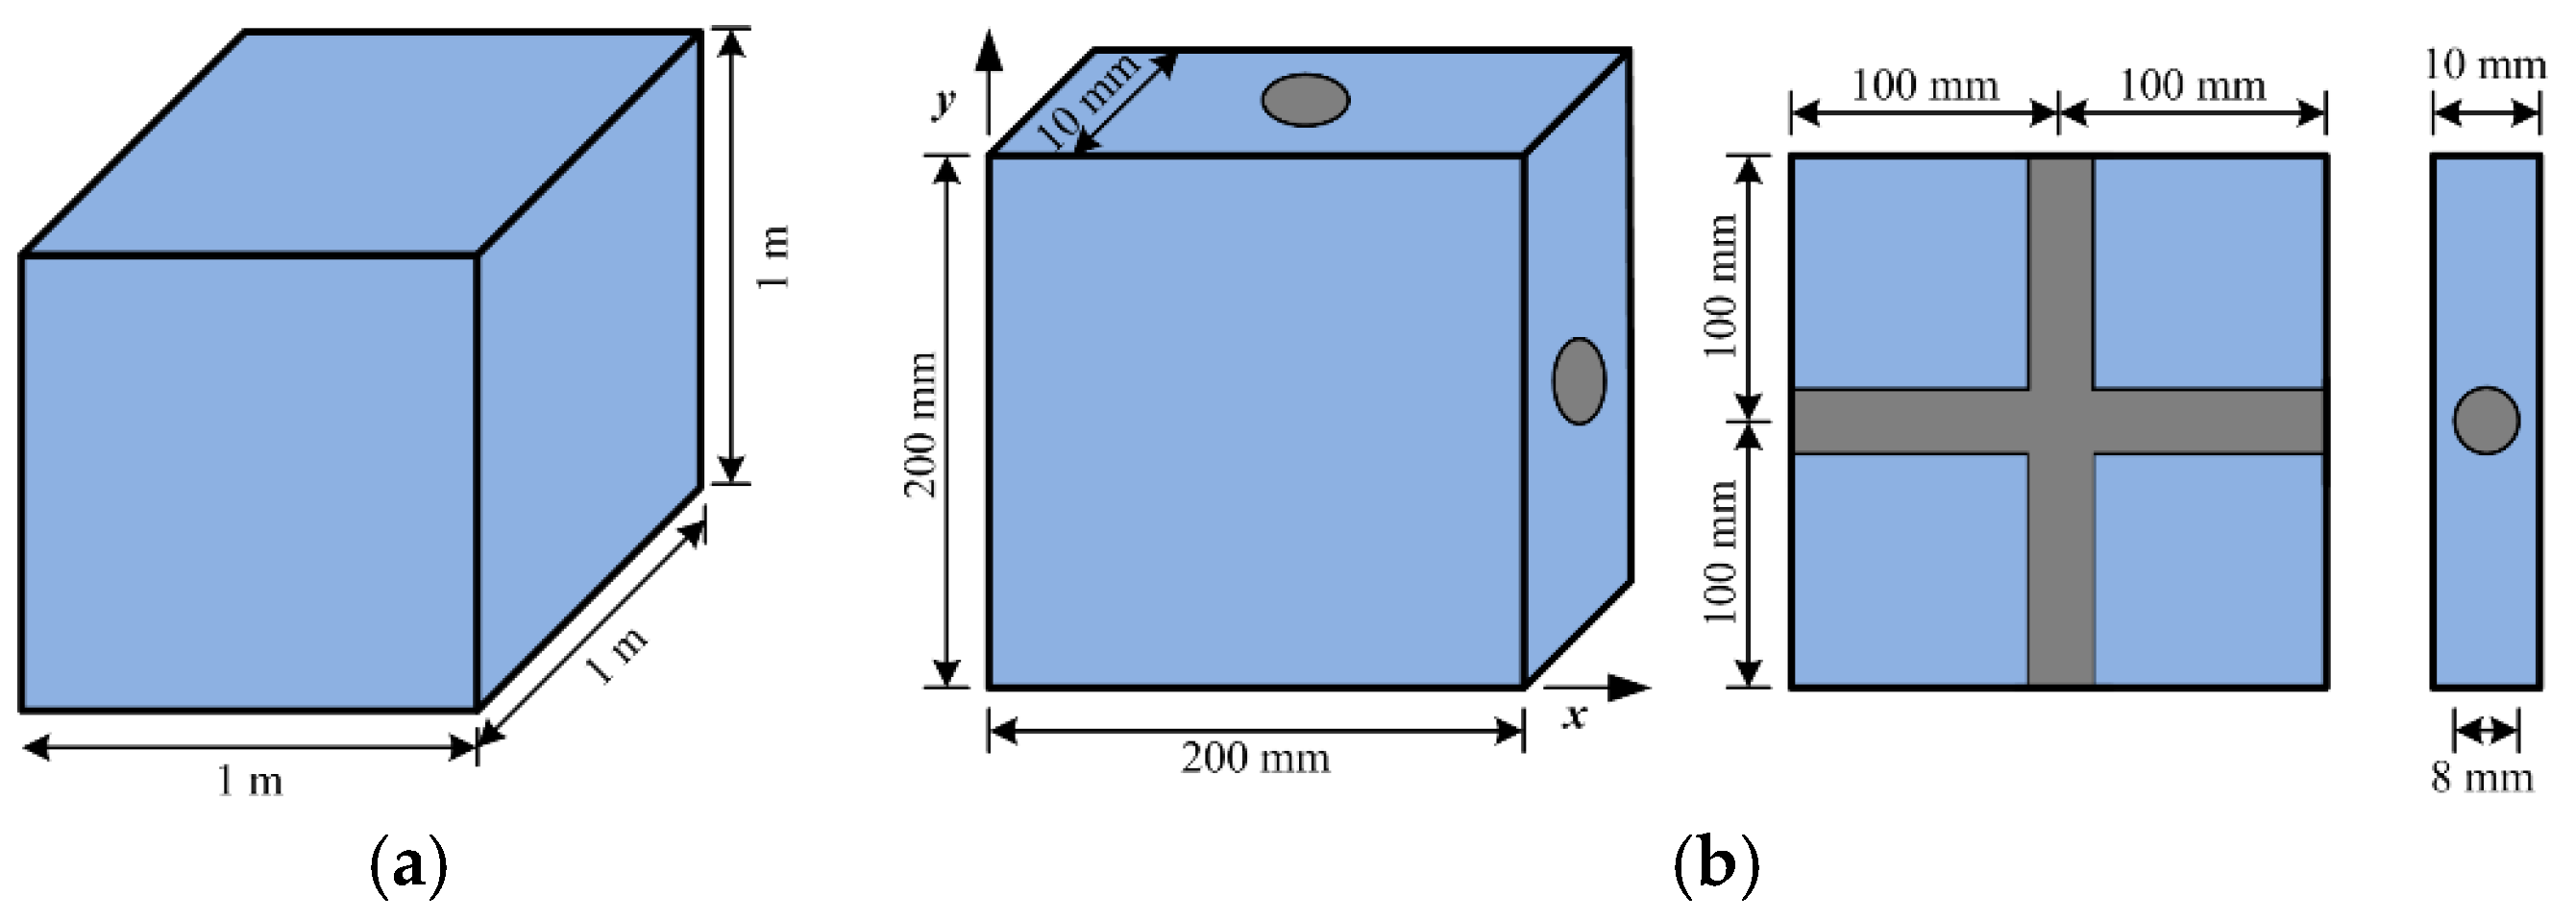
Figure 9.
Representative volume elements for local finite element test; (a) Concrete representative volume element (RVE); (b) RC RVE.
Figure 9.
Representative volume elements for local finite element test; (a) Concrete representative volume element (RVE); (b) RC RVE.
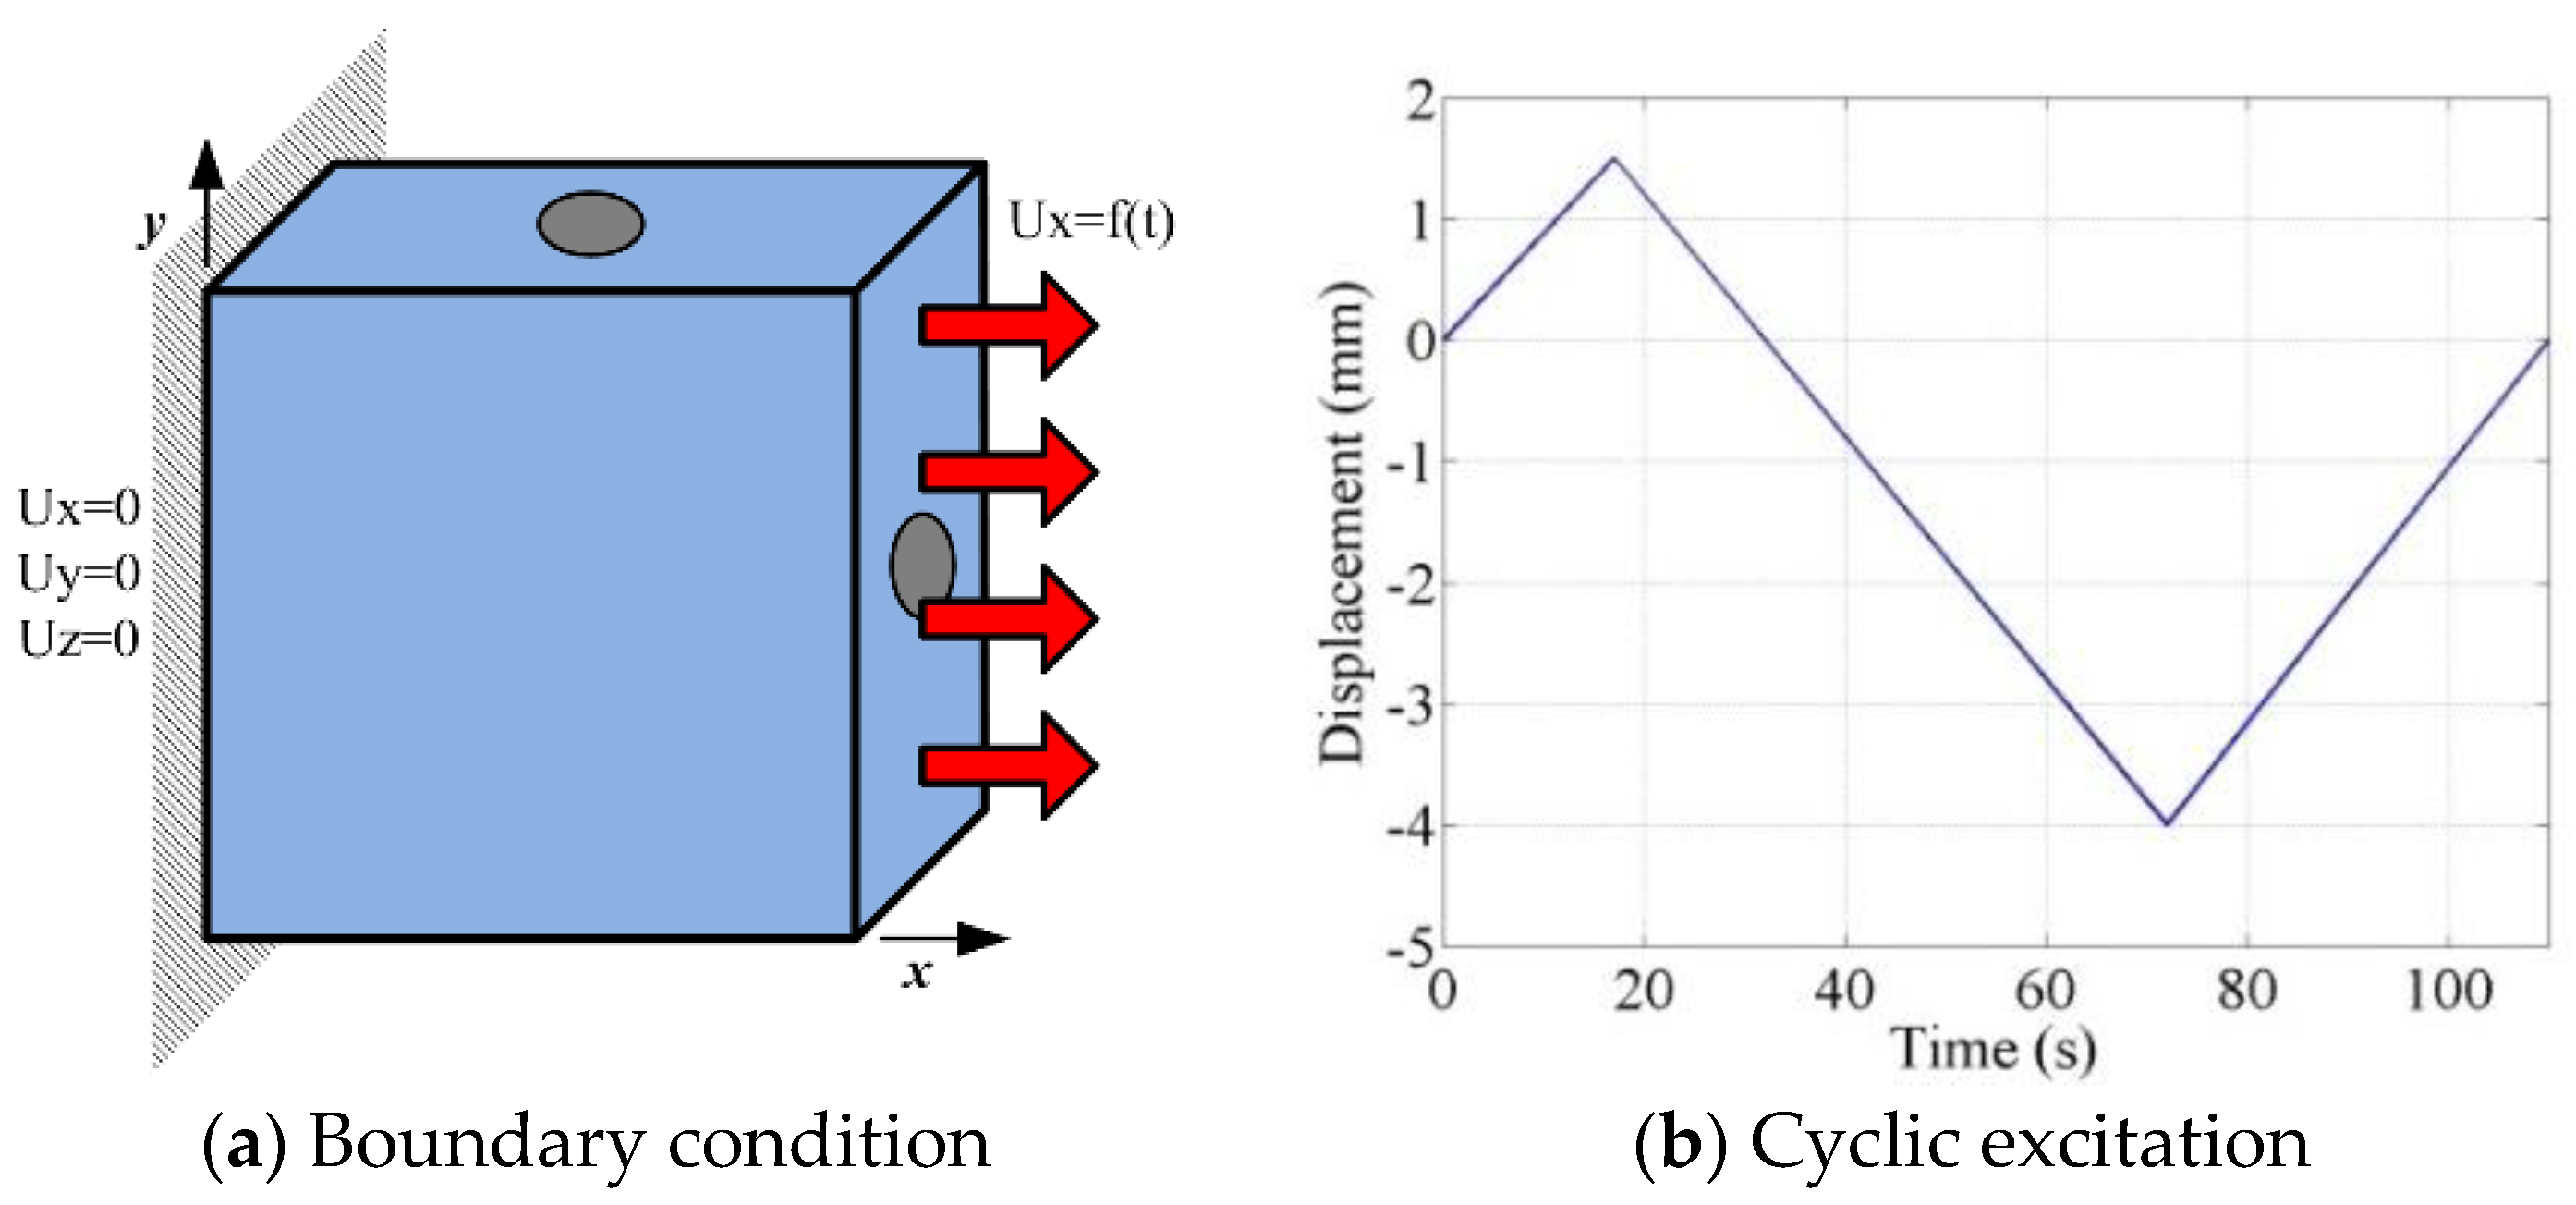
Figure 10.
Local test rc.1: uniaxial cyclic displacement loading.
Figure 10.
Local test rc.1: uniaxial cyclic displacement loading.
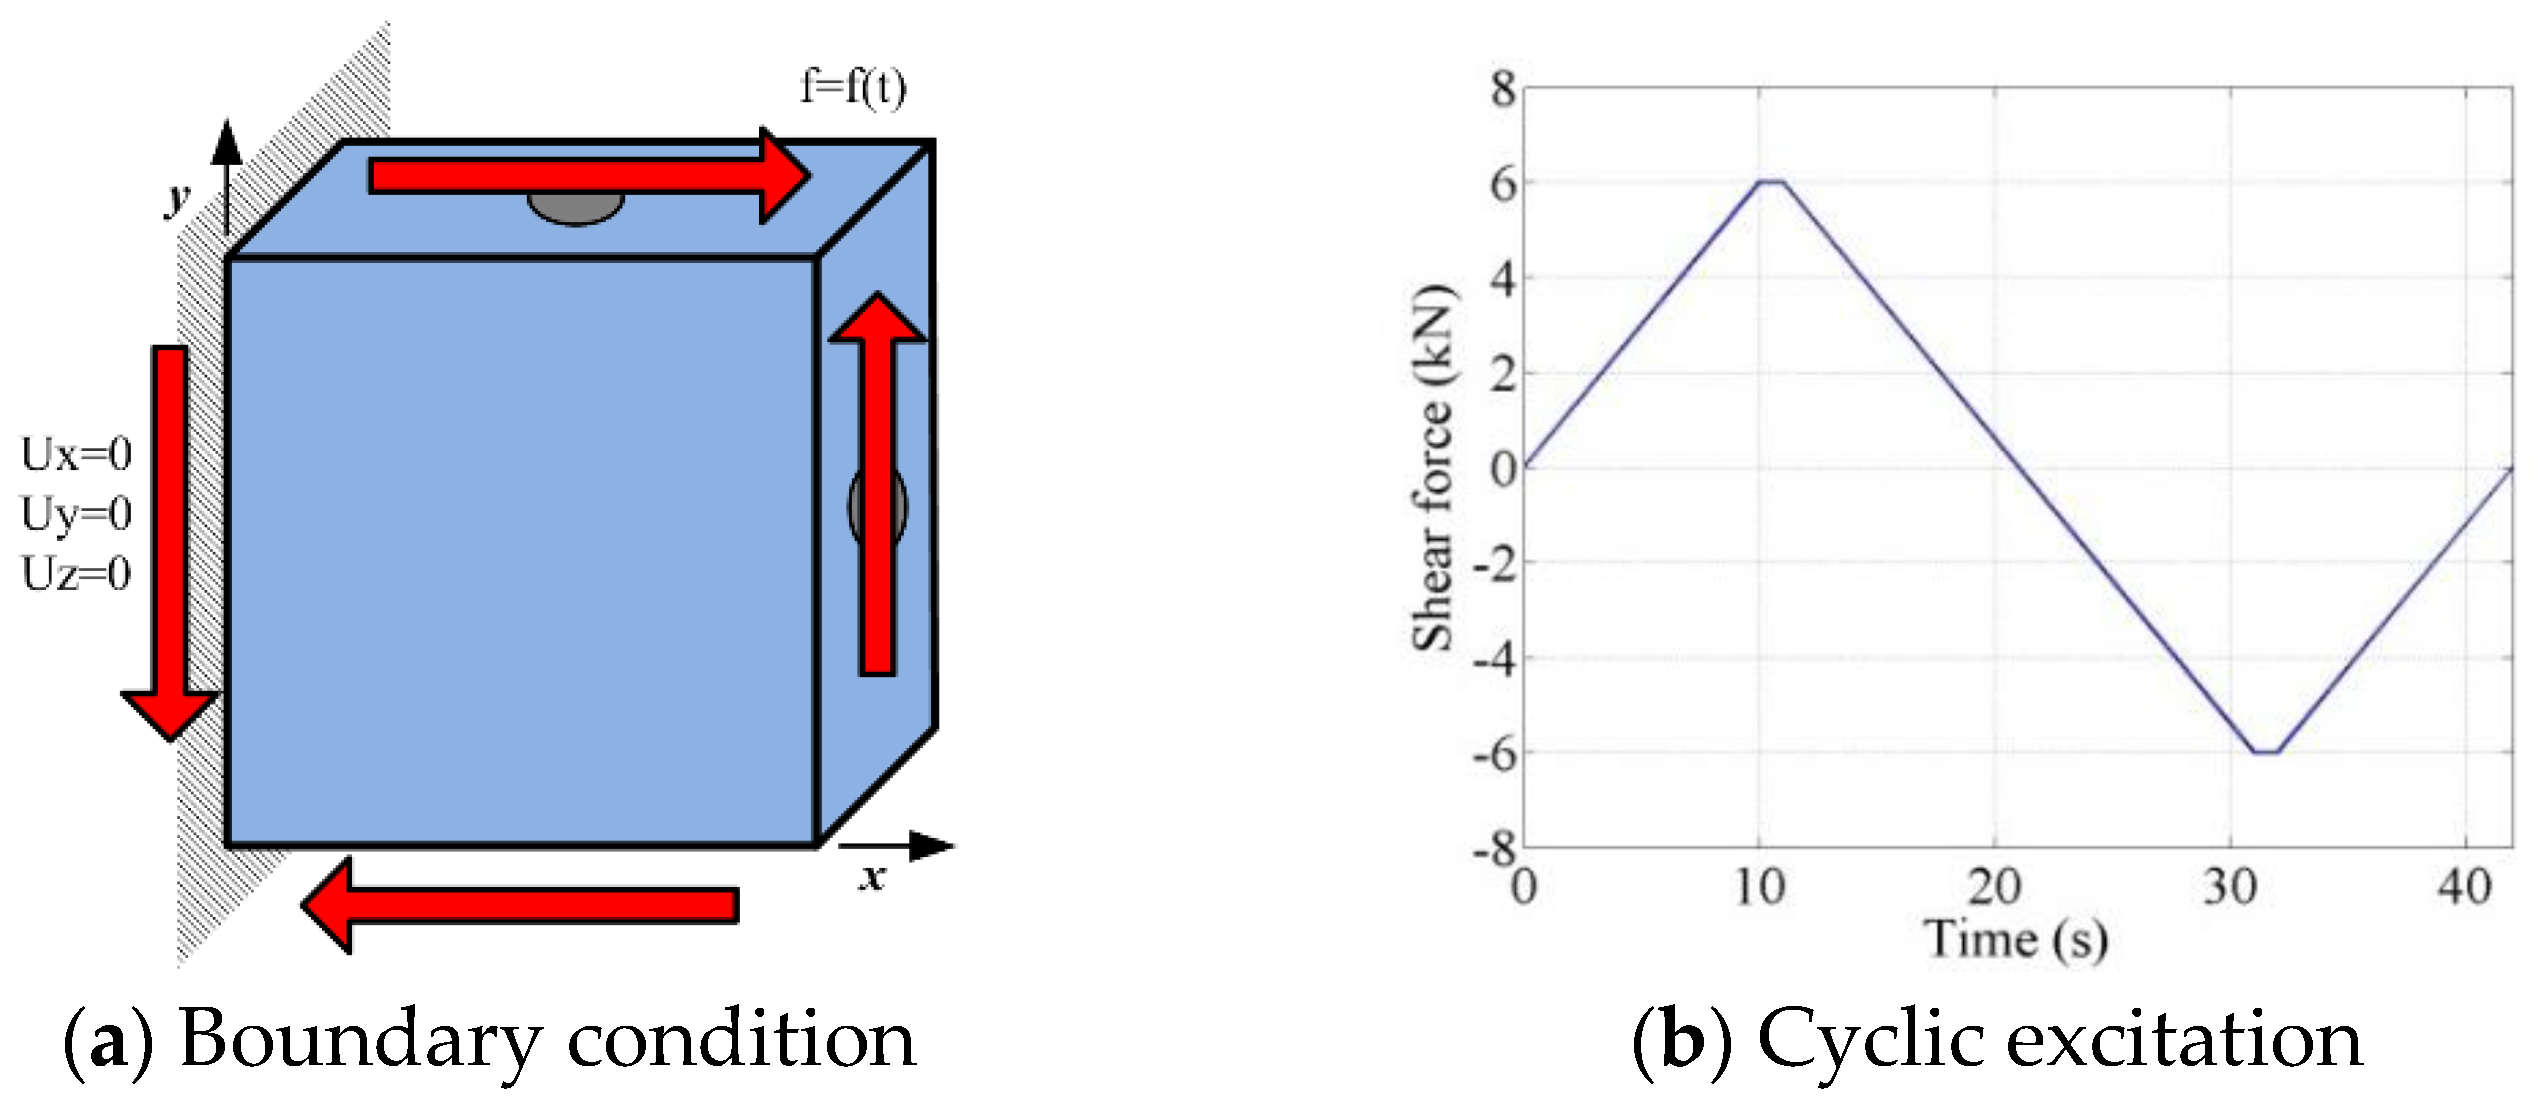
Figure 11.
Local test rc.2: cyclic pure shear loading.
Figure 11.
Local test rc.2: cyclic pure shear loading.
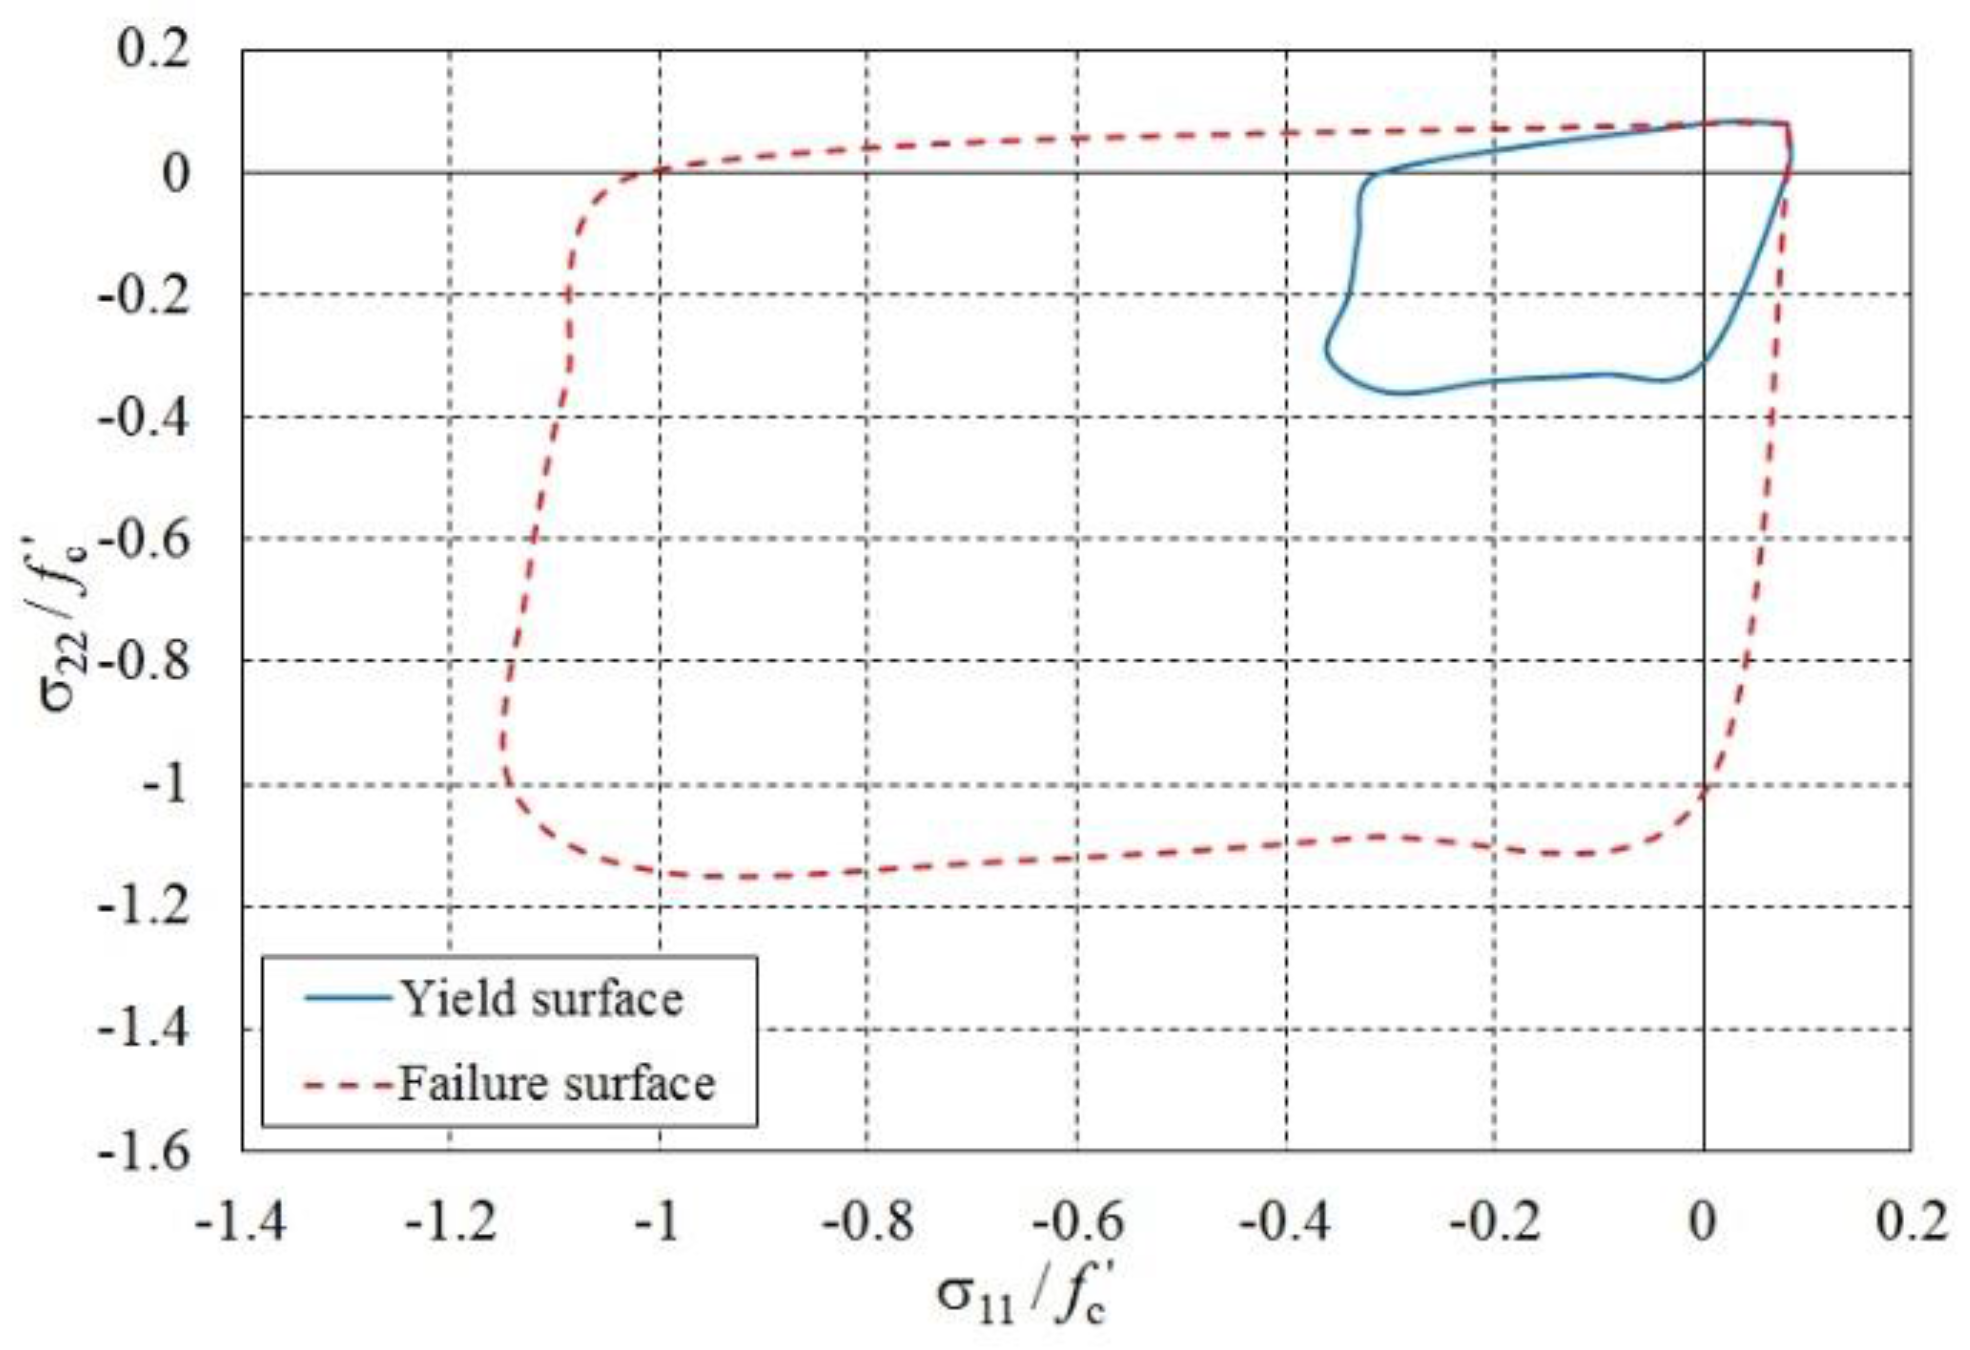
Figure 12.
Yield and failure surfaces constructed from local test c.1.
Figure 12.
Yield and failure surfaces constructed from local test c.1.
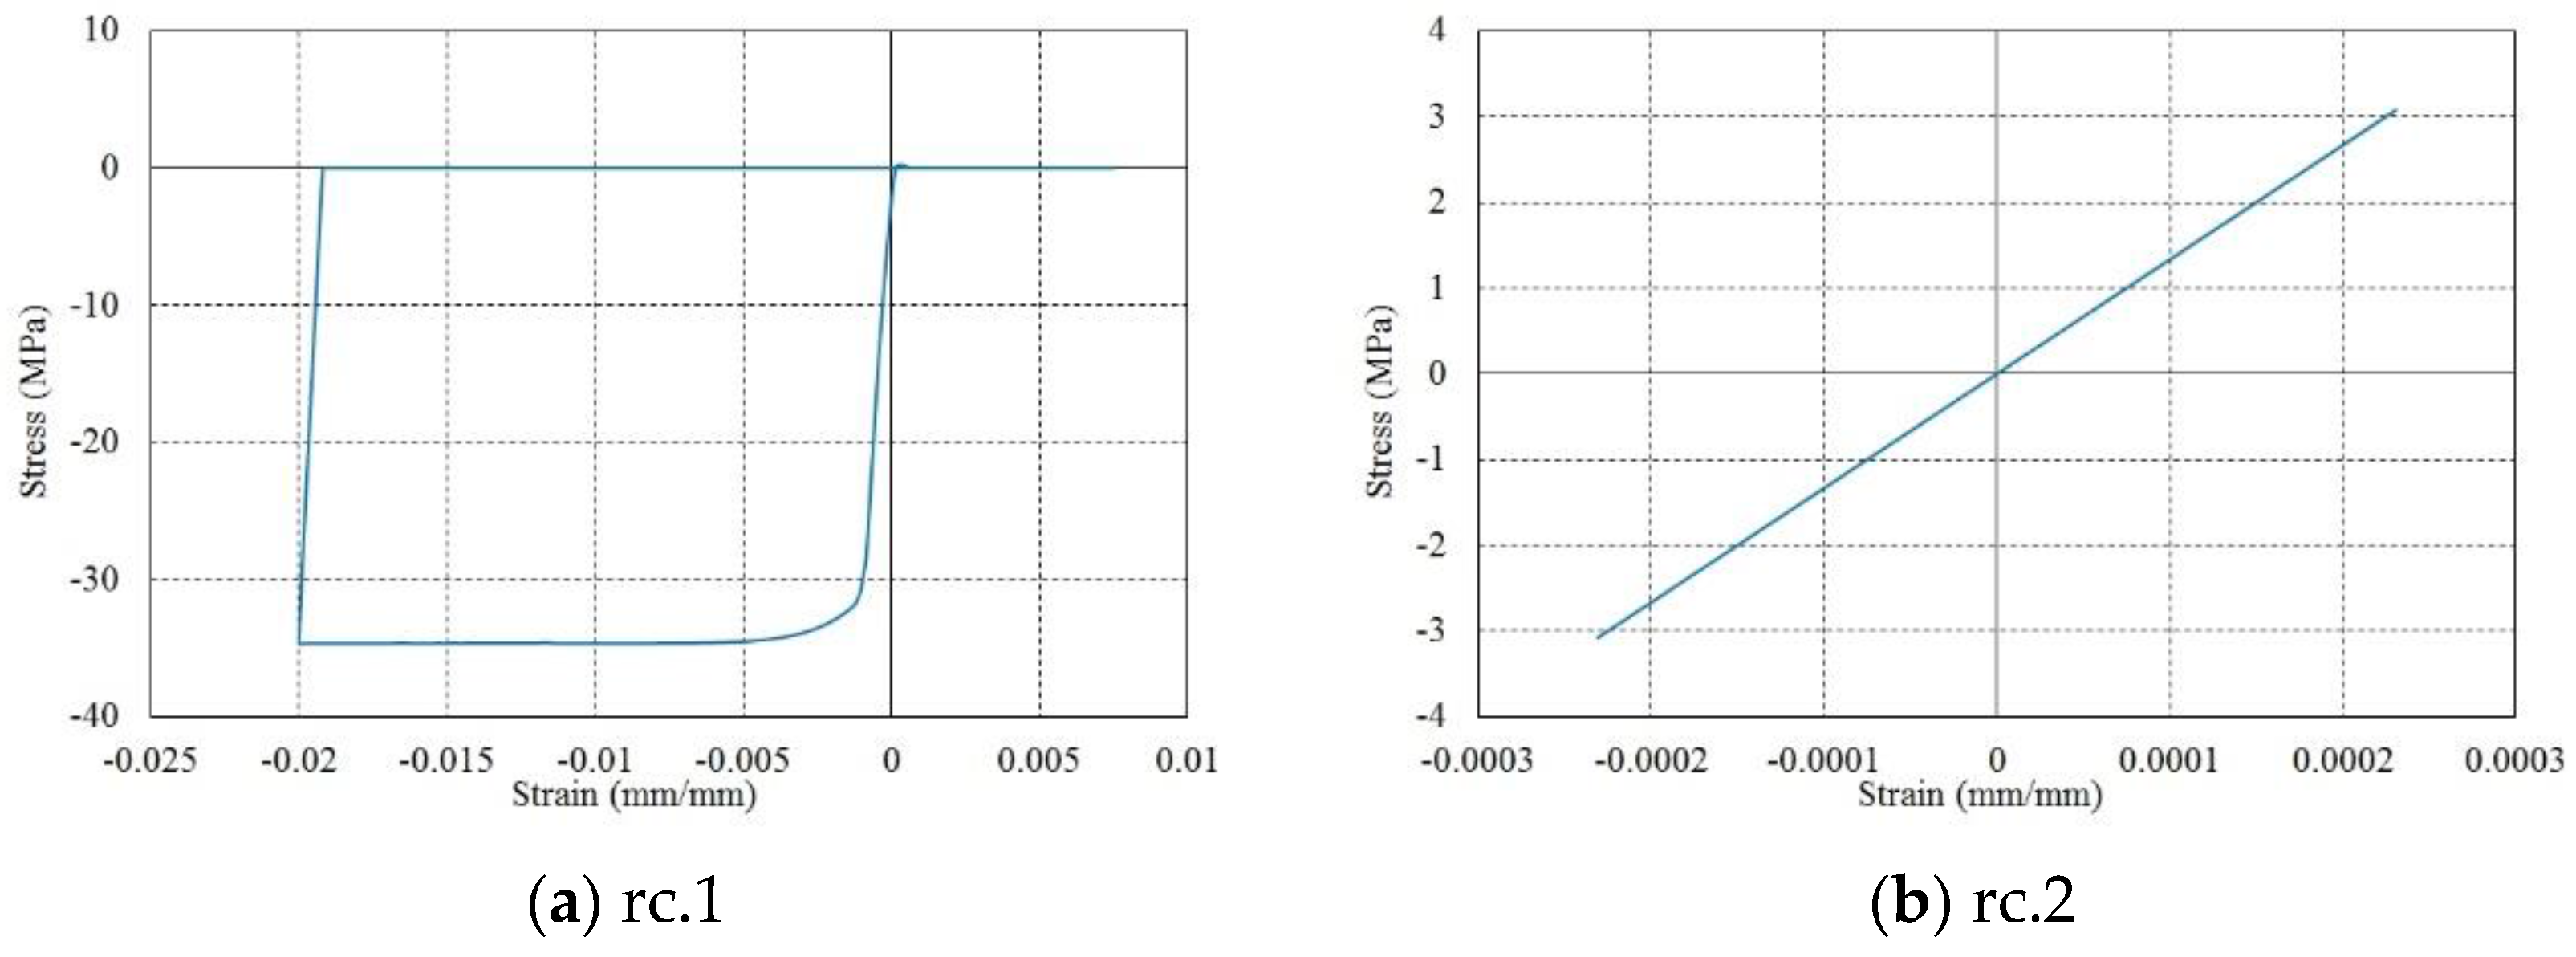
Figure 13.
Stress–strain responses from local tests rc.1 and rc.2.
Figure 13.
Stress–strain responses from local tests rc.1 and rc.2.
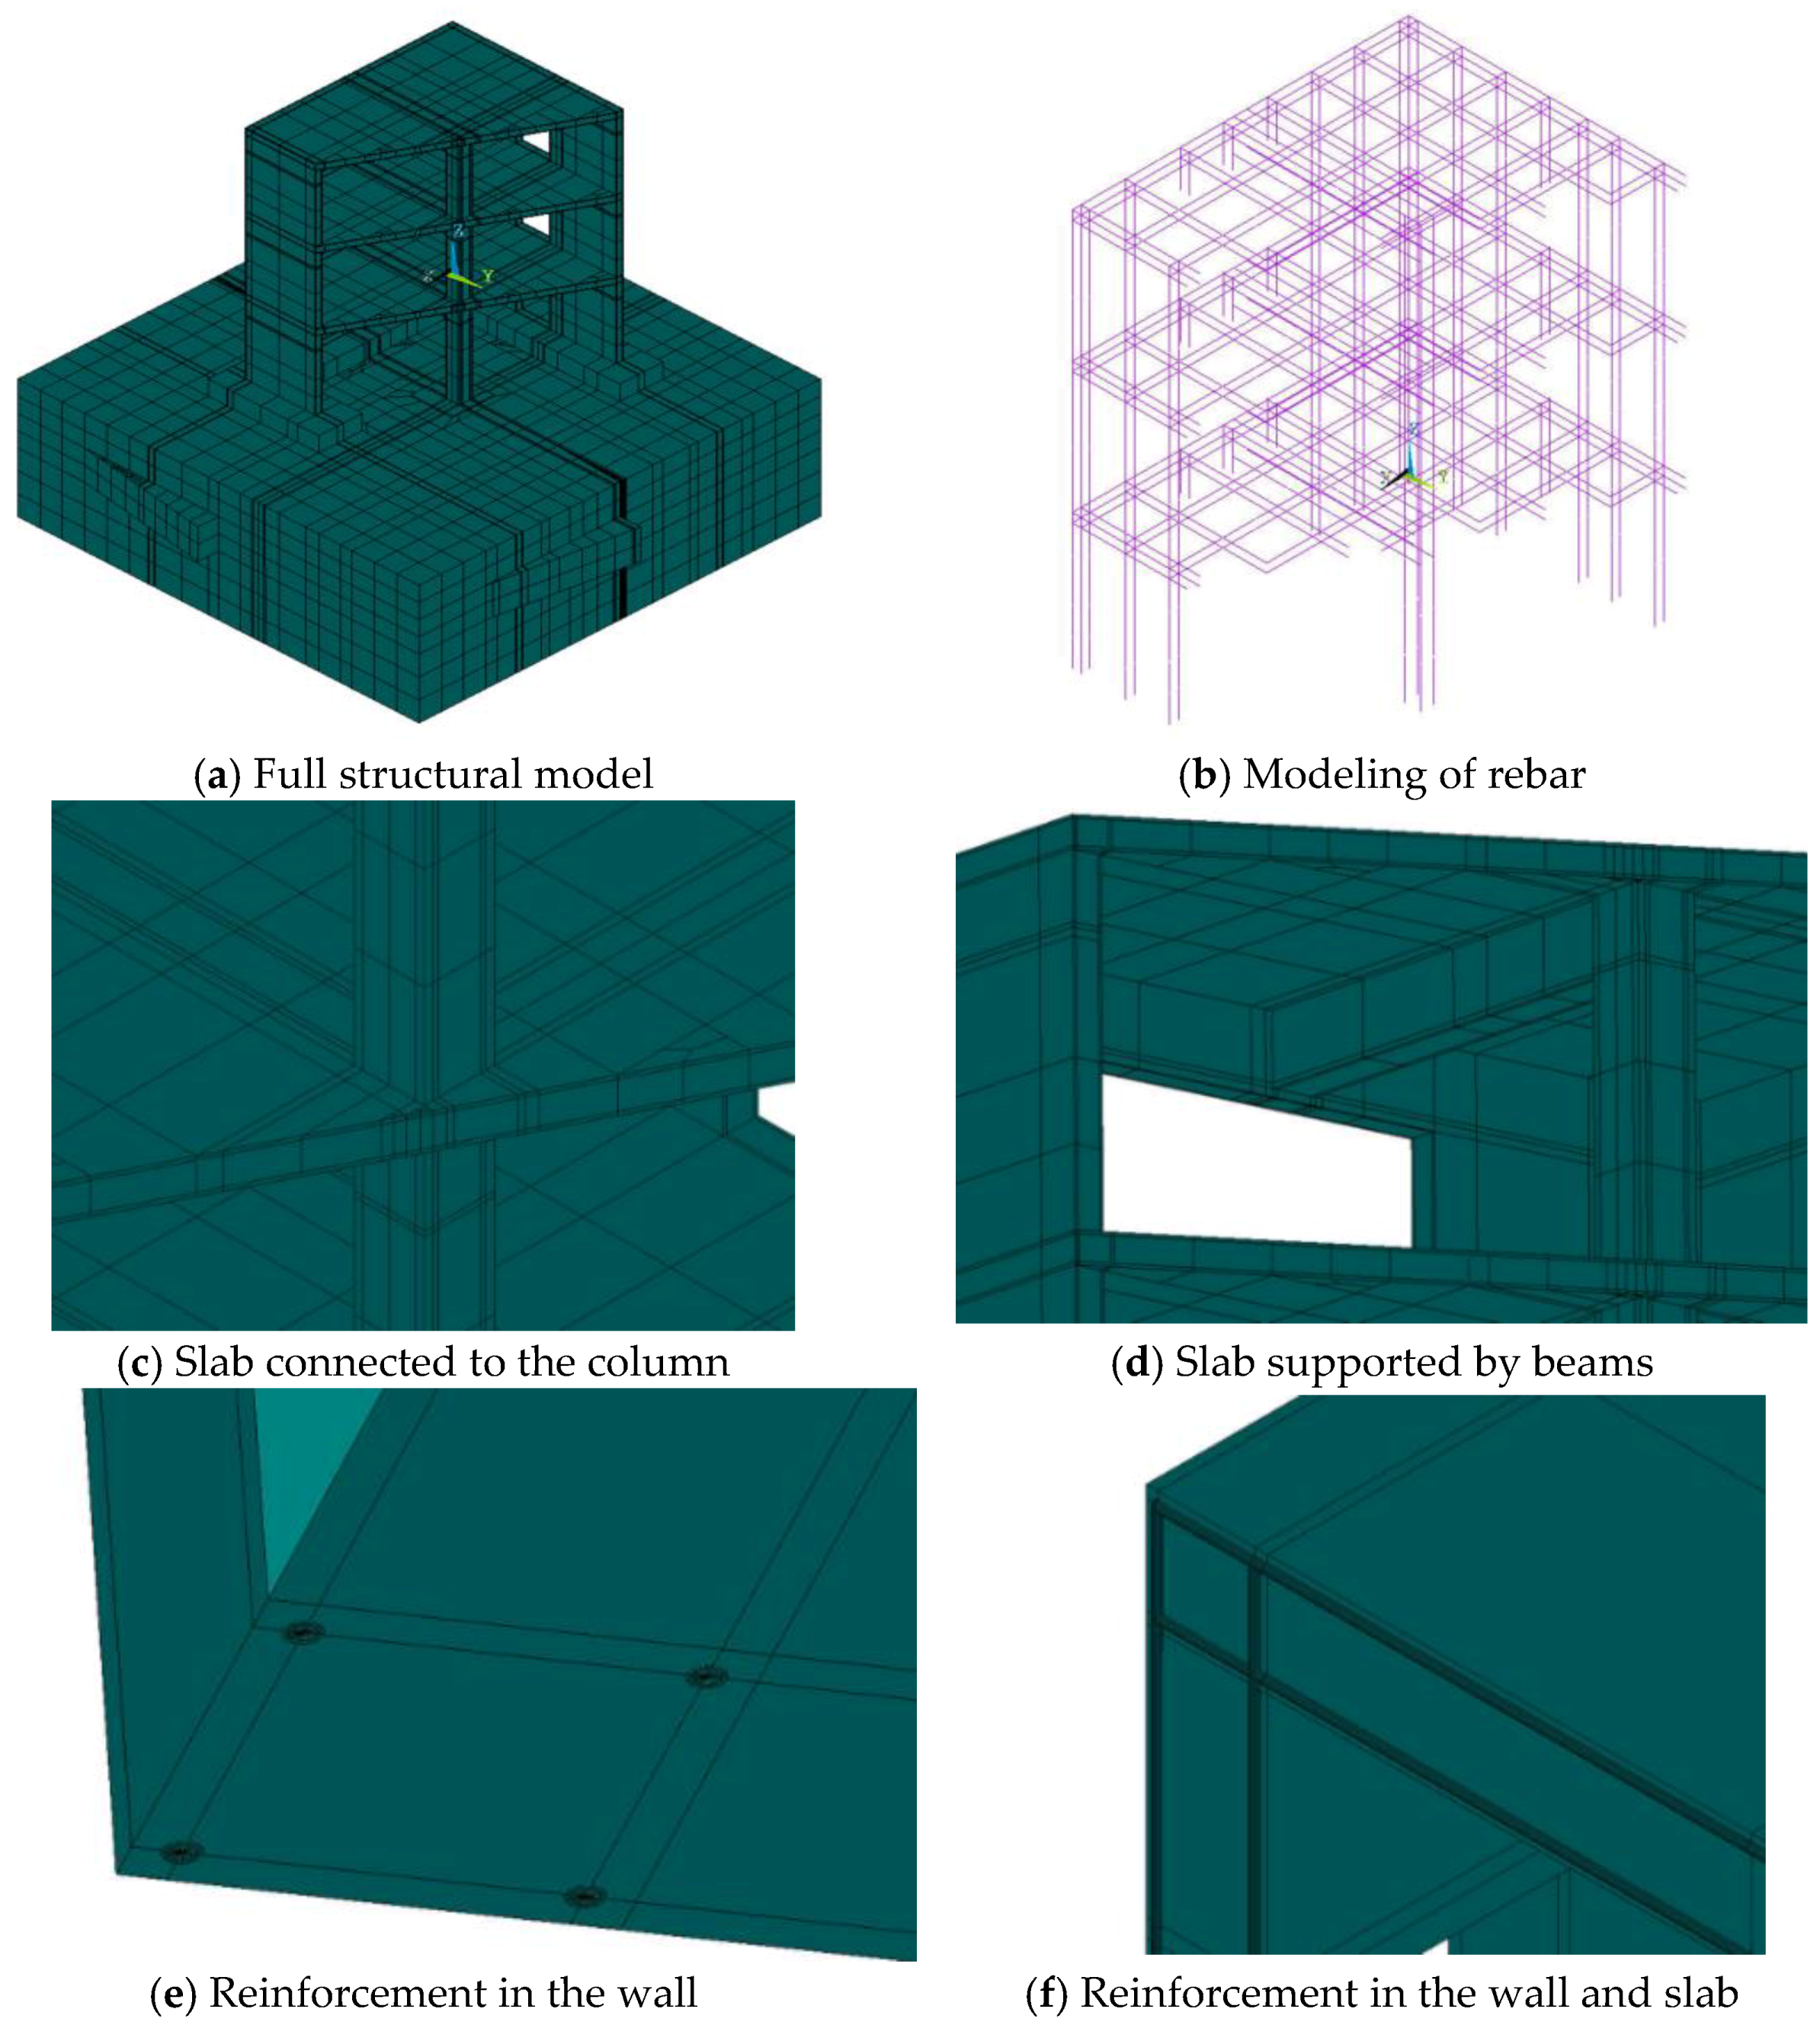
Figure 14.
Finite element modeling of the SMART 2013 RC structure.
Figure 14.
Finite element modeling of the SMART 2013 RC structure.
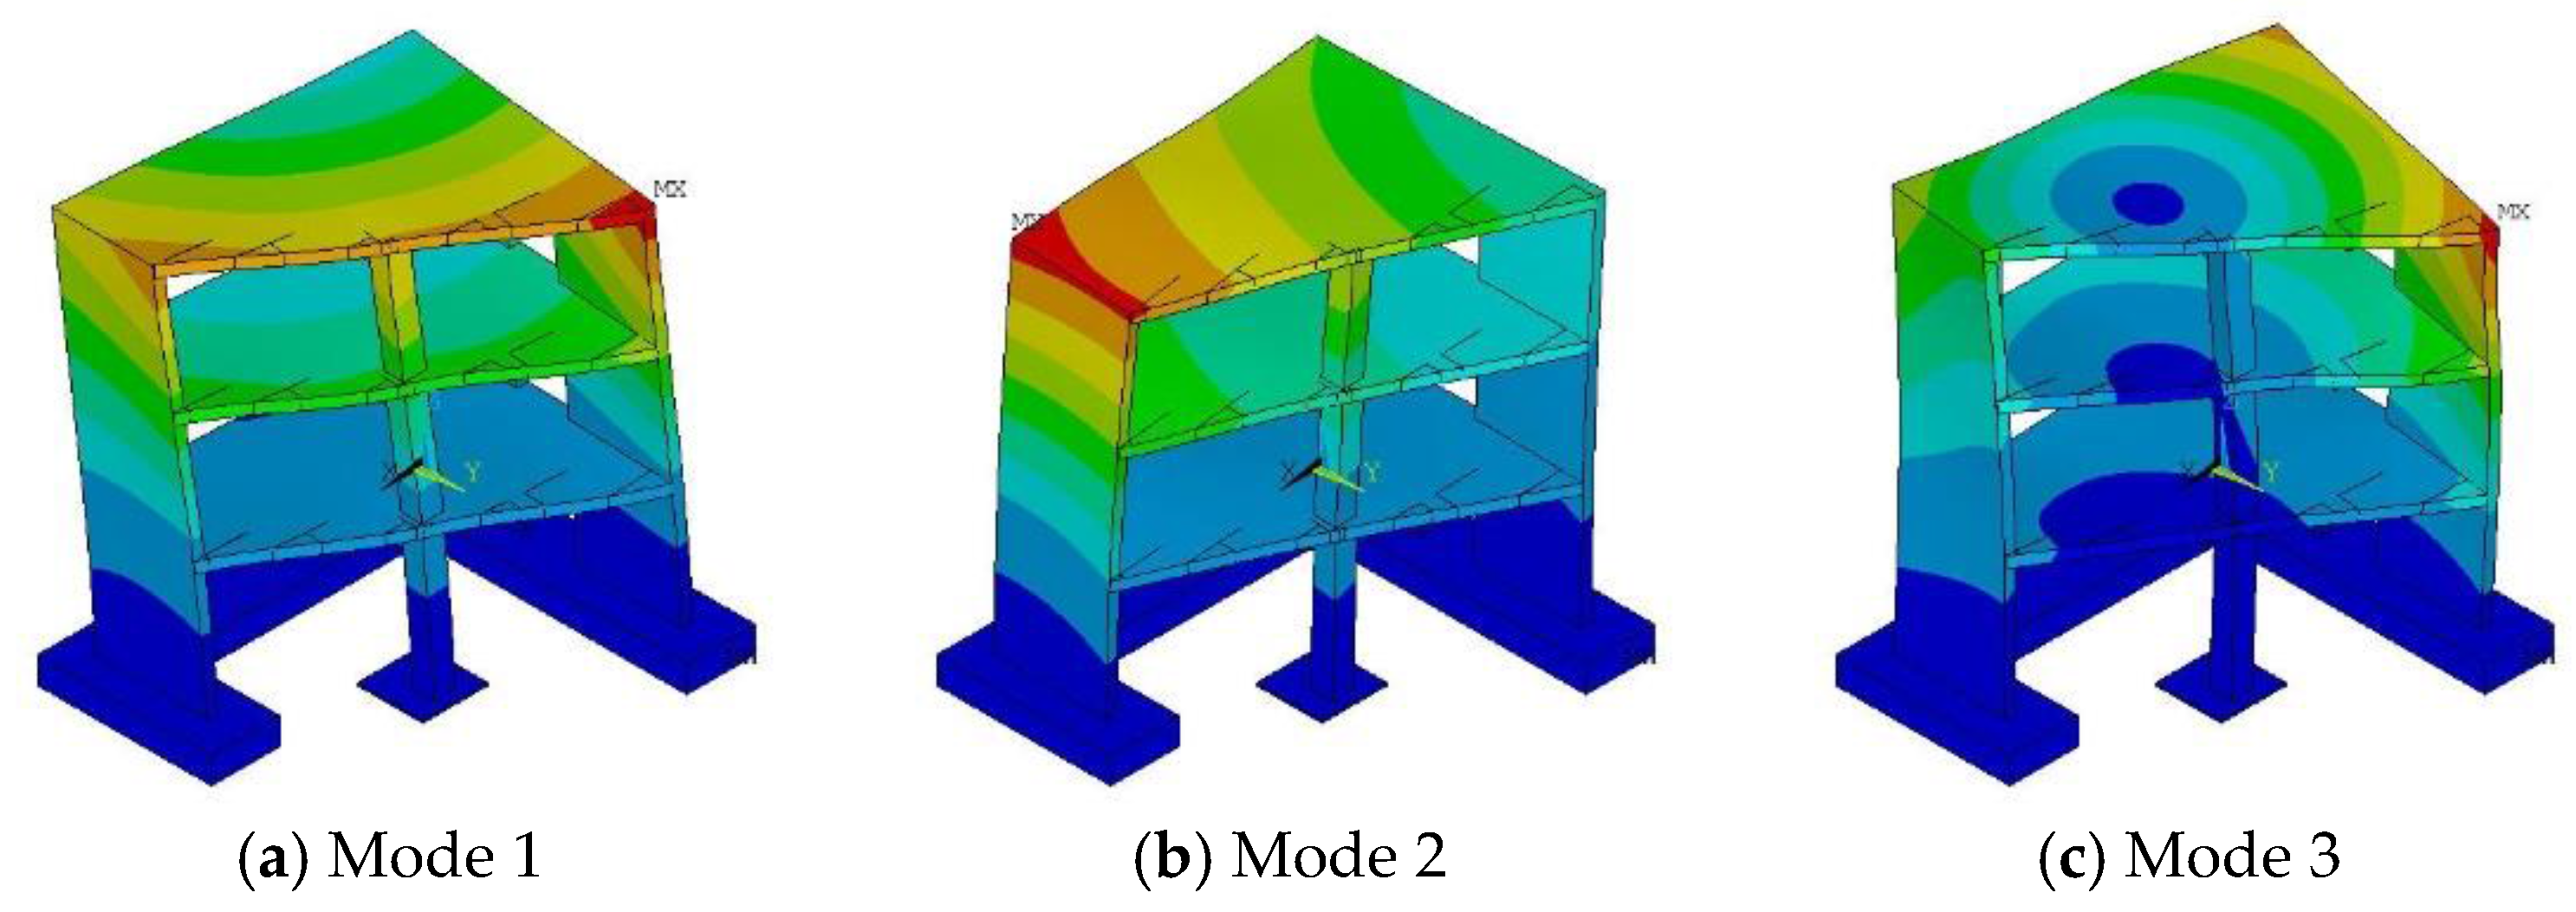
Figure 15.
Mode shapes of the SMART 2013 RC structure for the model Case 1.
Figure 15.
Mode shapes of the SMART 2013 RC structure for the model Case 1.
Figure 16.
Mode shapes of the SMART 2013 RC structure for the model Case 2.
Figure 16.
Mode shapes of the SMART 2013 RC structure for the model Case 2.
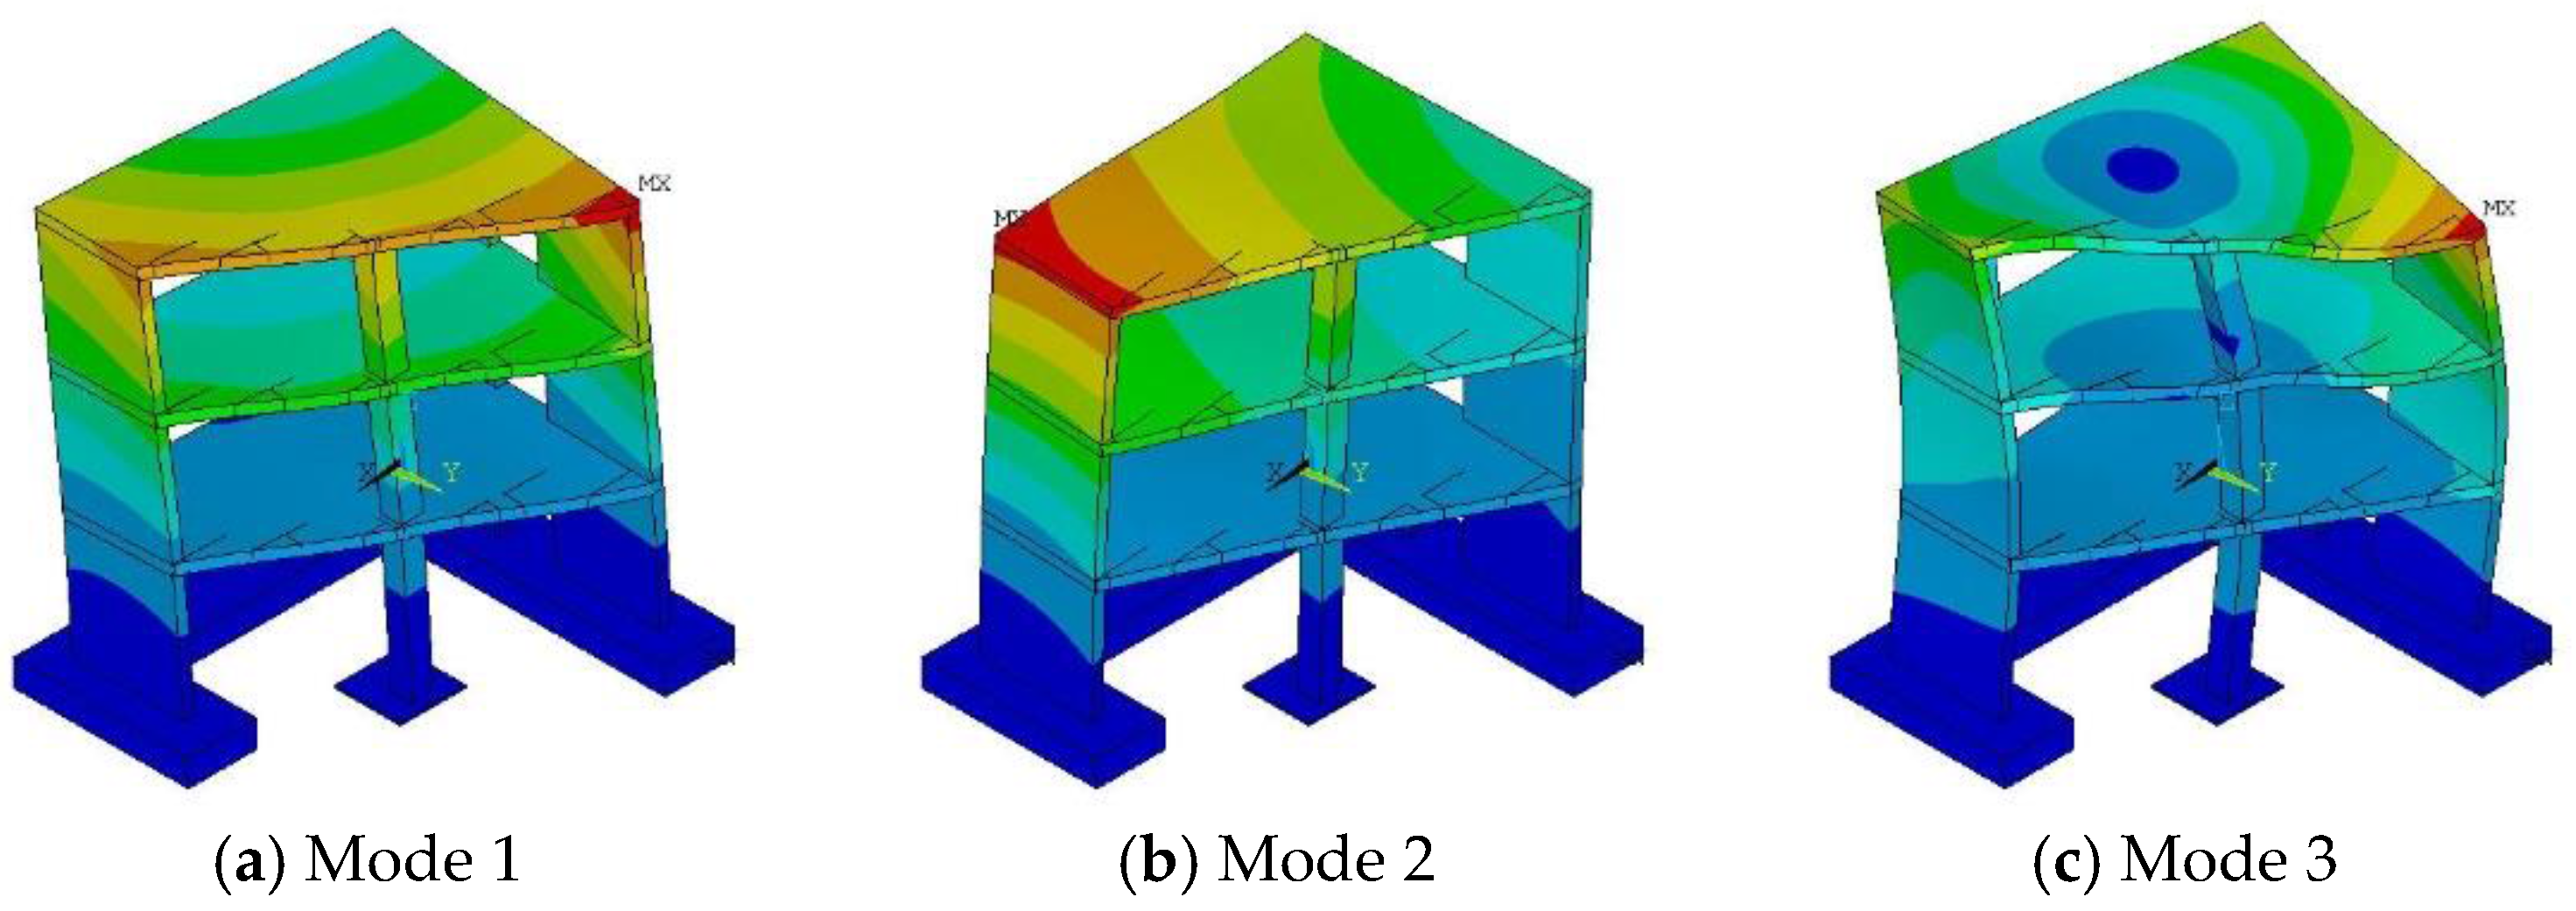
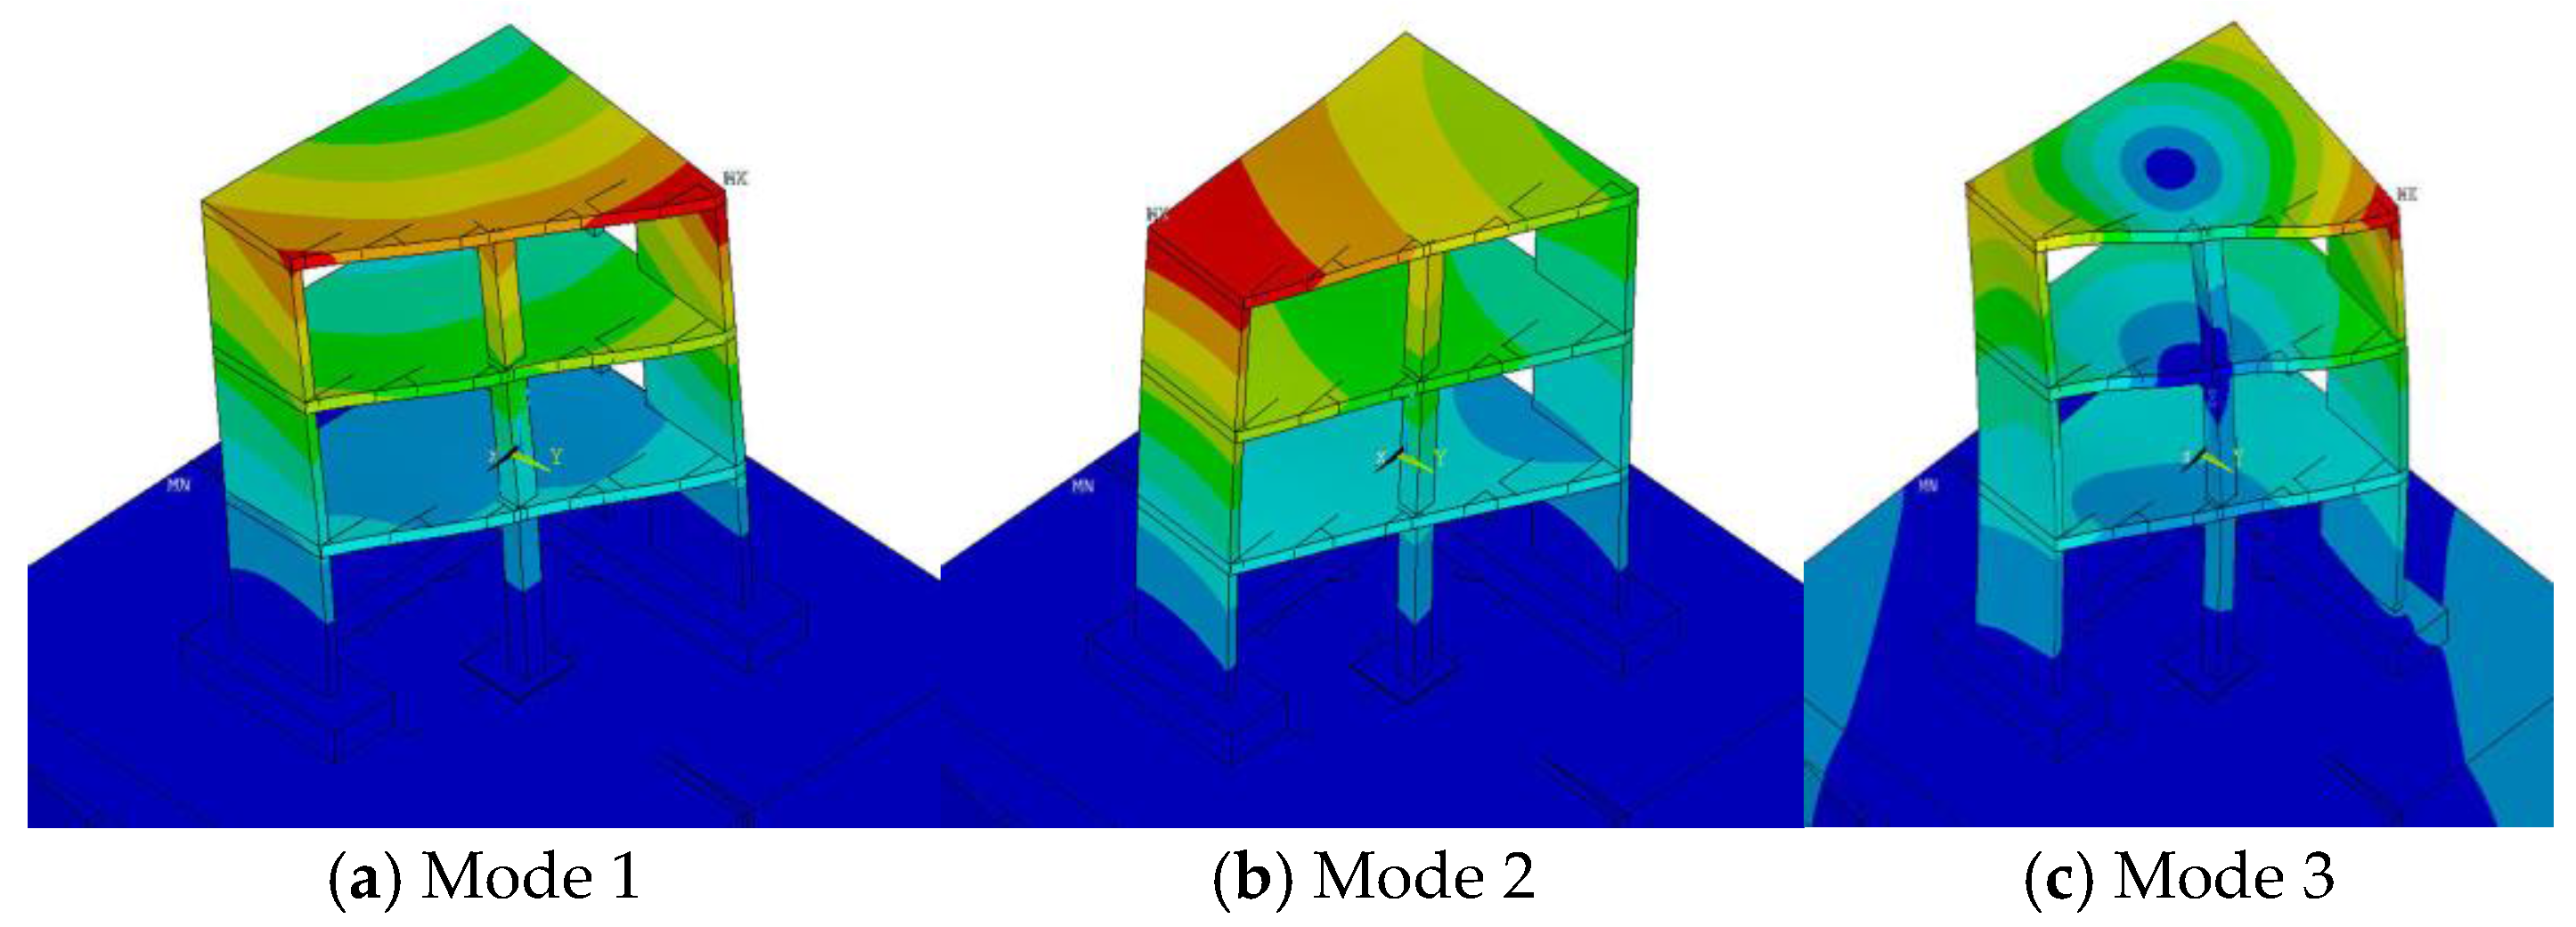
Figure 17.
Mode shapes of the SMART 2013 RC structure for the model Case 3.
Figure 17.
Mode shapes of the SMART 2013 RC structure for the model Case 3.
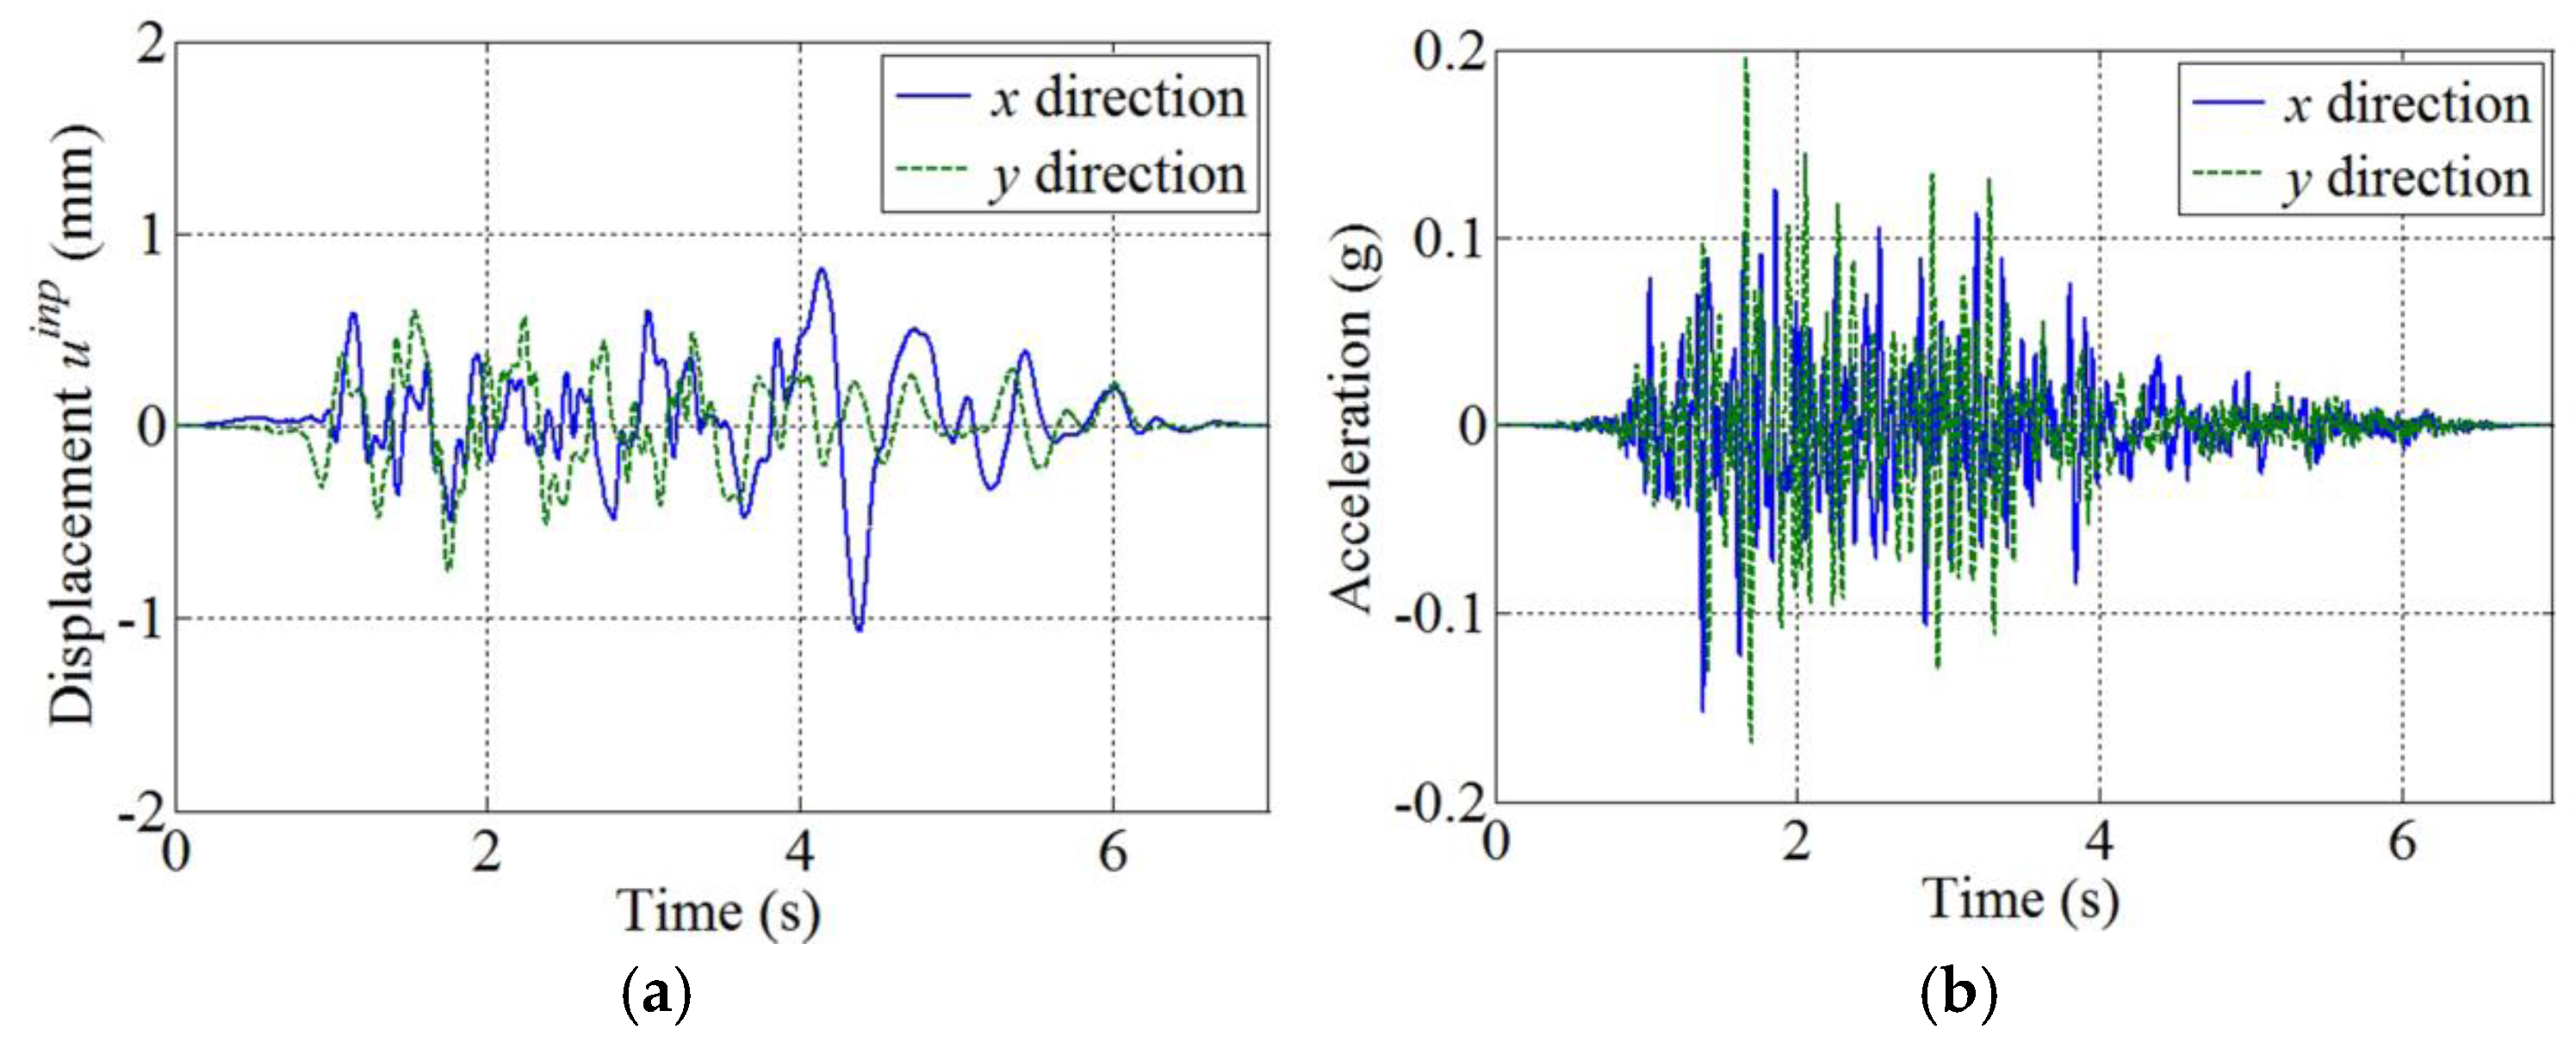
Figure 18.
Low-intensity ground motions; (a) ground displacement; (b) ground acceleration.
Figure 18.
Low-intensity ground motions; (a) ground displacement; (b) ground acceleration.
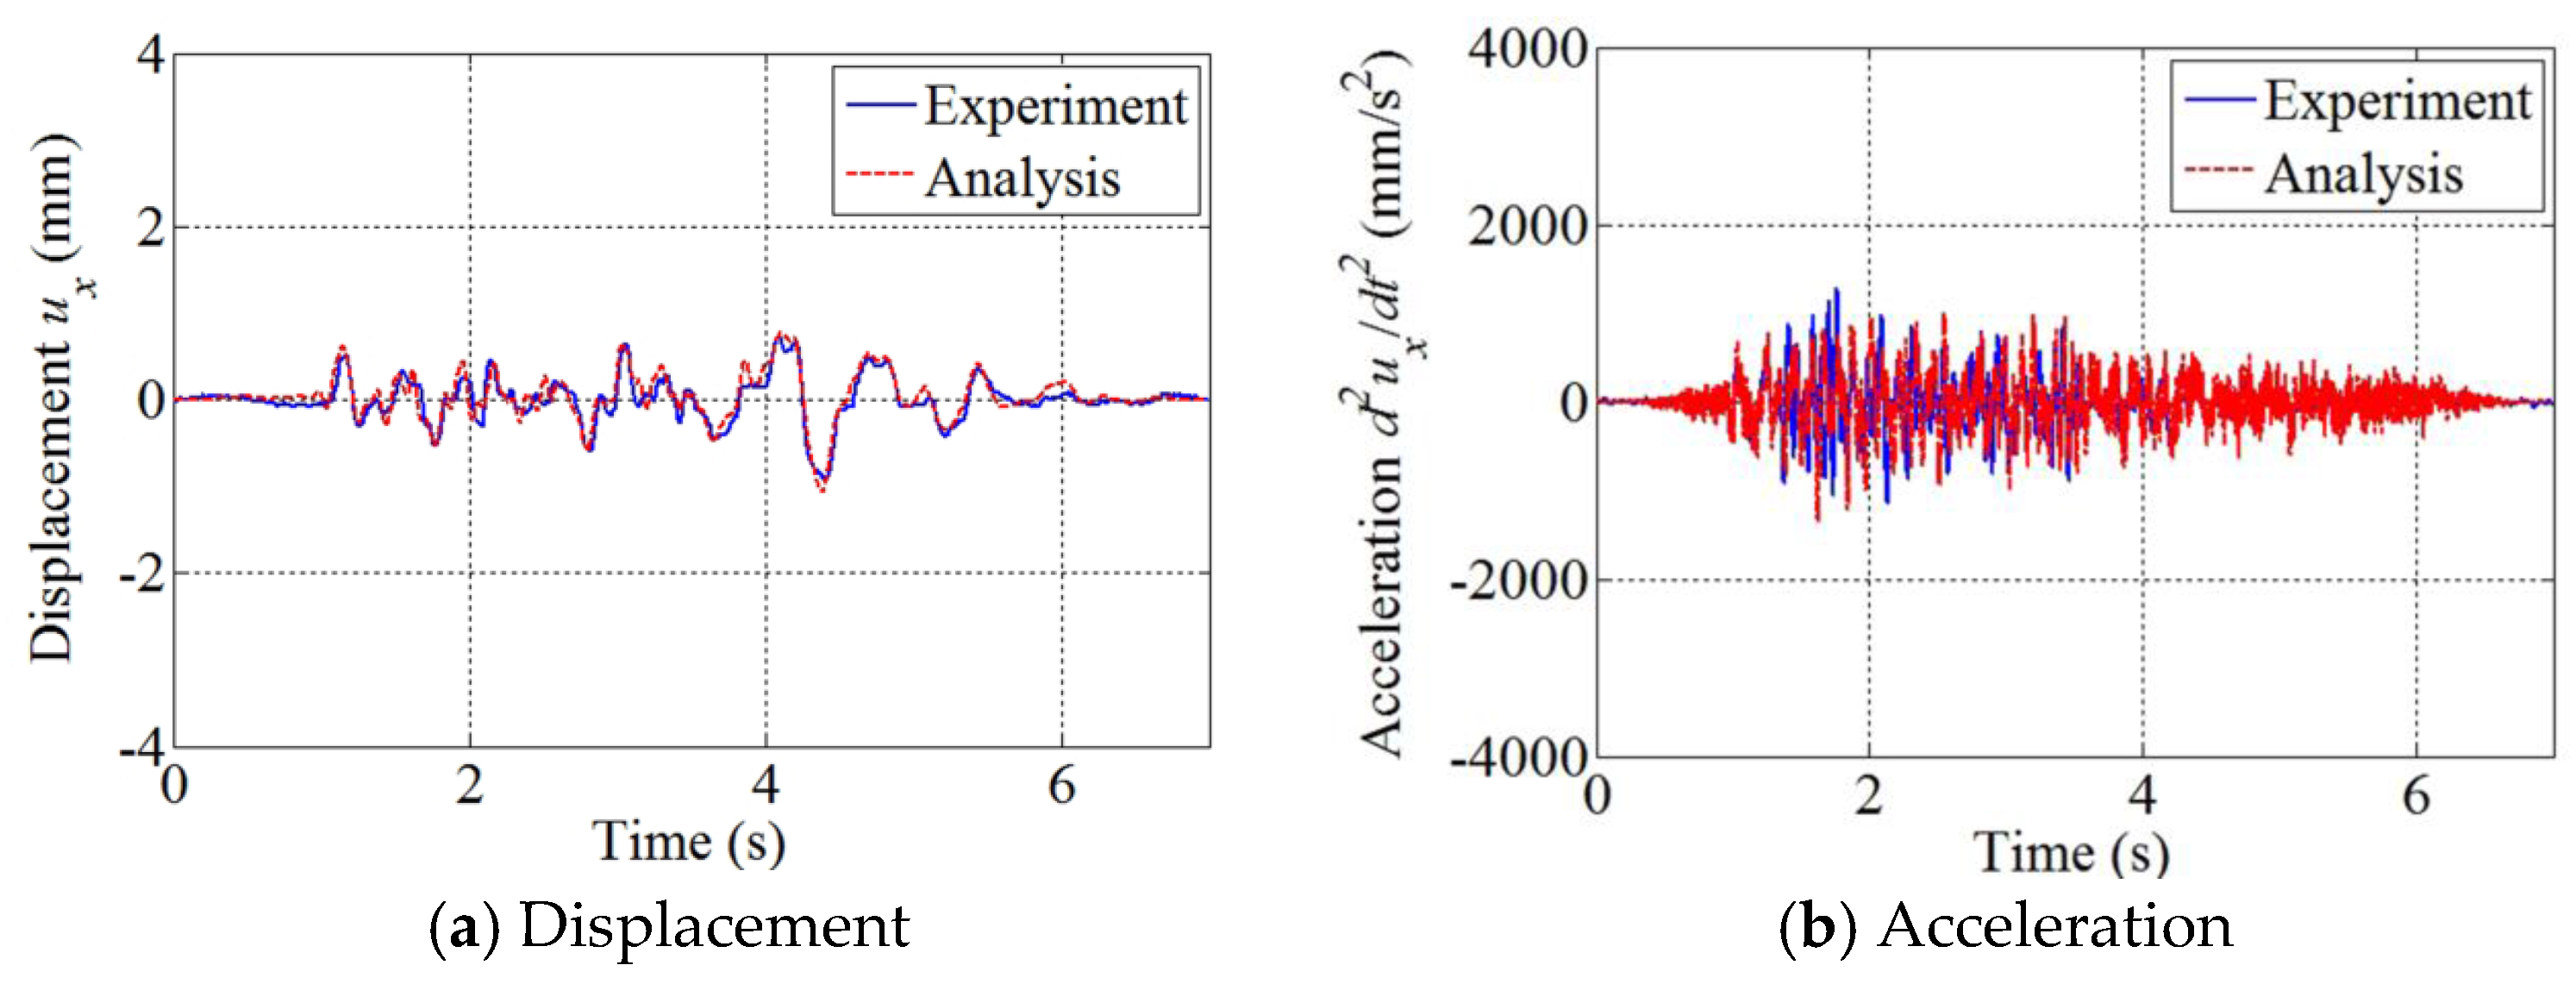
Figure 19.
First-floor response in the x direction due to the low-intensity ground motion; responses sampled at point A.
Figure 19.
First-floor response in the x direction due to the low-intensity ground motion; responses sampled at point A.
Figure 20.
Second-floor response in the x direction due to the low-intensity ground motion; responses sampled at point A.
Figure 20.
Second-floor response in the x direction due to the low-intensity ground motion; responses sampled at point A.
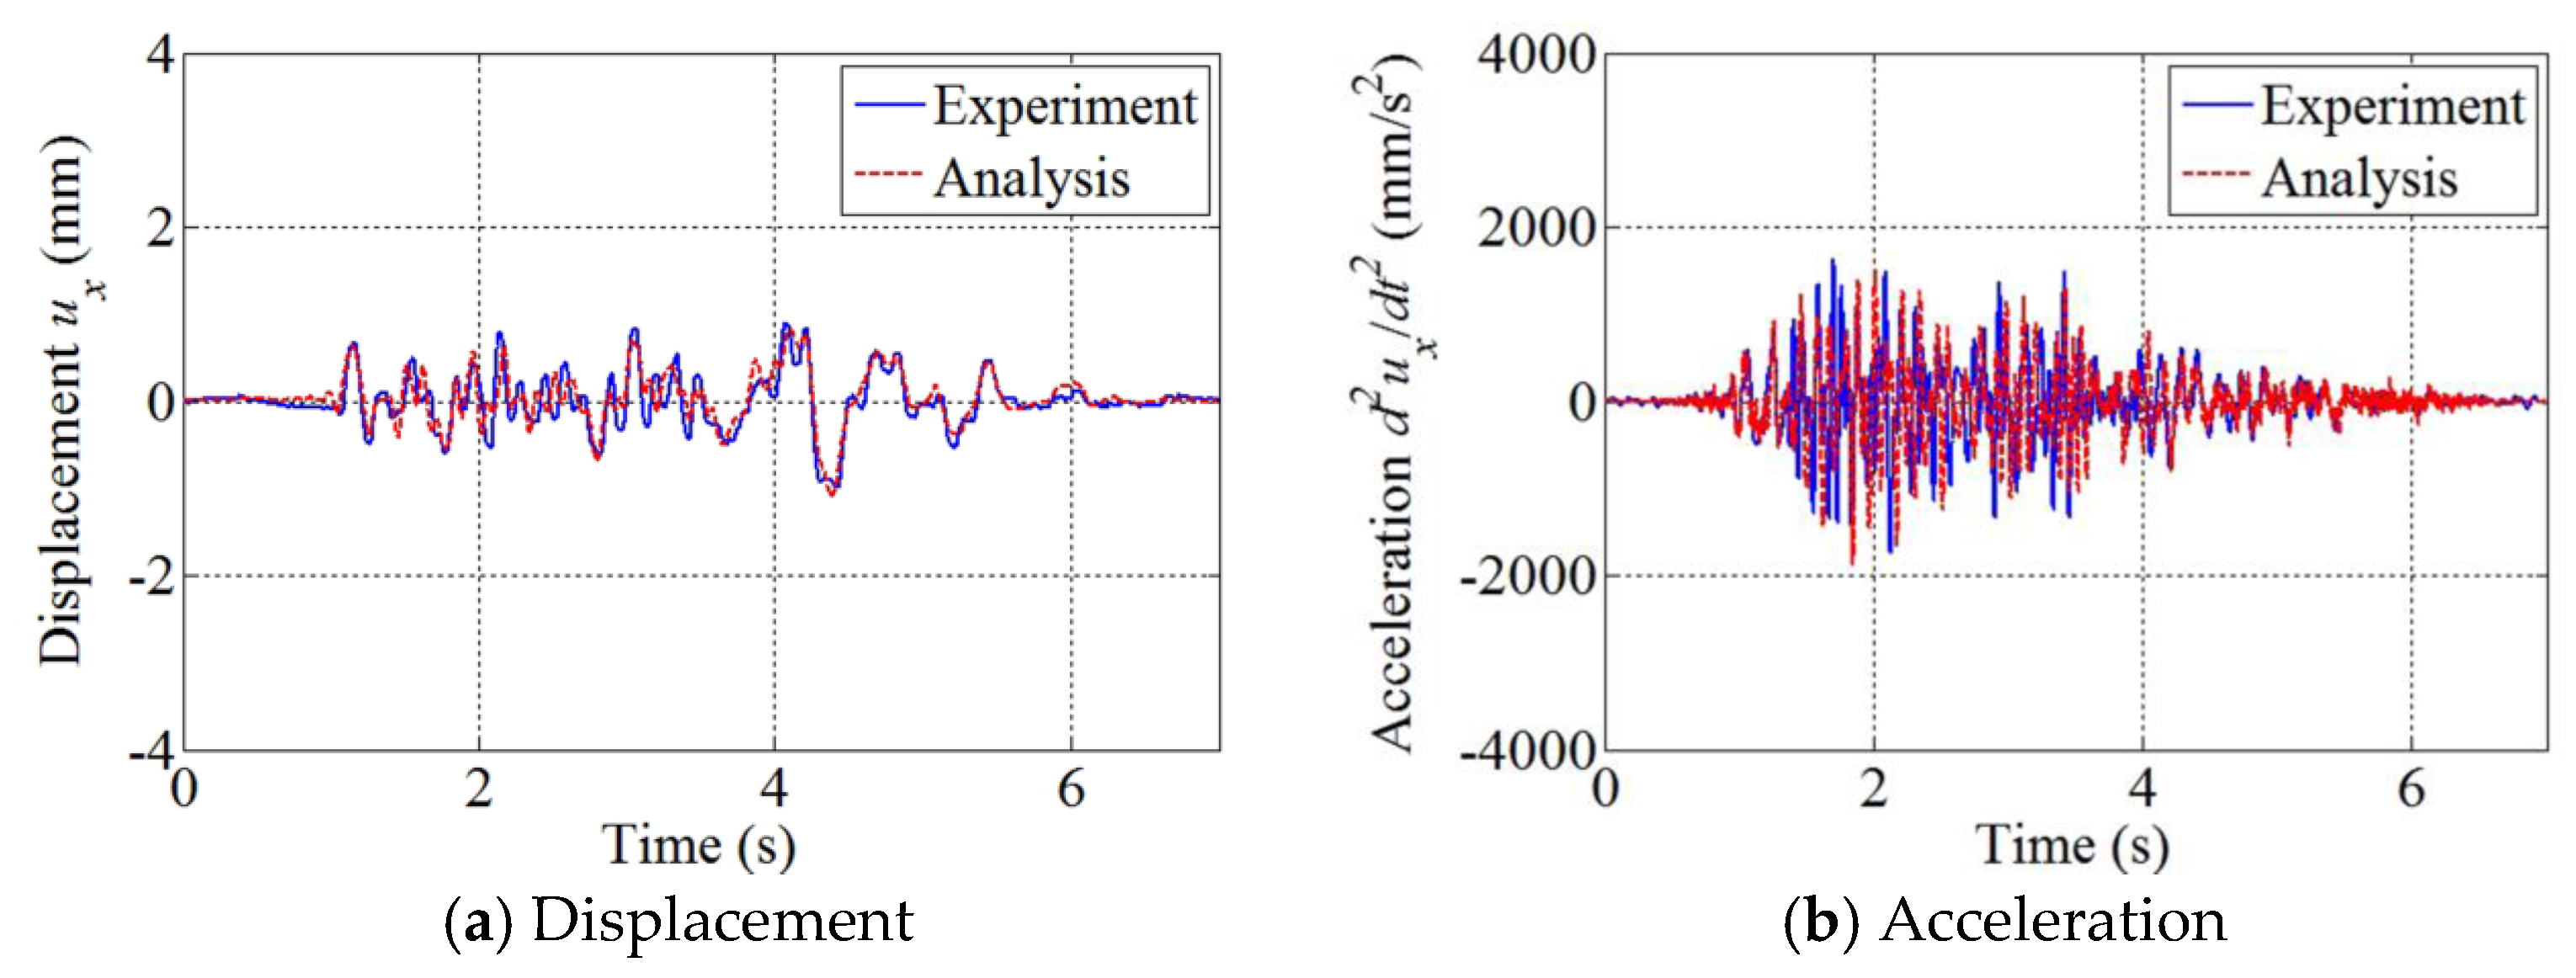
Figure 21.
Third-floor response in the x direction due to the low-intensity ground motion; responses sampled at point A.
Figure 21.
Third-floor response in the x direction due to the low-intensity ground motion; responses sampled at point A.
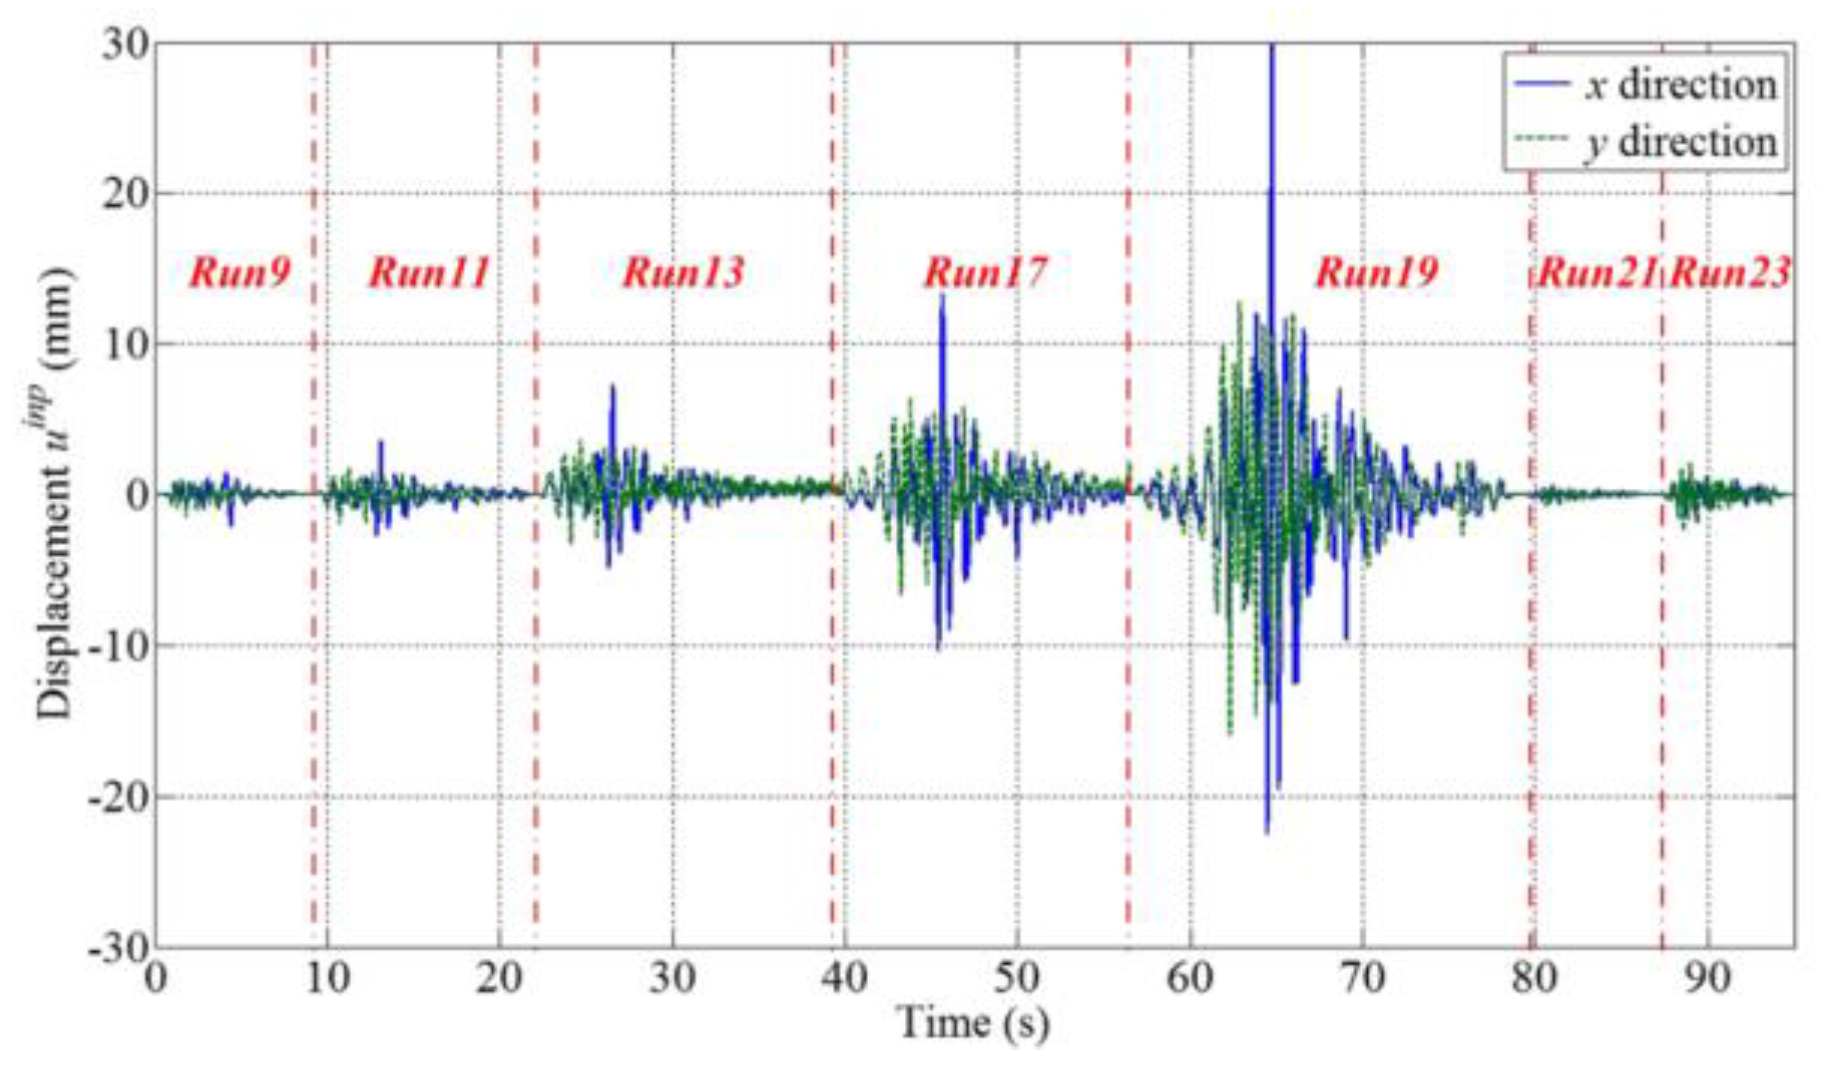
Figure 22.
High-intensity ground motions for a nonlinear seismic analysis of the SMART 2013 structure.
Figure 22.
High-intensity ground motions for a nonlinear seismic analysis of the SMART 2013 structure.
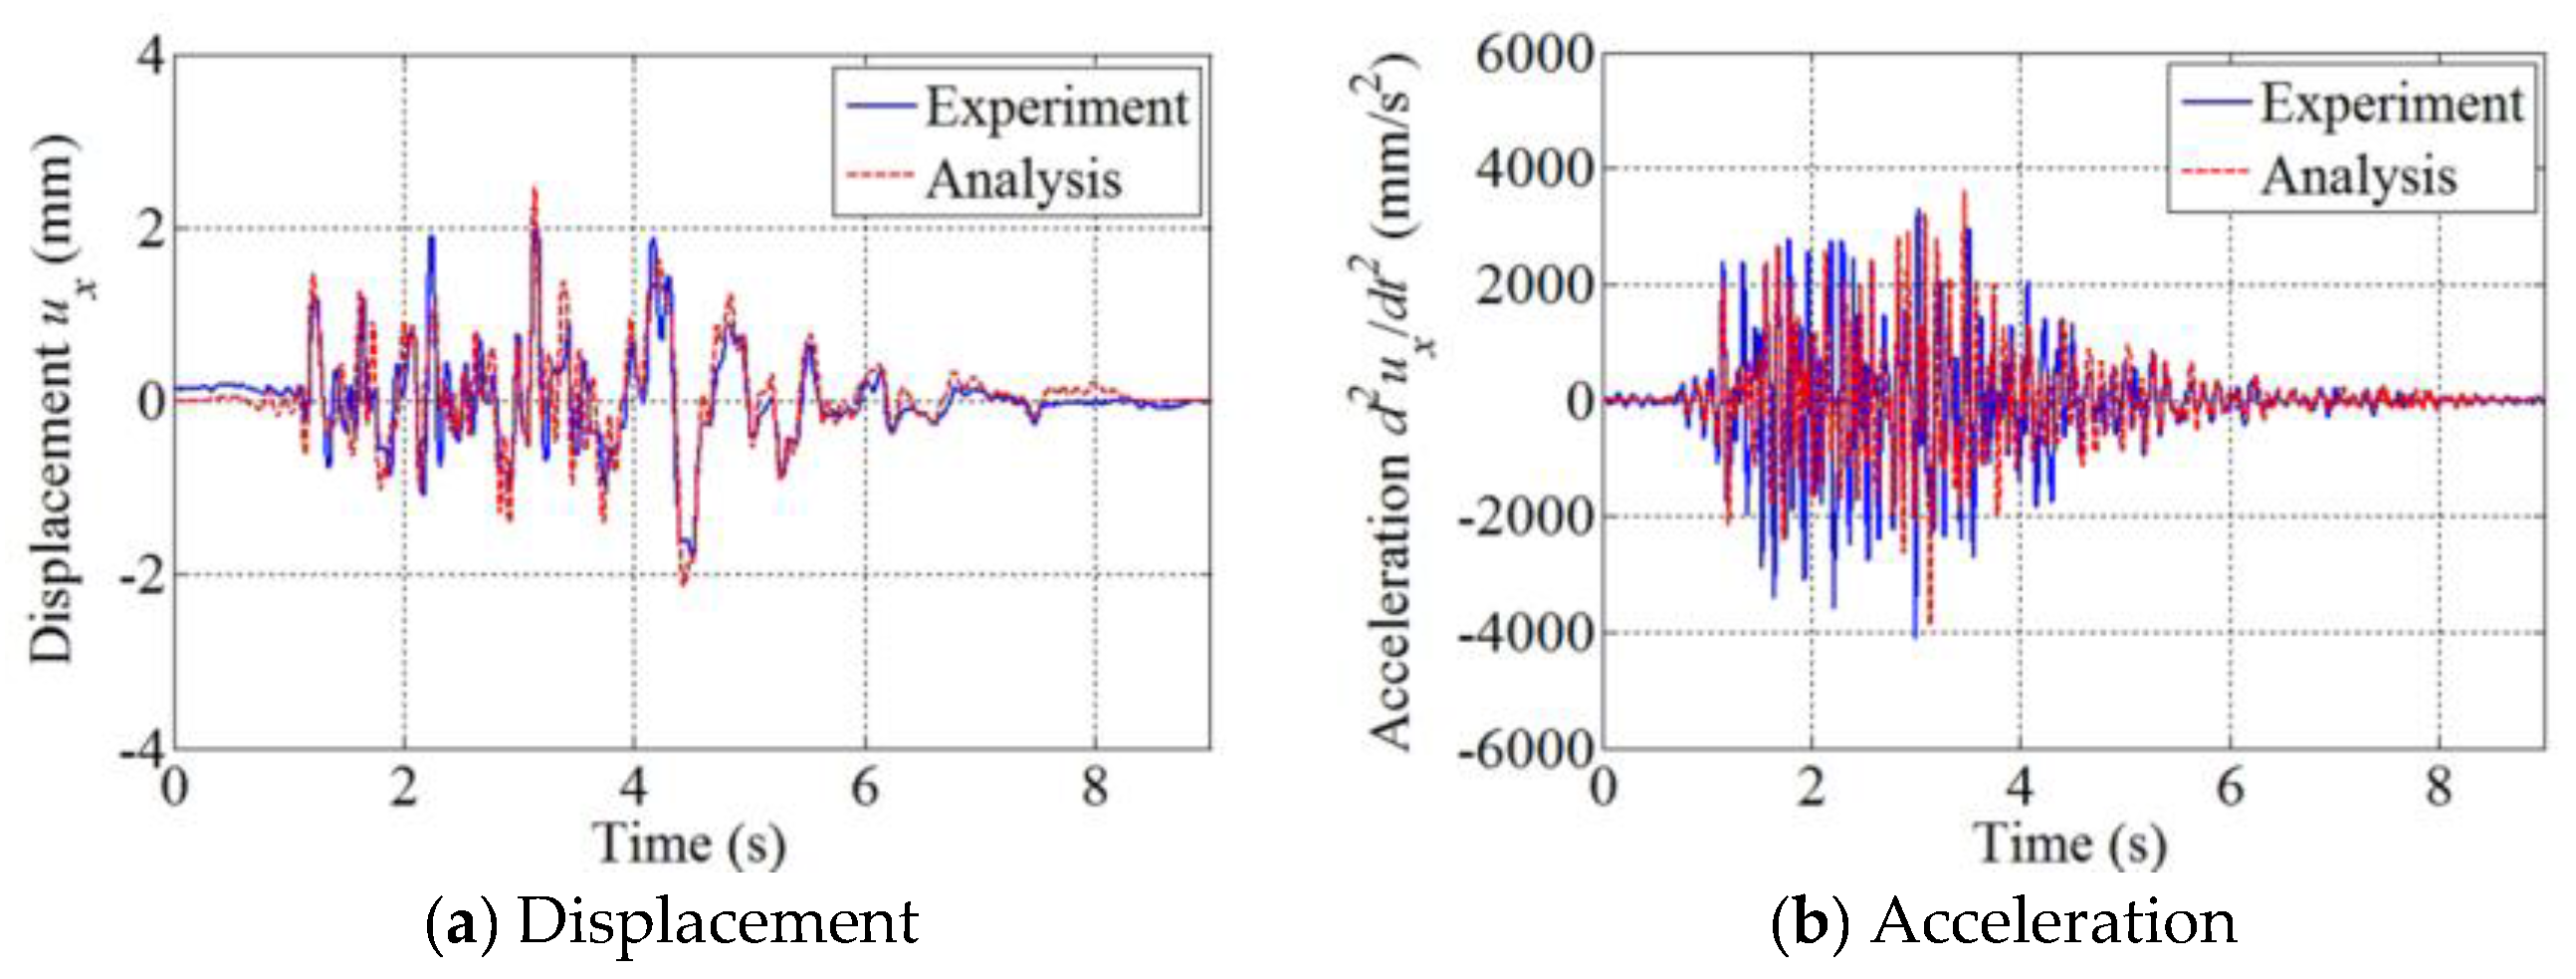
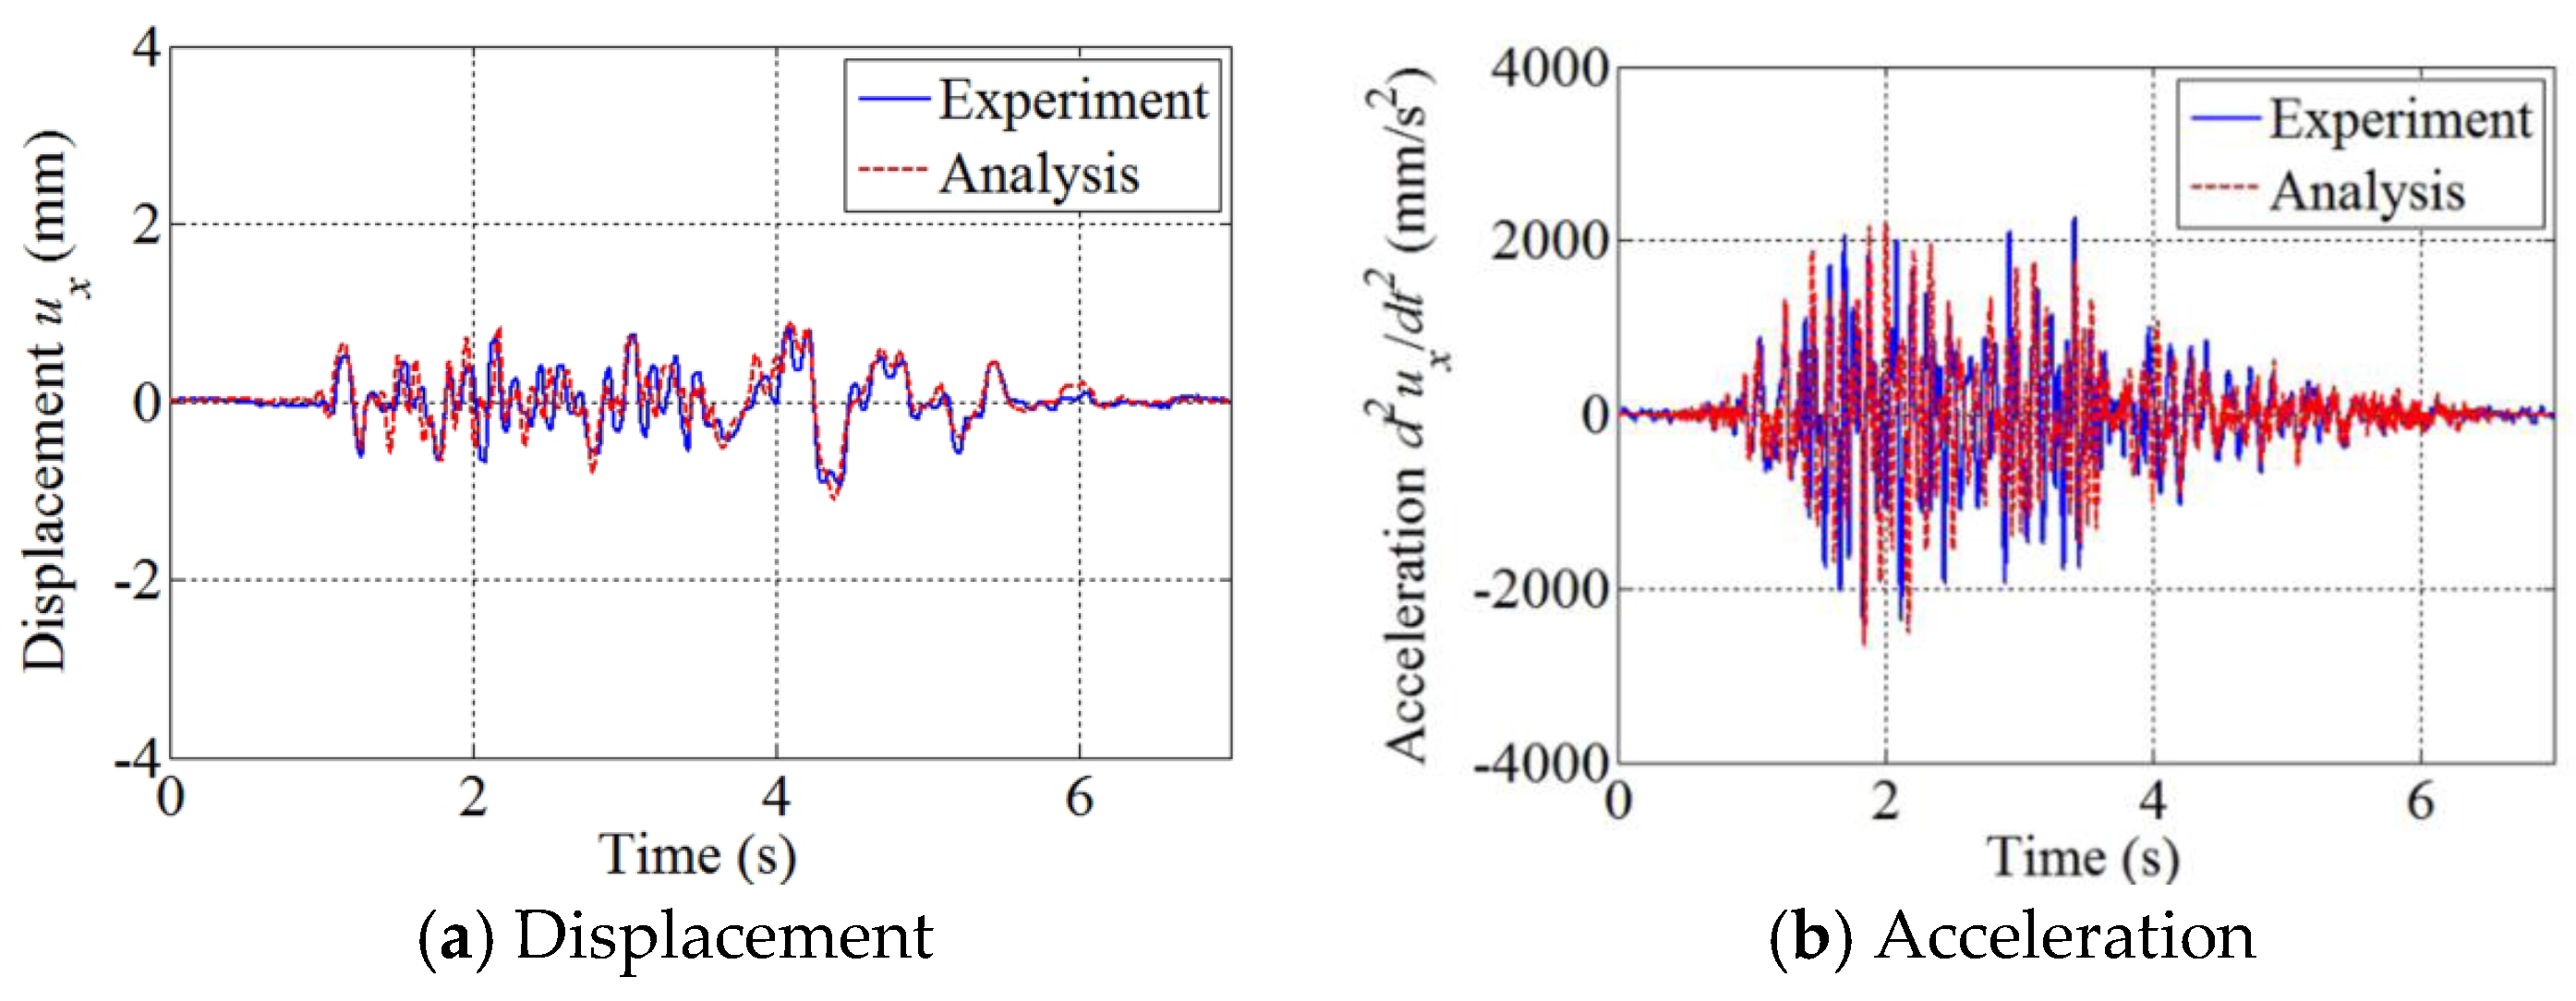
Figure 23.
Numerical and experimental responses in the x direction due to the ground motion of Run 9; responses sampled at point A on the third floor.
Figure 23.
Numerical and experimental responses in the x direction due to the ground motion of Run 9; responses sampled at point A on the third floor.
Figure 24.
Numerical and experimental responses in the x direction due to the scaled Northridge earthquake of Run 11; responses sampled at point A on the third floor.
Figure 24.
Numerical and experimental responses in the x direction due to the scaled Northridge earthquake of Run 11; responses sampled at point A on the third floor.
Figure 25.
Numerical and experimental responses in the x direction due to the scaled Northridge earthquake of Run 13; responses sampled at point A on the third floor.
Figure 25.
Numerical and experimental responses in the x direction due to the scaled Northridge earthquake of Run 13; responses sampled at point A on the third floor.
Figure 26.
Numerical and experimental responses in the x direction due to the scaled Northridge earthquake of Run 17; responses sampled at point A on the third floor.
Figure 26.
Numerical and experimental responses in the x direction due to the scaled Northridge earthquake of Run 17; responses sampled at point A on the third floor.
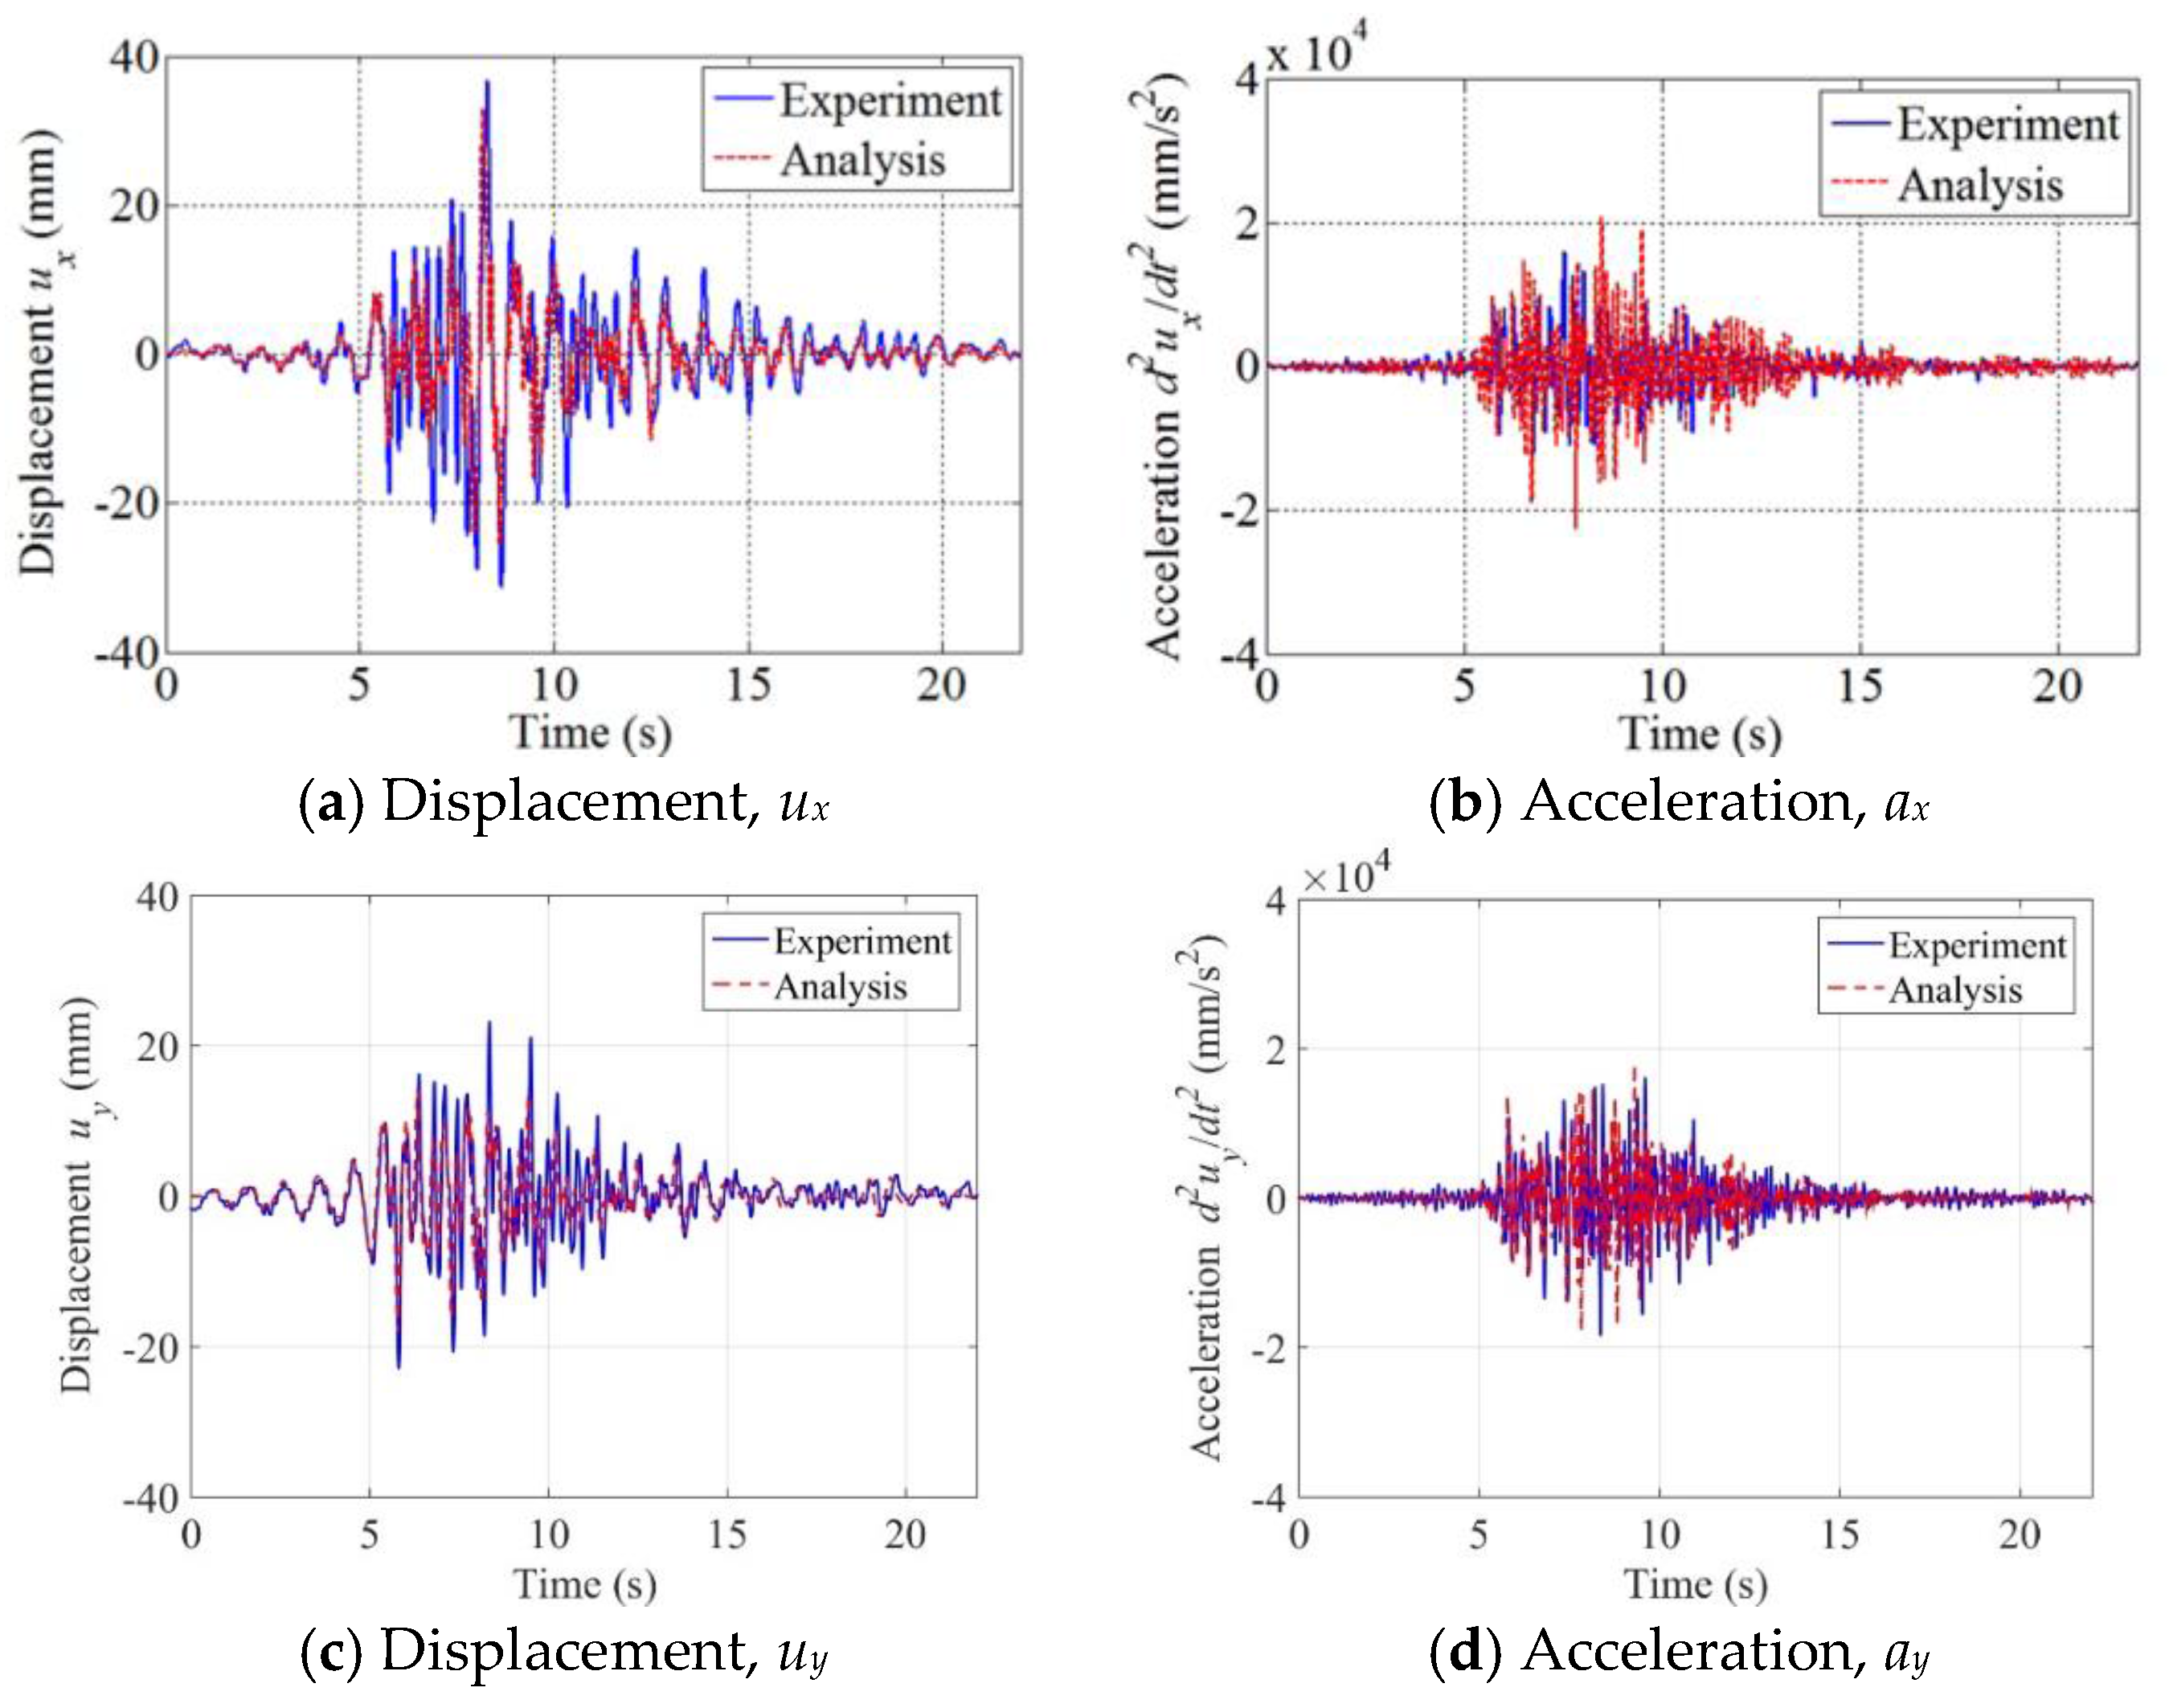
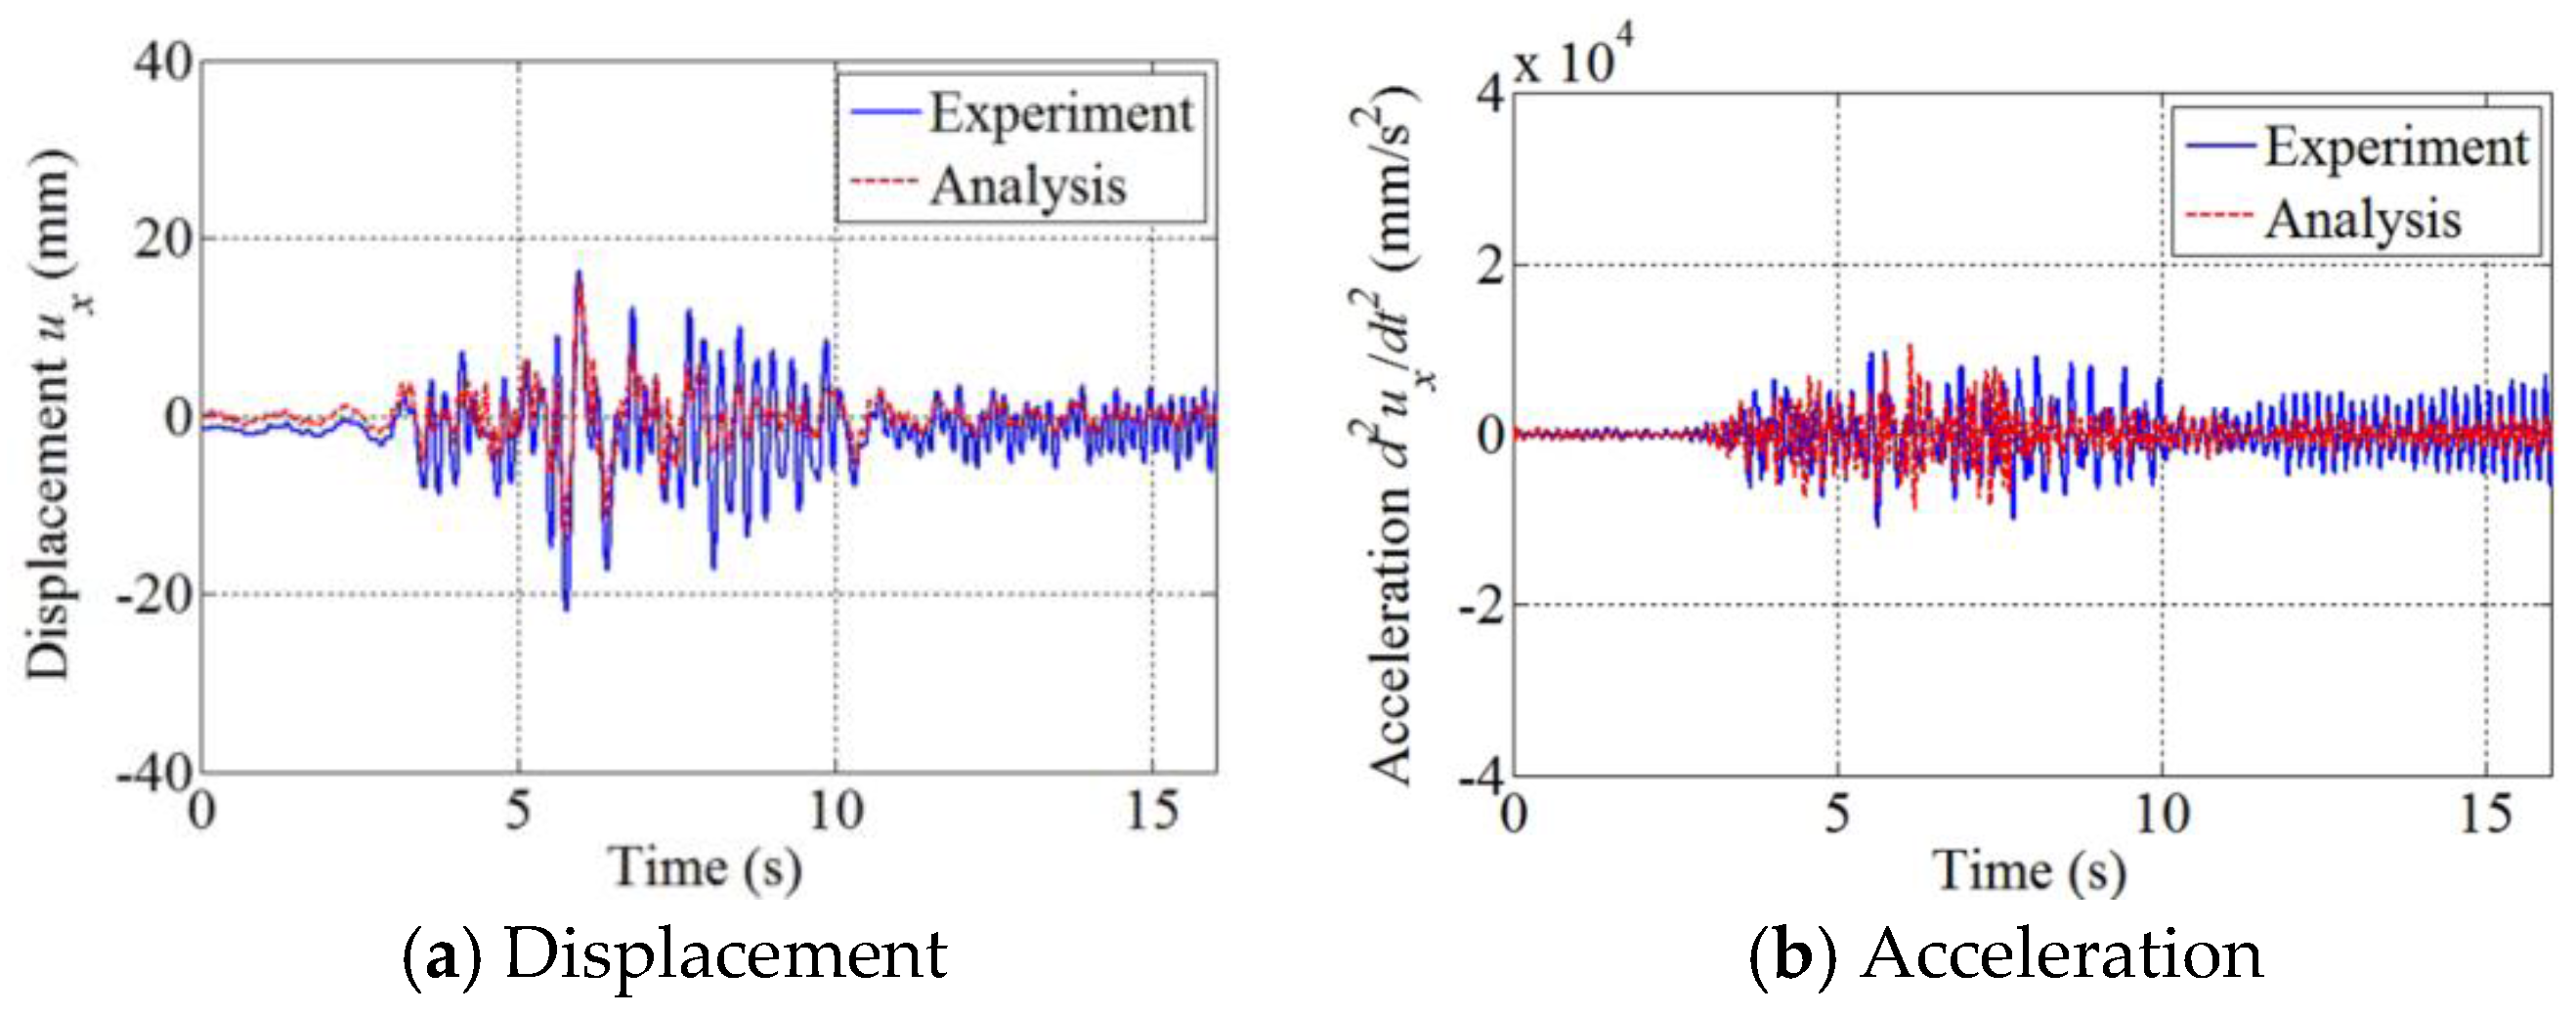
Figure 27.
Numerical and experimental responses due to real Northridge earthquake of Run 19; responses sampled at point A on the third floor.
Figure 27.
Numerical and experimental responses due to real Northridge earthquake of Run 19; responses sampled at point A on the third floor.
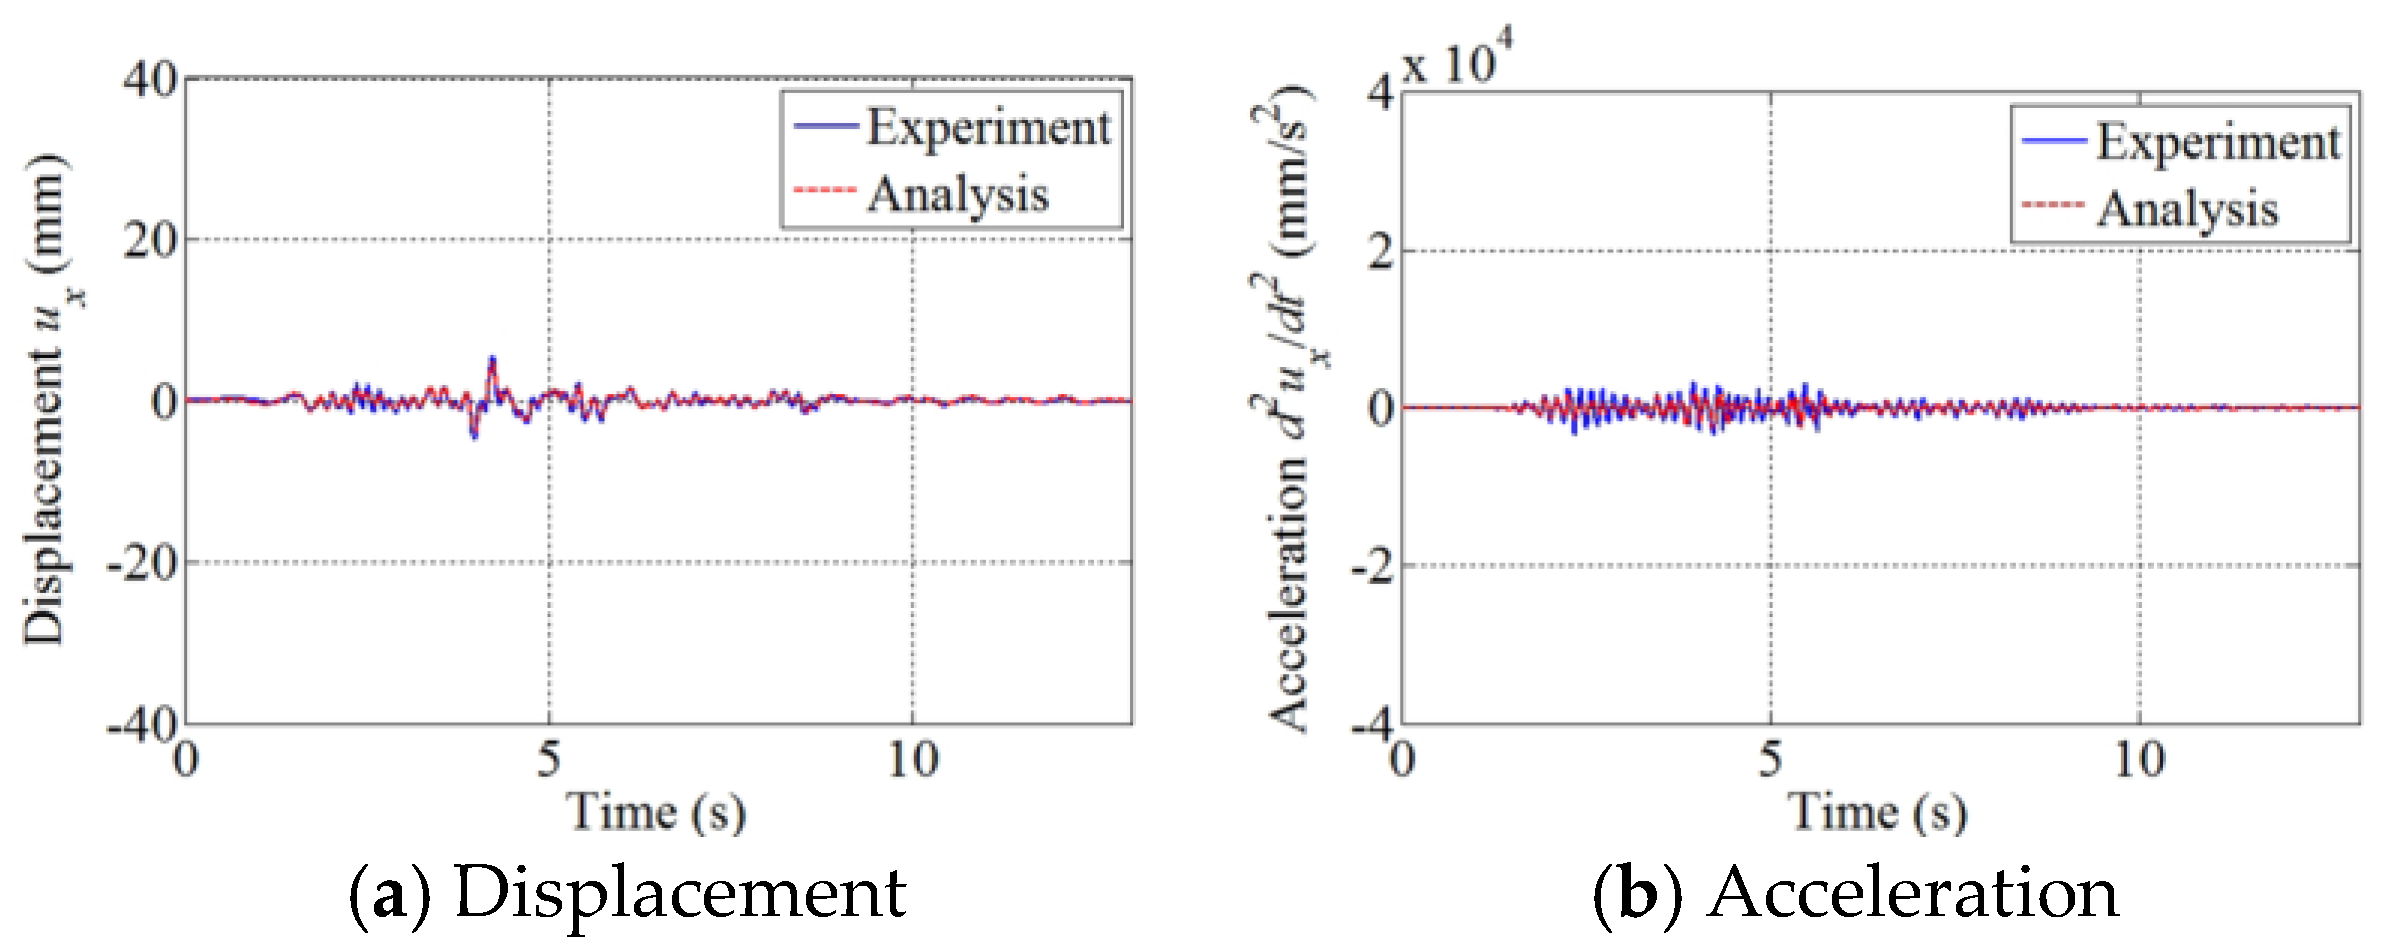
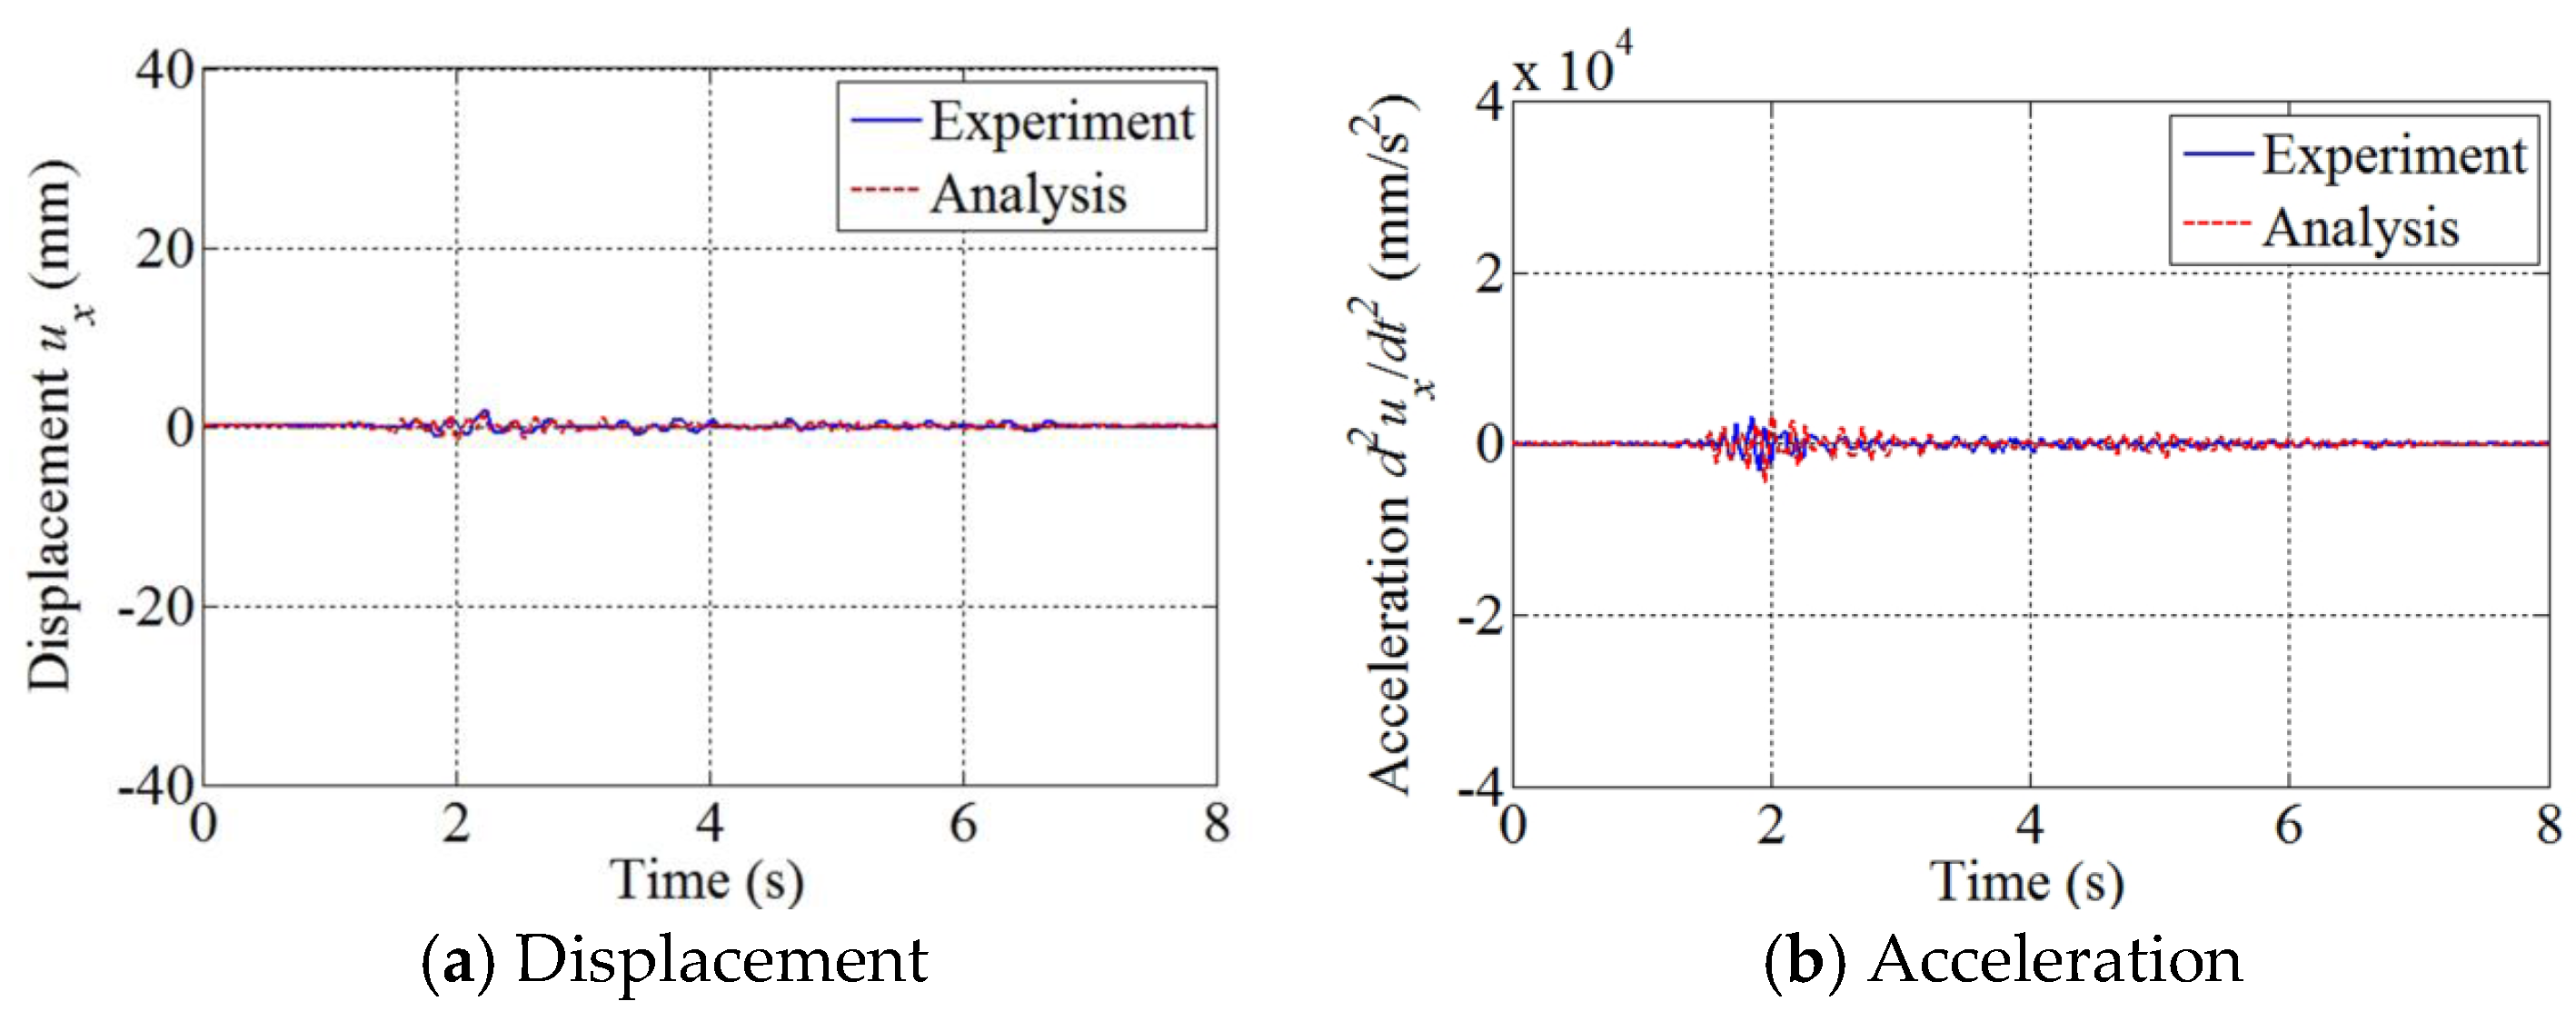
Figure 28.
Numerical and experimental responses in the x direction due to the scaled Northridge aftershock of Run 21; responses sampled at point A on the third floor.
Figure 28.
Numerical and experimental responses in the x direction due to the scaled Northridge aftershock of Run 21; responses sampled at point A on the third floor.
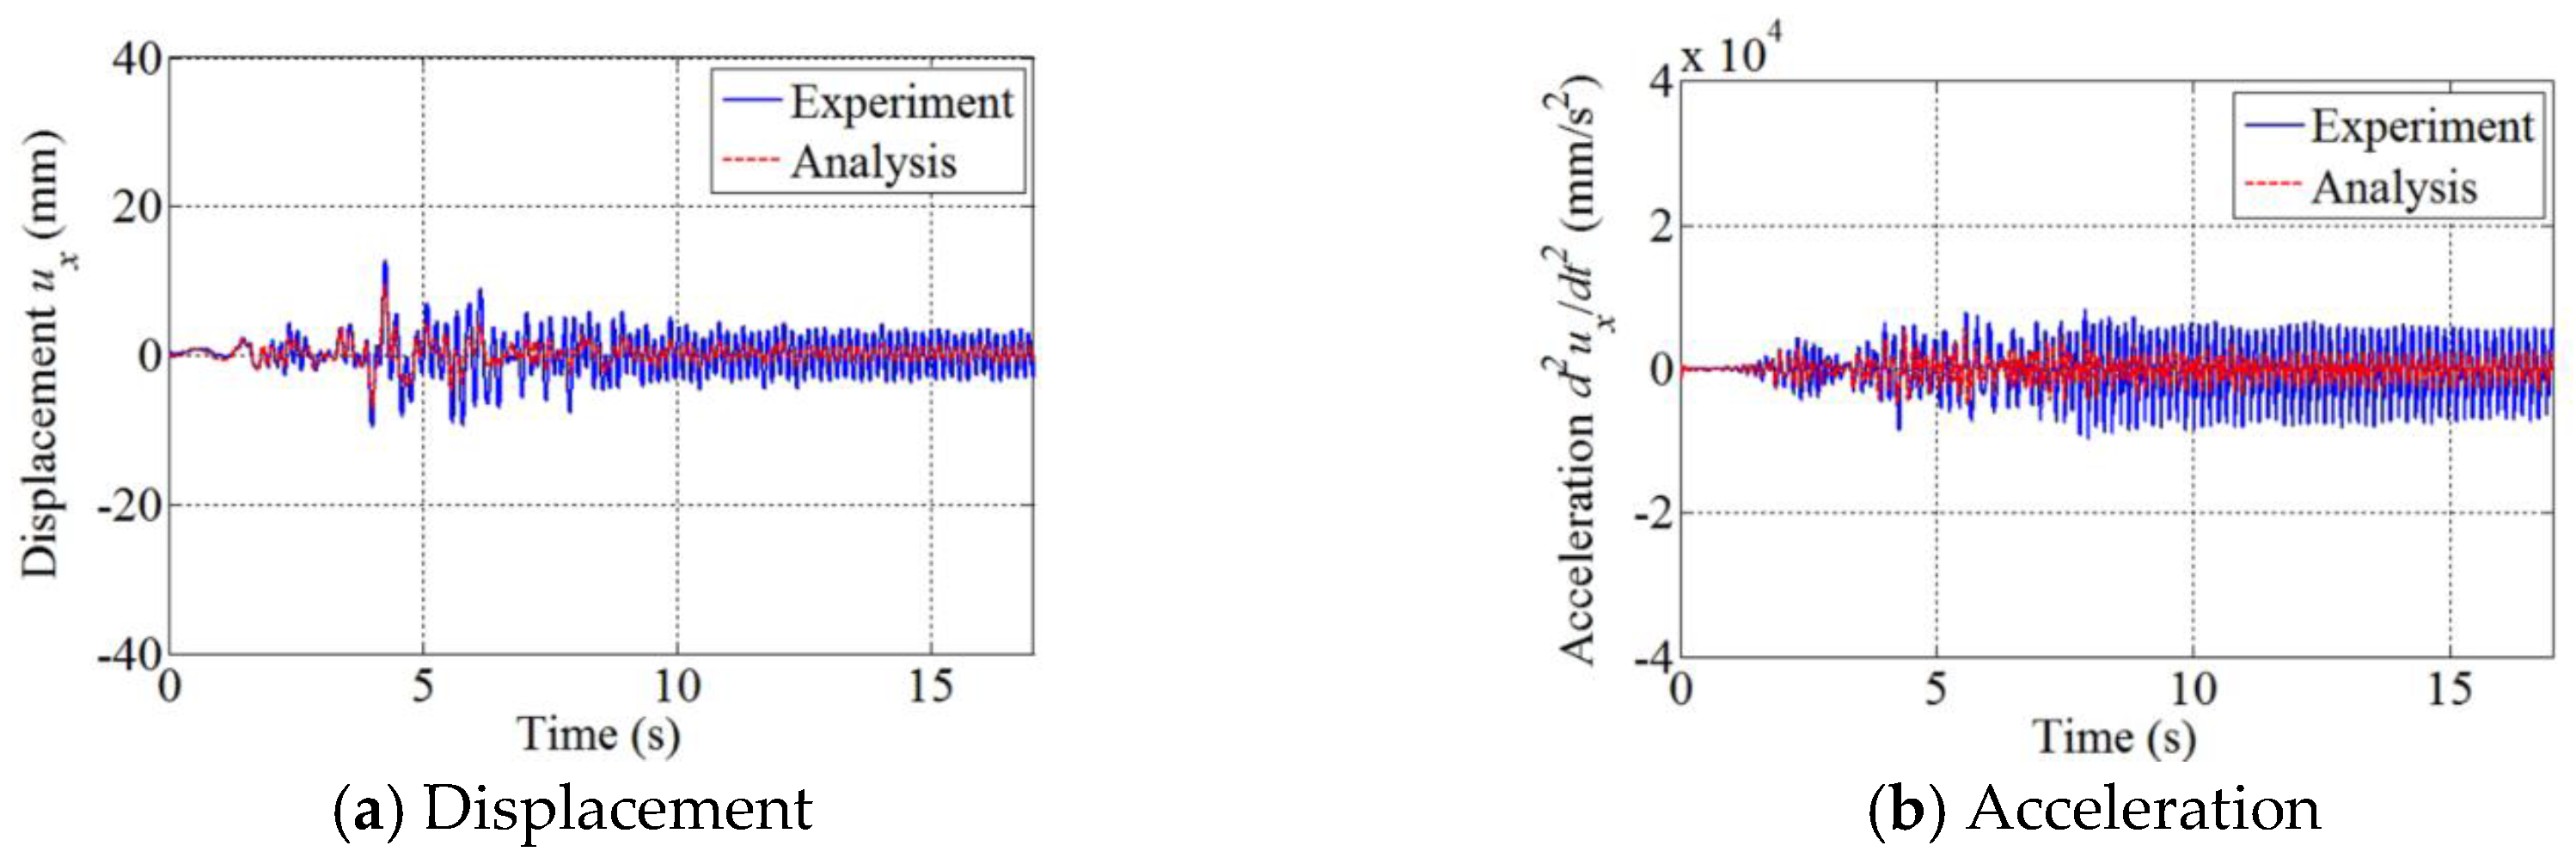
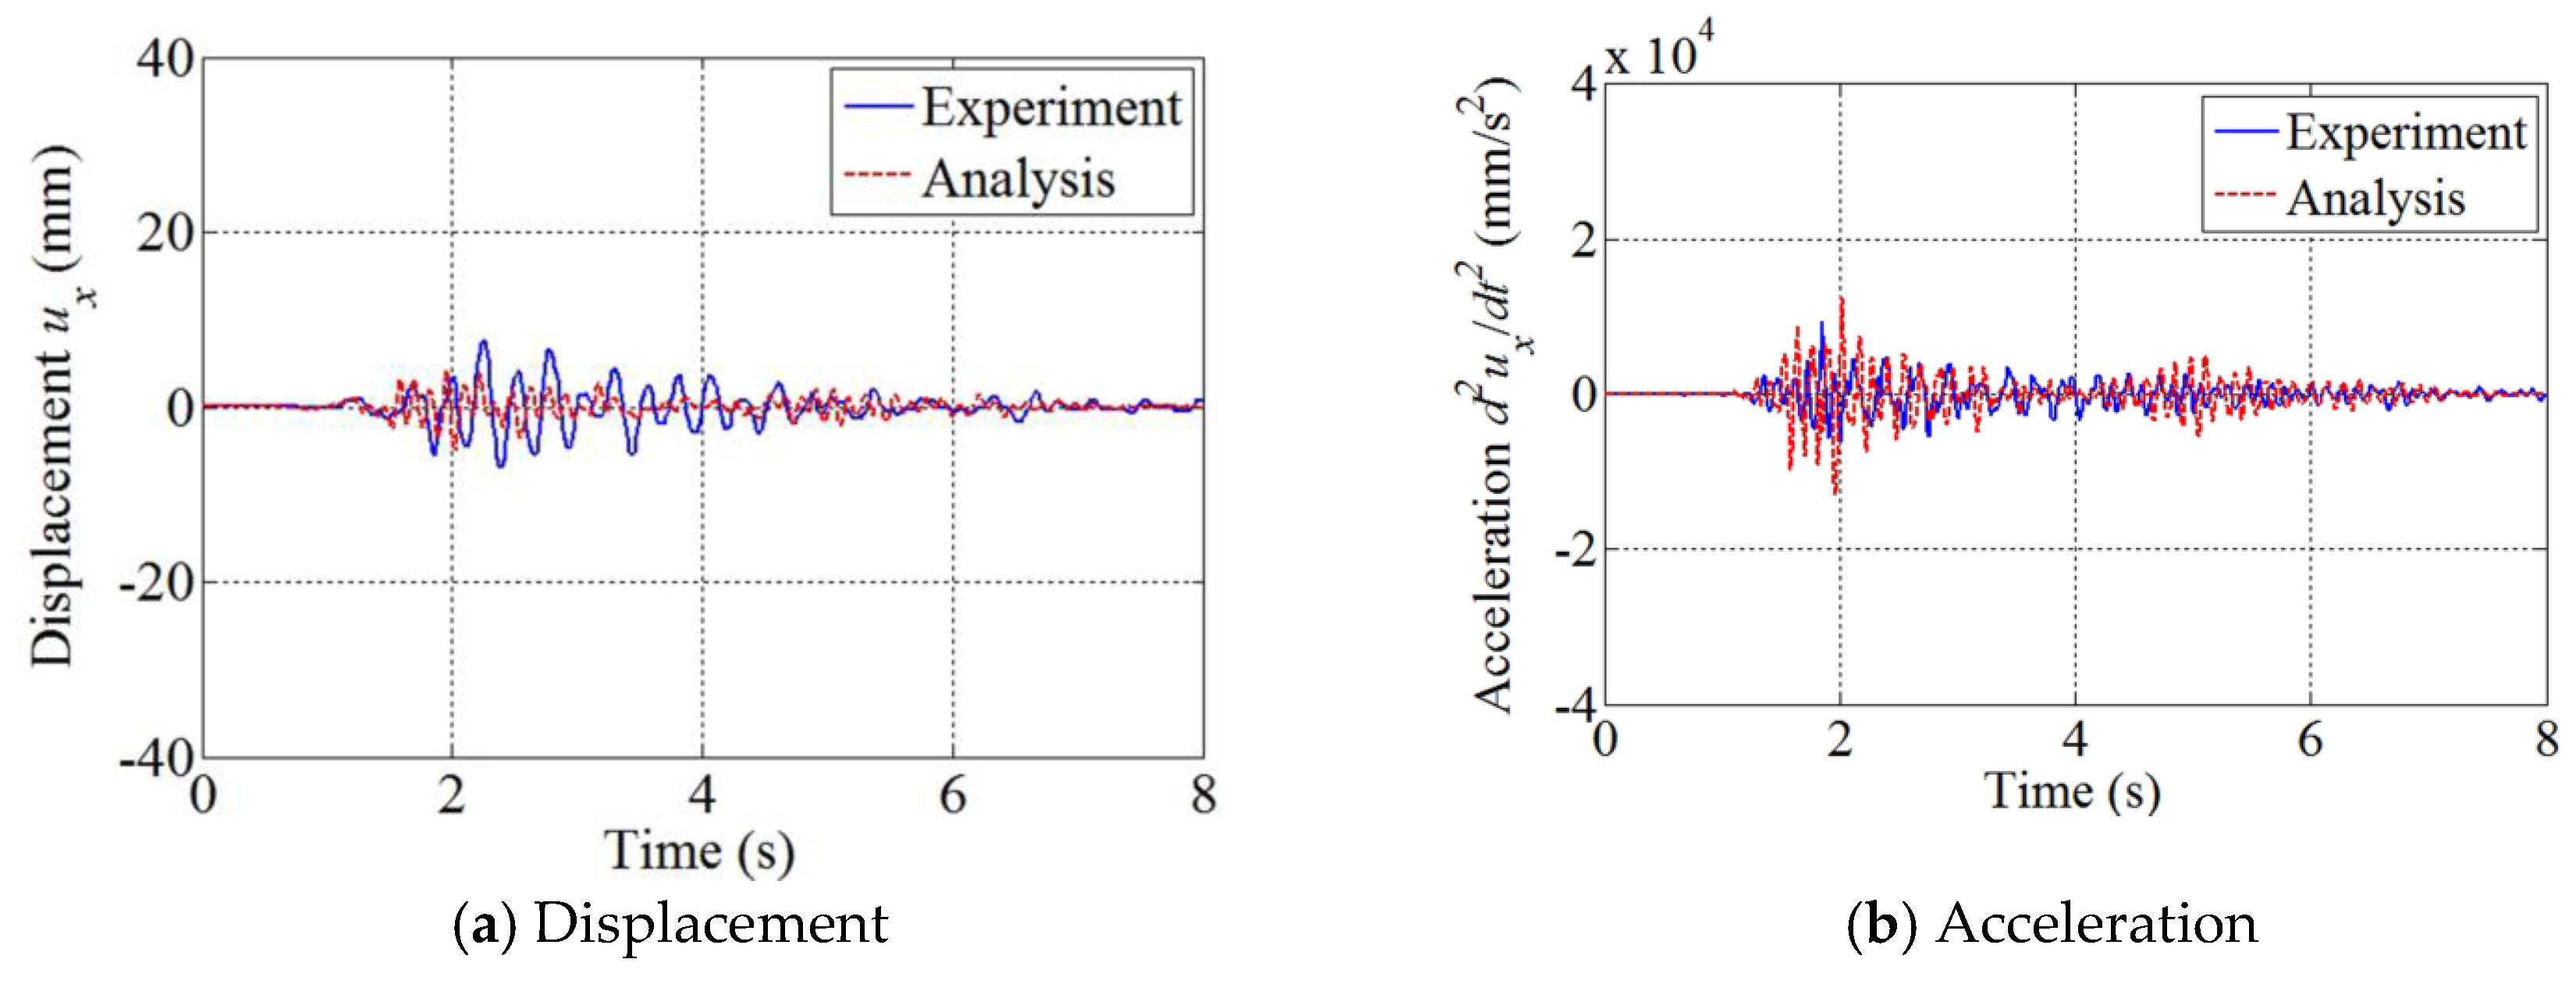
Figure 29.
Numerical and experimental responses in the x direction due to real Northridge aftershock of Run 23; responses sampled at point A on the third floor.
Figure 29.
Numerical and experimental responses in the x direction due to real Northridge aftershock of Run 23; responses sampled at point A on the third floor.
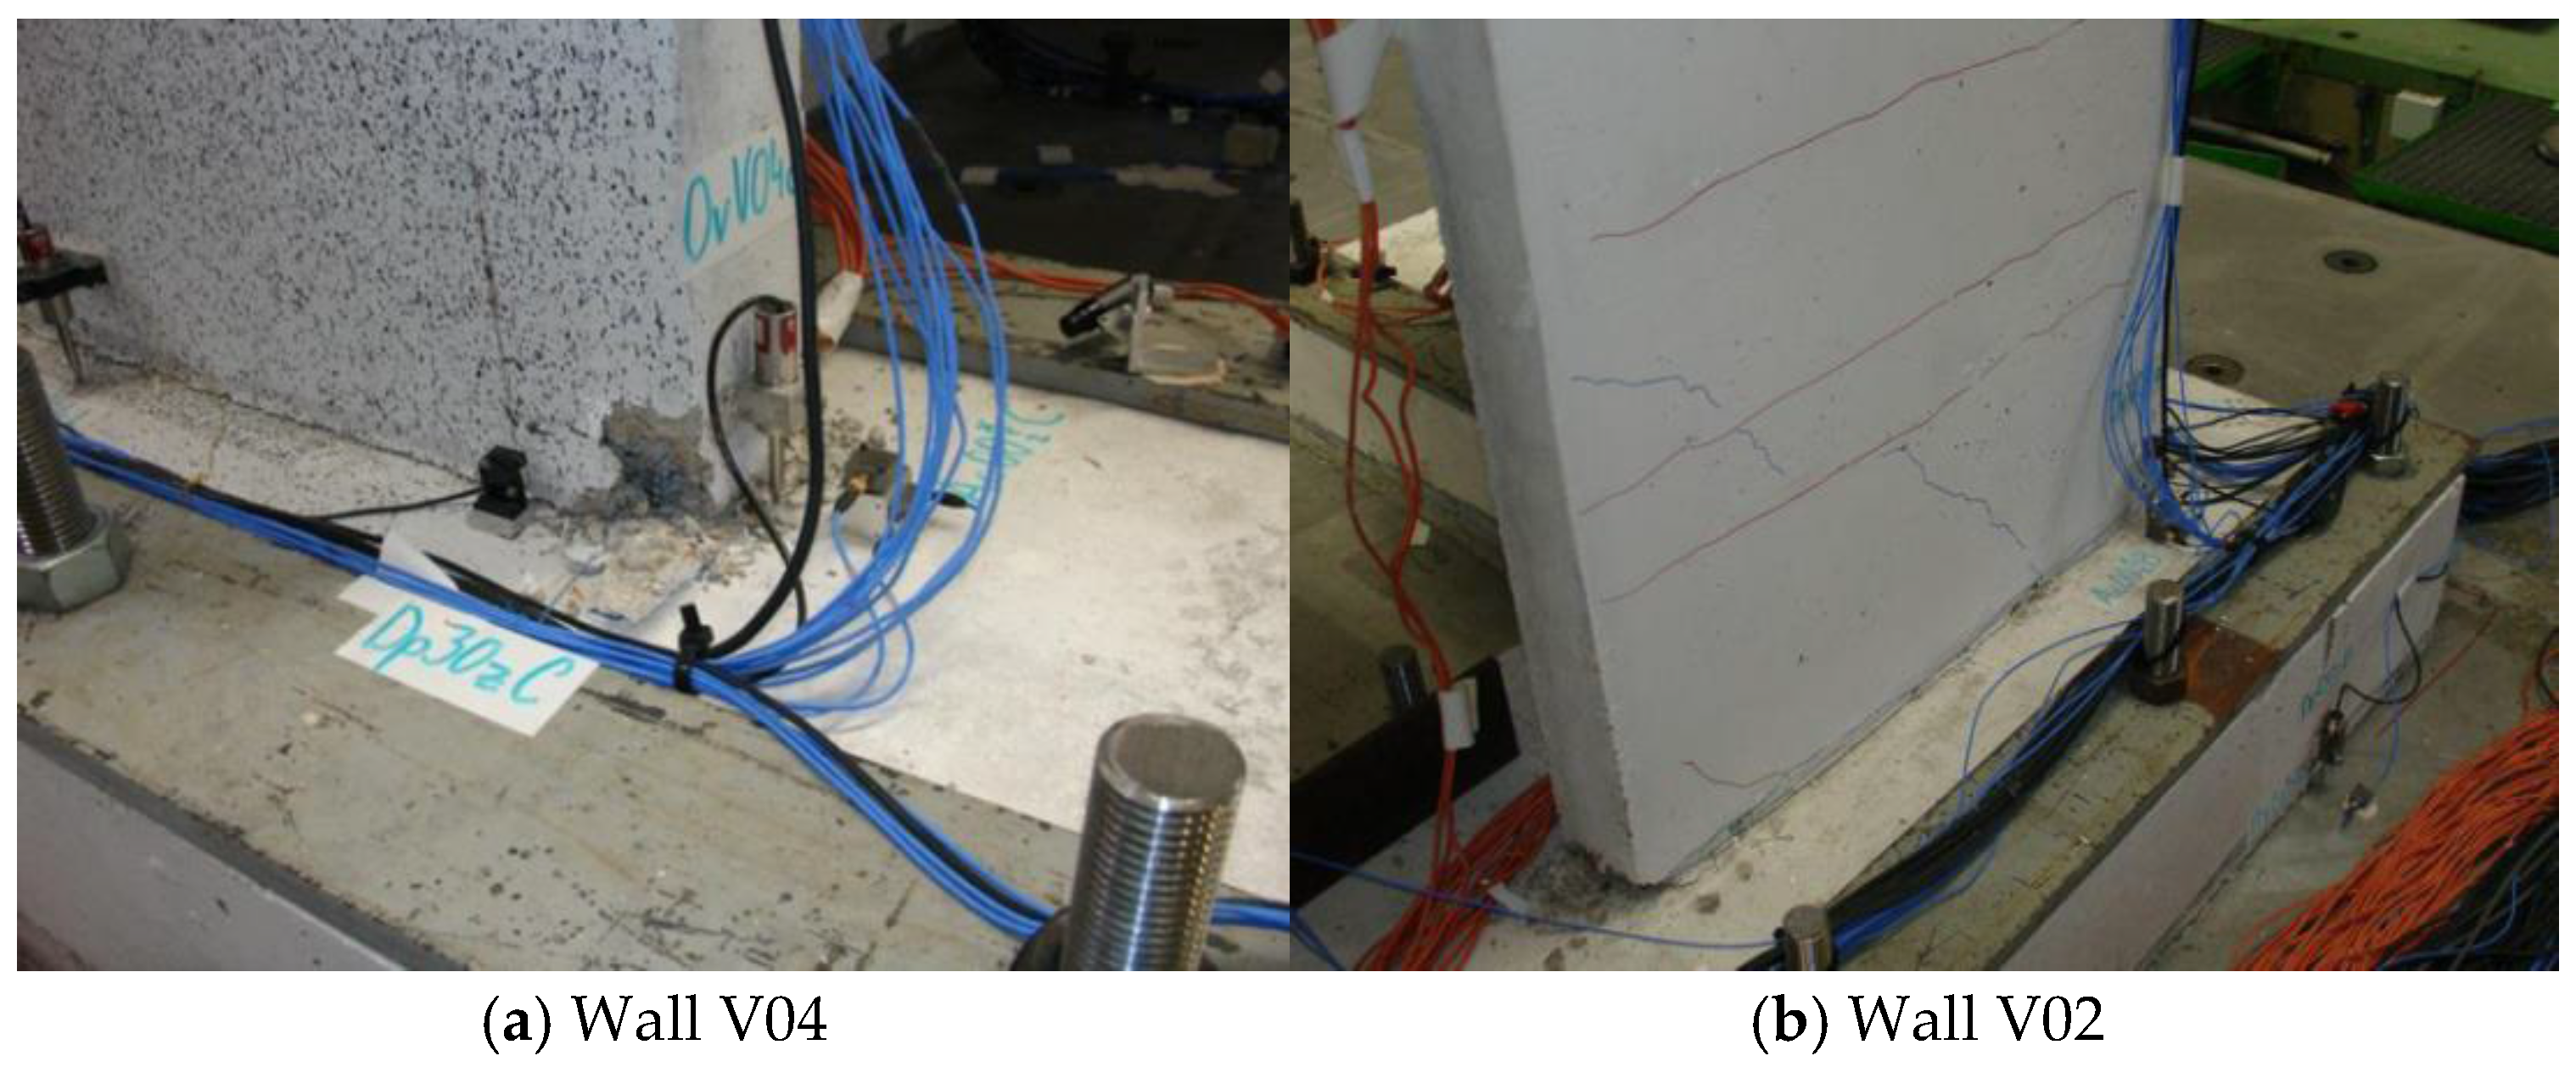
Figure 30.
Damages in the lower part of the concrete walls connected to the foundation [
23,
30].
Figure 30.
Damages in the lower part of the concrete walls connected to the foundation [
23,
30].
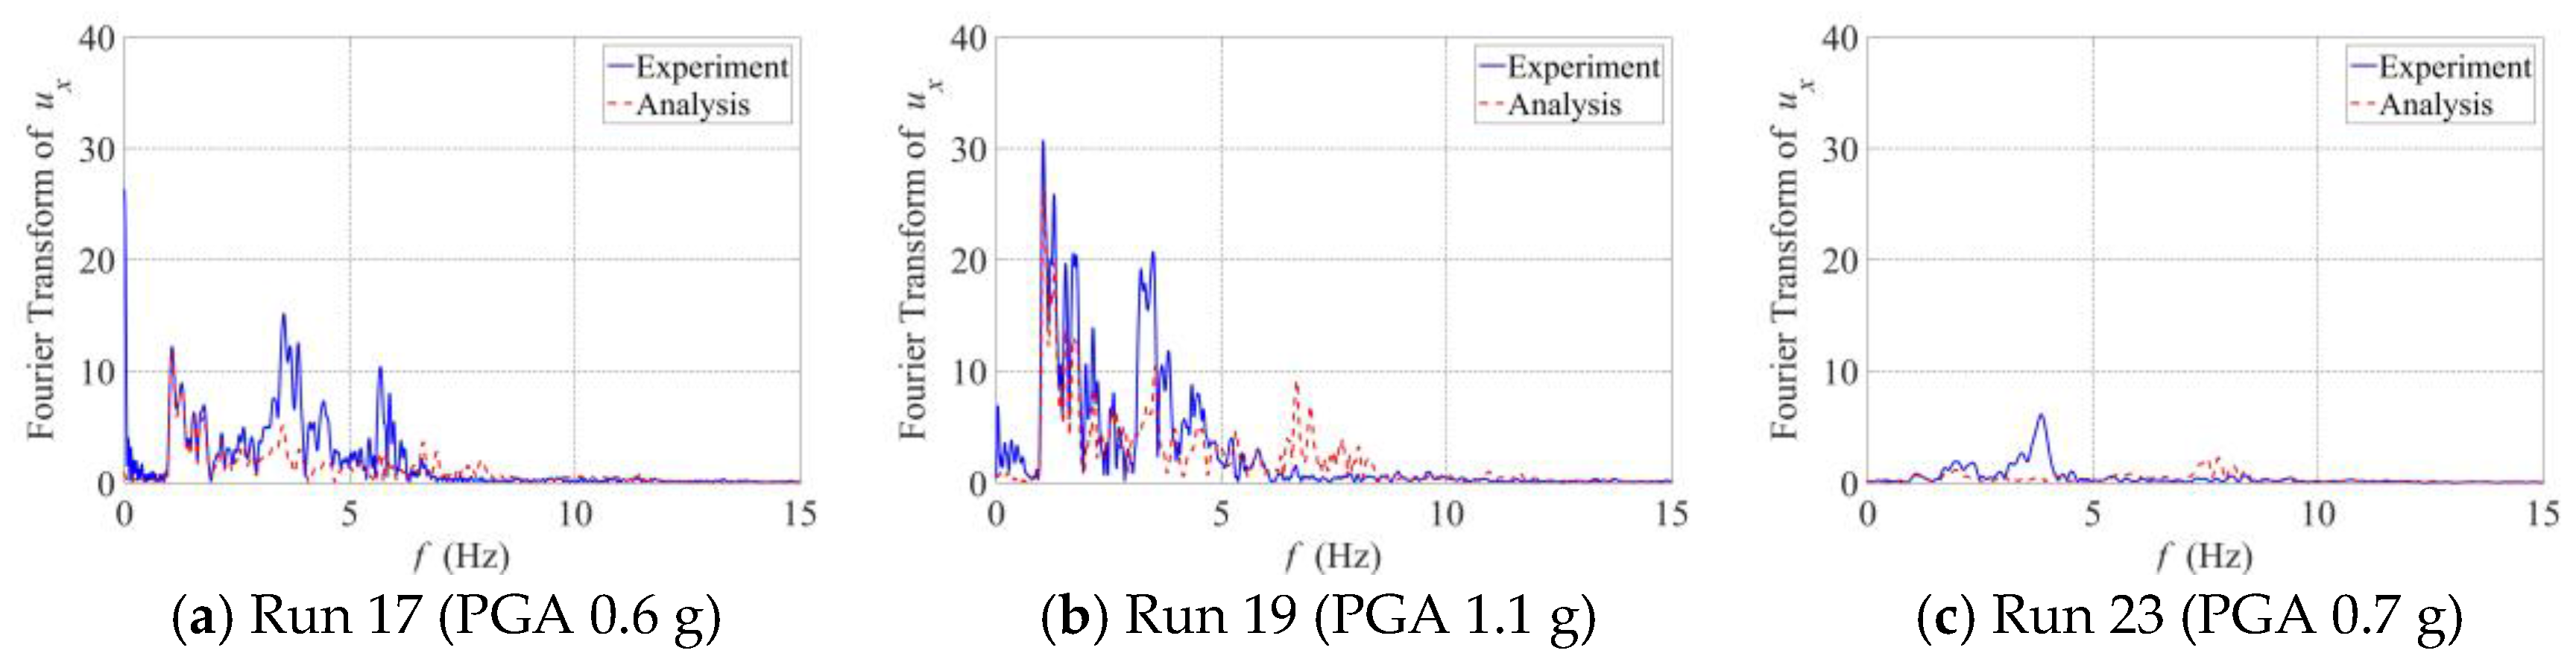
Figure 31.
Frequency spectrum of the x directional displacement at point A on the third floor.
Figure 31.
Frequency spectrum of the x directional displacement at point A on the third floor.
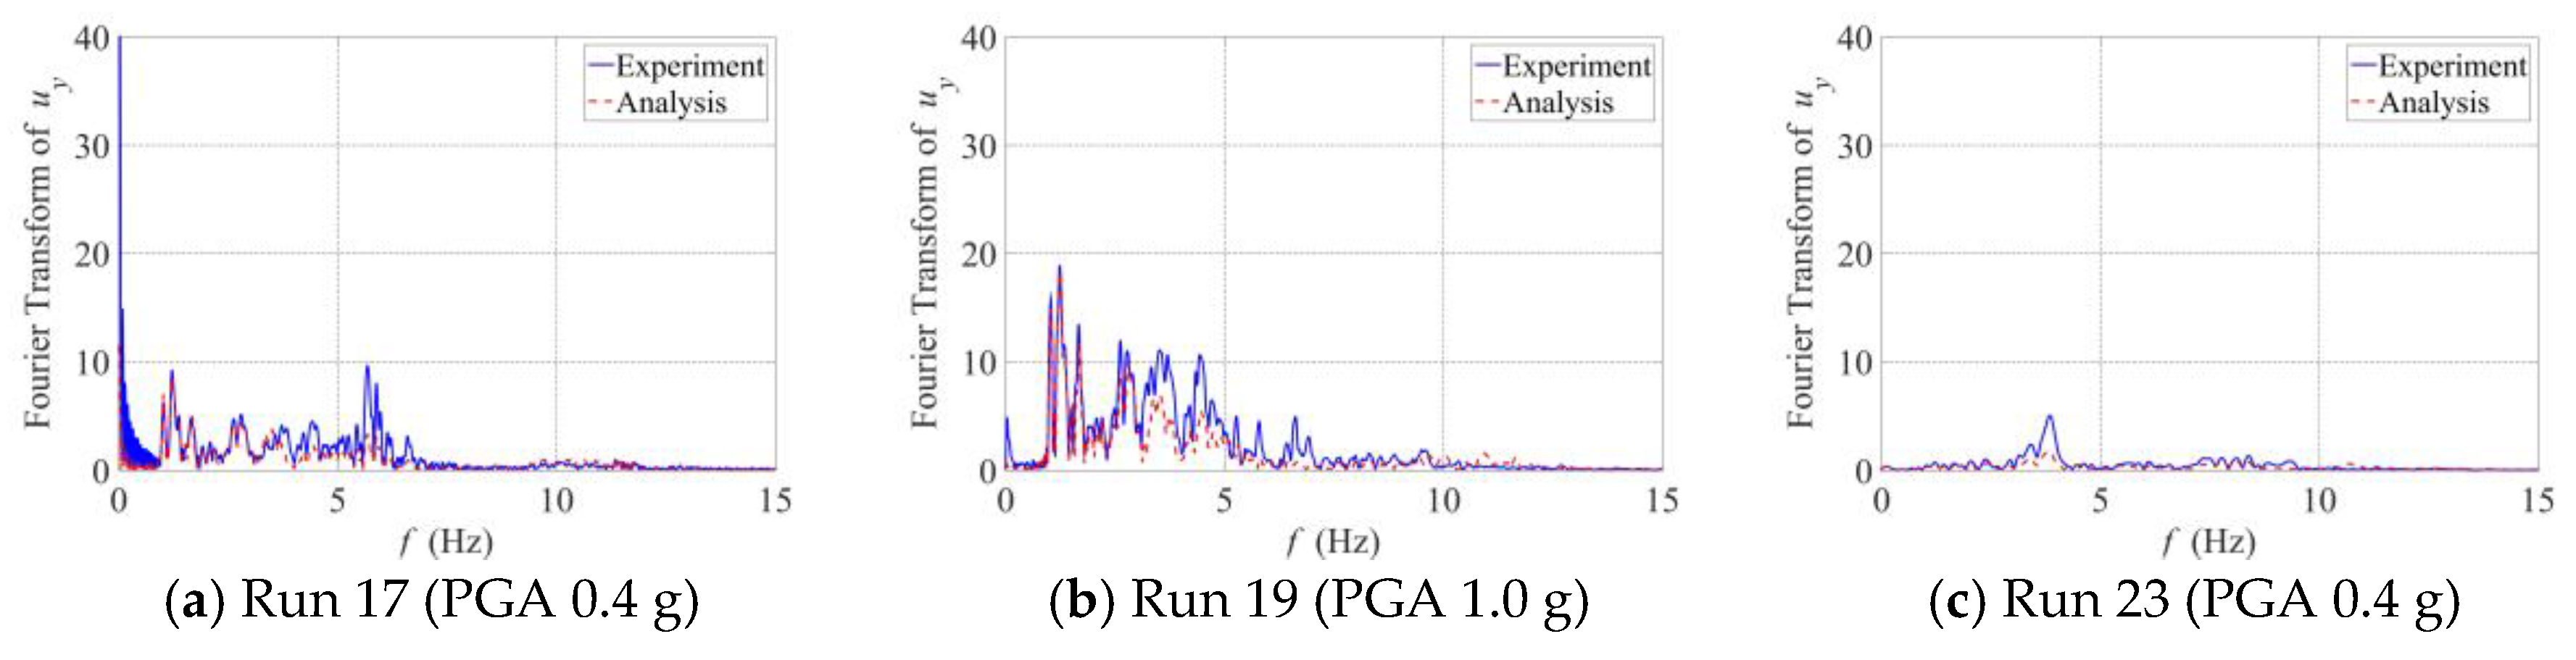
Figure 32.
Frequency spectrum of the y directional displacement at point A on the third floor.
Figure 32.
Frequency spectrum of the y directional displacement at point A on the third floor.
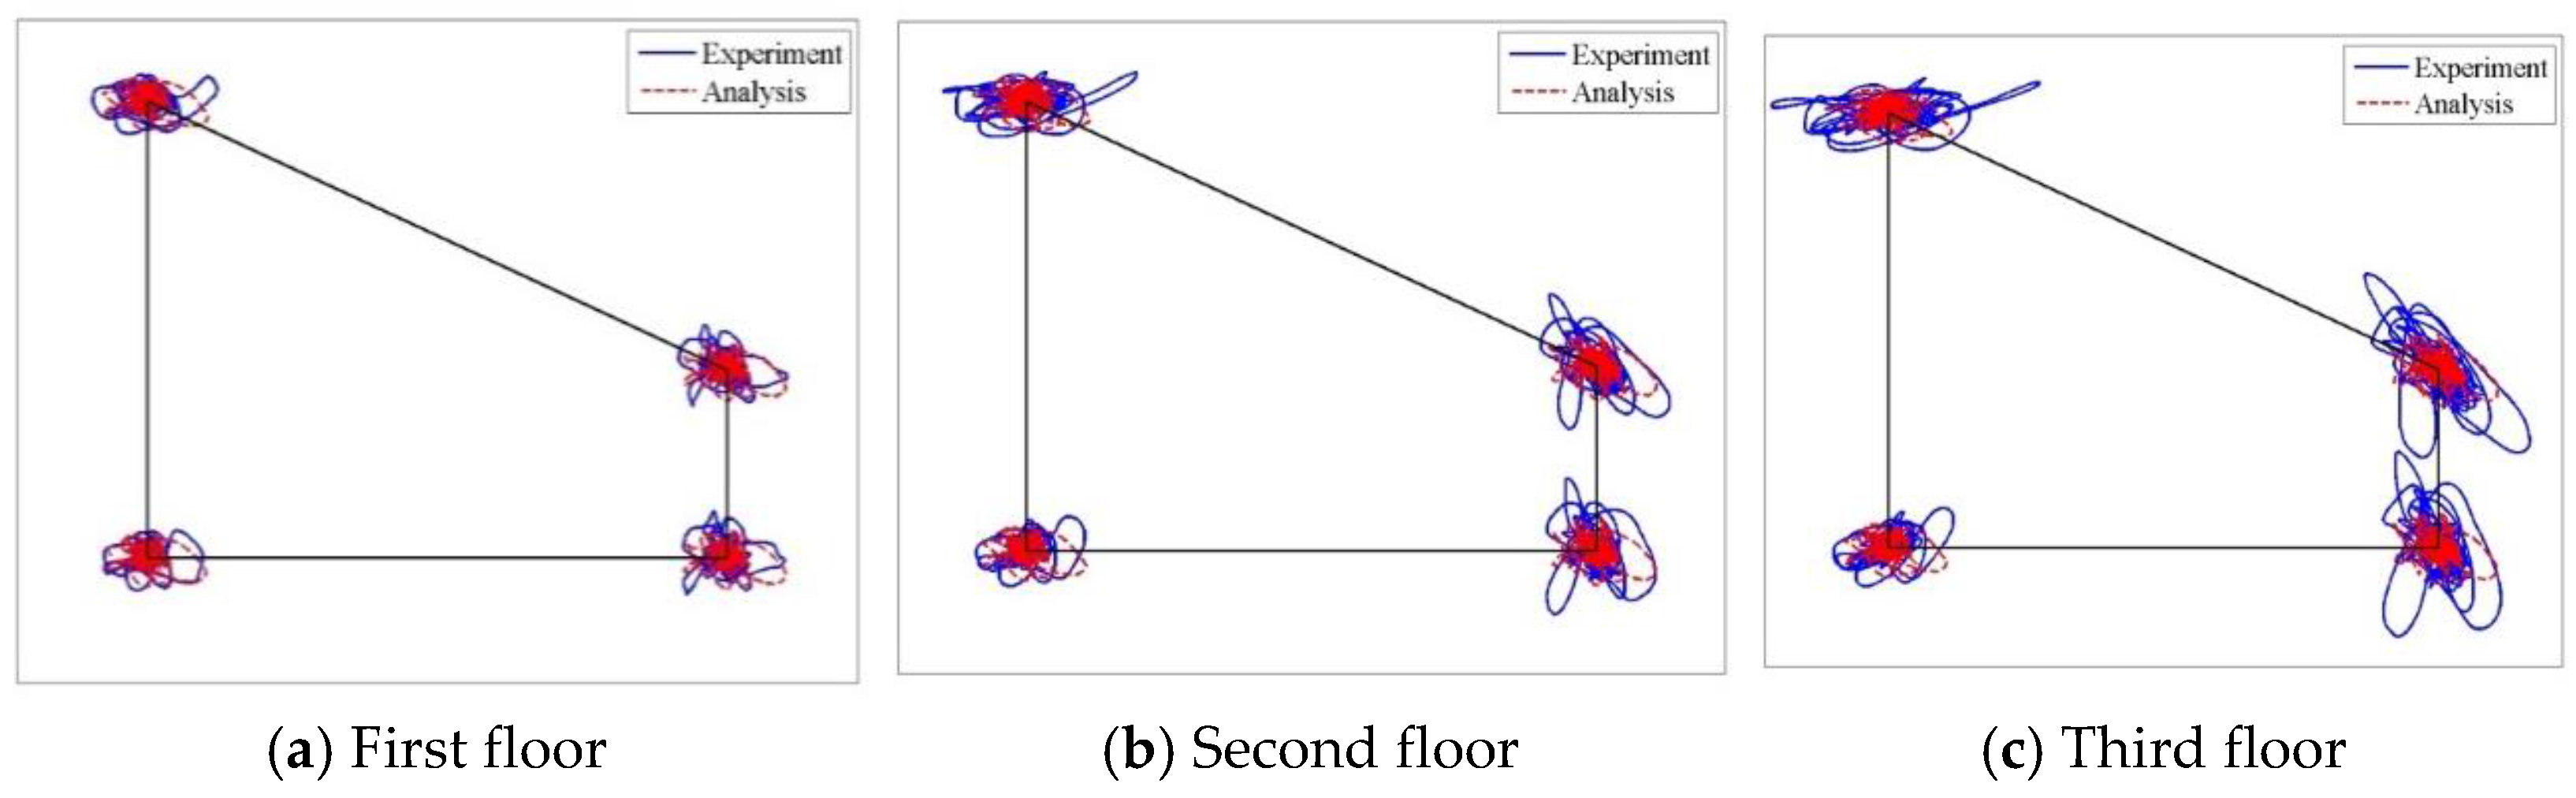
Figure 33.
Displacement trace at sampling points during the Northridge main shock of Run 19.
Figure 33.
Displacement trace at sampling points during the Northridge main shock of Run 19.
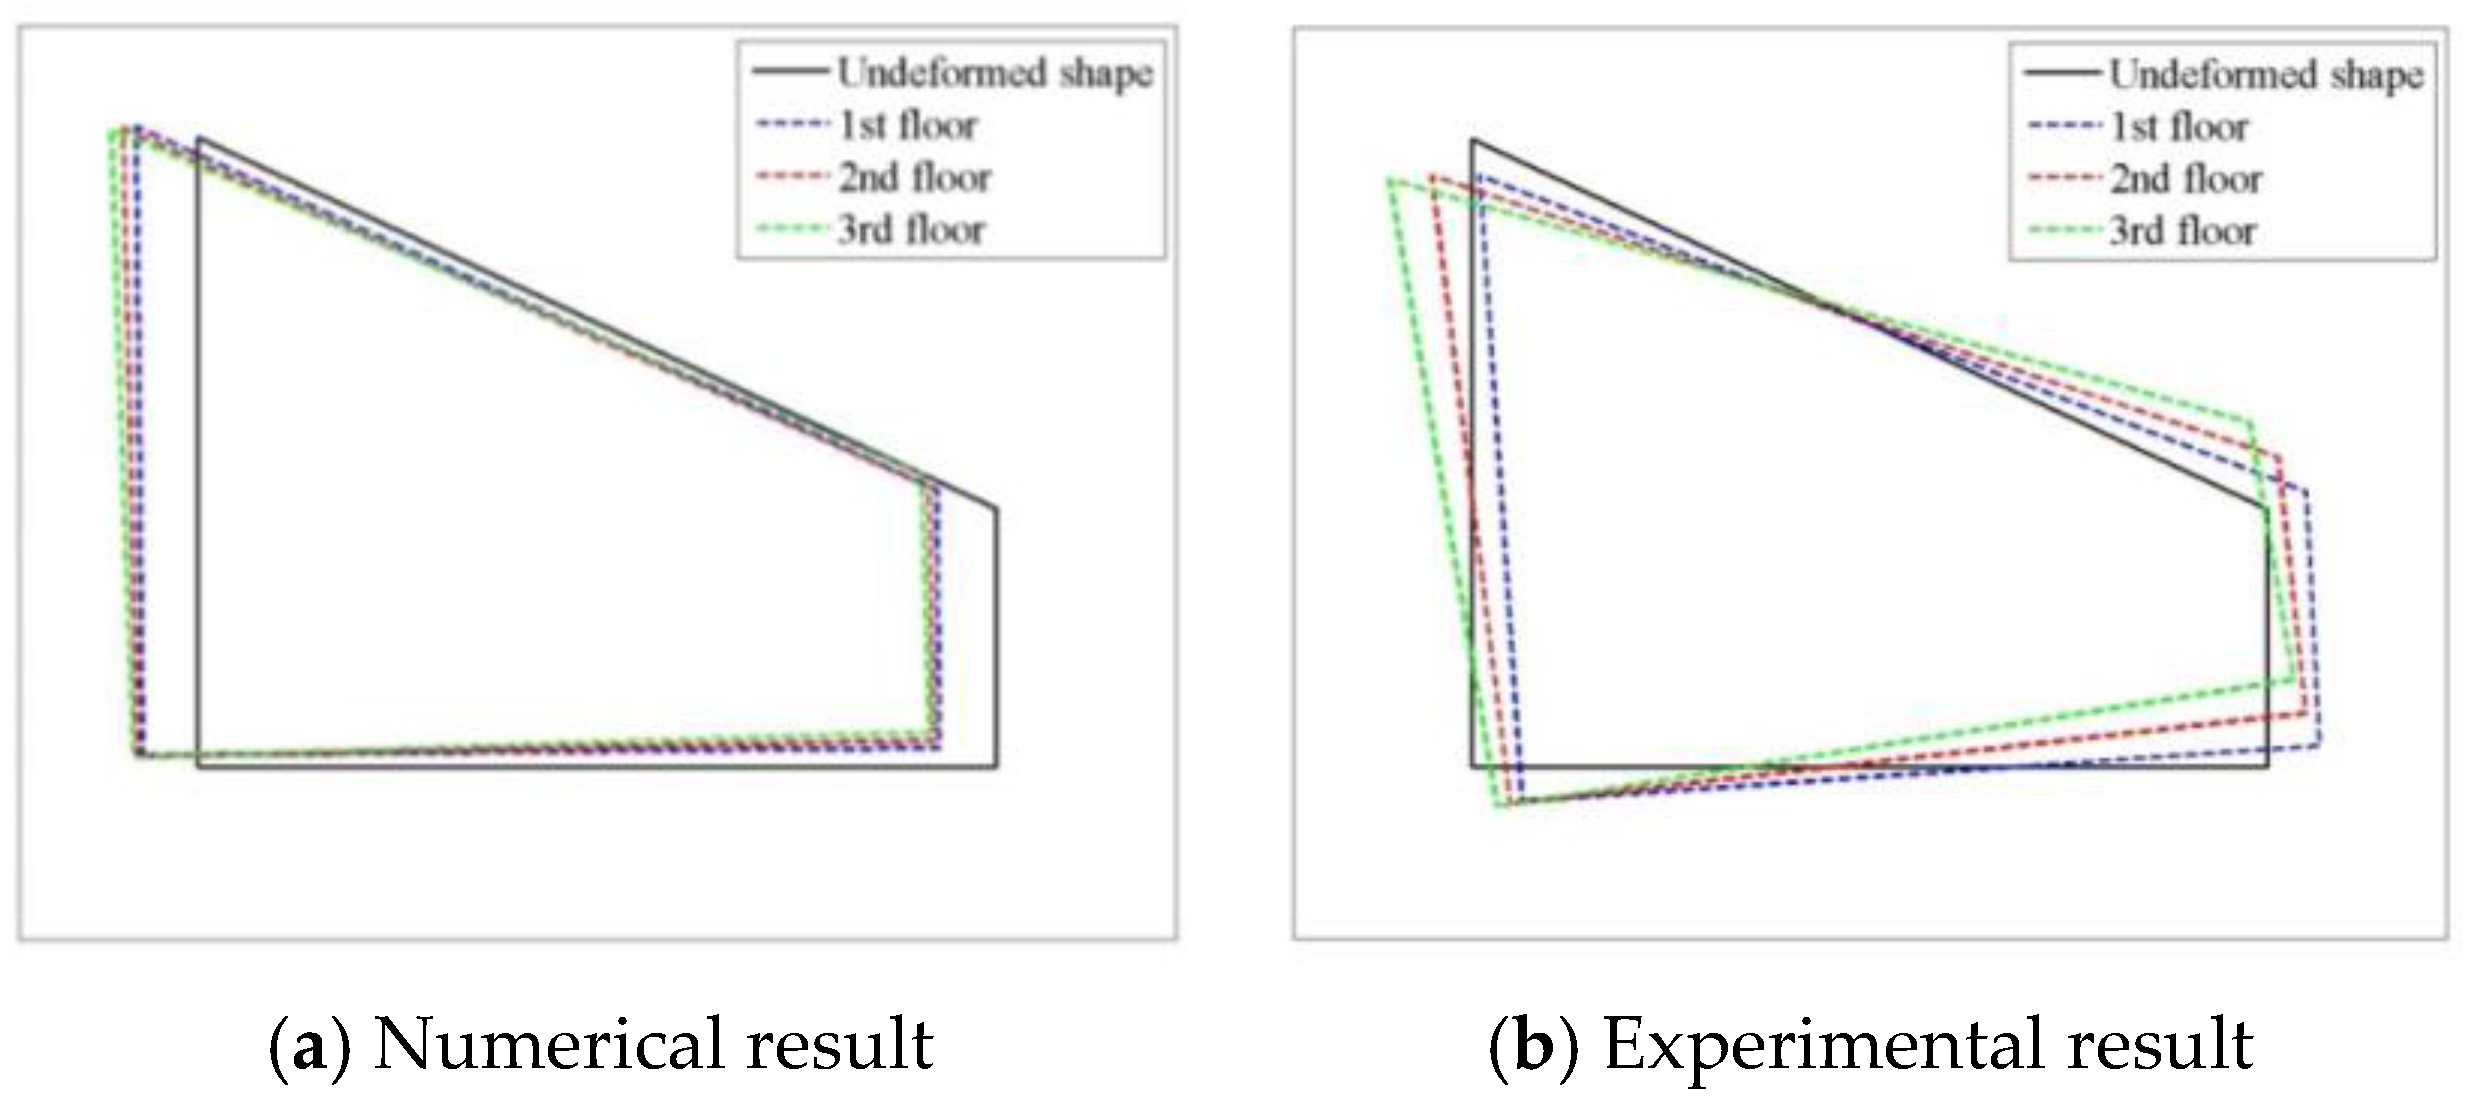
Figure 34.
Distortion of each floor due to the Northridge main shock (Run 19) at 8.6 s.
Figure 34.
Distortion of each floor due to the Northridge main shock (Run 19) at 8.6 s.
Figure 35.
Finite element modeling of a hypothetical symmetric structure for comparison with the SMART 2013 RC structure.
Figure 35.
Finite element modeling of a hypothetical symmetric structure for comparison with the SMART 2013 RC structure.
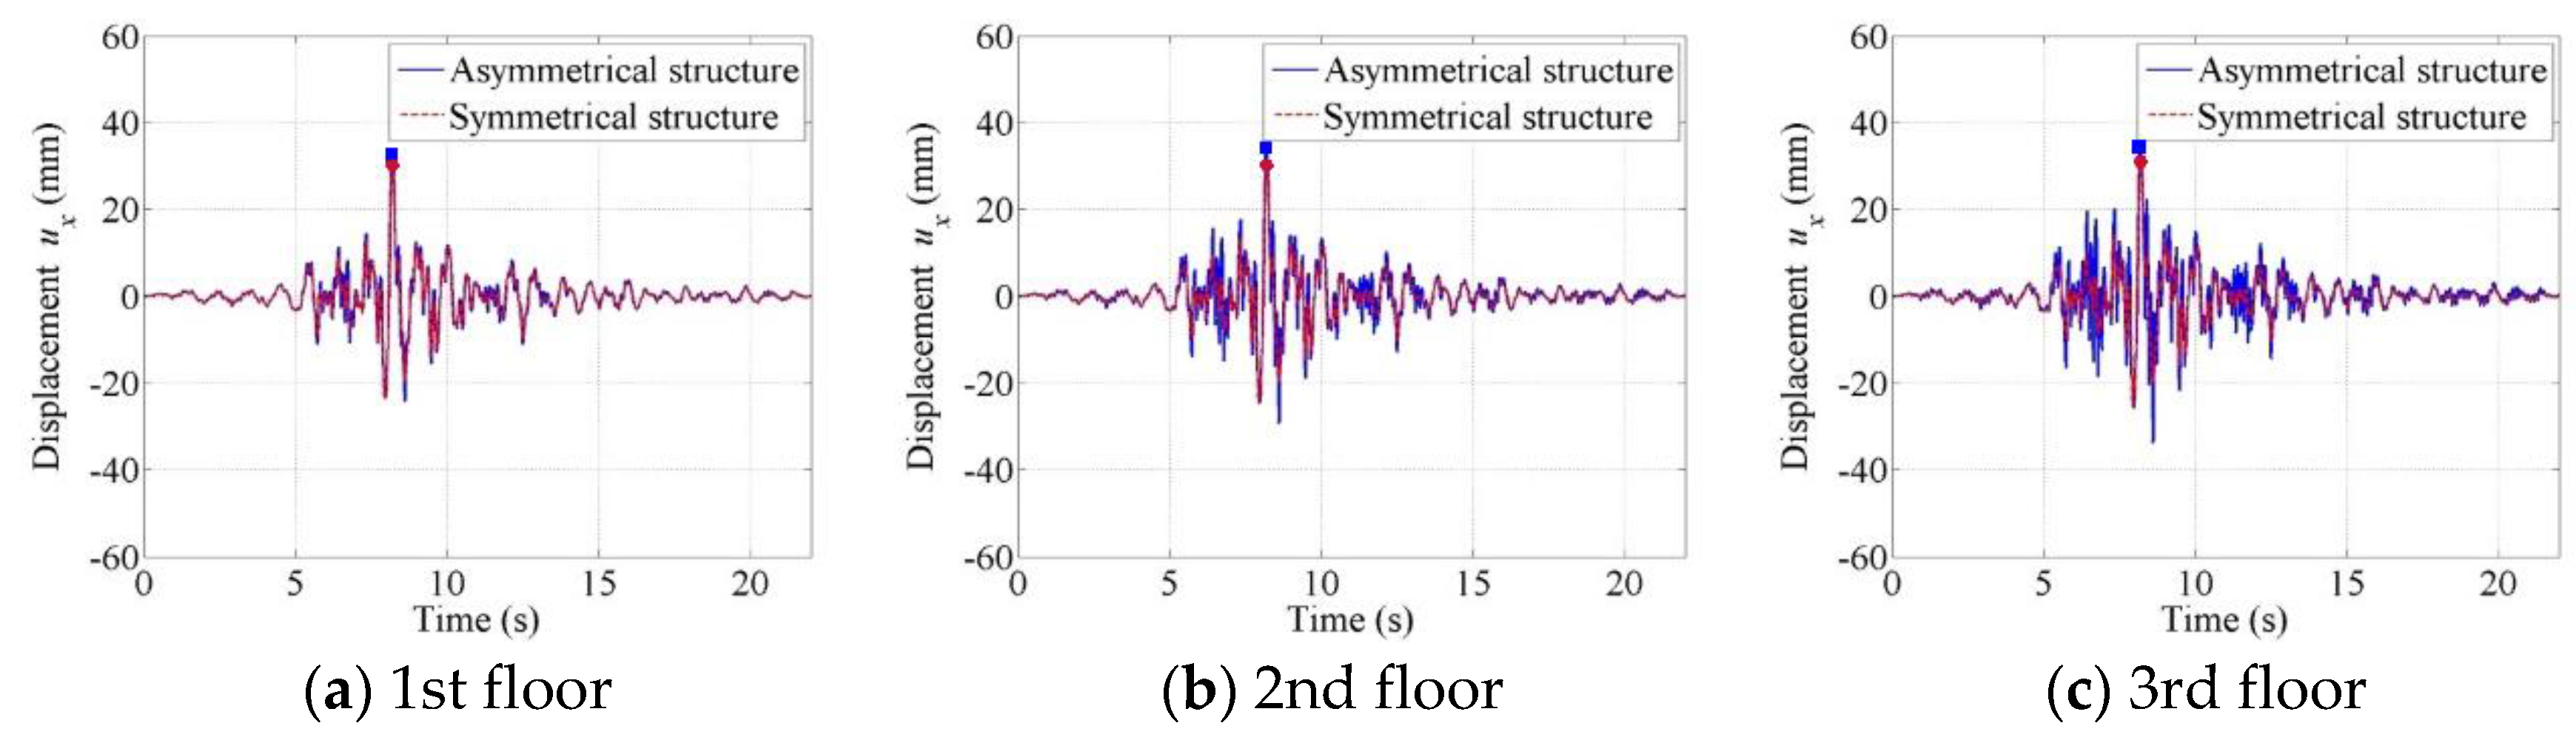
Figure 36.
Displacement responses of the asymmetric SMART 2013 structure and the hypothetical symmetric structure due to the Northridge earthquake (Run 19); Responses sampled at point D.
Figure 36.
Displacement responses of the asymmetric SMART 2013 structure and the hypothetical symmetric structure due to the Northridge earthquake (Run 19); Responses sampled at point D.
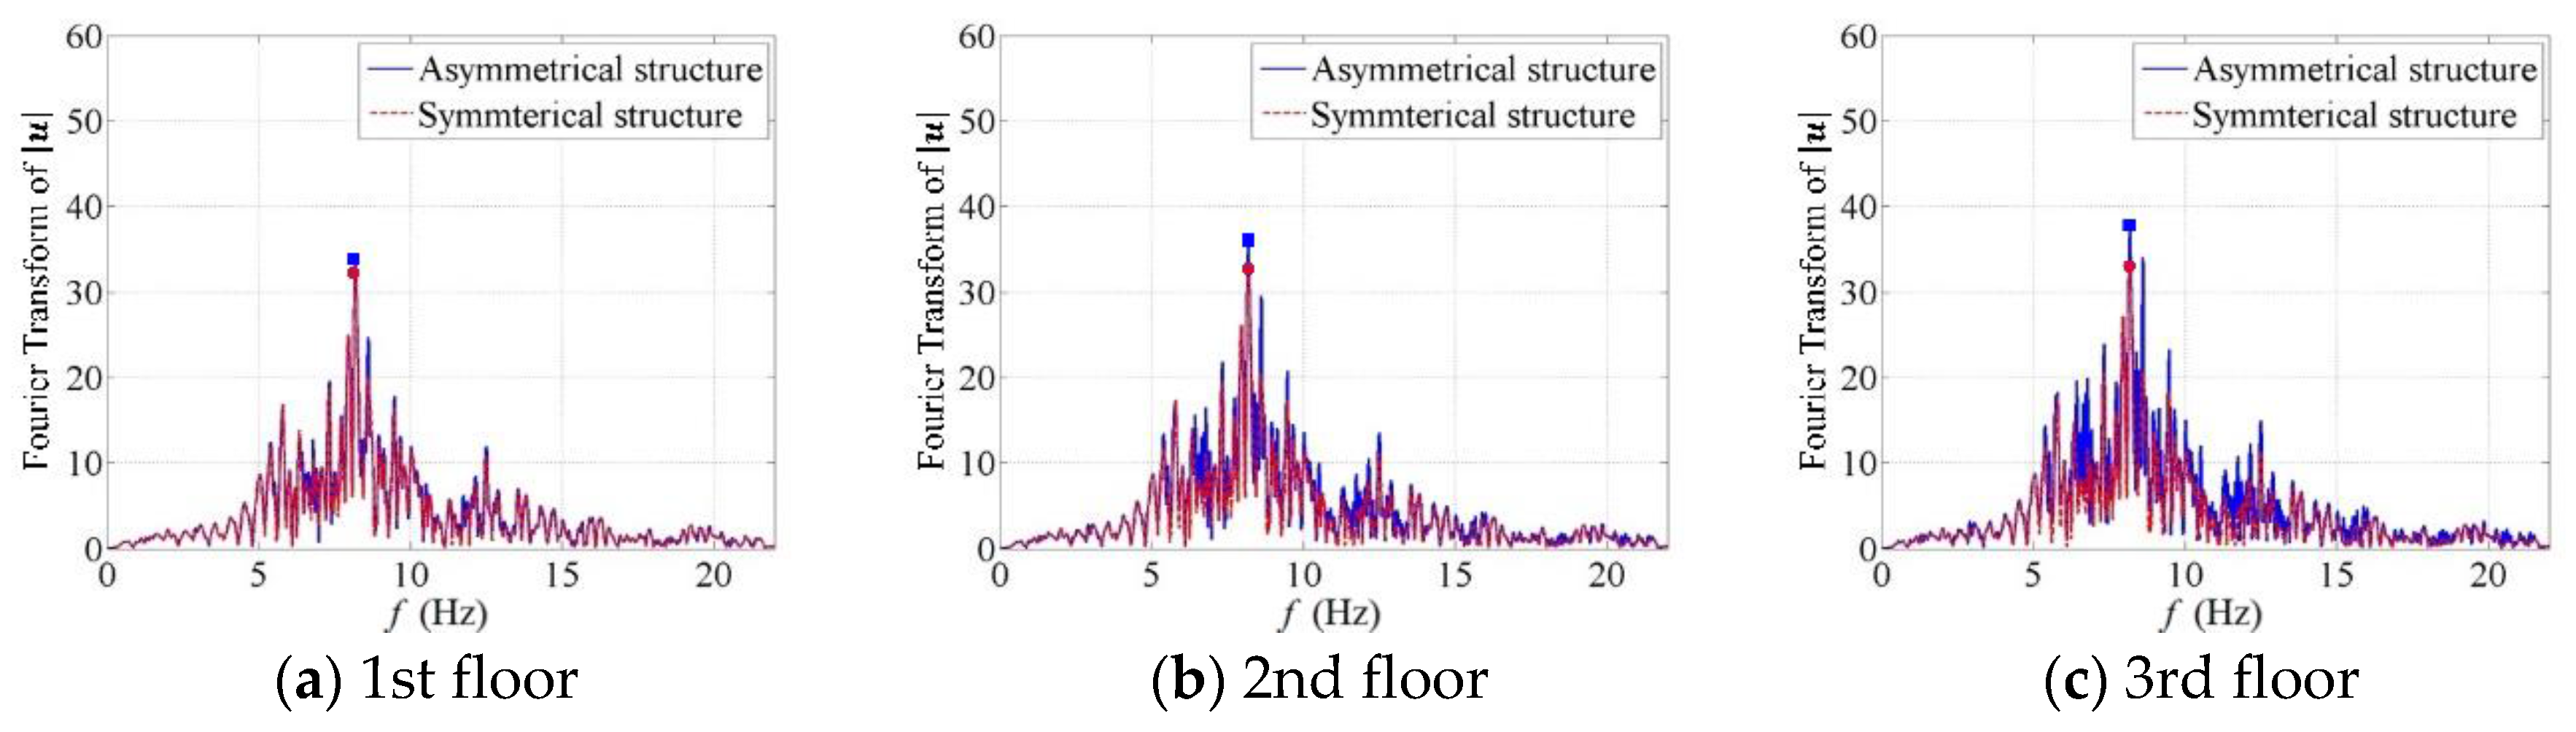
Figure 37.
Displacement frequency spectra of the asymmetric SMART 2013 structure and the hypothetical symmetric structure due to the Northridge earthquake (Run 19); Displacement amplitude sampled at point D.
Figure 37.
Displacement frequency spectra of the asymmetric SMART 2013 structure and the hypothetical symmetric structure due to the Northridge earthquake (Run 19); Displacement amplitude sampled at point D.
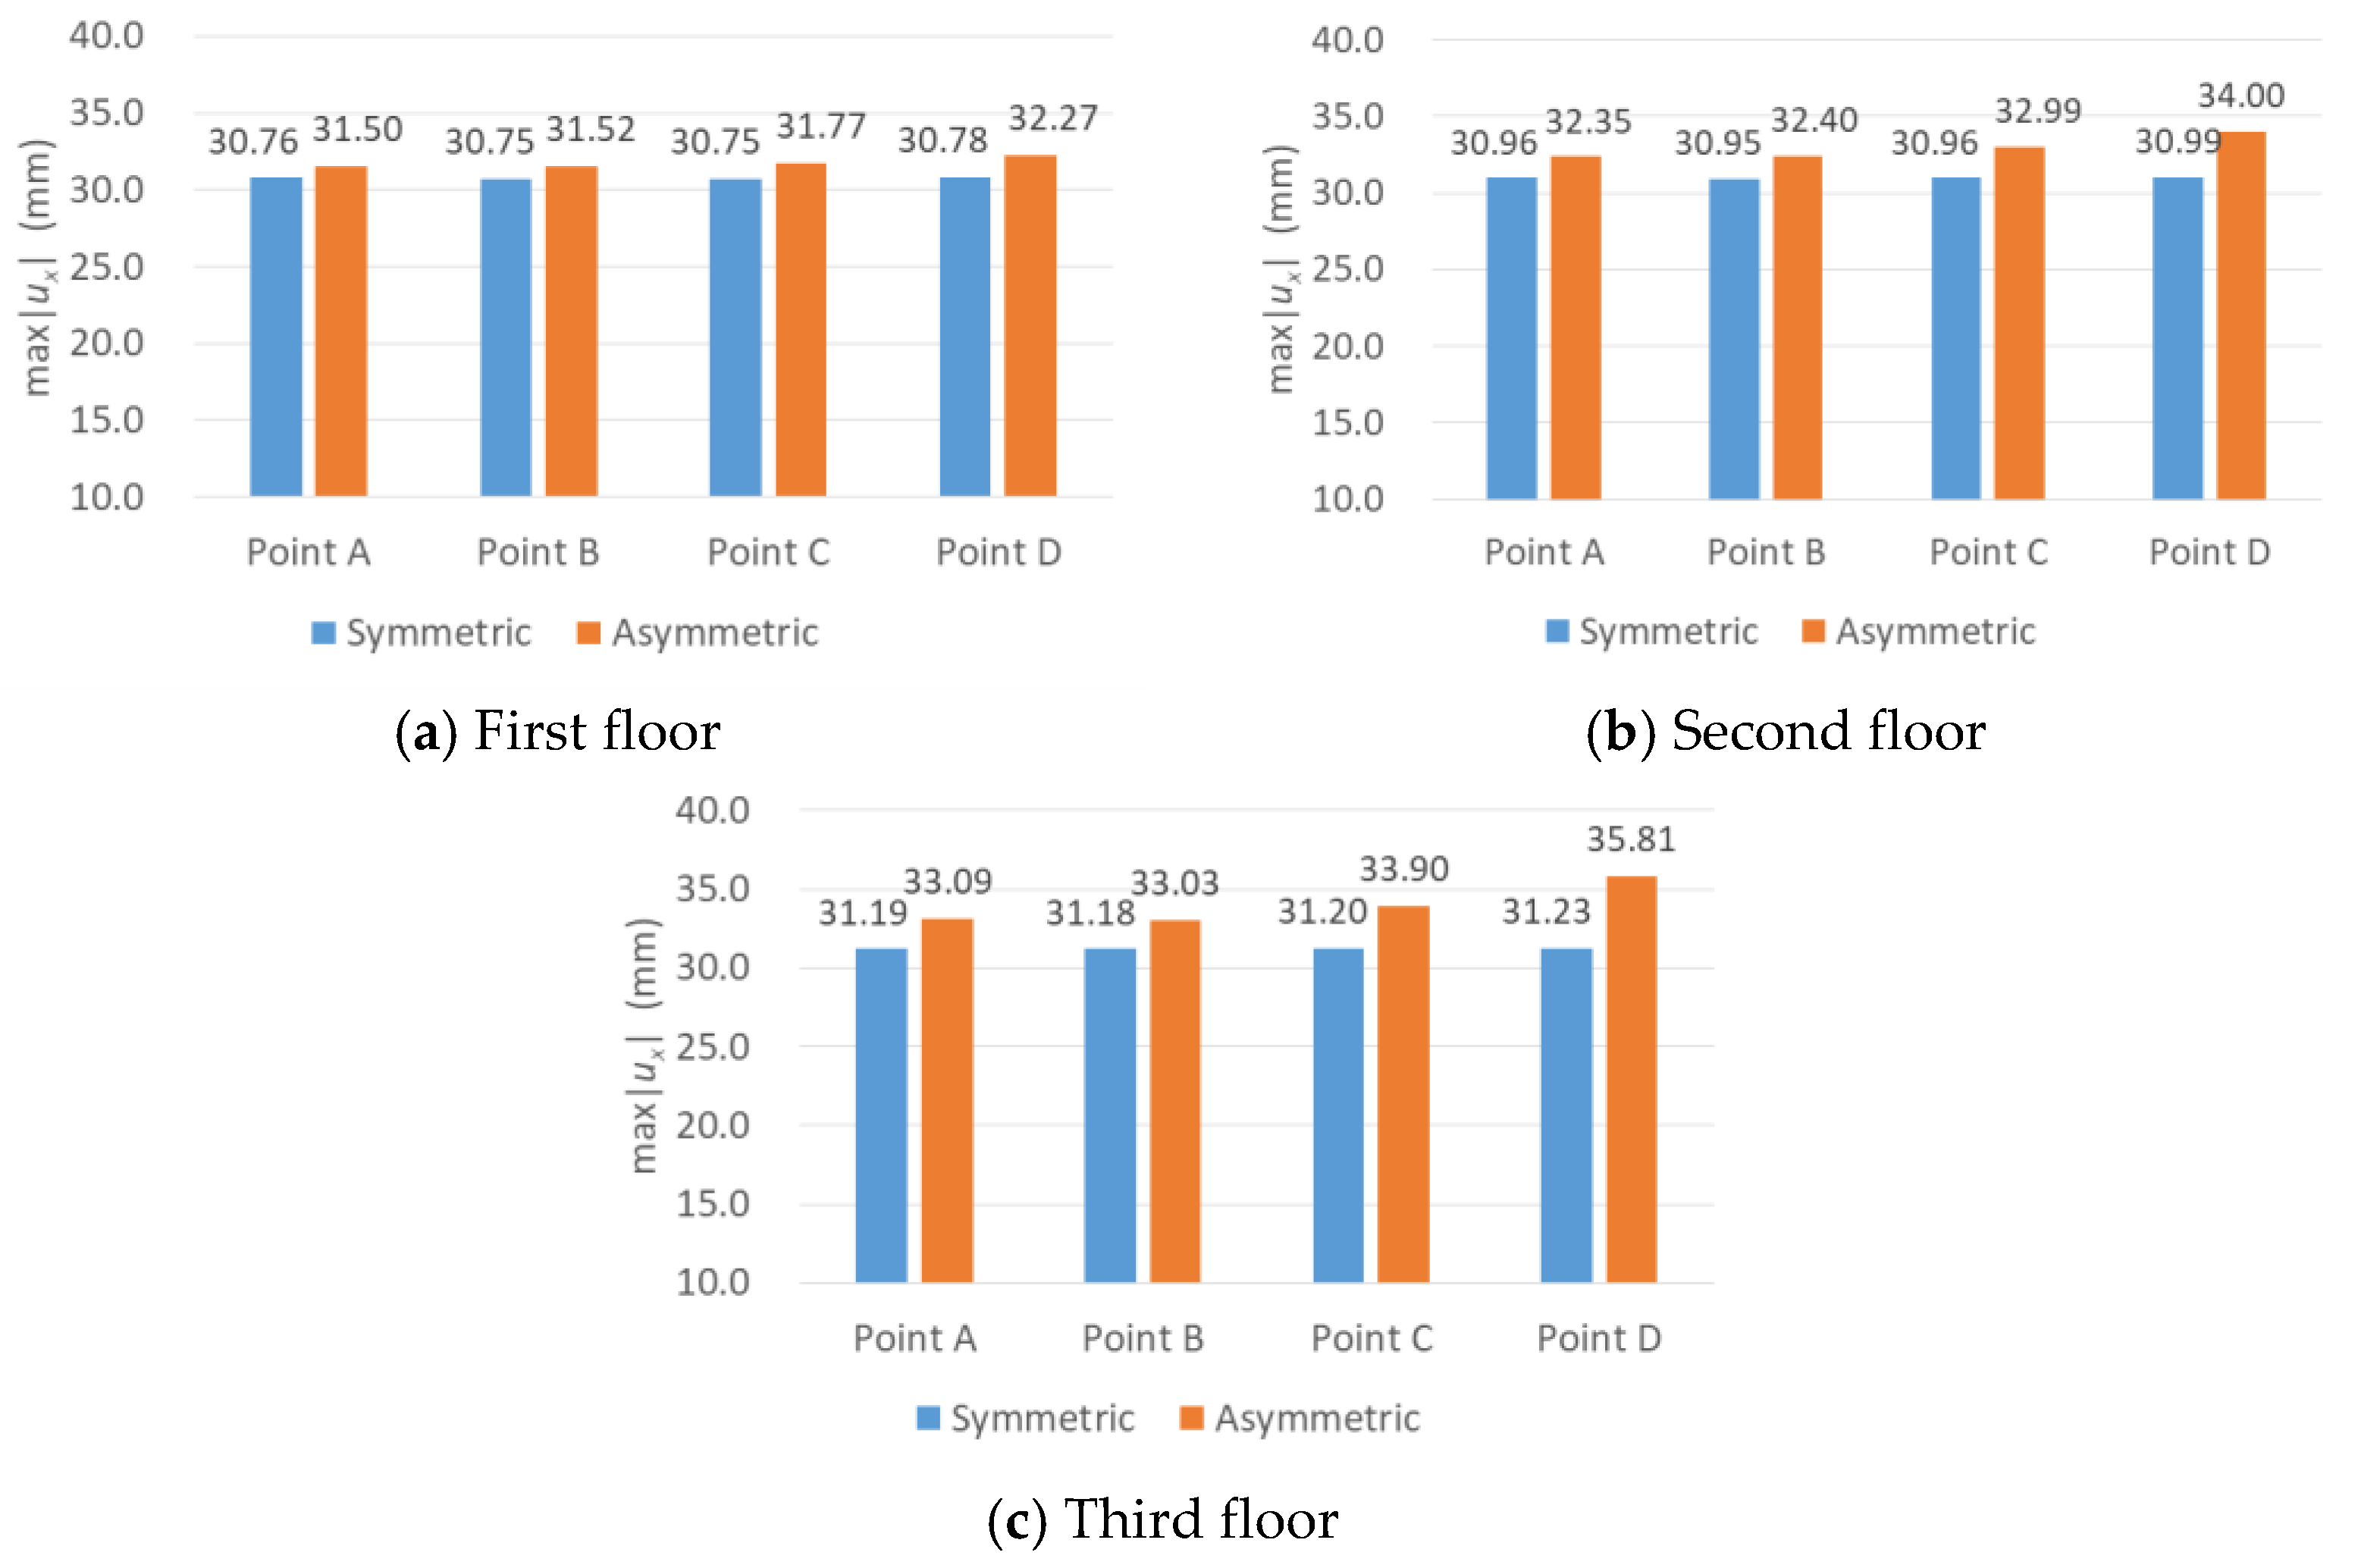
Figure 38.
Absolute maximum displacement in the x-direction of the asymmetric and the hypothetical symmetric structures due to the Northridge earthquake (Run 19).
Figure 38.
Absolute maximum displacement in the x-direction of the asymmetric and the hypothetical symmetric structures due to the Northridge earthquake (Run 19).
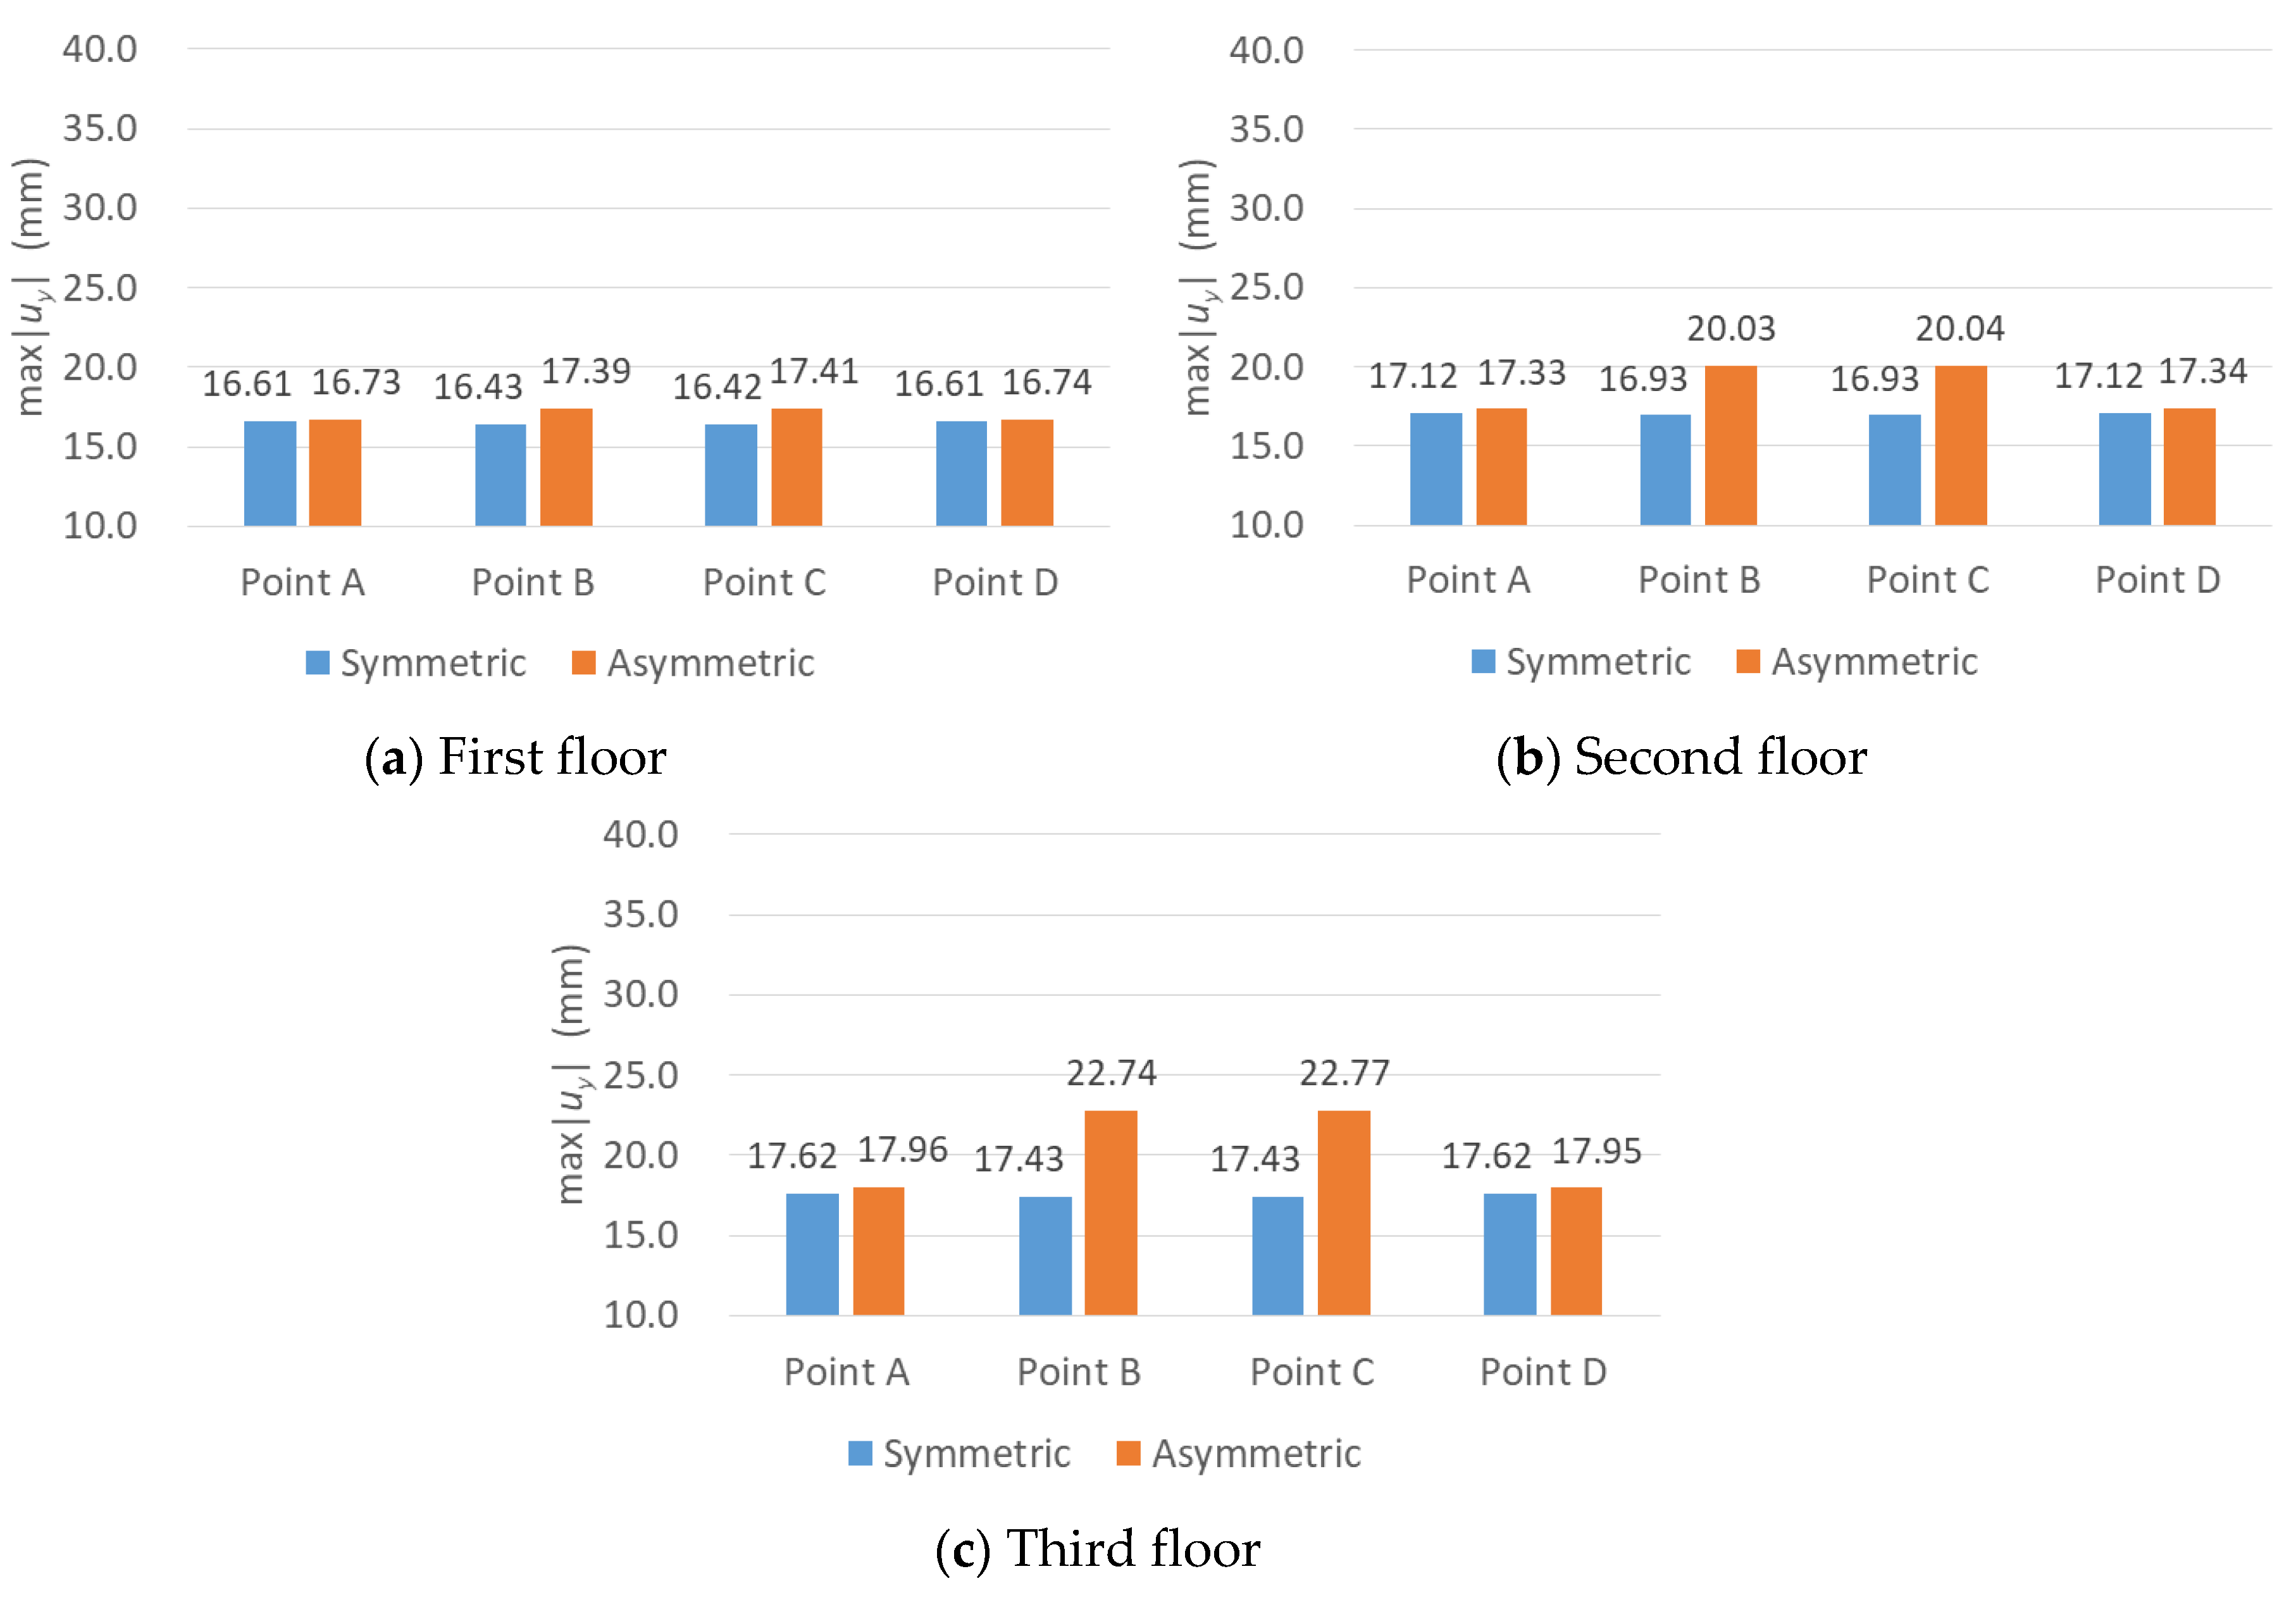
Figure 39.
Absolute maximum displacement in the y direction of the asymmetric and the hypothetical symmetric structures due to the Northridge earthquake (Run 19).
Figure 39.
Absolute maximum displacement in the y direction of the asymmetric and the hypothetical symmetric structures due to the Northridge earthquake (Run 19).
Table 1.
Dimensions of the structural components of the SMART (Seismic design and best-estimate Methods Assessment for Reinforced concrete buildings subjected to Torsion and nonlinear effects) 2013 reinforced concrete (RC) structure.
Table 1.
Dimensions of the structural components of the SMART (Seismic design and best-estimate Methods Assessment for Reinforced concrete buildings subjected to Torsion and nonlinear effects) 2013 reinforced concrete (RC) structure.
| Structural Component | Length (mm) | Thickness (mm) | Height (mm) |
|---|
| Wall (V01 + V02) | 3100 | 100 | 3650 |
| Wall V03 | 2550 | 100 | 3650 |
| Wall V04 | 1050 | 100 | 3650 |
| Beams | 1450 | 150 | 325 |
| Column | 200 | 200 | 3900 |
Table 2.
Material properties of concrete and rebar obtained by experiments [
24].
Table 2.
Material properties of concrete and rebar obtained by experiments [
24].
| Structural Component | Young’s Modulus (MPa) | Poisson’s Ratio | Compressive Strength (MPa) | Tensile Strength (MPa) | Mass Density (kg·m−3) |
|---|
| Foundation concrete | 25,400 | 0.17 | 43.3 | 3.45 | 2300 |
| Slab concrete on the first floor | 28,200 | 0.18 | 41.1 | 3.25 | 2300 |
| Slab concrete on the second floor | 24,700 | 0.17 | 36.8 | 3.35 | 2300 |
| Slab concrete on the third floor | 24,400 | 0.18 | 37.8 | 3.40 | 2300 |
| Wall concrete | 28,700 | 0.19 | 41.7 | 3.89 | 2300 |
| Steel reinforcement | 267,333 | 0.30 | 528 | 528 | 7800 |
Table 3.
Configuration of the local test. RVE: representative volume element.
Table 3.
Configuration of the local test. RVE: representative volume element.
| Test No. | Material | Aim | Loading Conditions |
|---|
| c.1 | Concrete | Construct failure surface | Biaxial tension–compression loading from –35 MPa to 2.4 MPa |
| rc.1 | Reinforced concrete | Identify axial cyclic response of RC RVE | Uniaxial cyclic tension–compression loading with displacement ranging from −4 mm to 1.5 mm |
| rc.2 | Reinforced concrete | Identify shear cyclic response of RC RVE | Cyclic pure shear loading with the force ranging from −6 KN to 6 KN |
Table 4.
Geometrical characteristics of the finite element (FE) model.
Table 4.
Geometrical characteristics of the finite element (FE) model.
| Geometrical Characteristics of the FE Model | Number |
|---|
| Total number of elements | 13,391 |
| Total number of nodes | 14,479 |
| Number of solid elements | 11,007 |
| Number of beam elements | 2384 |
Table 5.
Natural frequencies of the SMART 2013 RC structure for three model cases.
Table 5.
Natural frequencies of the SMART 2013 RC structure for three model cases.
| | Model Configurations | First Modal Frequency (Hz) | Second Modal Frequency (Hz) | Third Modal Frequency (Hz) |
|---|
| Analysis | Case 1 | 21.37 | 36.23 | 65.82 |
| Case 2 | 8.93 | 15.39 | 30.71 |
| Case 3 | 6.26 | 7.77 | 13.15 |
| Experiment | Case 3 | 6.28 | 7.86 | 16.50 |
Table 6.
Modal damping ratios obtained by experiments.
Table 6.
Modal damping ratios obtained by experiments.
| Mode | Frequency, (Hz) | Modal Damping Ratio, |
|---|
| 1 | 6.28 | 0.026 |
| 2 | 7.86 | 0.042 |
| 3 | 16.50 | 0.055 |
Table 7.
Absolute maximum seismic responses at point A due to the low-intensity ground motions.
Table 7.
Absolute maximum seismic responses at point A due to the low-intensity ground motions.
| Floor | Displacement, ux (mm) | Acceleration, ax (m/s2) |
|---|
| Analysis | Experiment | Analysis | Experiment |
|---|
| 1st floor | 1.06 | 0.91 | 1.37 (0.14 g) | 1.29 (0.13 g) |
| 2nd floor | 1.08 | 1.00 | 1.88 (0.19 g) | 1.74 (0.18 g) |
| 3rd floor | 1.10 | 1.01 | 2.66 (0.27 g) | 2.49 (0.25 g) |
Table 8.
Nominal input ground motions for a nonlinear seismic analysis.
Table 8.
Nominal input ground motions for a nonlinear seismic analysis.
| Run | PGA X (g) | PGA Y (g) | Percentage of Nominal Signal (%) | Type |
|---|
| 9 | 0.22 | 0.23 | 100 | Design earthquake signal–nominal |
| 11 | 0.21 | 0.16 | 11 | Scaled Northridge earthquake–step 1 |
| 13 | 0.40 | 0.21 | 22 | Scaled Northridge earthquake–step 2 |
| 17 | 0.60 | 0.40 | 44 | Scaled Northridge earthquake–step 3 |
| 19 | 1.10 | 1.00 | 100 | Real Northridge earthquake–nominal |
| 21 | 0.14 | 0.14 | 33 | Scaled Northridge aftershock–step 1 |
| 23 | 0.70 | 0.40 | 100 | Real Northridge aftershock–nominal |
Table 9.
Absolute maximum displacement at point A on the third floor.
Table 9.
Absolute maximum displacement at point A on the third floor.
| Seismic Simulation | Absolute Maximum Displacement, ux |
|---|
| Analysis (mm) | Experiment (mm) | Error (%) |
|---|
| Run 9 | 2.47 | 2.02 | 22.28 |
| Run 11 | 4.83 | 5.57 | 13.29 |
| Run 13 | 9.51 | 12.92 | 26.39 |
| Run 17 | 15.23 | 22.02 | 30.84 |
| Run 19 | 33.09 | 36.73 | 9.91 |
| Run 21 | 1.53 | 1.79 | 14.53 |
| Run 23 | 4.93 | 7.66 | 35.64 |
Table 10.
Absolute maximum acceleration at point A on the third floor.
Table 10.
Absolute maximum acceleration at point A on the third floor.
| Seismic Simulation | Absolute Maximum Acceleration, ax |
|---|
| Analysis (m/s2) | Experiment (m/s2) | Error (%) |
|---|
| Run 9 | 3.88 (0.40 g) | 4.10 (0.42 g) | 5.37 |
| Run 11 | 2.46 (0.25 g) | 3.39 (0.34 g) | 27.43 |
| Run 13 | 5.67 (0.58 g) | 9.73 (0.99 g) | 41.73 |
| Run 17 | 10.50 (1.07 g) | 10.83 (1.10 g) | 3.05 |
| Run 19 | 22.42 (2.28 g) | 16.11 (1.64 g) | 39.17 |
| Run 21 | 4.42 (0.45 g) | 3.23 (0.33 g) | 36.84 |
| Run 23 | 13.15 (1.34 g) | 9.28 (0.95 g) | 41.70 |
Table 11.
Absolute maximum seismic responses at sampling points A to D in both x and y directions for the analysis case of Run 19.
Table 11.
Absolute maximum seismic responses at sampling points A to D in both x and y directions for the analysis case of Run 19.
| | A | B | C | D |
|---|
| | Anal. | Exper. | Error
(%) | Anal. | Exper. | Error
(%) | Anal. | Exper. | Error
(%) | Anal. | Exper. | Error
(%) |
|---|
| (mm) | 33.09 | 36.79 | 10.06 | 33.03 | 35.34 | 6.54 | 33.90 | 51.67 | 34.39 | 35.81 | 85.39 | 58.06 |
| (mm) | 17.96 | 23.20 | 22.59 | 22.74 | 55.89 | 59.31 | 22.77 | 55.36 | 58.87 | 17.95 | 22.31 | 19.54 |
| (m/s2) | 22.42 | 16.11 | 39.17 | 20.27 | 14.61 | 38.74 | 25.52 | 16.78 | 52.09 | 34.32 | 32.01 | 7.22 |
| (m/s2) | 18.05 | 18.37 | 1.74 | 31.76 | 26.89 | 18.11 | 31.95 | 27.80 | 14.93 | 17.67 | 17.57 | 0.57 |

 ,
, 


