Investigation on the Effects of Internal EGR by Variable Exhaust Valve Actuation with Post Injection on Auto-ignited Combustion and Emission Performance

Abstract
:1. Introduction
2. Numerical Model Description
2.1. Engine Modeling
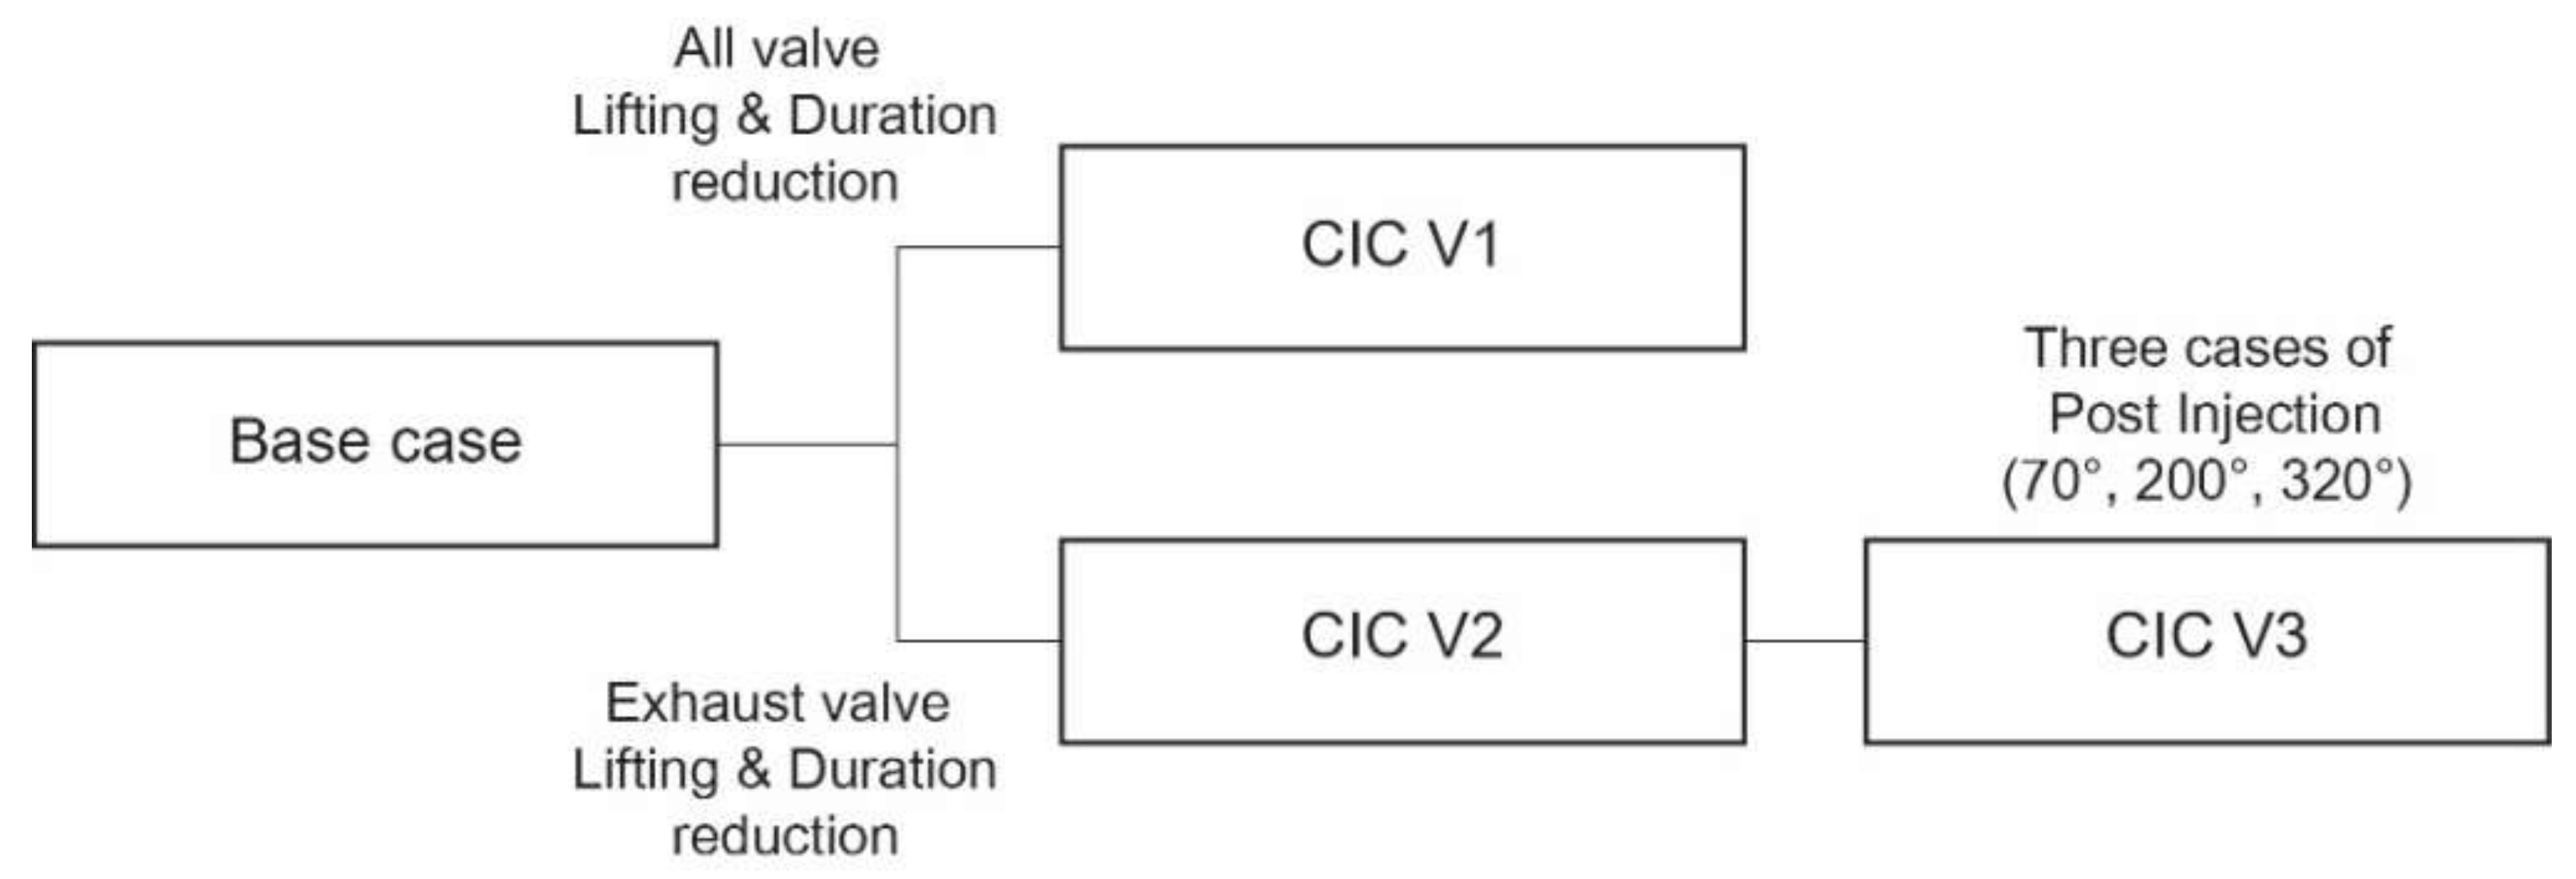
2.2. Four Variable Valve Train Configurations
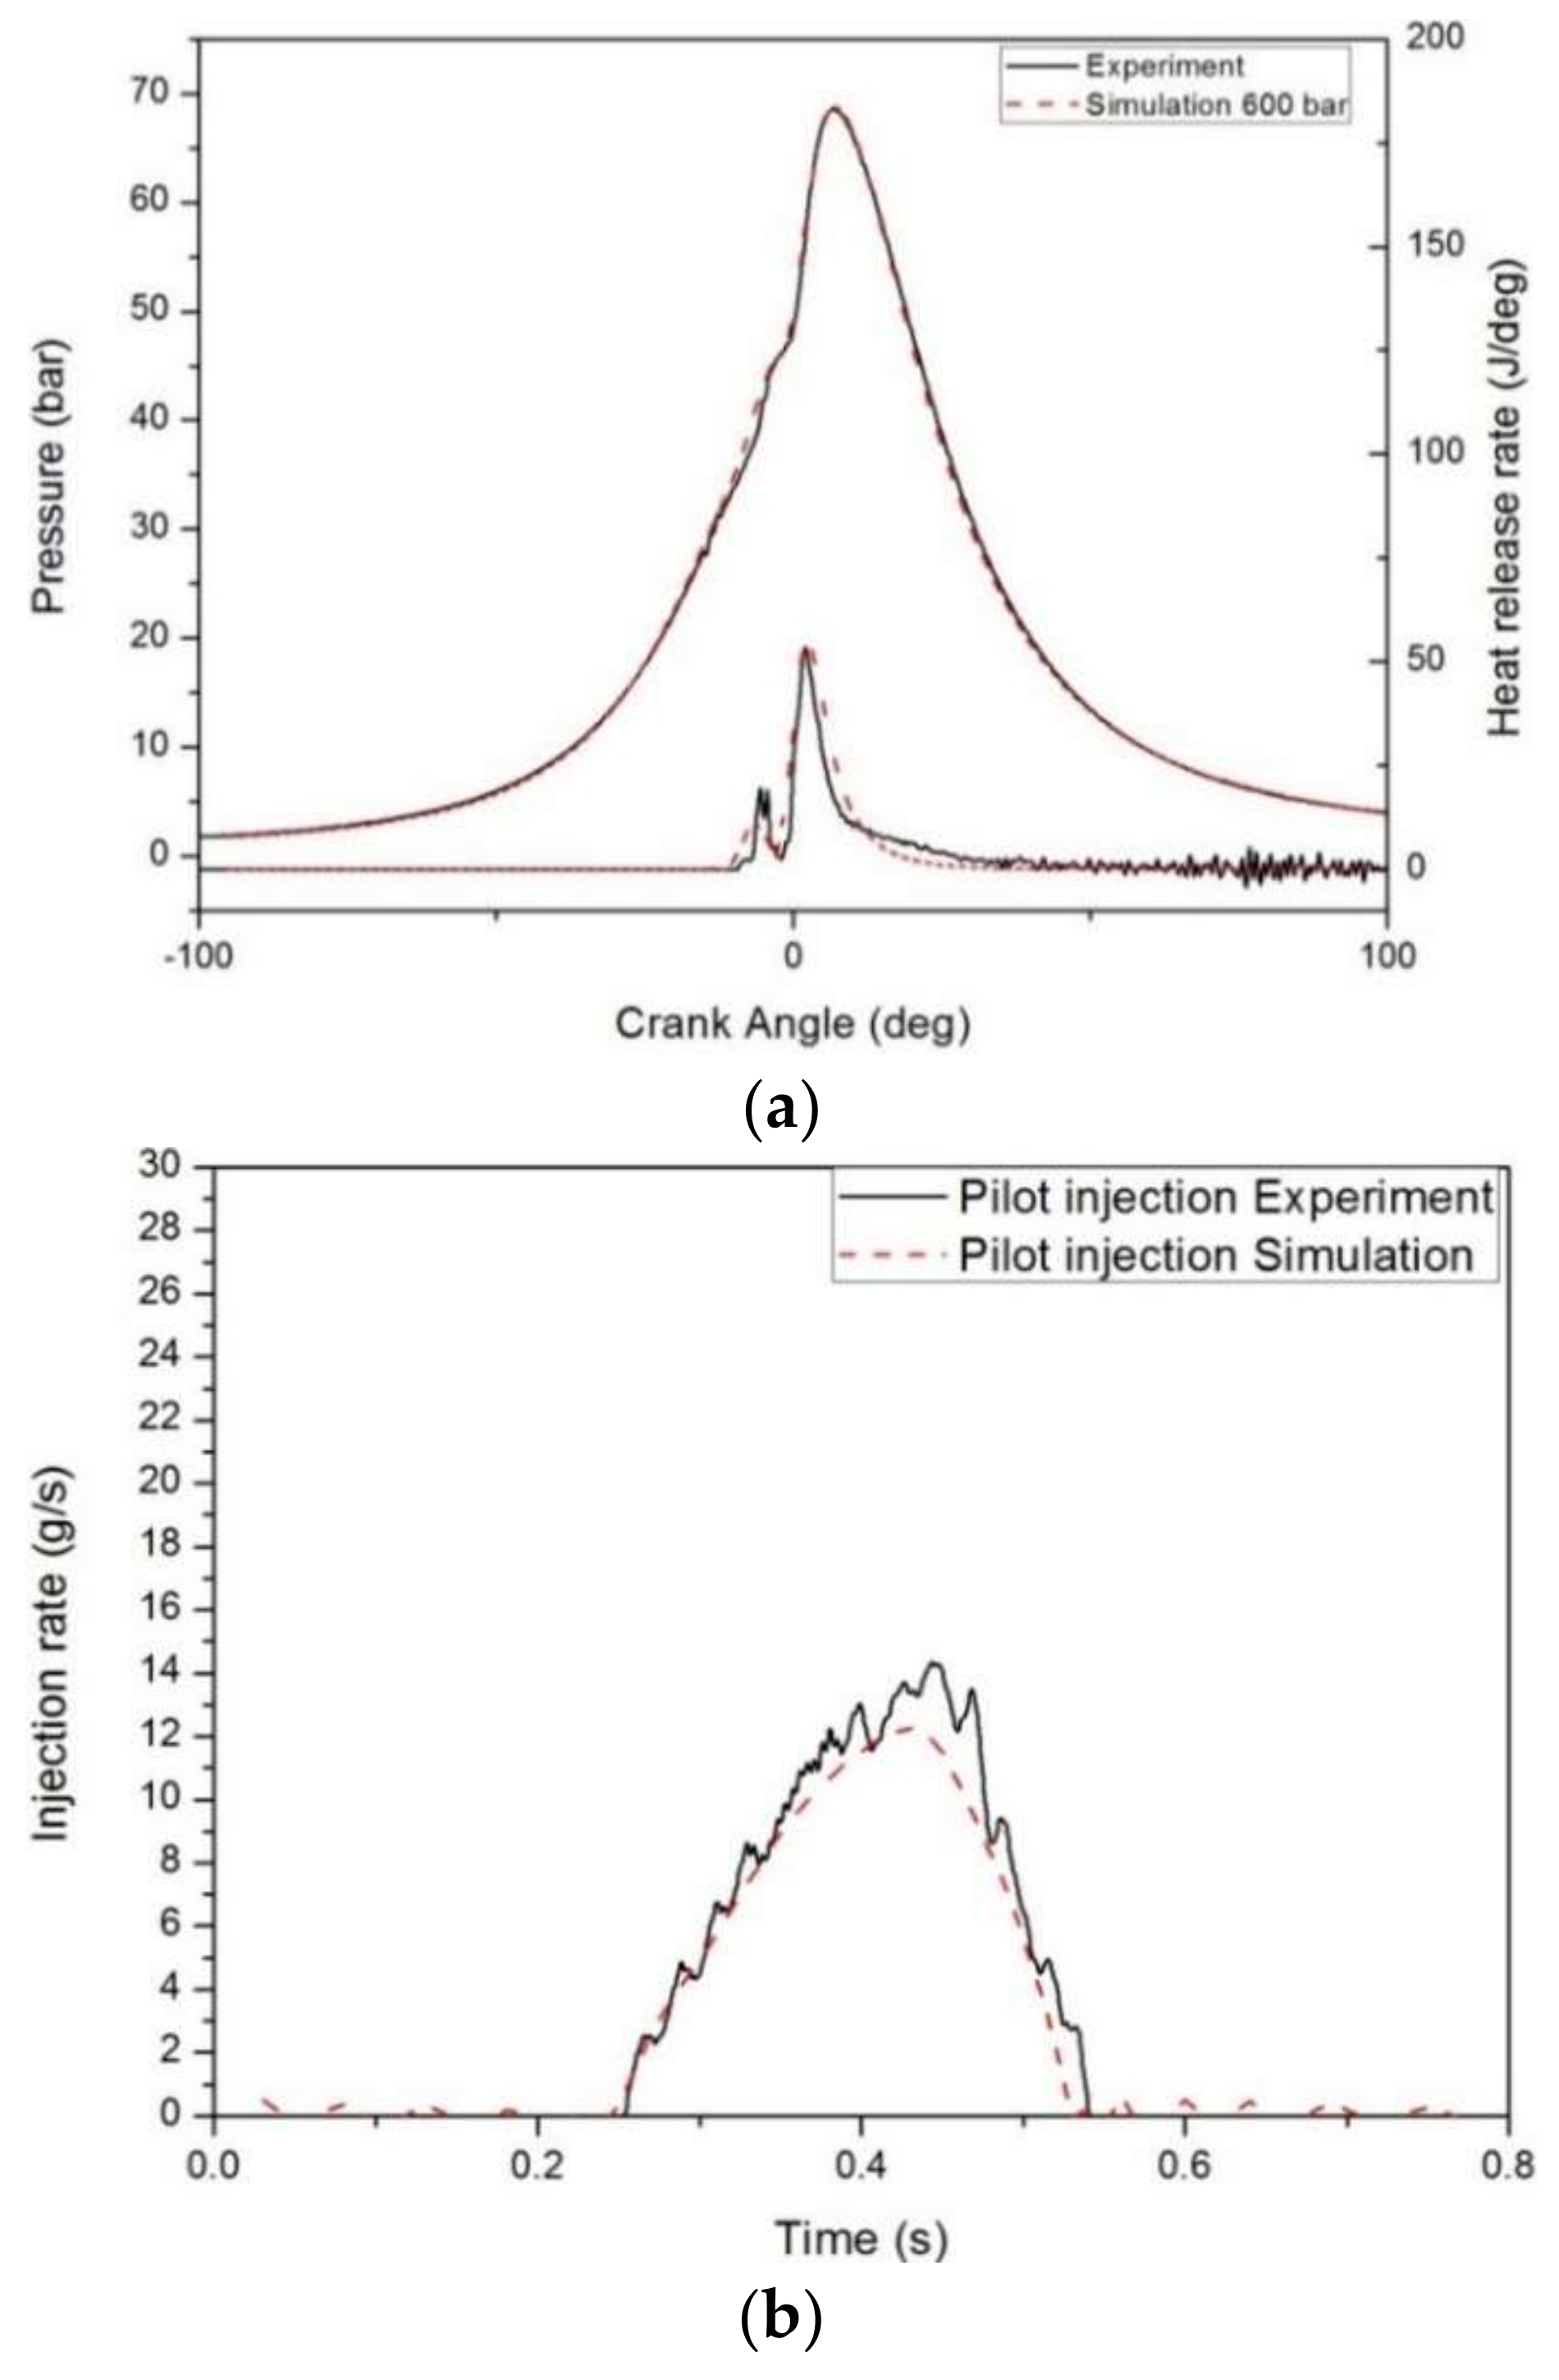
2.3. Model Verification
3. Results and Discussion
3.1. Combustion Characteristic of Recompression Internal EGR
3.2. Effect of Post Fuel Injection in Recompression Internal EGR
3.3. Comparison of Emission Performance
4. Conclusions
- (1)
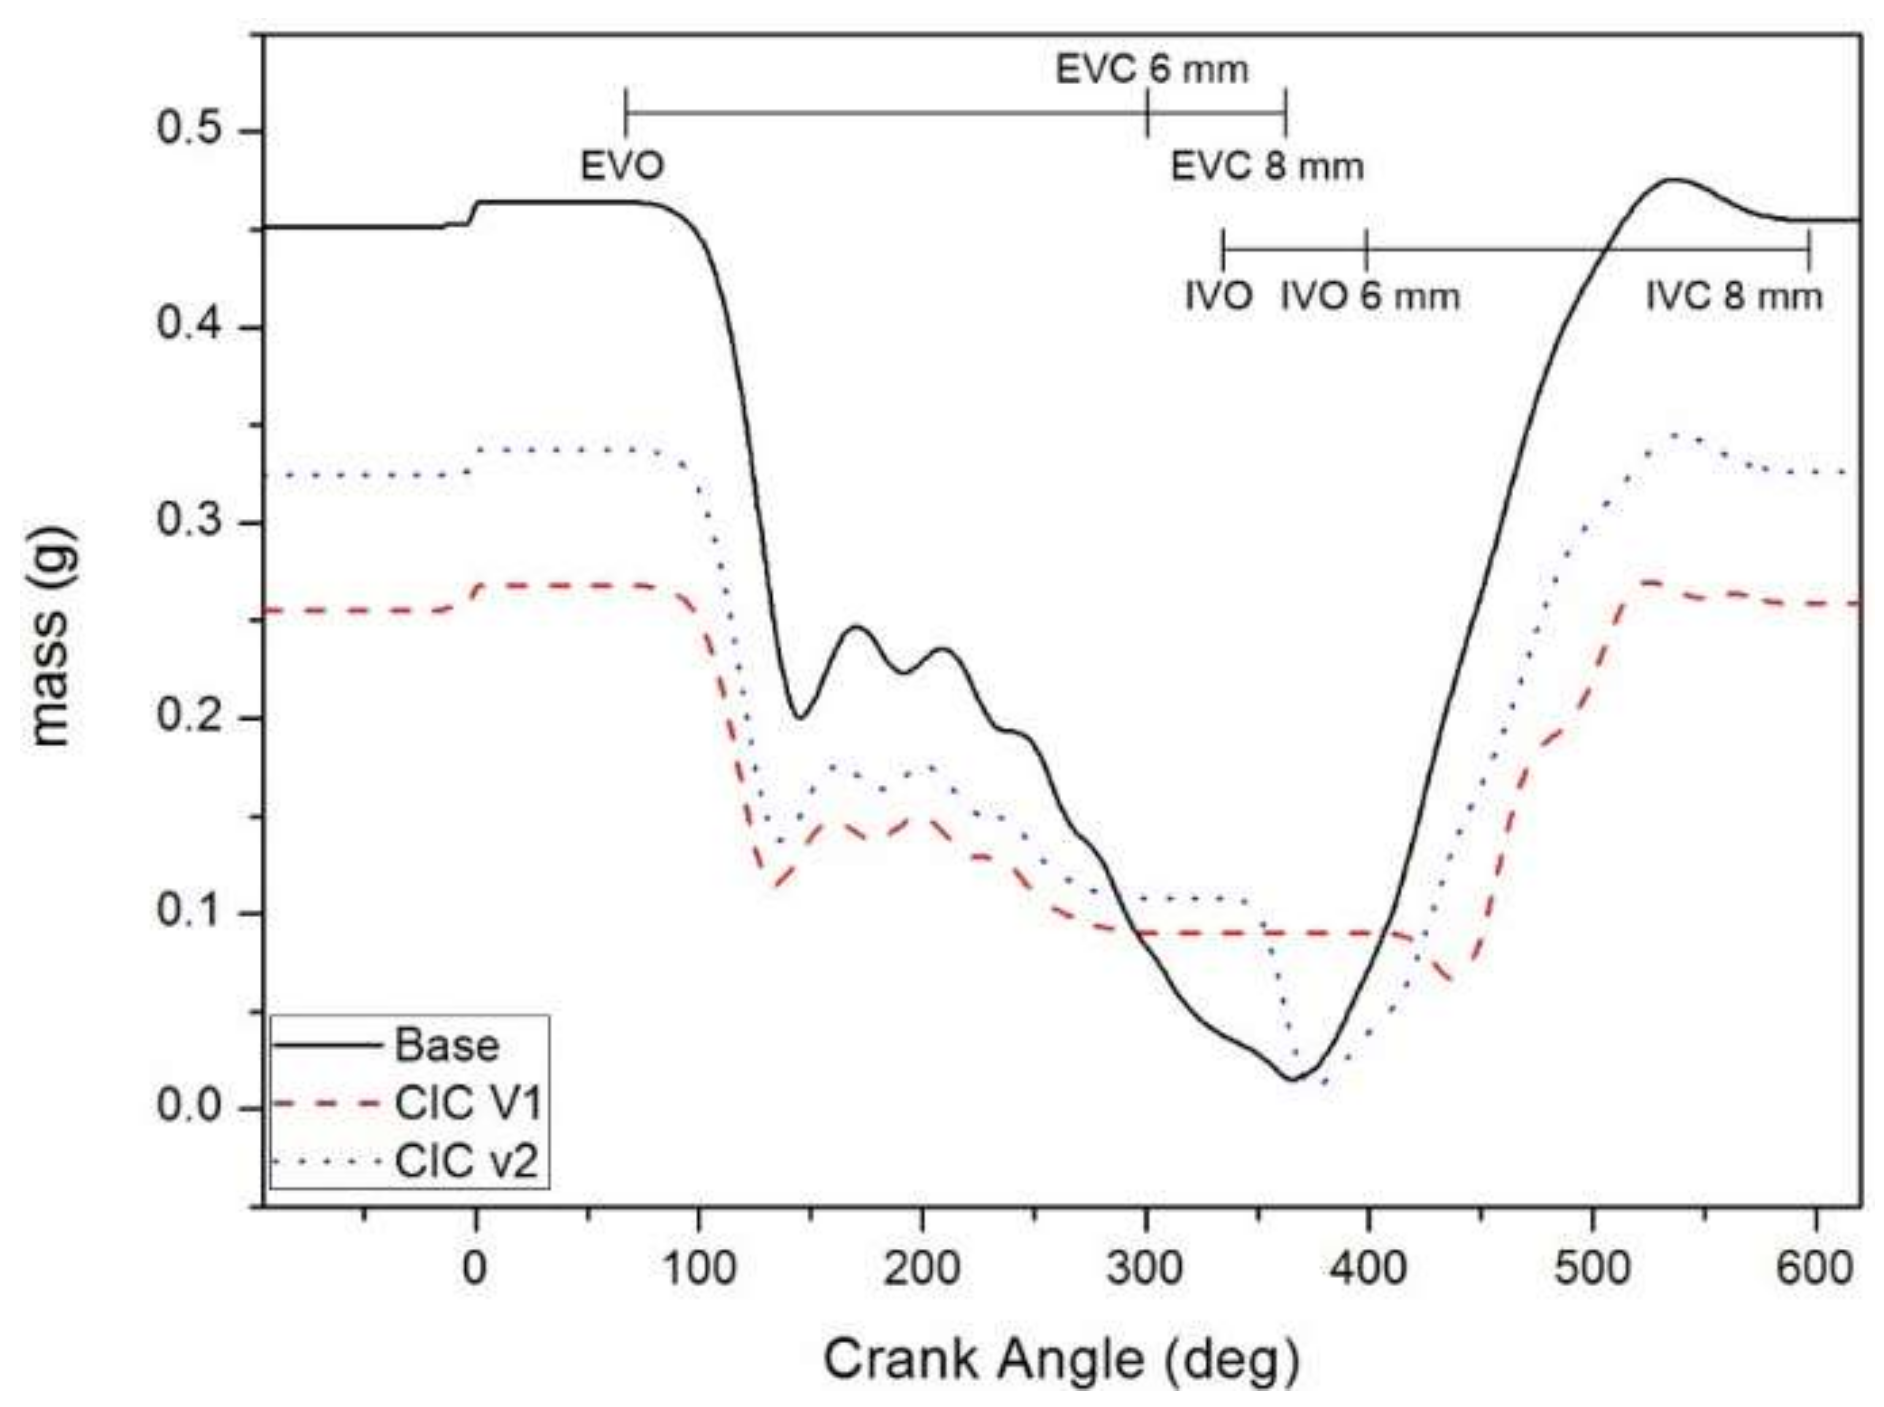
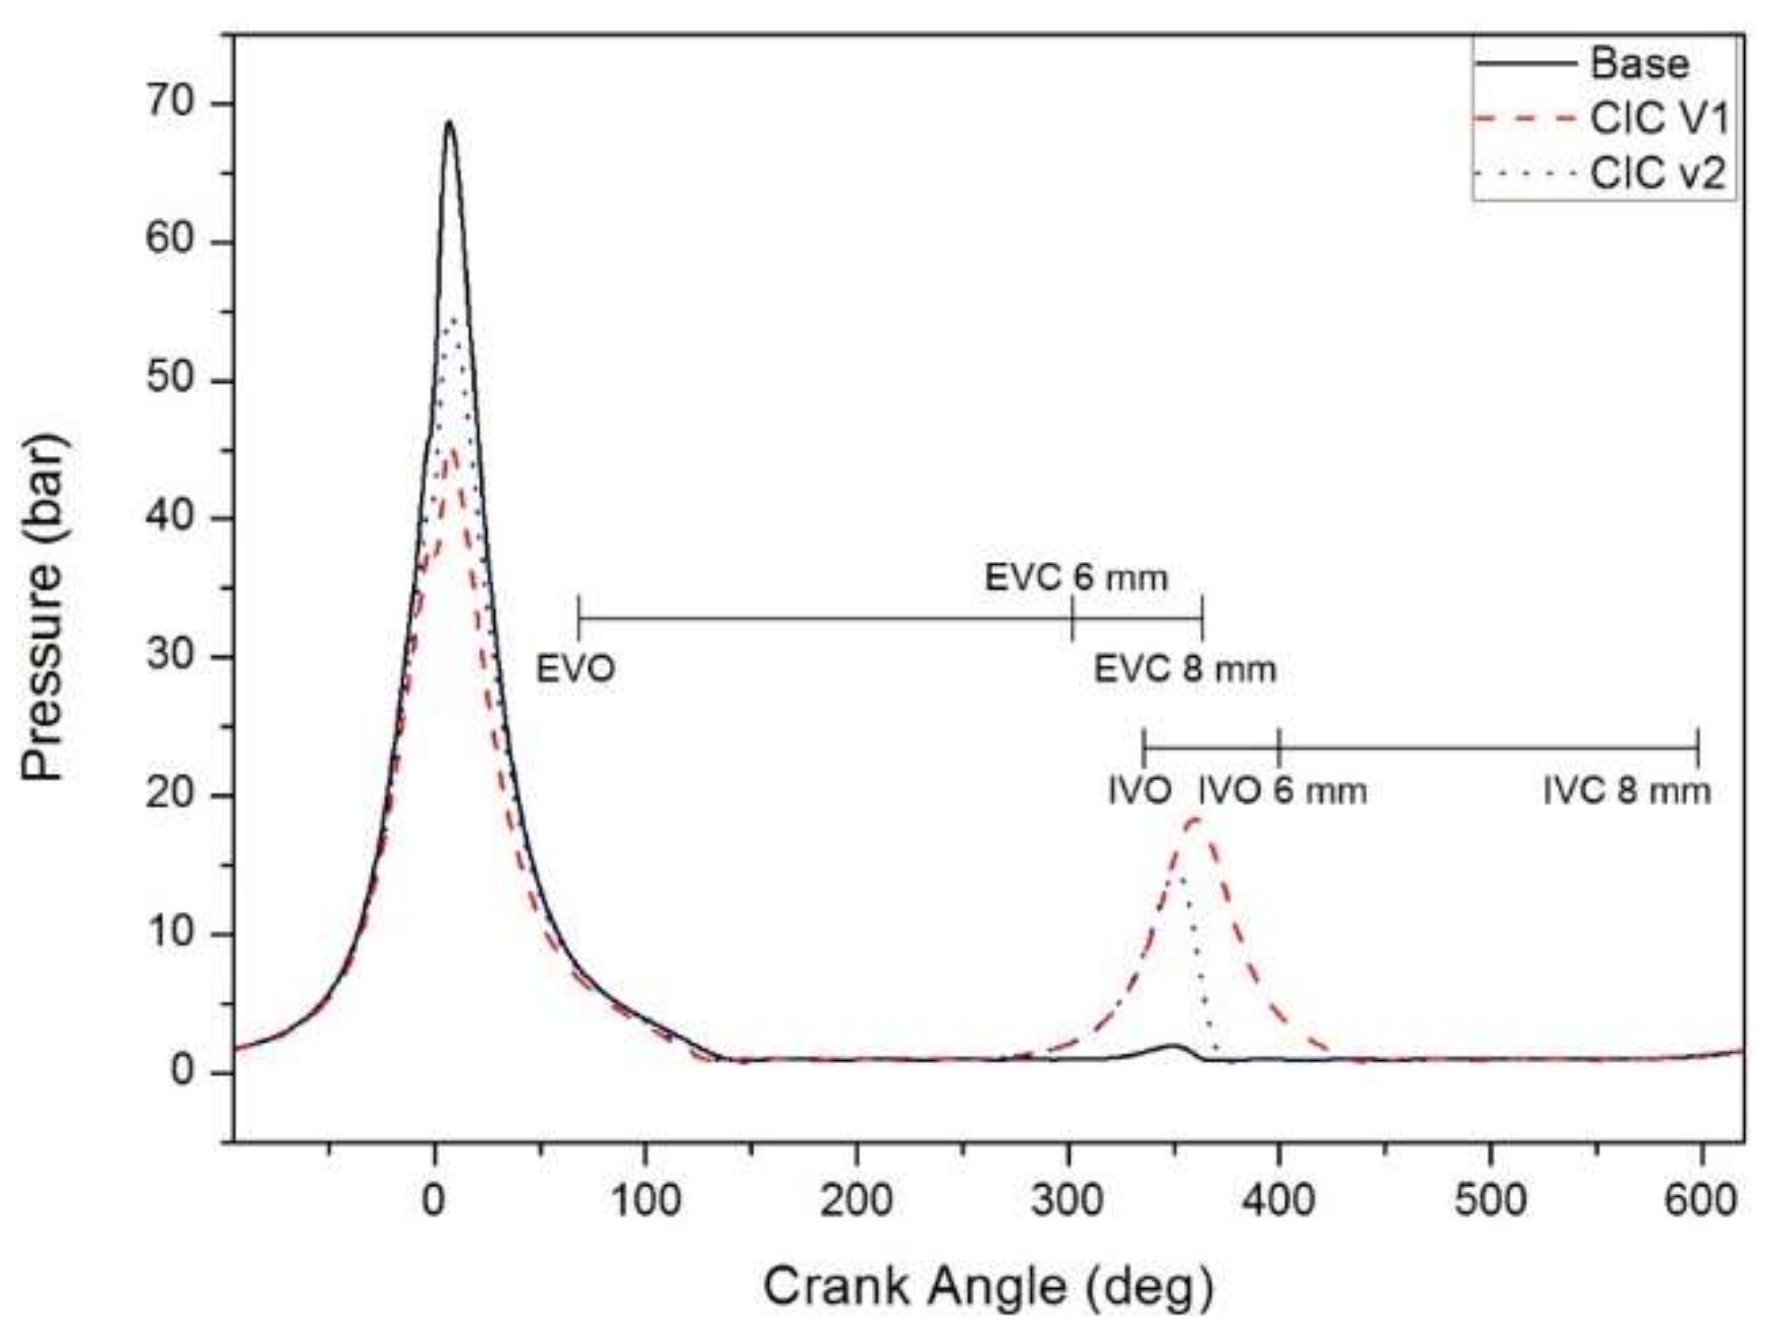
- Recompression internal EGR leads to negative valve overlap effects and a higher temperature in engine operation, due to its trapping of burnt gas and limited air flow, creating a high temperature inside the cylinder. The earlier the exhaust valve closes during the exhaust stroke, as in the case of a larger NVO, the greater the amount of the hot exhaust gas from the previous engine cycle would be trapped in the cylinder. This leaves less room in the cylinder for the in-coming fresh air mass, thereby increasing the cylinder charge temperature while decreasing the oxygen level in the cylinder charge. As a result, there is an optimal setting of NVO for each operating condition to achieve the best engine performance.
- (2)
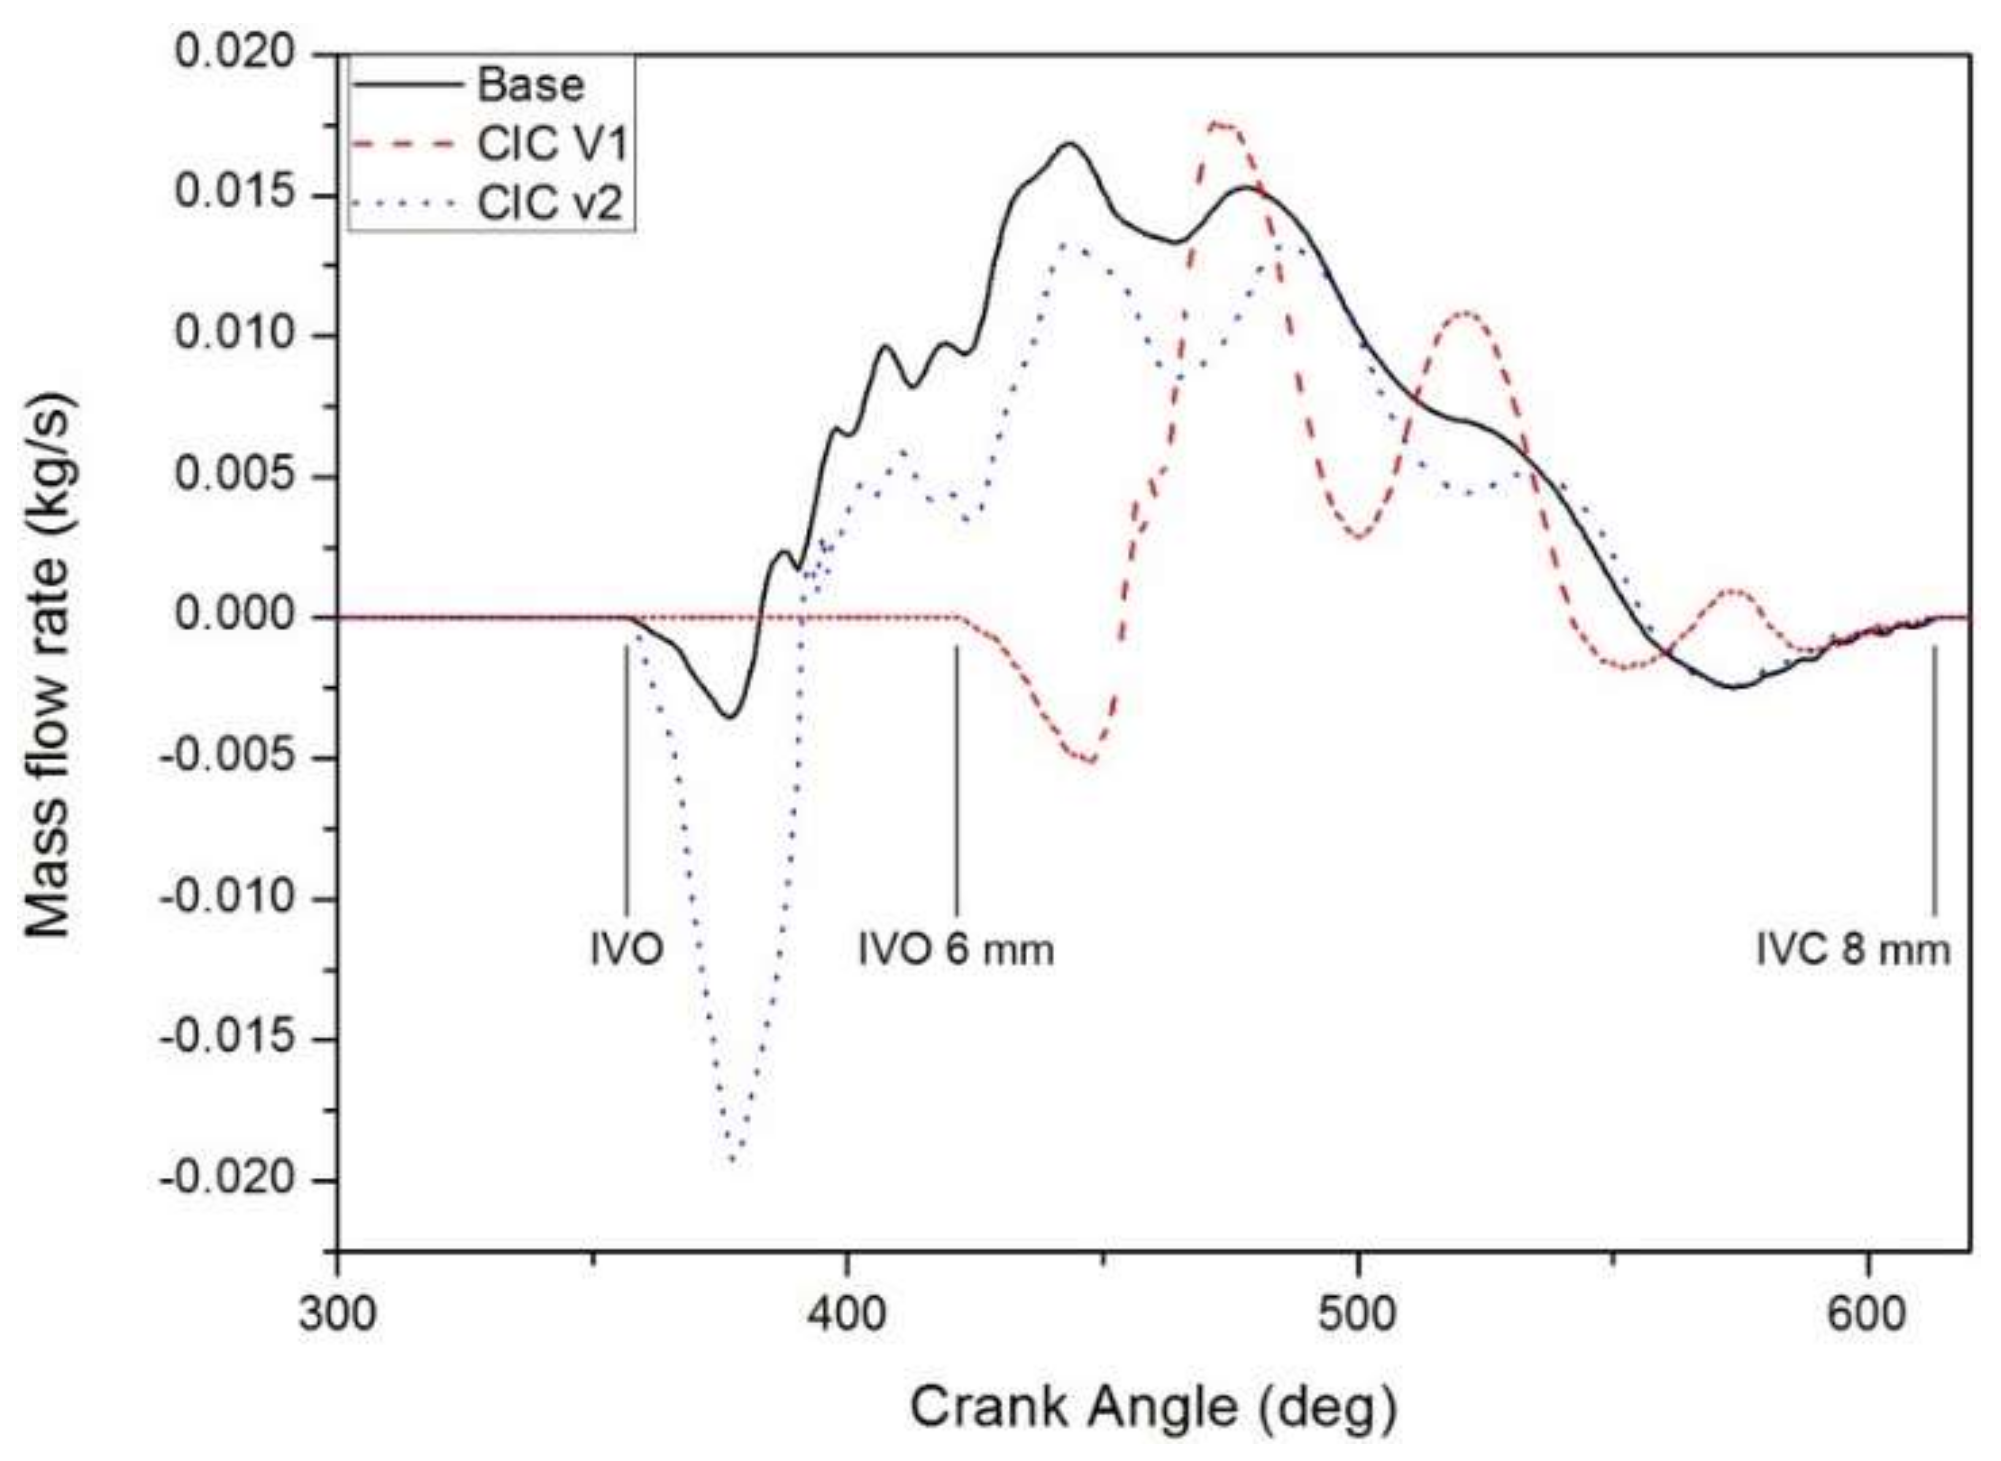
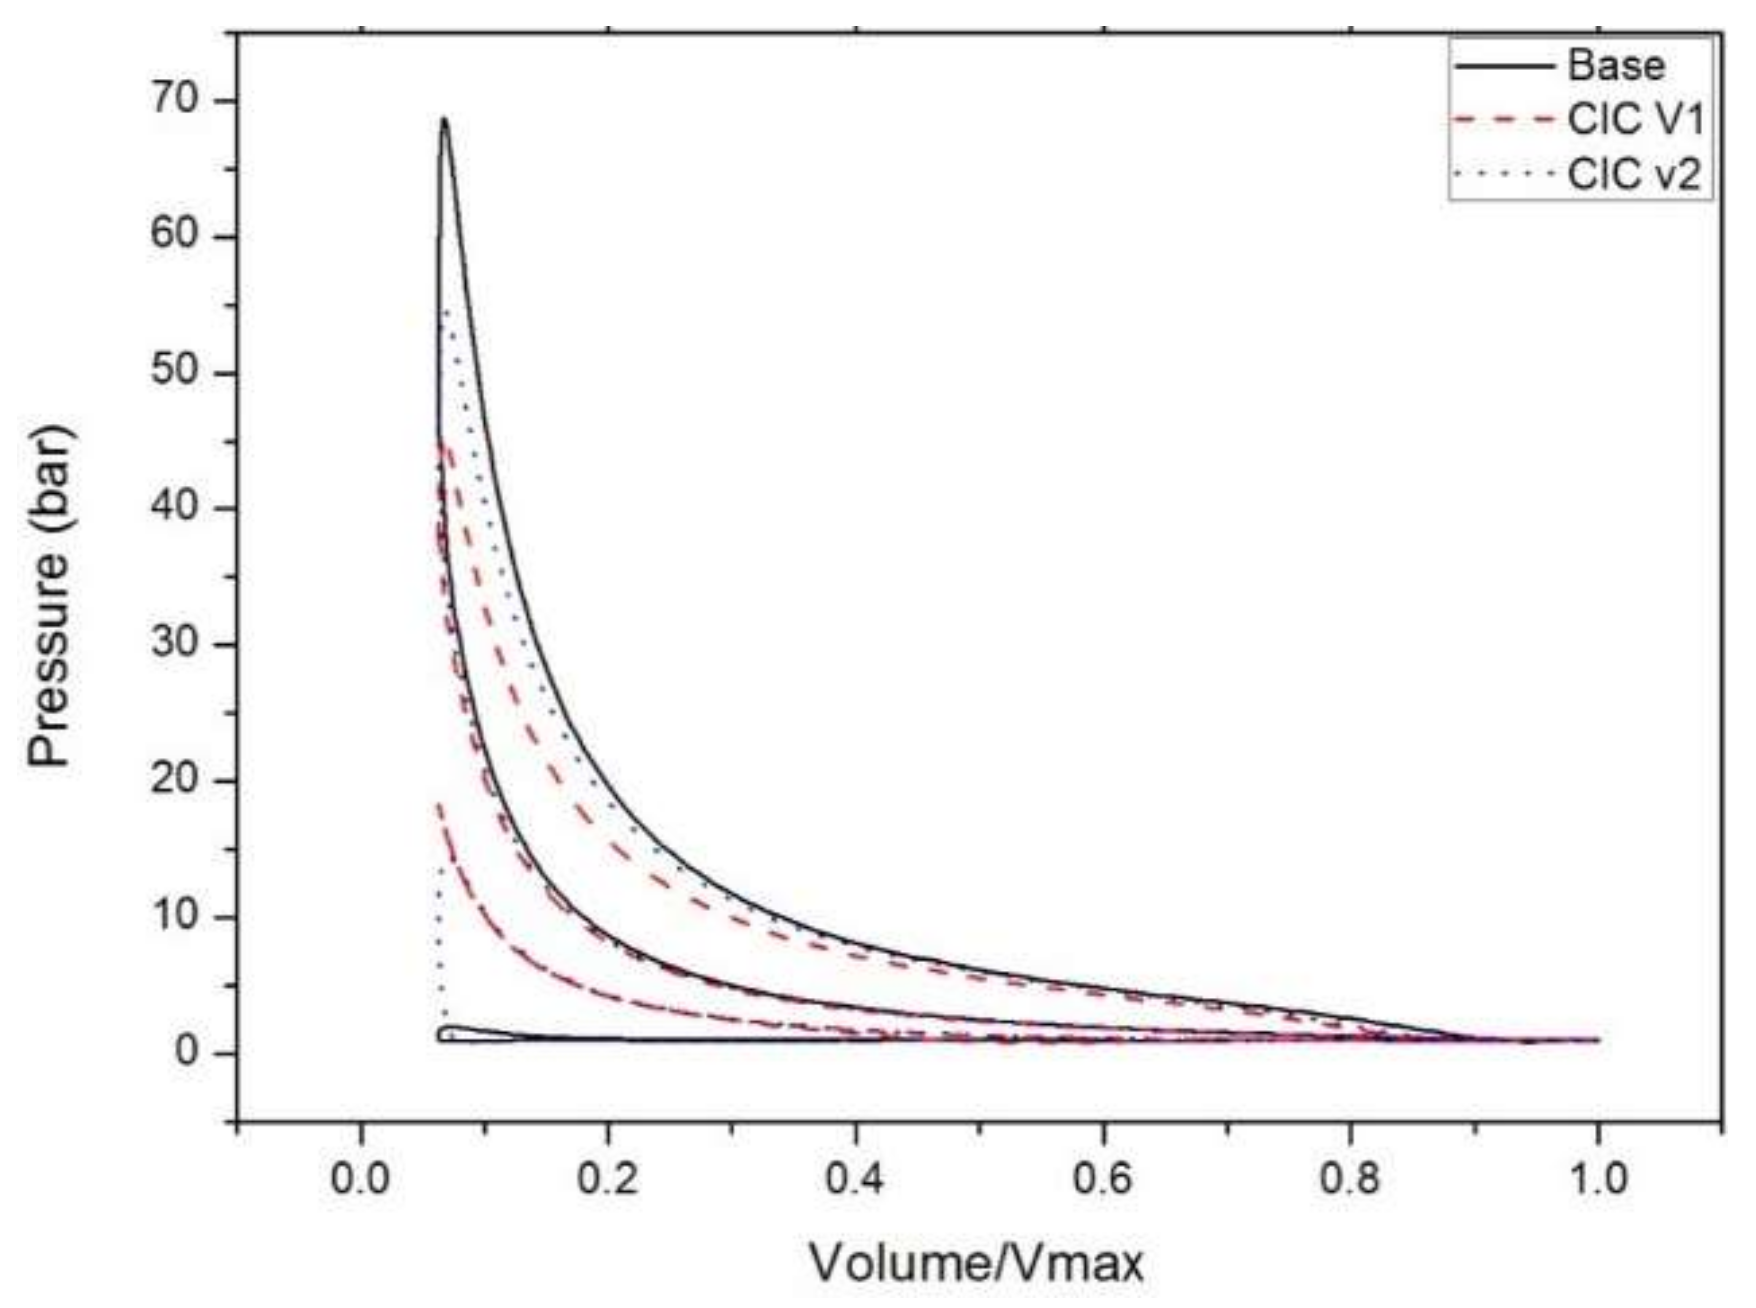
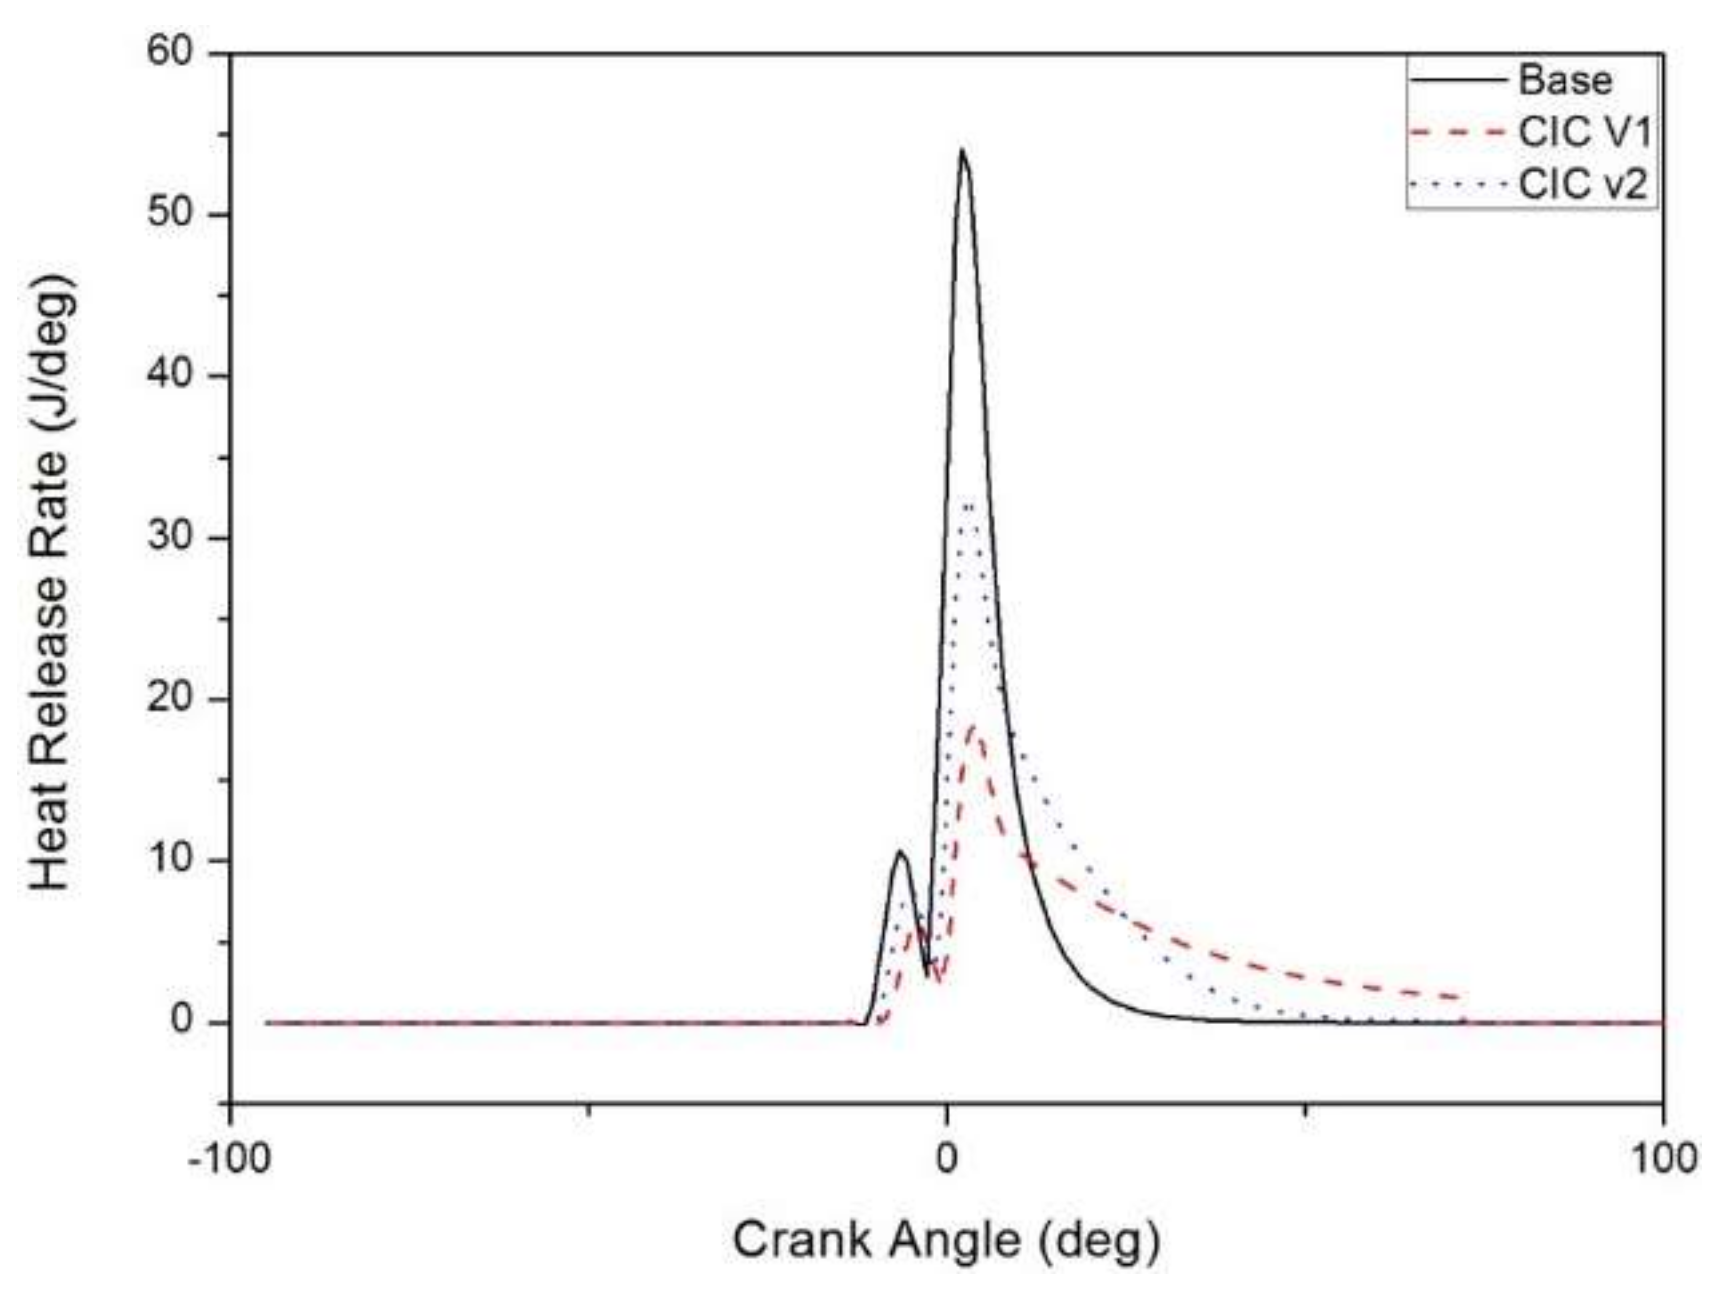
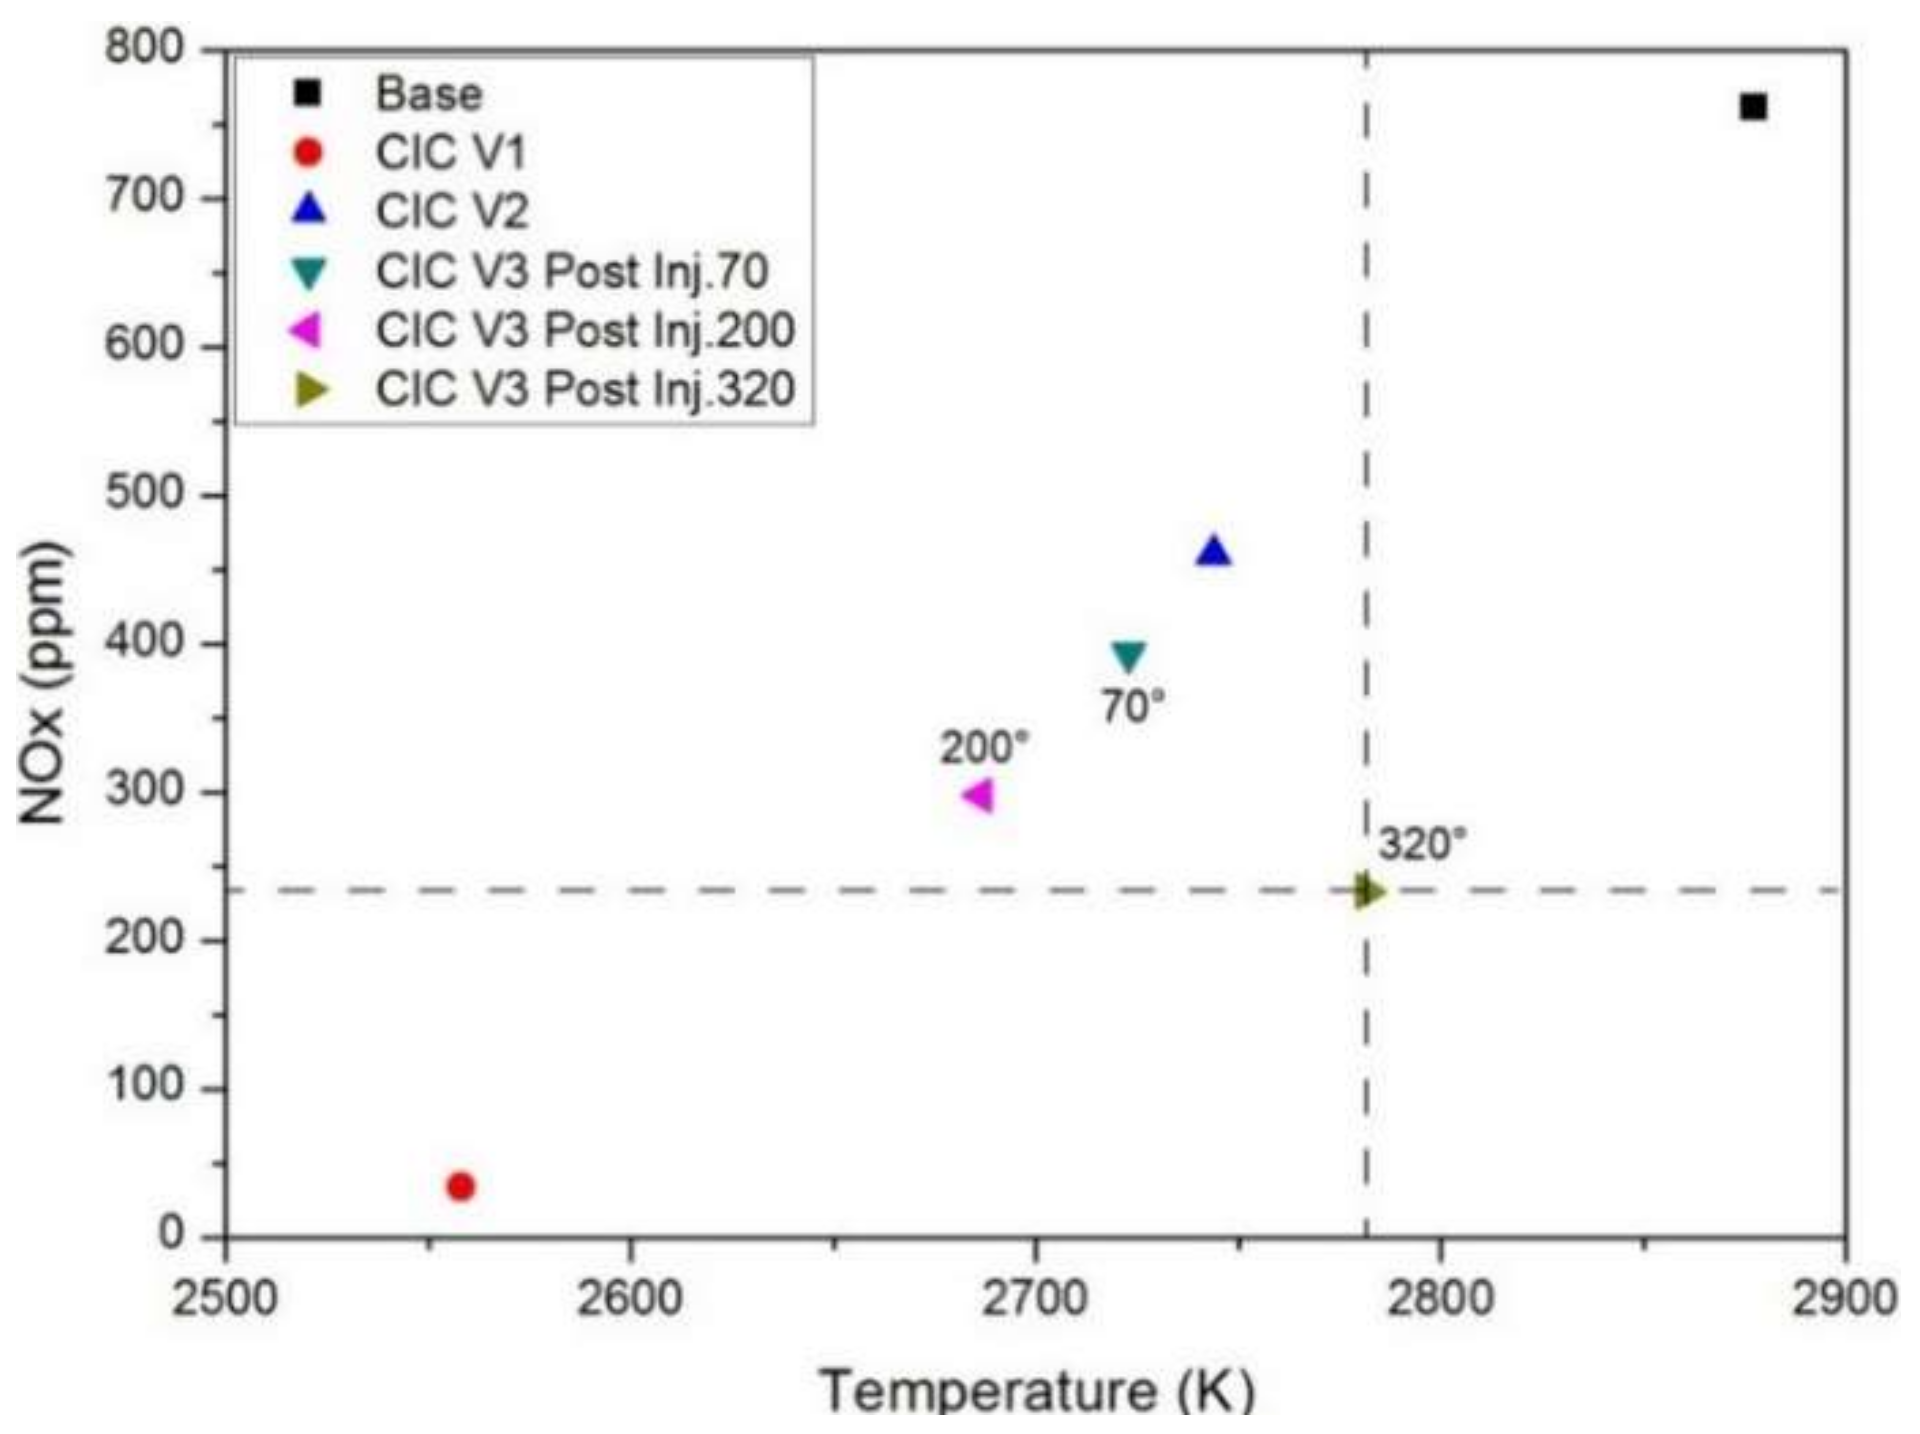
- The CIC V2 case is used for enhancing the internal EGR rate, which is reduced in both the lifting and duration of the exhaust valve without control of the intake valve, thus the operating temperature is decreased overall, but a higher temperature is seen at the main combustion period than in the “Base” and CIC V1 cases. This is caused by the inflow of more fresh air while keeping internal gas in the cylinder and increasing the discharging of burnt gas through the intake valve. Therefore, effective work has risen due to a pressure drop in the intake stroke and the rising of pressure at the main combustion, compared with the CIC V1 case.
- (3)
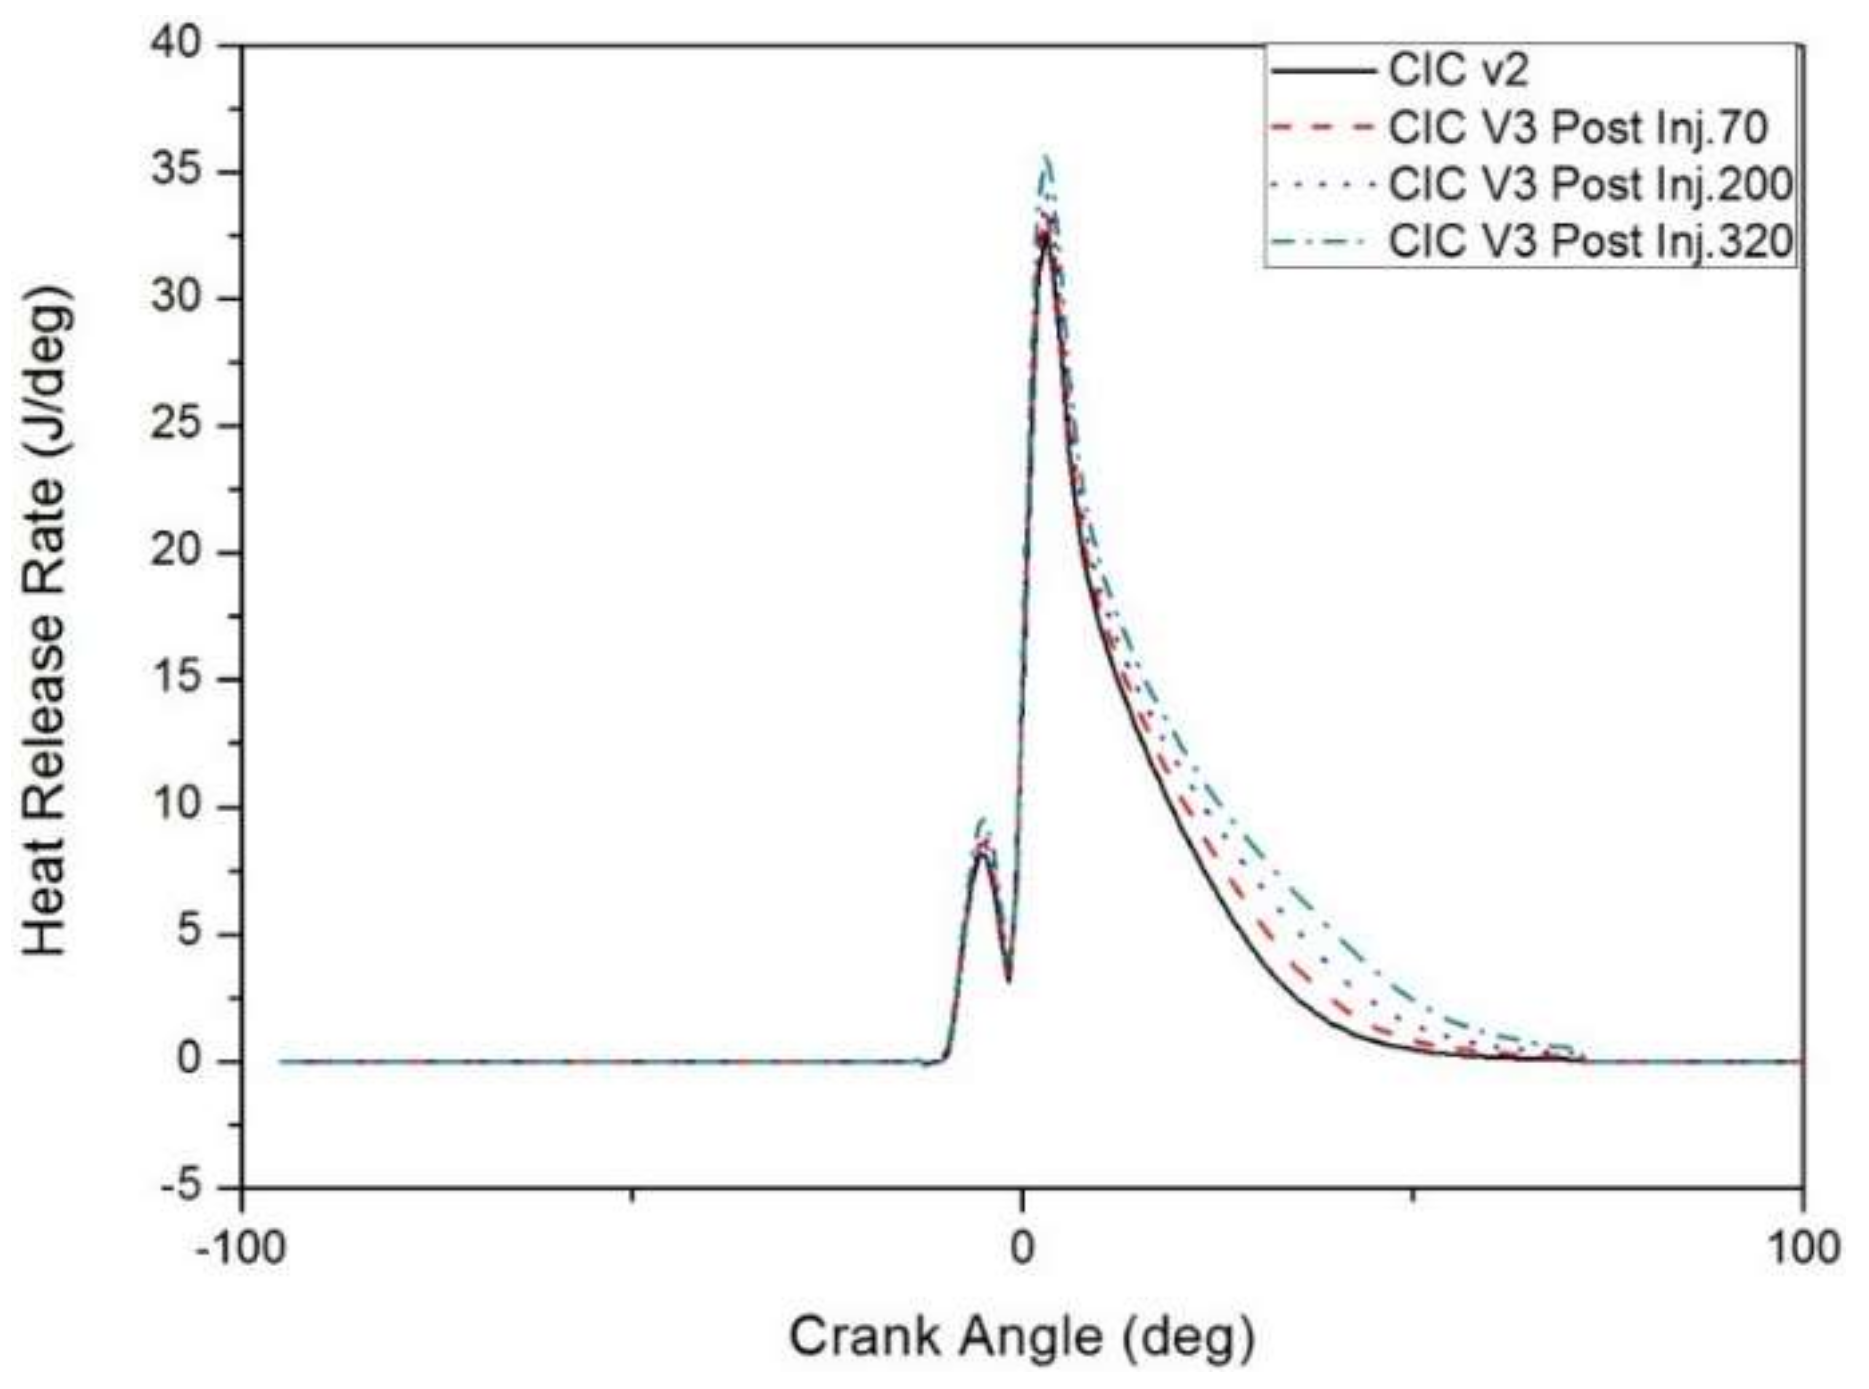
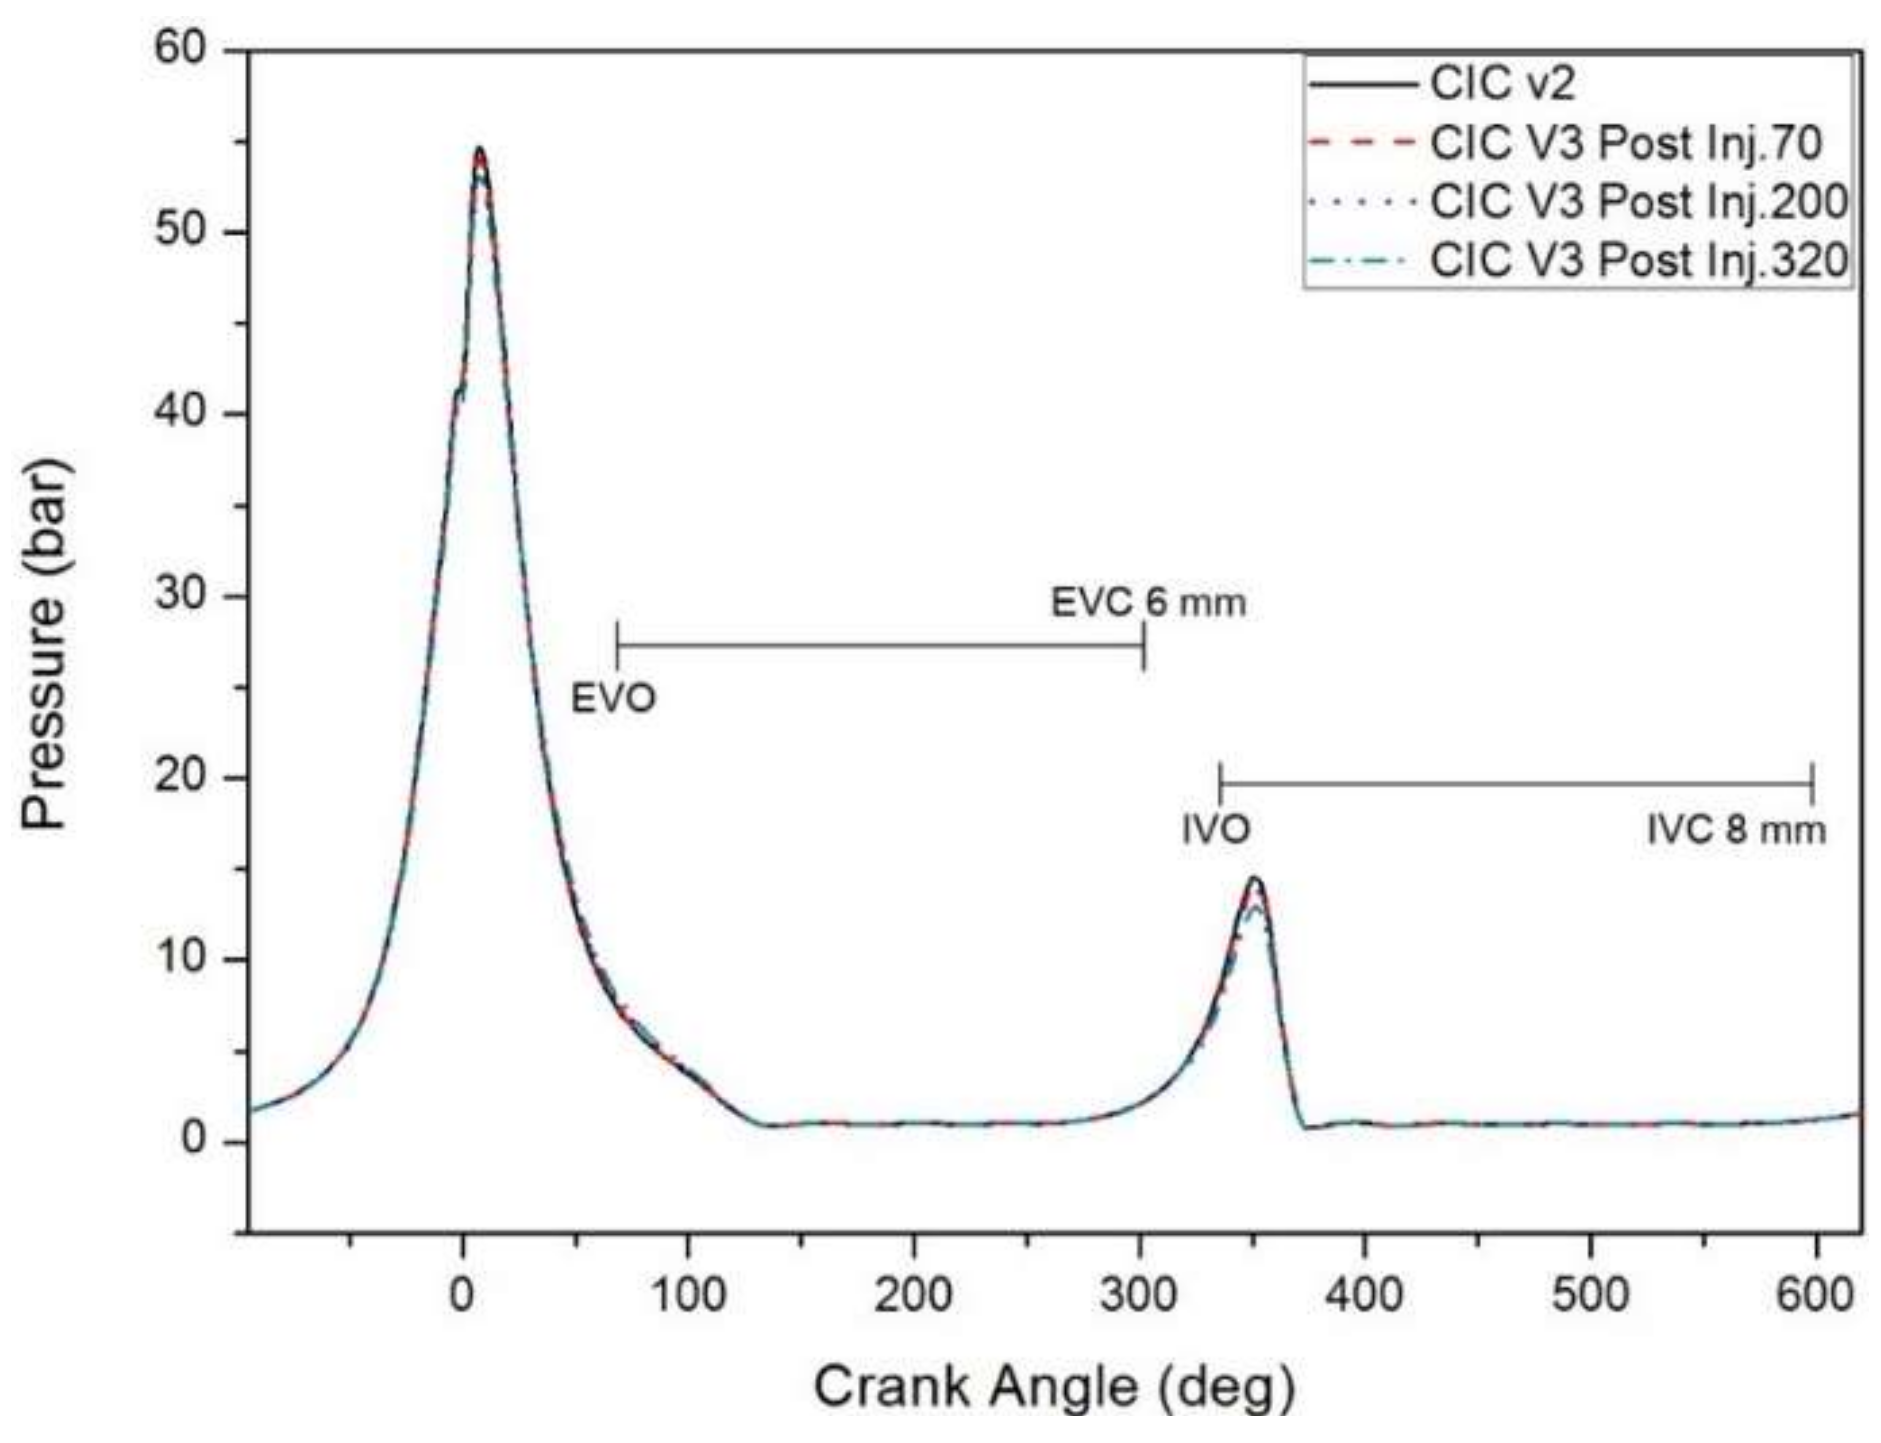
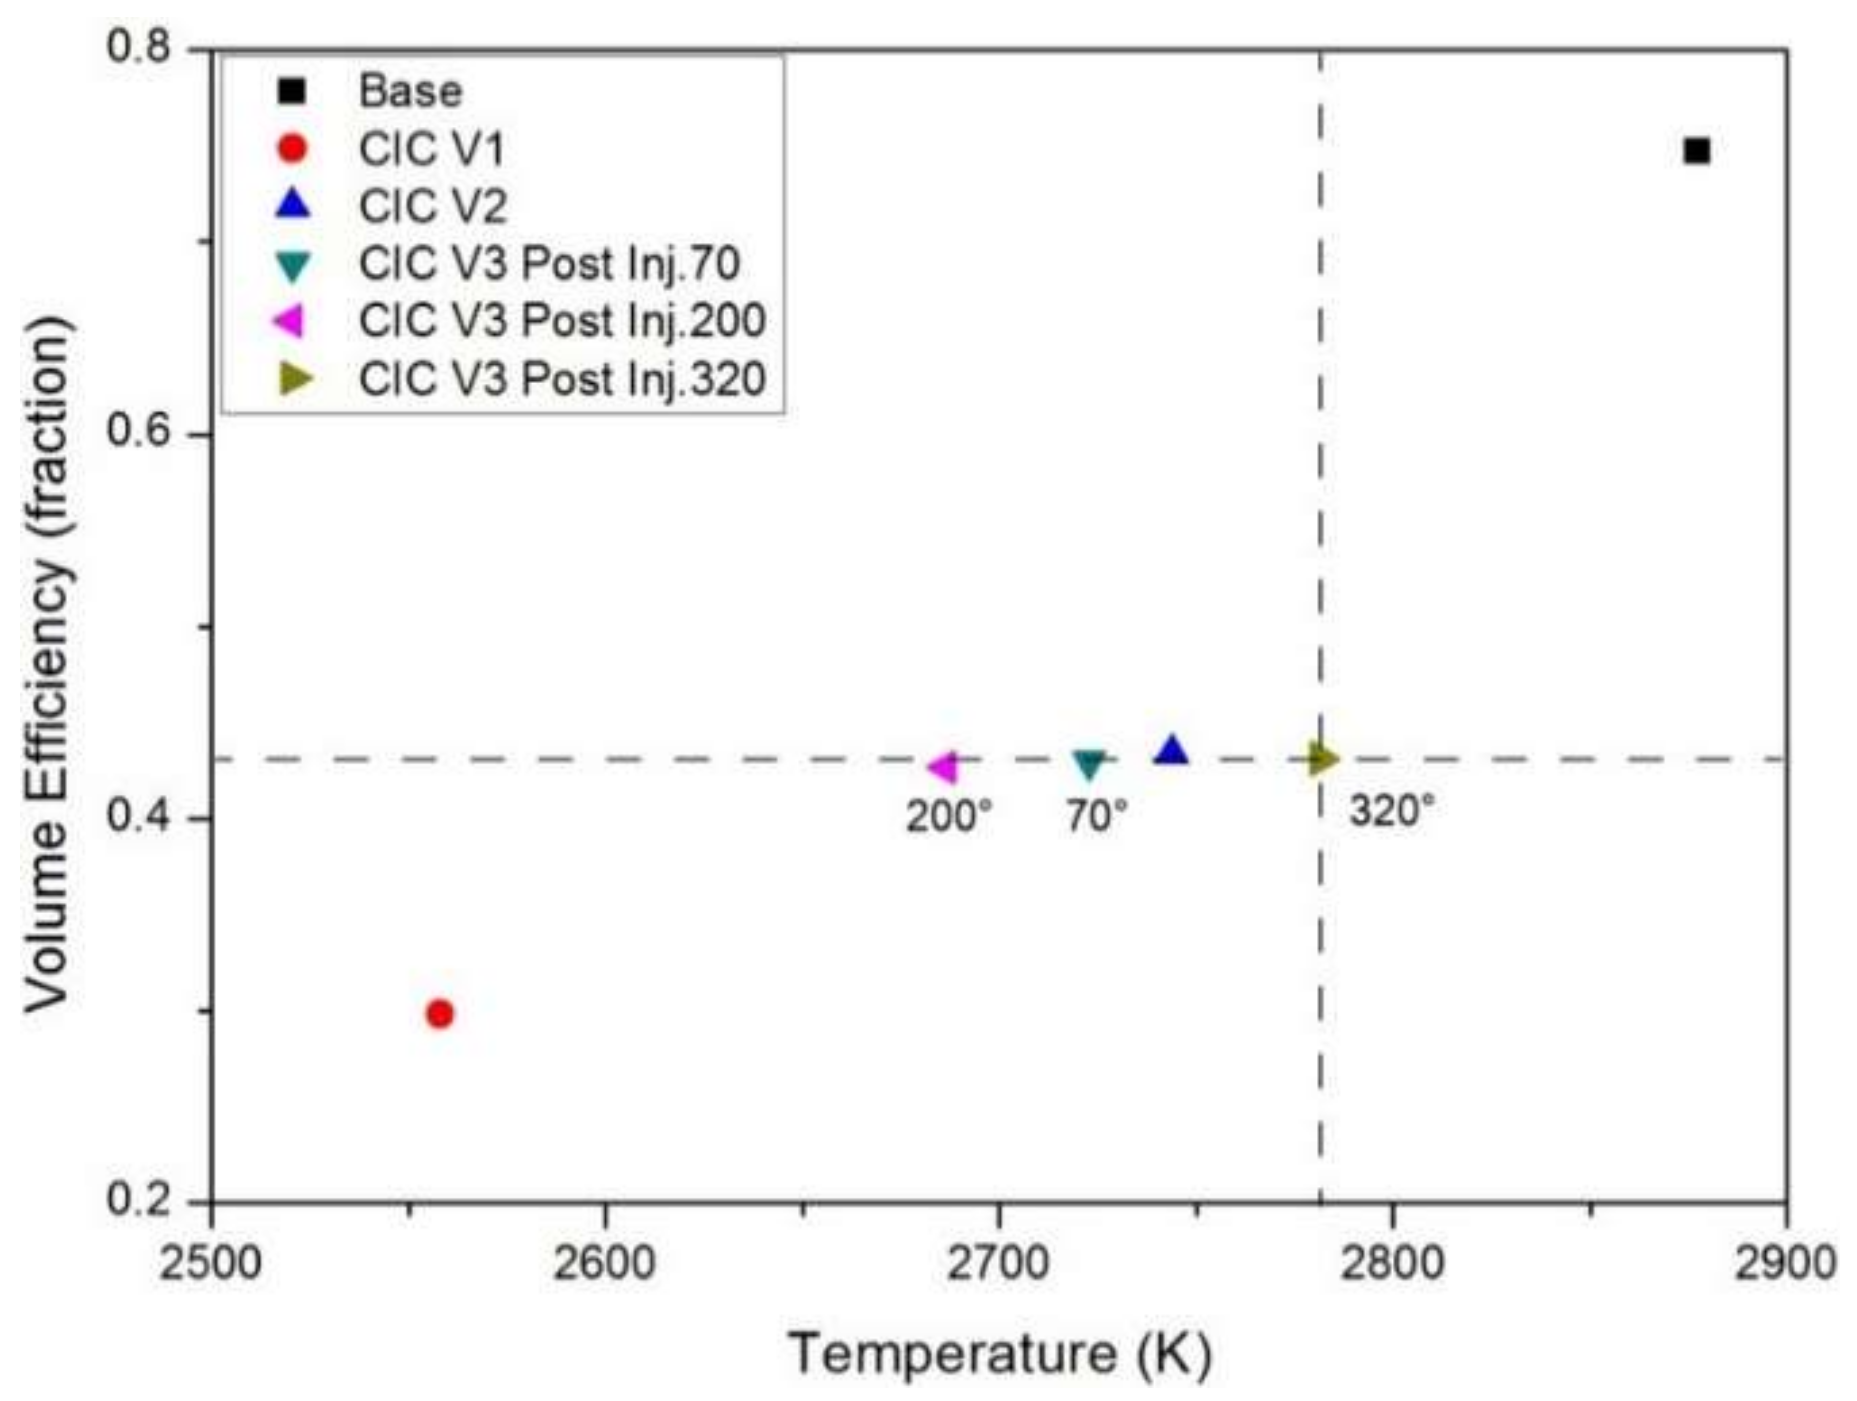
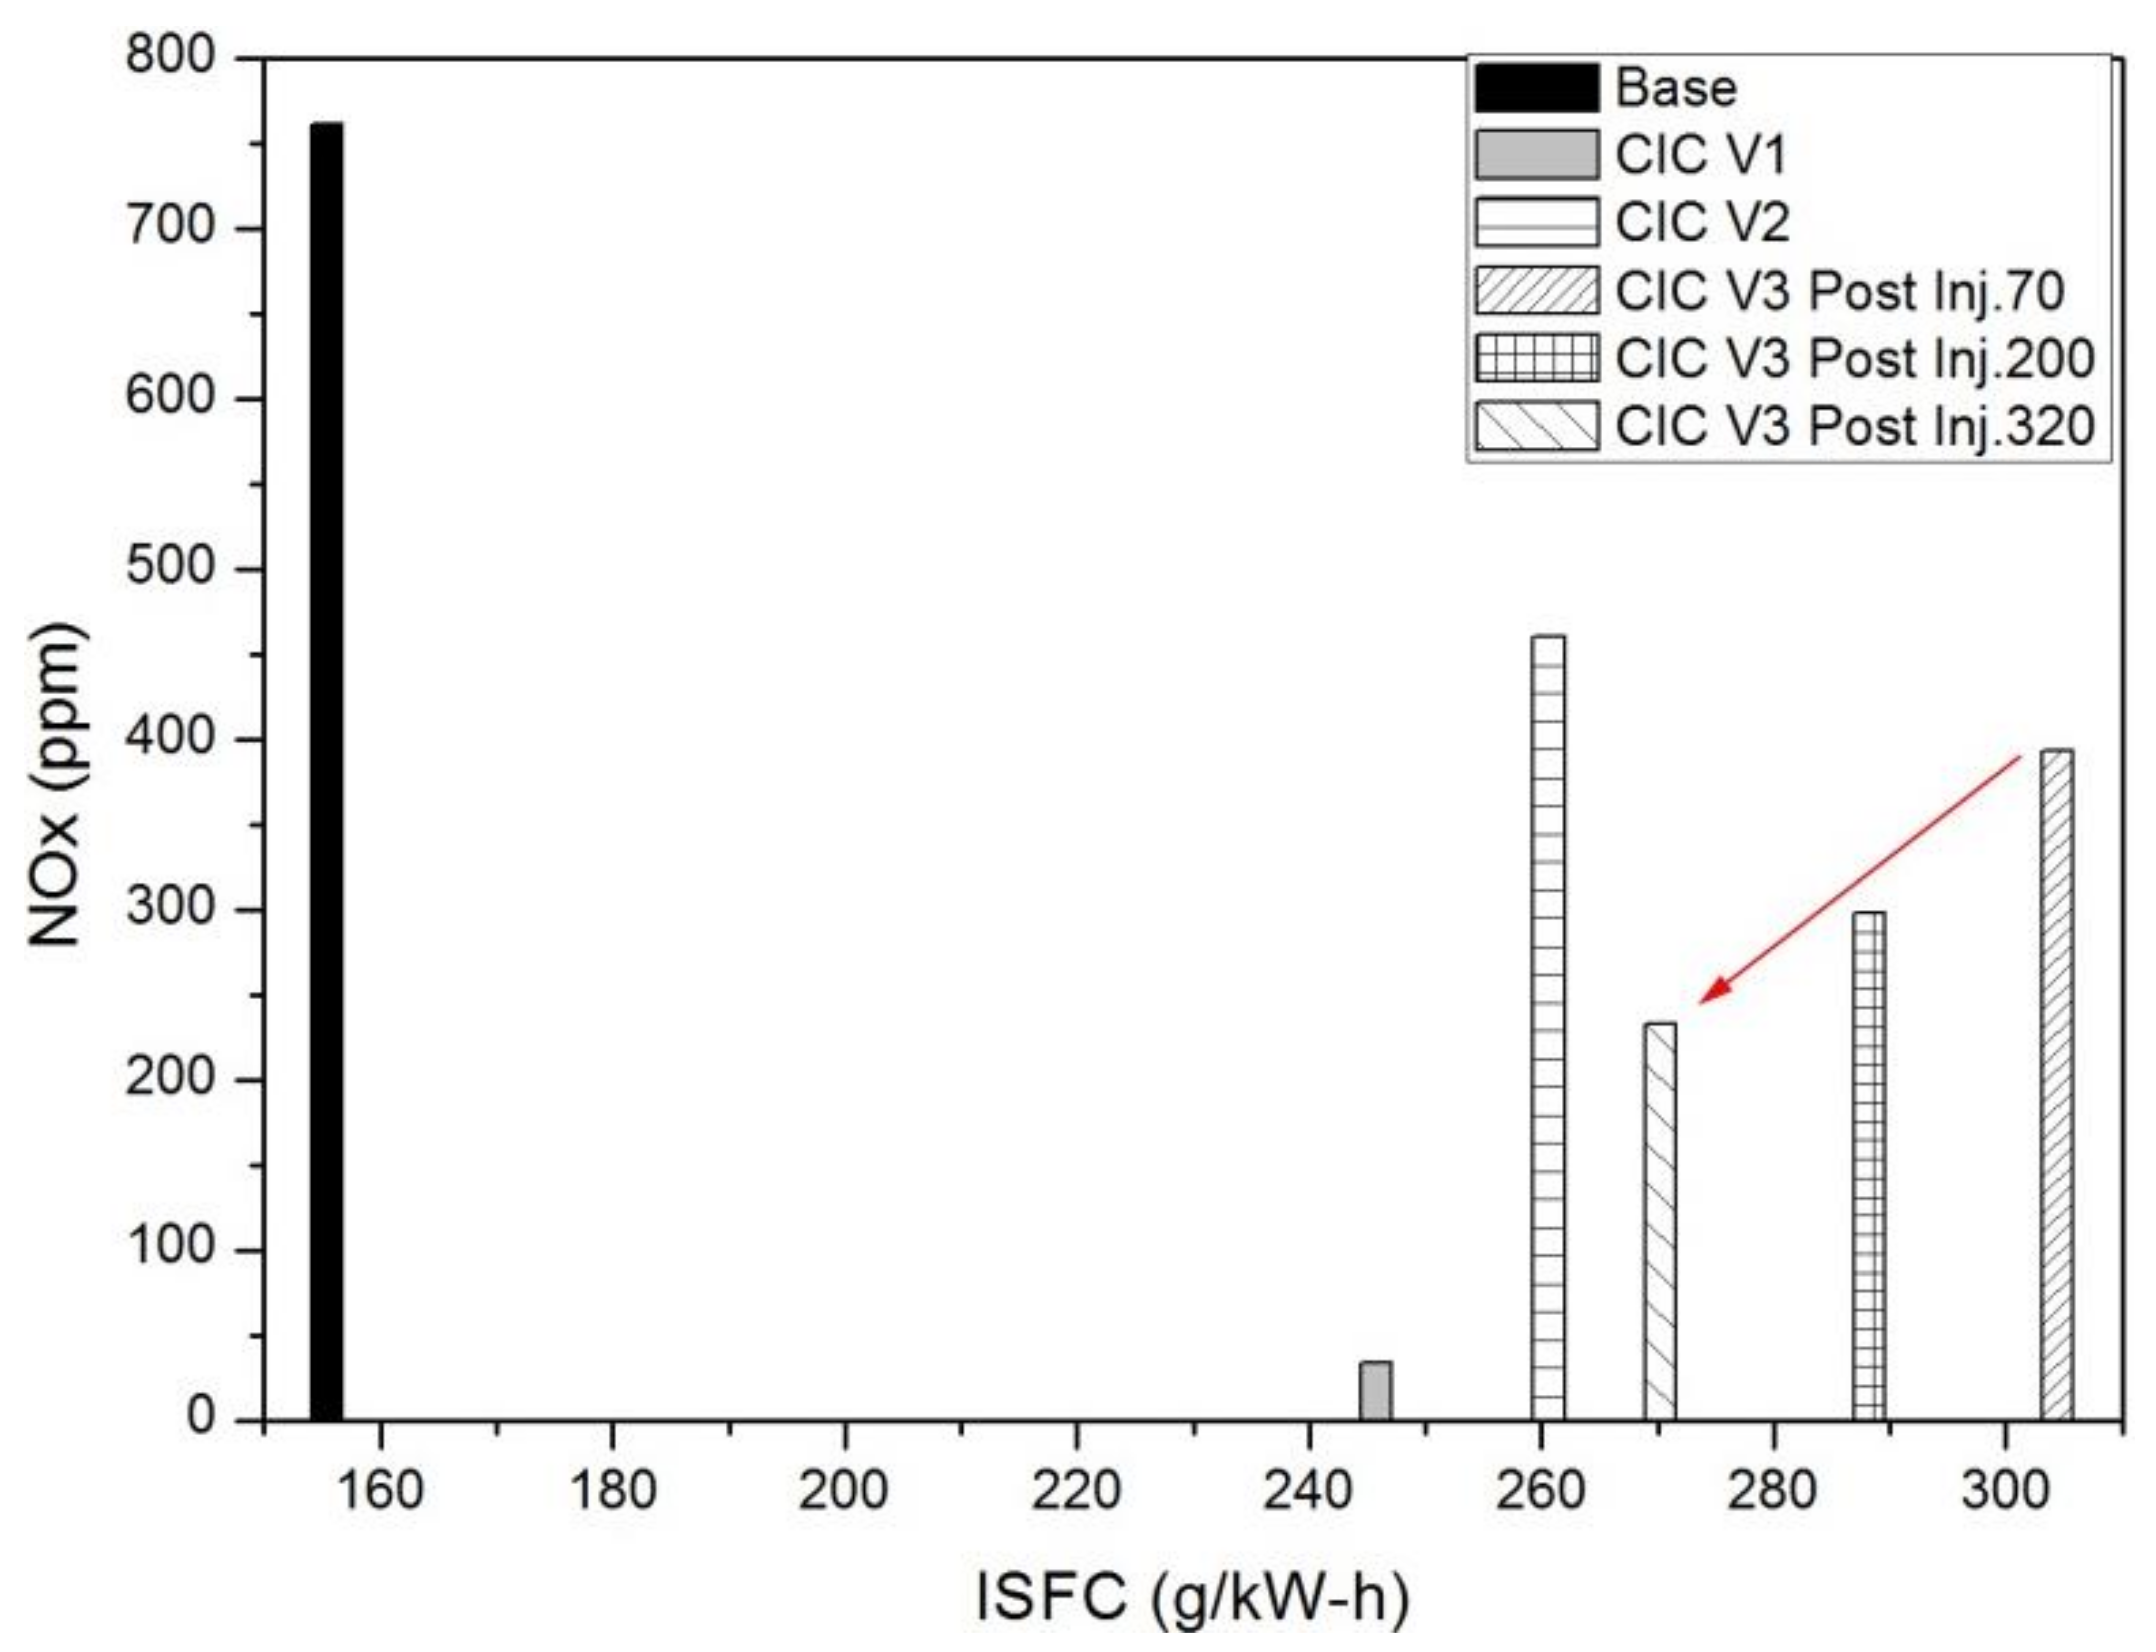
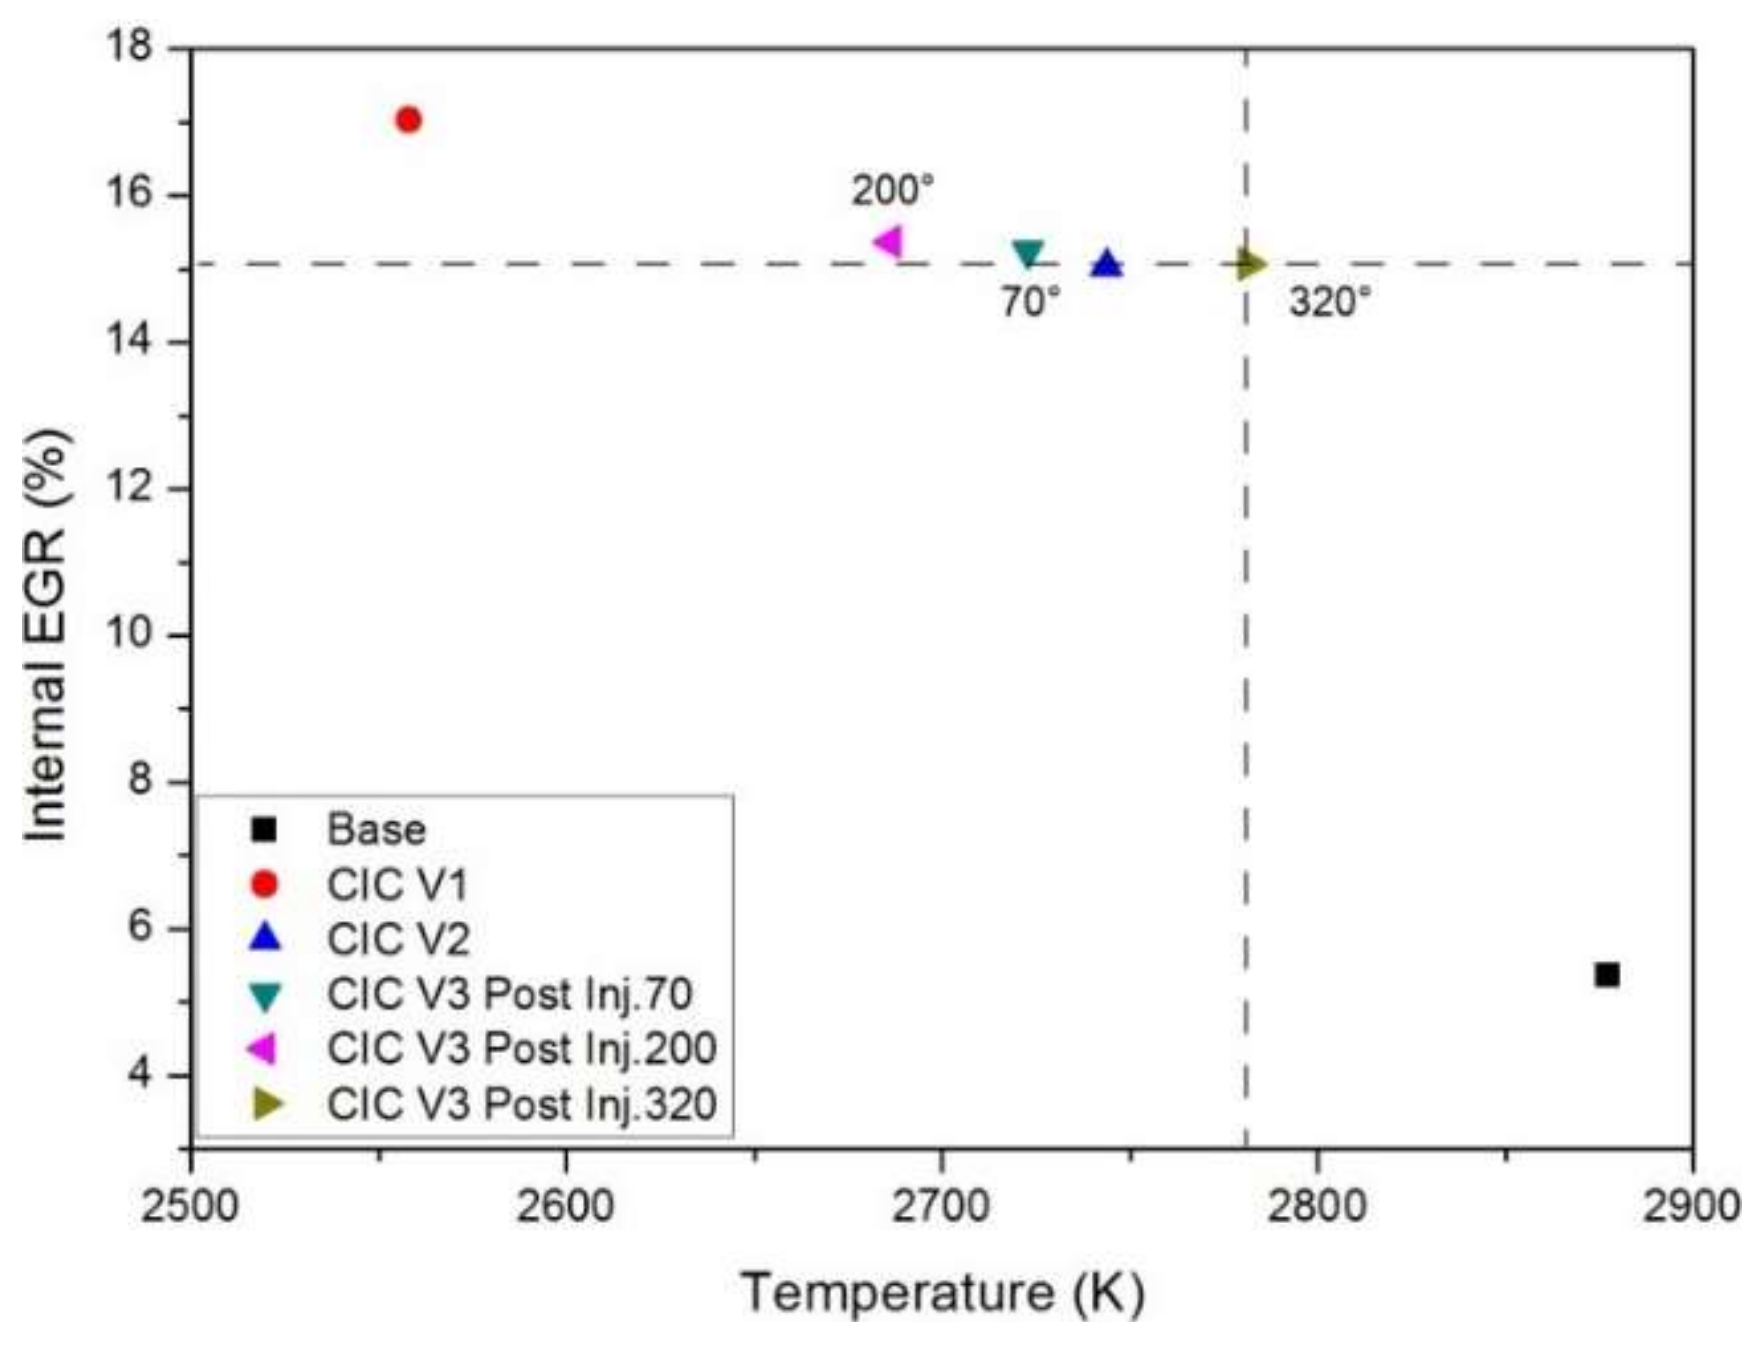
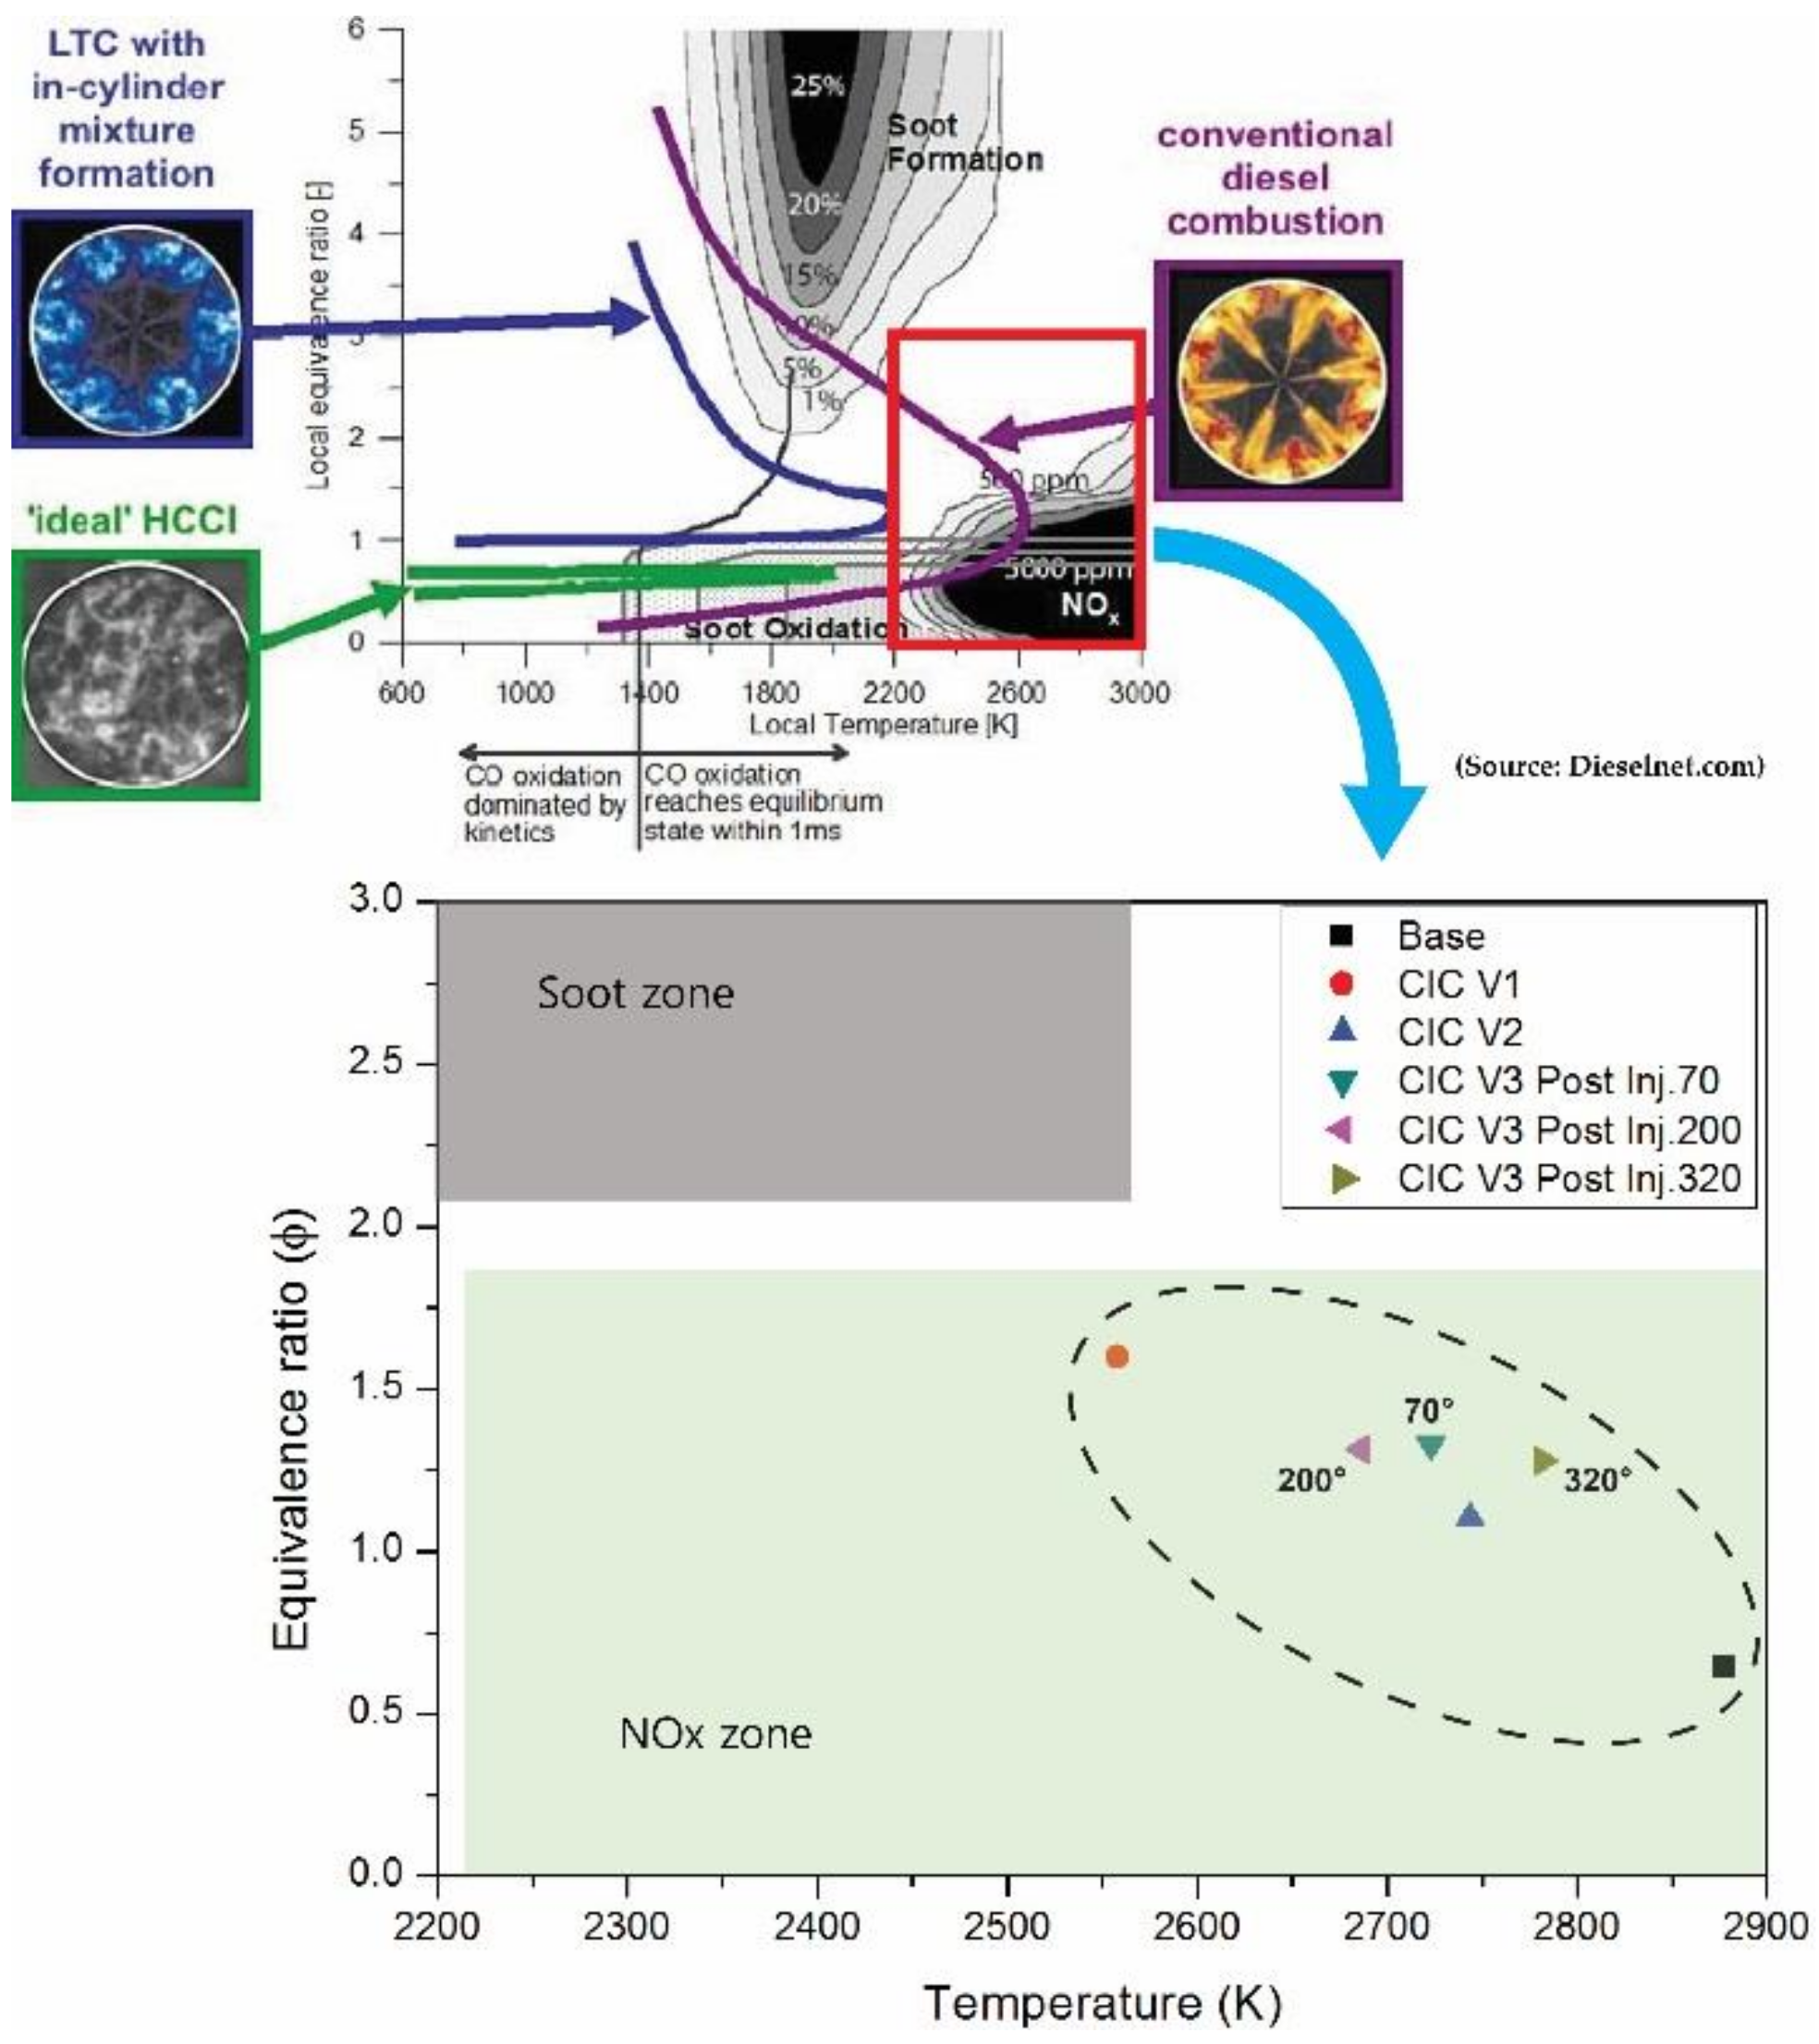
- For the use of thermal energy wasted when adjusting recompression by variable valve actuation, post injection with three cases was applied with total injected fuel of 20% based on CIC V2. Each post injection shows a similar volume efficiency, but retarded post injection timing caused an increase in IMEP, as well as a reduction of both ISFC and NOx. In the case of post injection at 320°, when increasing the pressure and temperature for both intake and exhaust valves, which were closed in the recompression period, the highest engine operating temperature was seen, but there were lower emissions of NOx than in other post injection cases.
- (4)
- The recompression internal EGR is effective in utilizing heat energy by enhancing the EGR rate by about 10%. Additionally, recompression with retarded post injection is beneficial to IMEP with NOx reduction, even if CIC V1 with no-full lift and duration of the intake and exhaust valve has an internal EGR rate of about 2% higher than that of CIC V2 with no-full lift and duration of the exhaust valve.
- (5)
- Finally, the internal EGR scheme with variable exhaust valve actuation in a diesel engine is advantageous to apply post injection from the viewpoint of utilizing thermal energy. However, since the ISFC increases according to post-injection conditions, it is necessary to consider the maximum use of exhaust heat energy for NOx reduction.
Acknowledgments
Author Contributions
Conflicts of Interest
References
- Johnson, T.V. Review of Vehicular Emissions Trends. SAE Int. J. Engines 2015, 8, 1152–1167. [Google Scholar] [CrossRef]
- Tran, T.H.T.; Enomoto, H.; Nishioka, K.; Simizu, K. Development of Small Gasoline Engine with Electronic Variable Valve Timing Unit; SAE Technical Paper 2011-32-0579; SAE International: Warrendale, PA, USA, 2011. [Google Scholar]
- Johnson, T.; Joshi, A. Review of Vehicle Engine Efficiency and Emissions; SAE Technical Paper 2017-01-0907; SAE International: Warrendale, PA, USA, 2017. [Google Scholar]
- Bharath, A.N.; Yang, Y.; Reitz, R.D.; Rutland, C. Comparison of Variable Valve Actuation, Cylinder Deactivation and Injection Strategies for Low-Load RCCI Operation of a Light Duty Engine; SAE International 2015-01-0843; SAE International: Warrendale, PA, USA, 2015. [Google Scholar]
- Baratta, M.; Finesso, R.; Misul, D.; Spessa, E. Comparison between Internal and External EGR Performance on a Heavy Duty Diesel Engine by Means of a Refined 1D Fluid-Dynamic Engine Model; SAE International 2015-24-2389; SAE International: Warrendale, PA, USA, 2015. [Google Scholar]
- Shimada, T.; Yoshida, Y.; Rin, C.; Yamada, M.; Ito, N.; Iijima, A.; Yoshida, K.; Shoji, H. Influence of Internal EGR on Knocking in an HCCI Engine. In Proceedings of the JSAE/SAE 2015 Small Engine Technologies Conference, Osaka, Japan, 17–19 November 2015. [Google Scholar]
- Piano, A.; Millo, F.; Di Nunno, D.; Gallone, A. Numerical Analysis on the Potential of Different Variable Valve Actuation Strategies on a Light Duty Diesel Engine for Improving Exhaust System Warm Up; SAE Technical Paper 2017-24-0024; SAE International: Warrendale, PA, USA, 2017. [Google Scholar]
- Gonzalez, D.M.; Di Nunno, D. Internal Exhaust Gas Recirculation for Efficiency and Emissions in a 4-Cylinder Diesel Engine; SAE Technical Paper 2016-01-2184; SAE International: Warrendale, PA, USA, 2016. [Google Scholar]
- Guan, W.; Pedrozo, V.; Zhao, H.; Ban, Z.; Lin, T. Investigation of EGR and Miller Cycle for NOx Emissions and Exhaust Temperature Control of a Heavy-Duty Diesel Engine; SAE Technical Paper 2017-01-2227; SAE International: Warrendale, PA, USA, 2017. [Google Scholar]
- Deppenkemper, K.; Özyalcin, C.; Ehrly, M.; Pischinger, S. 1D engine simulation approach for optimizing engine and exhaust aftertreatment thermal management for passenger car diesel engines by means of variable valve train (VVT) applications. In Proceedings of the 2018 SAE World Congress Experience Conference, Detroit, MI, USA, 10–12 April 2018. [Google Scholar]
- Martin, J.; Sun, C.; Boehman, A.; O’Connor, J. Experimental Study of Post Injection Scheduling for Soot Reduction in a Light-Duty Turbodiesel Engine; SAE Technical Paper 2016-01-0726; SAE International: Warrendale, PA, USA, 2016. [Google Scholar]
- Han, S.; Kim, J.; Lee, J. A Study on the Optimal Actuation Structure Design of a Direct Needle-Driven Piezo Injector for a CRDi Engine. Appl. Sci. 2017, 7, 320. [Google Scholar] [CrossRef]
- O’Connor, J.; Musculus, M. Post Injections for Soot Reduction in Diesel Engines: A Review of Current Understanding; 2013 SAE International 2013-01-0917; SAE International: Warrendale, PA, USA, 2013. [Google Scholar]


| Low Load | Low, Middle Load |
| Fuel Injection Quantity: 12 mg | Fuel Injection Quantity: 12 & 19.8 mg |
| Idle + Low Speed | Middle Speed |
| Engine speed: 800 rpm | Engine speed: 1200~2000 rpm |
| Item | Unit | Specification | |
|---|---|---|---|
| Bore x Stroke | mm | 88 × 90 | |
| Displacement | cc | 499 | |
| Valve per cylinder | - | 4 (2 intake and 2 exhaust) | |
| Compression ration | - | 16 | |
| Intake valve | CAD | IVO | bTDC 10 |
| IVC | aBDC 28 | ||
| Exhaust valve | CAD | EVO | bBDC 54 |
| EVC | aTDC 4 | ||
| Case | Valve Profile | Description |
|---|---|---|
| Base | 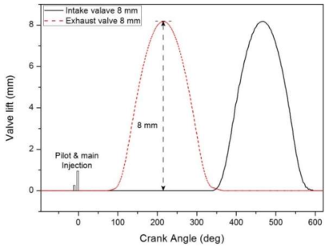 | All valve lift 8 mm |
| CIC V1 | 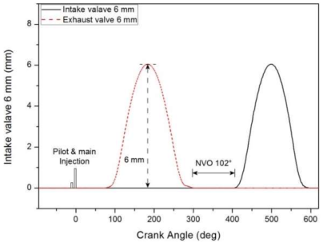 | Recompression + All valve lifting 6 mm + Negative valve overlap |
| CIC V2 |  | Recompression + Exhaust valve lifting 6 mm + Intake valve lifting 8 mm + Negative valve overlap |
| CIC V3 |  | CIC V2 + Post injection (Three fuel injection timing: 70°, 200°, 320°) |
| Item | Specification |
|---|---|
| Engine speed (rpm) | 1200 |
| Fuel injection quantity (mg) | 12 |
| Fuel injection pressure (bar) | 600 |
| Intake & Exhaust valve lift (mm) | 8 |
| Injection | Pilot | Main |
|---|---|---|
| Fuel injection timing (deg) | 15 ATDC | 5 ATDC |
| Fuel injection quantity (mg) | 1.4 | 11.1 |
© 2018 by the authors. Licensee MDPI, Basel, Switzerland. This article is an open access article distributed under the terms and conditions of the Creative Commons Attribution (CC BY) license (http://creativecommons.org/licenses/by/4.0/).
Share and Cite
Cho, I.; Lee, Y.; Lee, J. Investigation on the Effects of Internal EGR by Variable Exhaust Valve Actuation with Post Injection on Auto-ignited Combustion and Emission Performance. Appl. Sci. 2018, 8, 597. https://doi.org/10.3390/app8040597
Cho I, Lee Y, Lee J. Investigation on the Effects of Internal EGR by Variable Exhaust Valve Actuation with Post Injection on Auto-ignited Combustion and Emission Performance. Applied Sciences. 2018; 8(4):597. https://doi.org/10.3390/app8040597
Chicago/Turabian StyleCho, Insu, Yumin Lee, and Jinwook Lee. 2018. "Investigation on the Effects of Internal EGR by Variable Exhaust Valve Actuation with Post Injection on Auto-ignited Combustion and Emission Performance" Applied Sciences 8, no. 4: 597. https://doi.org/10.3390/app8040597
APA StyleCho, I., Lee, Y., & Lee, J. (2018). Investigation on the Effects of Internal EGR by Variable Exhaust Valve Actuation with Post Injection on Auto-ignited Combustion and Emission Performance. Applied Sciences, 8(4), 597. https://doi.org/10.3390/app8040597