1. Introduction
Owing to the characteristics of a tattoo (i.e., body location, size, depth, age, and pigment color) [
1,
2,
3,
4,
5], a number of tattoo removal techniques are in use, including surgical excision, cryosurgery, chemical destruction, and laser removal [
3,
6,
7,
8,
9]. Currently, laser tattoo removal is considered to be one of the most efficient techniques owing to the selective treatment of the tattoo pigments. Unlike surgical excision, the laser removal method delivers various wavelengths, selectively targets the particular tattoo pigments, and then fragments the pigment into small particles using short pulsed laser light [
10,
11,
12]. These fragments are then removed from the skin through the lymphatic system or trans-epidermal elimination [
13,
14]. In addition, the targeted tattoo pigments specifically absorb laser light with no or minimal injury to the surrounding healthy tissue. Thus, the method can reduce pain, treatment time, and complications [
2,
8,
13].
Typically, laser treatment requires many sessions to completely remove the tattoo from the skin. Thus, the quantification of the amount of tattoo clearance after each treatment can be critical in optimizing treatment parameters such as fluence and repetition rate to minimize the number of the sessions for the complete tattoo removal. Recently, various qualitative assessments have been studied to identify the residual tattoo concentration after a laser treatment, including histology, invisible radiation photography, optical coherence tomography (OCT) [
15,
16], and two-photon microscopy (TPM) [
17]. However, most assessment methods are costly and time consuming (or non-real-time). In particular, OCT can determine the degree of tattoo distribution in the skin after the treatment owing to the absorption/scattering responses of the tattoo in the infrared (IR) spectra. The tattoo can be detected by variations in the contrast between the tattoo pigmented area and the normal skin area with an OCT image [
15,
16]. However, the limitation of this method is that certain inks can be undetectable because of the high transmission in the IR range [
15].
In the current study, we developed a simple imaging device to detect the relative variations in the tattooed skin after laser treatment. Owing to its cost-effectiveness and simple operation, a complementary metal–oxide–semiconductor (CMOS) camera was chosen to acquire the images of the tattooed skin. To minimize external exposure factors (i.e., environmental illumination, intensity, exposure time, etc.), light emitting diodes (LEDs) were used to irradiate the tattooed area in a dark room during image acquisition. In particular, LEDs are a less expensive light source and can emit various wavelengths (e.g., blue, green, and red) with narrow bandwidths and low intensities [
18,
19,
20,
21]. Thus, it was hypothesized that a CMOS camera with cost-effective and small-sized LED sources could be a feasible imaging tool to estimate the contrast variations in the tattooed skin after a laser treatment [
20,
21]. Furthermore, because the laser-treated tattoo can be removed through the lymphatic system or trans-epidermal elimination [
13,
14], the current study evaluated the proposed device in vivo to emulate clinical conditions.
2. Materials and Methods
All animal experimental procedures were implemented in accordance with the guidelines of the Korean National Institute of Health and were approved by the committee on animal care and use at the Pukyong National University (Permit Number: 2016-30). Six Asian mice (150–200 g; eight weeks old) were used as the animal model for the current study. The mice were fed in an individual 108 cm
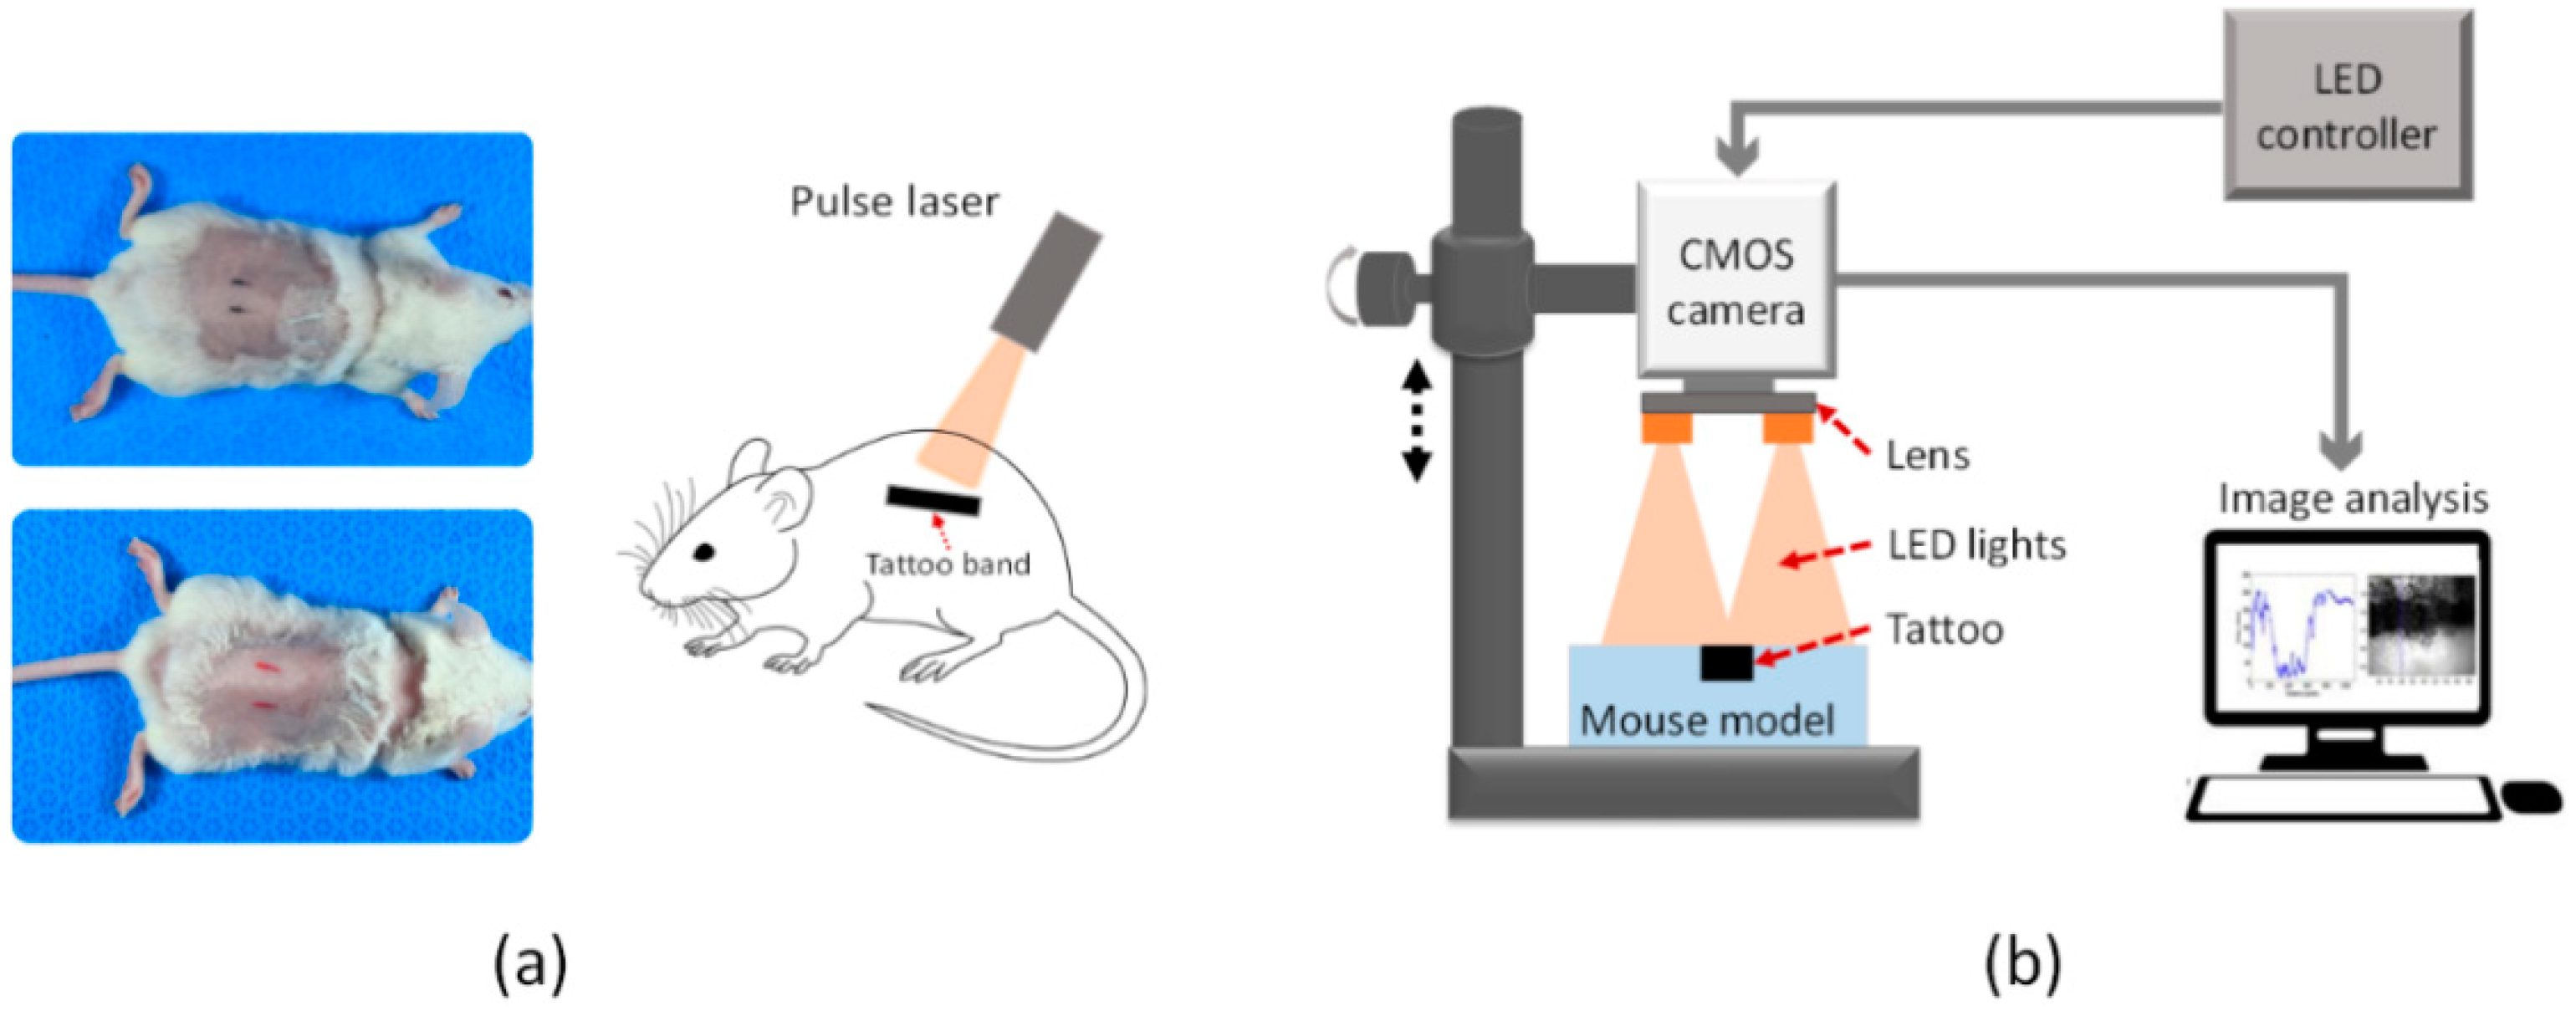
2 cage (temperature = 22 °C and humidity = 55%). Prior to tattooing, each mouse was anesthetized with a 0.3-mL solution of Zoletil and Rompun (3:1 ratio). Two commercially available tattoo inks were used for the tests: black (E02-1, Eternal Tattoo Supply, Brighton, MI, USA) and red inks (Odyssey red, D&H Company, Seoul, Korea). Each ink was tattooed on the back of a mouse after its hair was shaved completely, and three mice were tested for each color. The tattoo ink was injected approximately 1 mm below the skin using a reciprocating vibrator-driven needle. Two 1-cm-long tattoo bands (0.2-cm thick and 1 cm apart) of each color were created on the back of each animal (
Figure 1a).
After the tattoo areas had completely healed (14 days), each mouse received a laser tattoo treatment under anesthesia. Owing to the different characteristics of light absorption [
5,
11,
13], the black and red tattoos were removed using Q-switched 1064-nm and 532-nm wavelengths, respectively (Iris, Bluecore Company, Busan, Korea). The laser conditions for the tattoo treatment included a spot size of 5 mm on the skin, a pulse duration of 8–10 ns, and a repetition rate of 1 Hz. For comparison purposes, one-half of each tattoo band was removed by the laser treatment (i.e., 0.5 cm on the left side), and the other half remained intact. The aiming beam was precisely aligned and positioned on half of the tattoo band prior to the treatment. Based on the previous in vivo studies [
5,
11,
13], fluences of 1.5 J/cm
2 and 0.5 J/cm
2 were selected for removing the black and red tattoos, respectively.
Table 1 shows a summary of the laser parameters used for the current study.
To estimate the relative variations in the tattoo contrast after a laser treatment, a CMOS camera was utilized with the assistance of multicolor LEDs. According to
Figure 1b, the customized imaging device consisted of a 25-mm focal lens (66-895, Edmund Optics, Barrington, NJ, USA), a monochromatic CMOS camera (DMK AFUX236-M12, The Imaging Source, Taipei City, Taiwan) with a high resolution (1920 × 1200), a frame rate of up to 54 fps, and three different LEDs (SLTRGB35066N, Samsung, Suwon, Korea). Both the CMOS camera and LEDs were vertically positioned above each sample, as shown in
Figure 1b. The LEDs were able to selectively irradiate three different light colors (red, green, and blue lights) in a predetermined manner using an LED controller. According to the manufacturer, the central wavelengths of the red, green, and blue lights (i.e., RGB lights) correspond to 635, 530, and 450 nm, respectively. During the irradiation, each LED was measured to generate a luminous intensity of 300 mcd. Each tattooed area was then captured pre and post treatment by exploiting the customized imaging device under the irradiation of various LED colors. A total of six images were acquired for each tattoo. All the post-treatment images were captured two weeks after the laser treatment, which corresponds to the time required for the complete tissue healing [
11,
13]. Both the non-treated and the treated areas on the tattoo band were detected from the acquired images. The contrast values from each image were then calculated by estimating the differences in the measured intensity values between the non-tattooed (i.e., background) and the tattooed areas with Image J (National Institute of Health, Bethesda, MD, USA) as follows
where I
BGD is the intensity value measured from the non-tattooed area (i.e., initial mouse skin as background), and I
tattoo is the intensity value measured from the tattooed area. Zero contrast means that the tattoo is removed completely (i.e., I
tattoo = I
BGD). The reduction in the tattoo contrast after the laser treatment was also quantified by normalizing the difference in the calculated contrast values between the pretreatment (Contrast
pre) and the post treatment (Contrast
post) by Contrast
pre as
Two weeks after the laser treatment, all mice were euthanized using CO2 gas. The non-treated and the treated tattooed tissues were stored in 10% neutral-buffered formalin (VWR International, Westchester, PA, USA) for five days. To evaluate the tattoo distribution in the pre- and post-treated areas, all the tattooed tissues were cross sectioned. Subsequently, each cross-section was embedded in paraffin and was imaged to show an overall cross-sectional view of the tattoo distribution using a Huvitz stereo microscope (Meyer Instruments Inc., Houston, TX, USA). Image J was then used to measure the tattooed areas as well as the positions in the acquired images from the pre and the post treatment. Thus, the reduction in each tattoo after the laser treatment was quantified by estimating the variations in the tattoo distribution between the two conditions. For a non-parametric statistical analysis, the Mann–Whitney U test was performed on the calculated contrasts and the reduced tattoos using the SPSS program (SPSS Inc., Chicago, IL, USA), and p < 0.05 represents the statistical significance.
3. Results
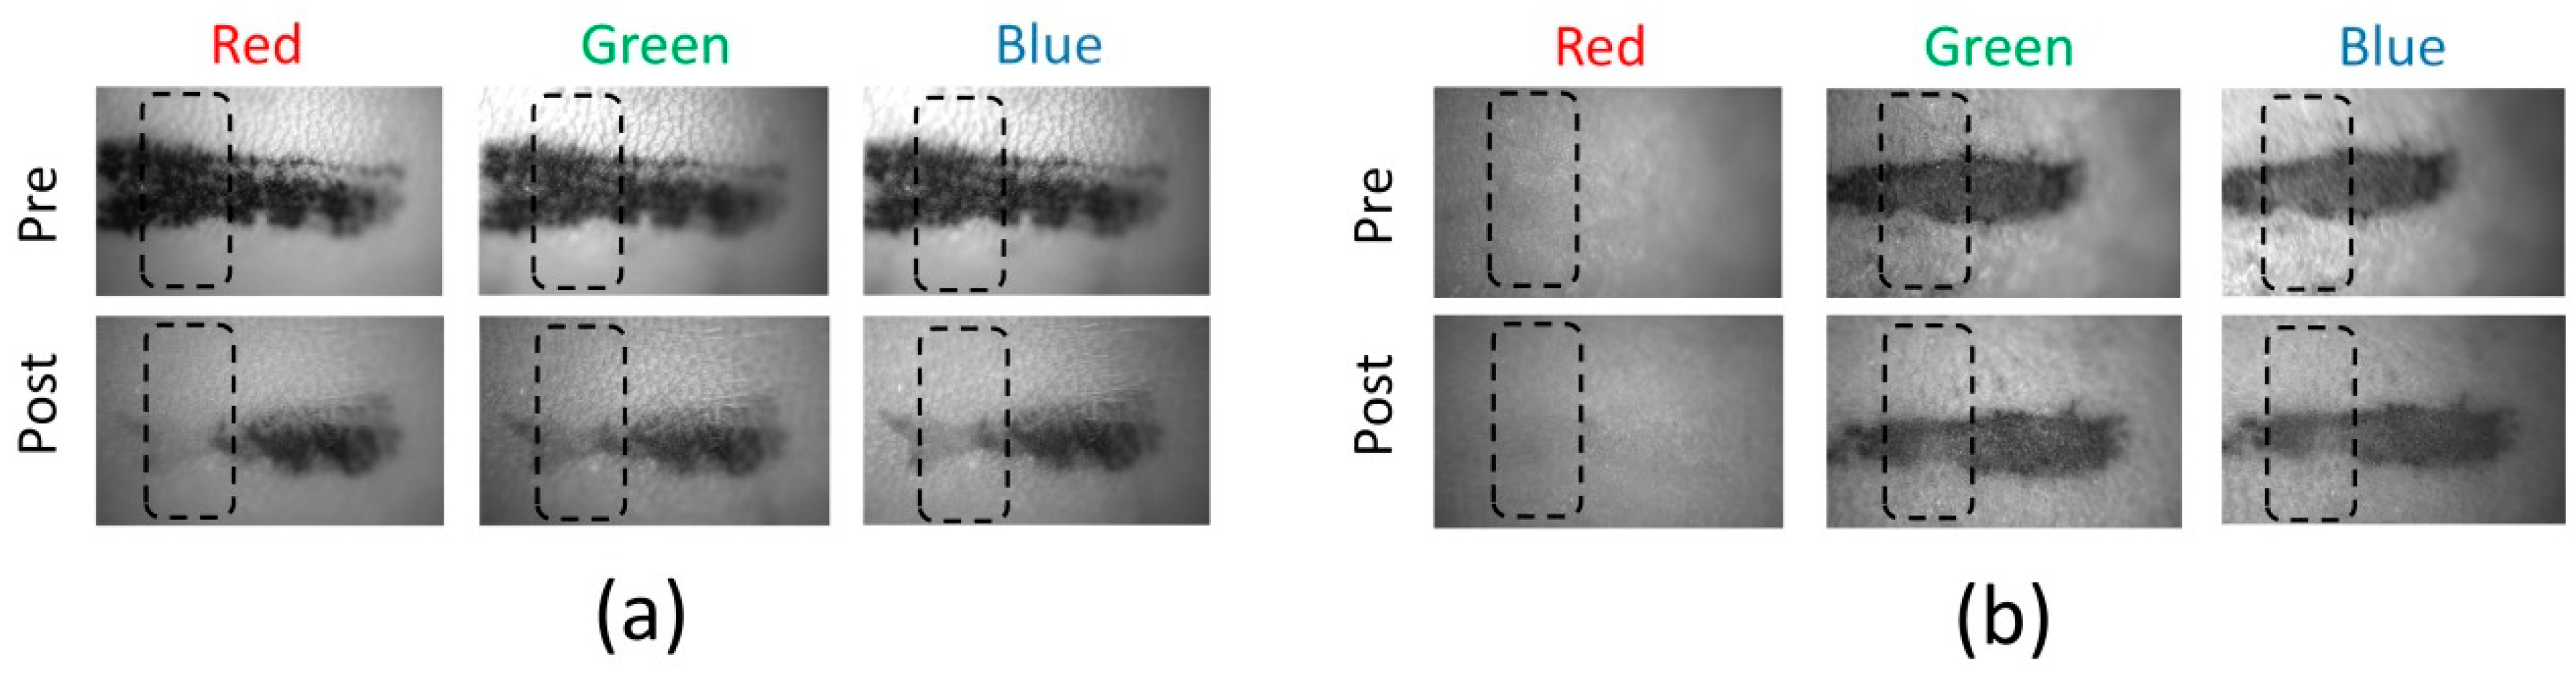
Figure 2 shows the captured images of the tattoos before and two weeks after laser treatment. Each tattoo band was imaged using a CMOS camera with LED irradiation (red, green, and blue lights; monochrome image). The total number of captured images was six for each tattoo. The black dotted boxes represent the locations for image analysis. Regardless of the tattoo and LED colors, the treated area on the mouse skin appeared fainter than the non-treated area. The change in the black tattoo band was clearly observed before and after the treatment under the three LED colors (
Figure 2a). However, unlike the black tattoo band, the red tattoo band yielded various responses to the LED colors (
Figure 2b). In particular, the red tattoo band (from pre- and post-laser treatments) was hardly detected under the red LED, whereas the red tattoo was evident under both the green and the blue LEDs.
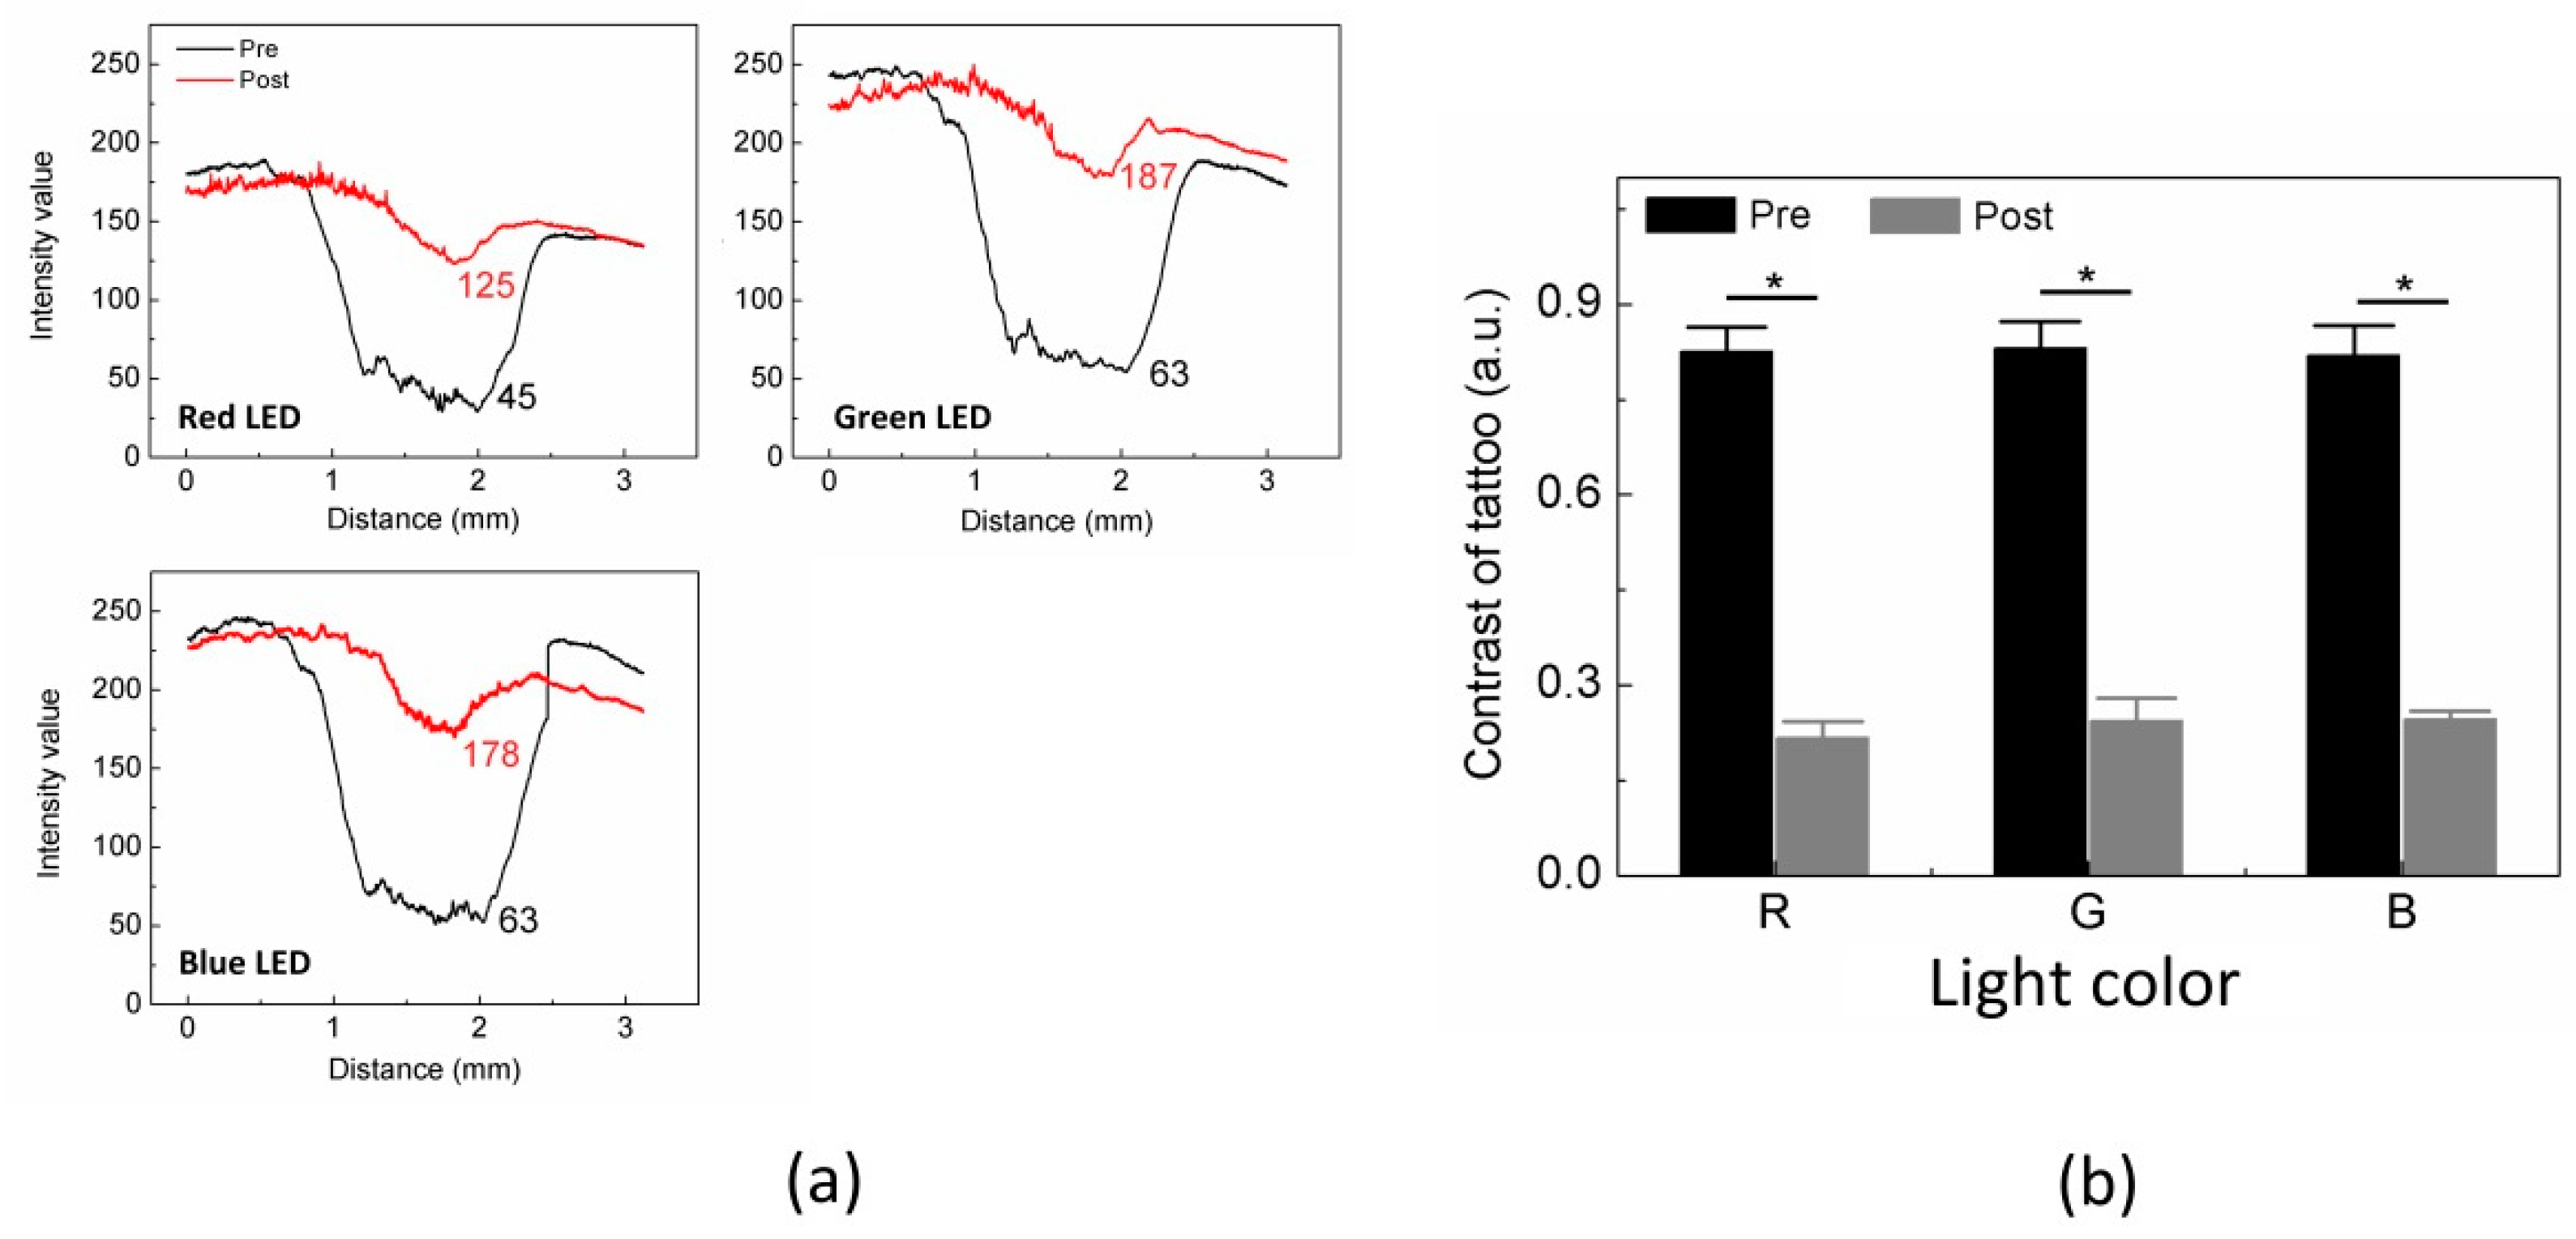
Based on the captured images under three LED colors (
Figure 2), we analyzed and compared the intensity values of the black tattoo measured from the pre and post treatment. The results are shown in
Figure 3. All the intensity values are displayed from 10 measurements in the dotted box in
Figure 2a and compared between the pre and the post treatment (
Figure 3a). Apparently, the black tattoo yielded considerably lower I
tattoo (i.e., tattooed area) than I
BGD (i.e., non-tattooed area) under all the LED colors for the pre-treatment (e.g., I
tattoo = 45 ± 12 vs. I
BGD = 125 ± 8 under red LED;
p < 0.001). Under each LED color, I
BGD was almost invariant between the pre and the post treatment (
p = 0.08–0.17). Nevertheless, I
tattoo from the pretreatment was lower than I
tattoo from the post treatment for all the LED colors. The intensity variation between the pre and the post treatment was found to be up to 80 under all the LED colors (e.g., I
tattoo = 45 ± 12 for pre vs. 125 ± 8 for post under red LED;
p < 0.001). To quantify the variations in the intensity value after the laser treatment, the contrast between the black tattoo and the background were calculated and compared, as shown in
Figure 3b. Irrespective of the LED color, Contrast
pre was four-fold higher than Contrast
post (
p < 0.001). However, the contrast values for either the pre or post treatment were comparable under all the LED colors (i.e., Contrast
pre = 0.81–0.83;
p = 0.65, and Contrast
post = 0.21–0.25;
p = 0.32).
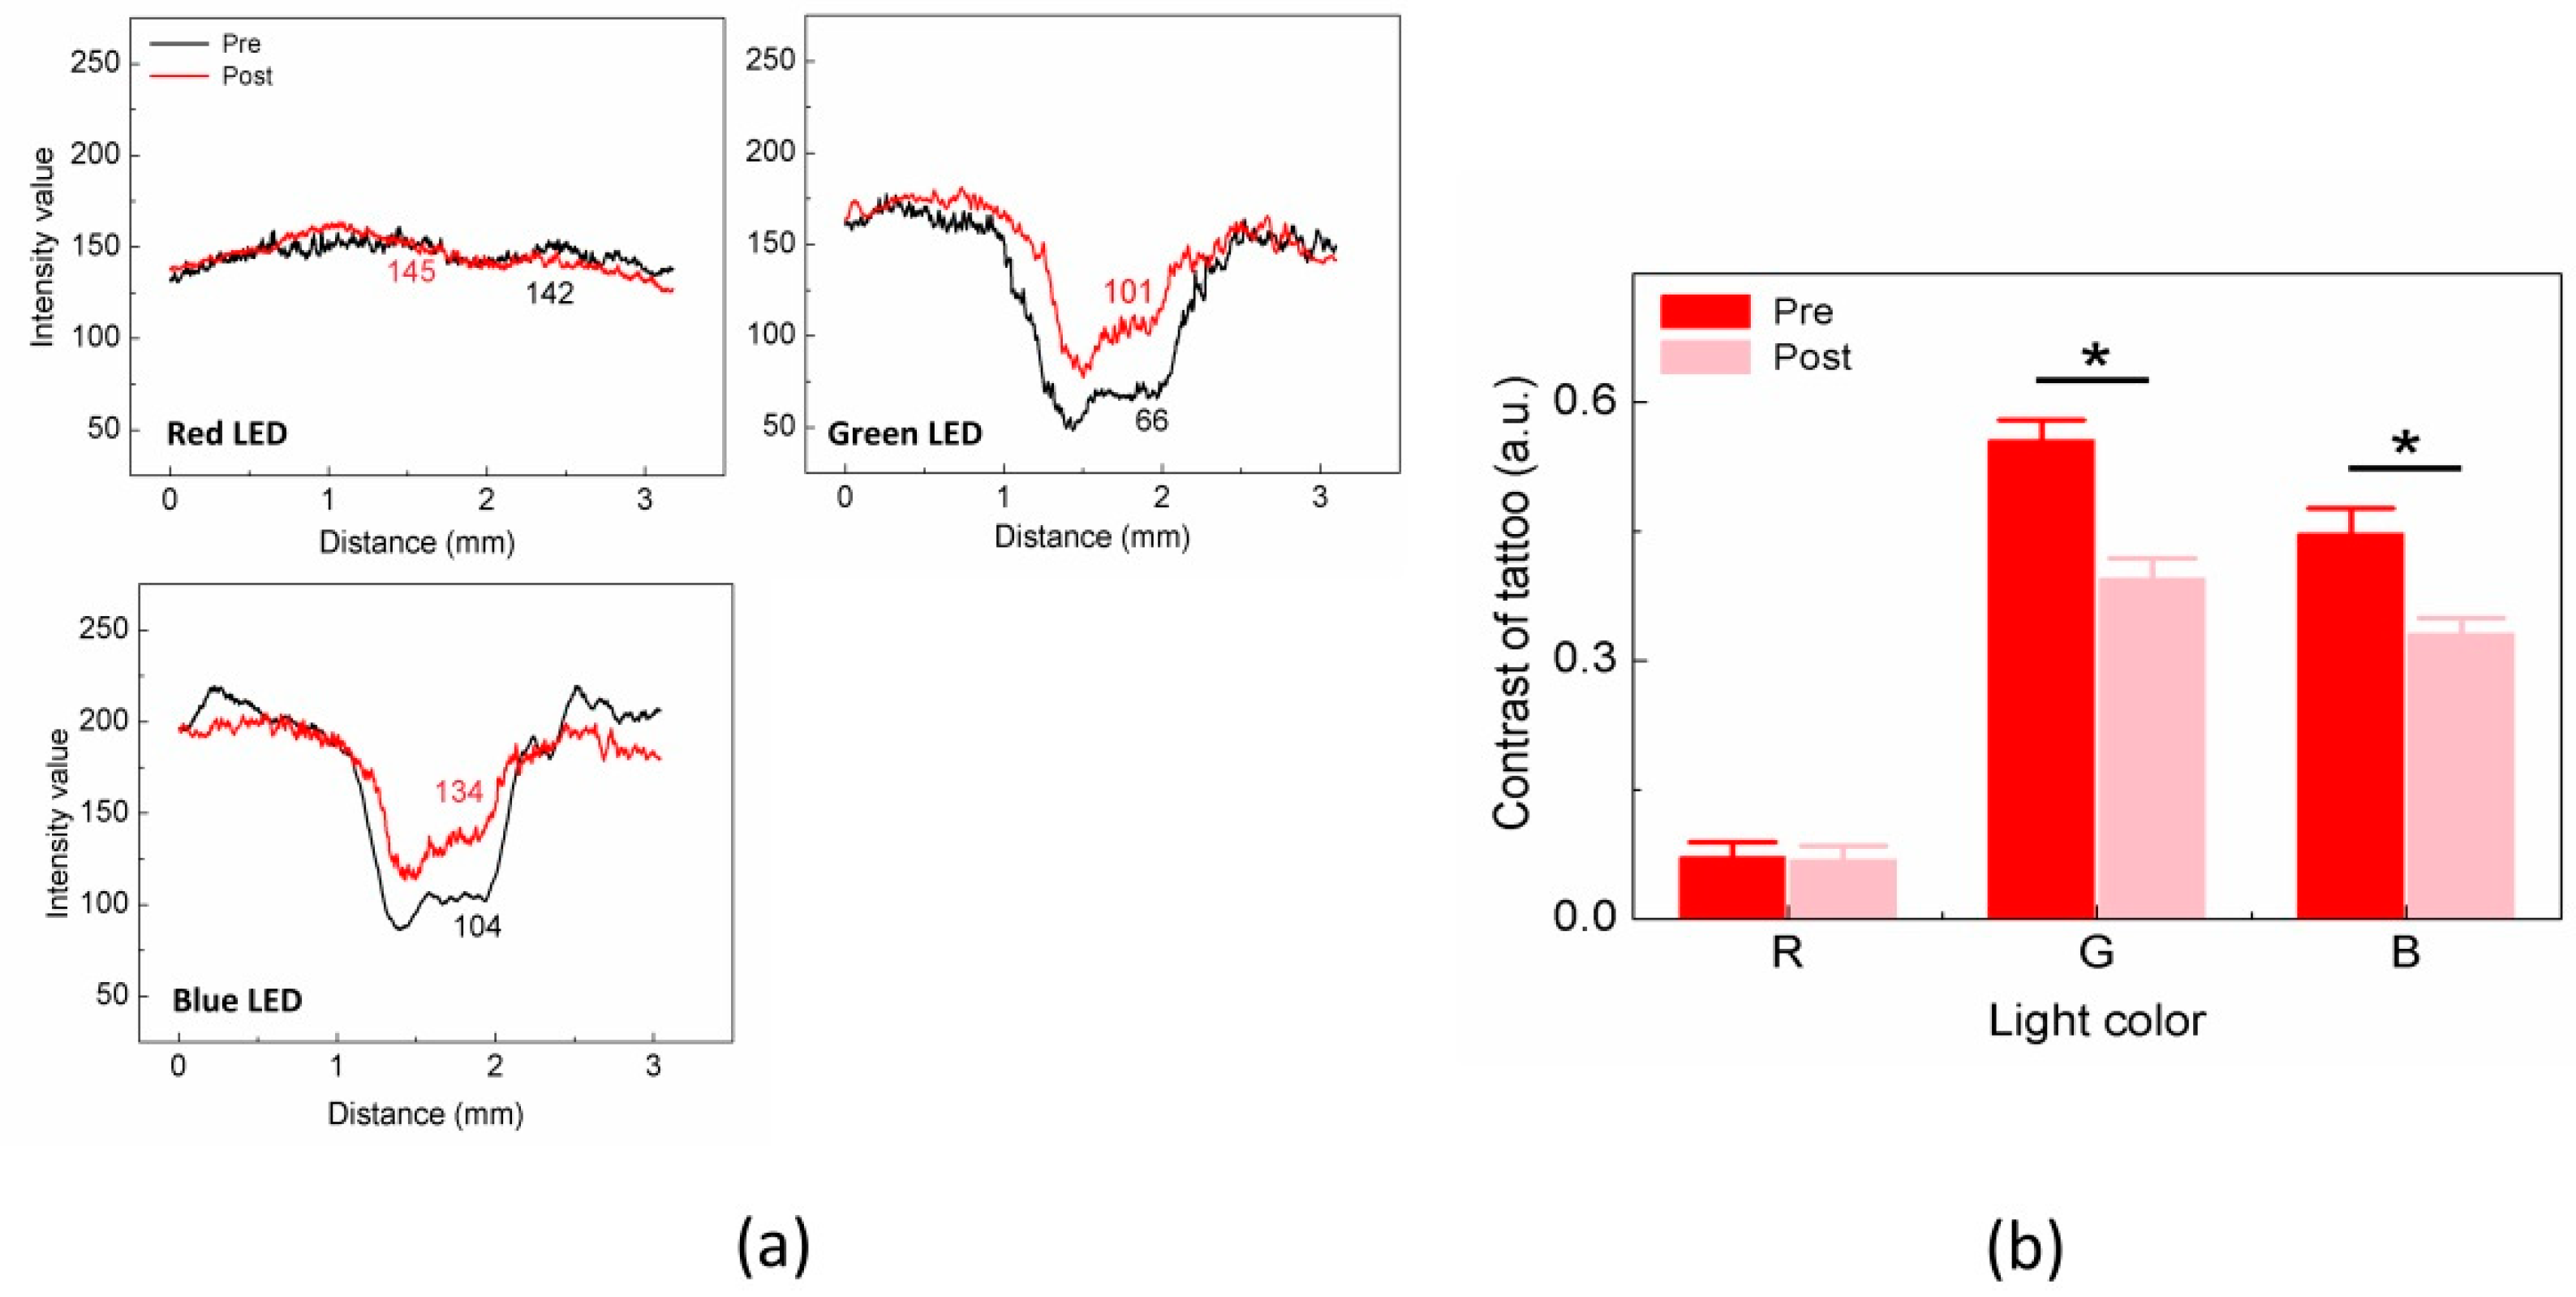
Figure 4 shows the intensity and contrast values measured from the red tattoo.
Figure 4a presents the spatial variations in the intensity profiles between the pre and post treatment under all the LED colors (i.e., measurements of dotted boxes in
Figure 2b). For the pretreatment condition, the red tattoo case presented a markedly lower I
tattoo than I
BGD under green and blue LEDs, but no difference between I
tattoo and I
BGD was found under the red LED. I
BGD was almost comparable between the pre and the post treatment under all the LEDs (
p = 0.1–0.28). We also observed that the variation in I
tattoo between the pre and the post treatment was significant under the green and blue LEDs, which was approximately 35 for the green LED (i.e., I
tattoo = 66 ± 8 for pre vs. 101 ± 6 for post;
p < 0.001) and 30 for the blue LED (i.e., I
tattoo = 104 ± 11 for pre vs. 134 ± 12 for post;
p < 0.001). However, the red LED showed an insignificant change in I
tattoo between the pre and the post treatment (i.e., I
tattoo = 142 ± 2 for pre and 145 ± 2 for post;
p = 0.83).
Figure 4b exhibits the quantitative comparisons of the contrast estimated from the red tattoo between the pre and the post treatment under all the LEDs. The overall contrast values from the red tattoo were significantly lower than those from the black tattoo (
Figure 3b). Unlike the black tattoo case, the contrast in the red tattoo was dependent on the LED colors. In the case of the red LED, the contrast values between the pre and the post treatment were almost comparable (i.e., Contrast
pre = 0.07 ± 0.02 vs. Contrast
post = 0.06 ± 0.02;
p = 0.42). Meanwhile, under the green and the blue LEDs, Contrast
post became 30% and 26% lower than Contrast
pre, respectively (i.e., Contrast
pre = 0.55 ± 0.02 vs. Contrast
post = 0.39 ± 0.02 for green;
p = 0.001 and Contrast
pre = 0.45 ± 0.03 vs. Contrast
post = 0.33 ± 0.02 for blue;
p = 0.007). Based upon the contrast estimation in
Figure 3 and
Figure 4, the relative contrast reduction in tattoo after the laser treatment was quantified for both the black and red tattoos (
Table 2). In the case of the black tattoo, the contrast reduction was almost invariant for all the LEDs, which ranged from 71.5% to 72.8% (
p = 0.74–0.78). However, the red tattoo showed no contrast reduction under the red LED but both the green and the blue LEDs yielded a comparable contrast decrease after the treatment (23.2–28.7%;
p = 0.33–0.70).
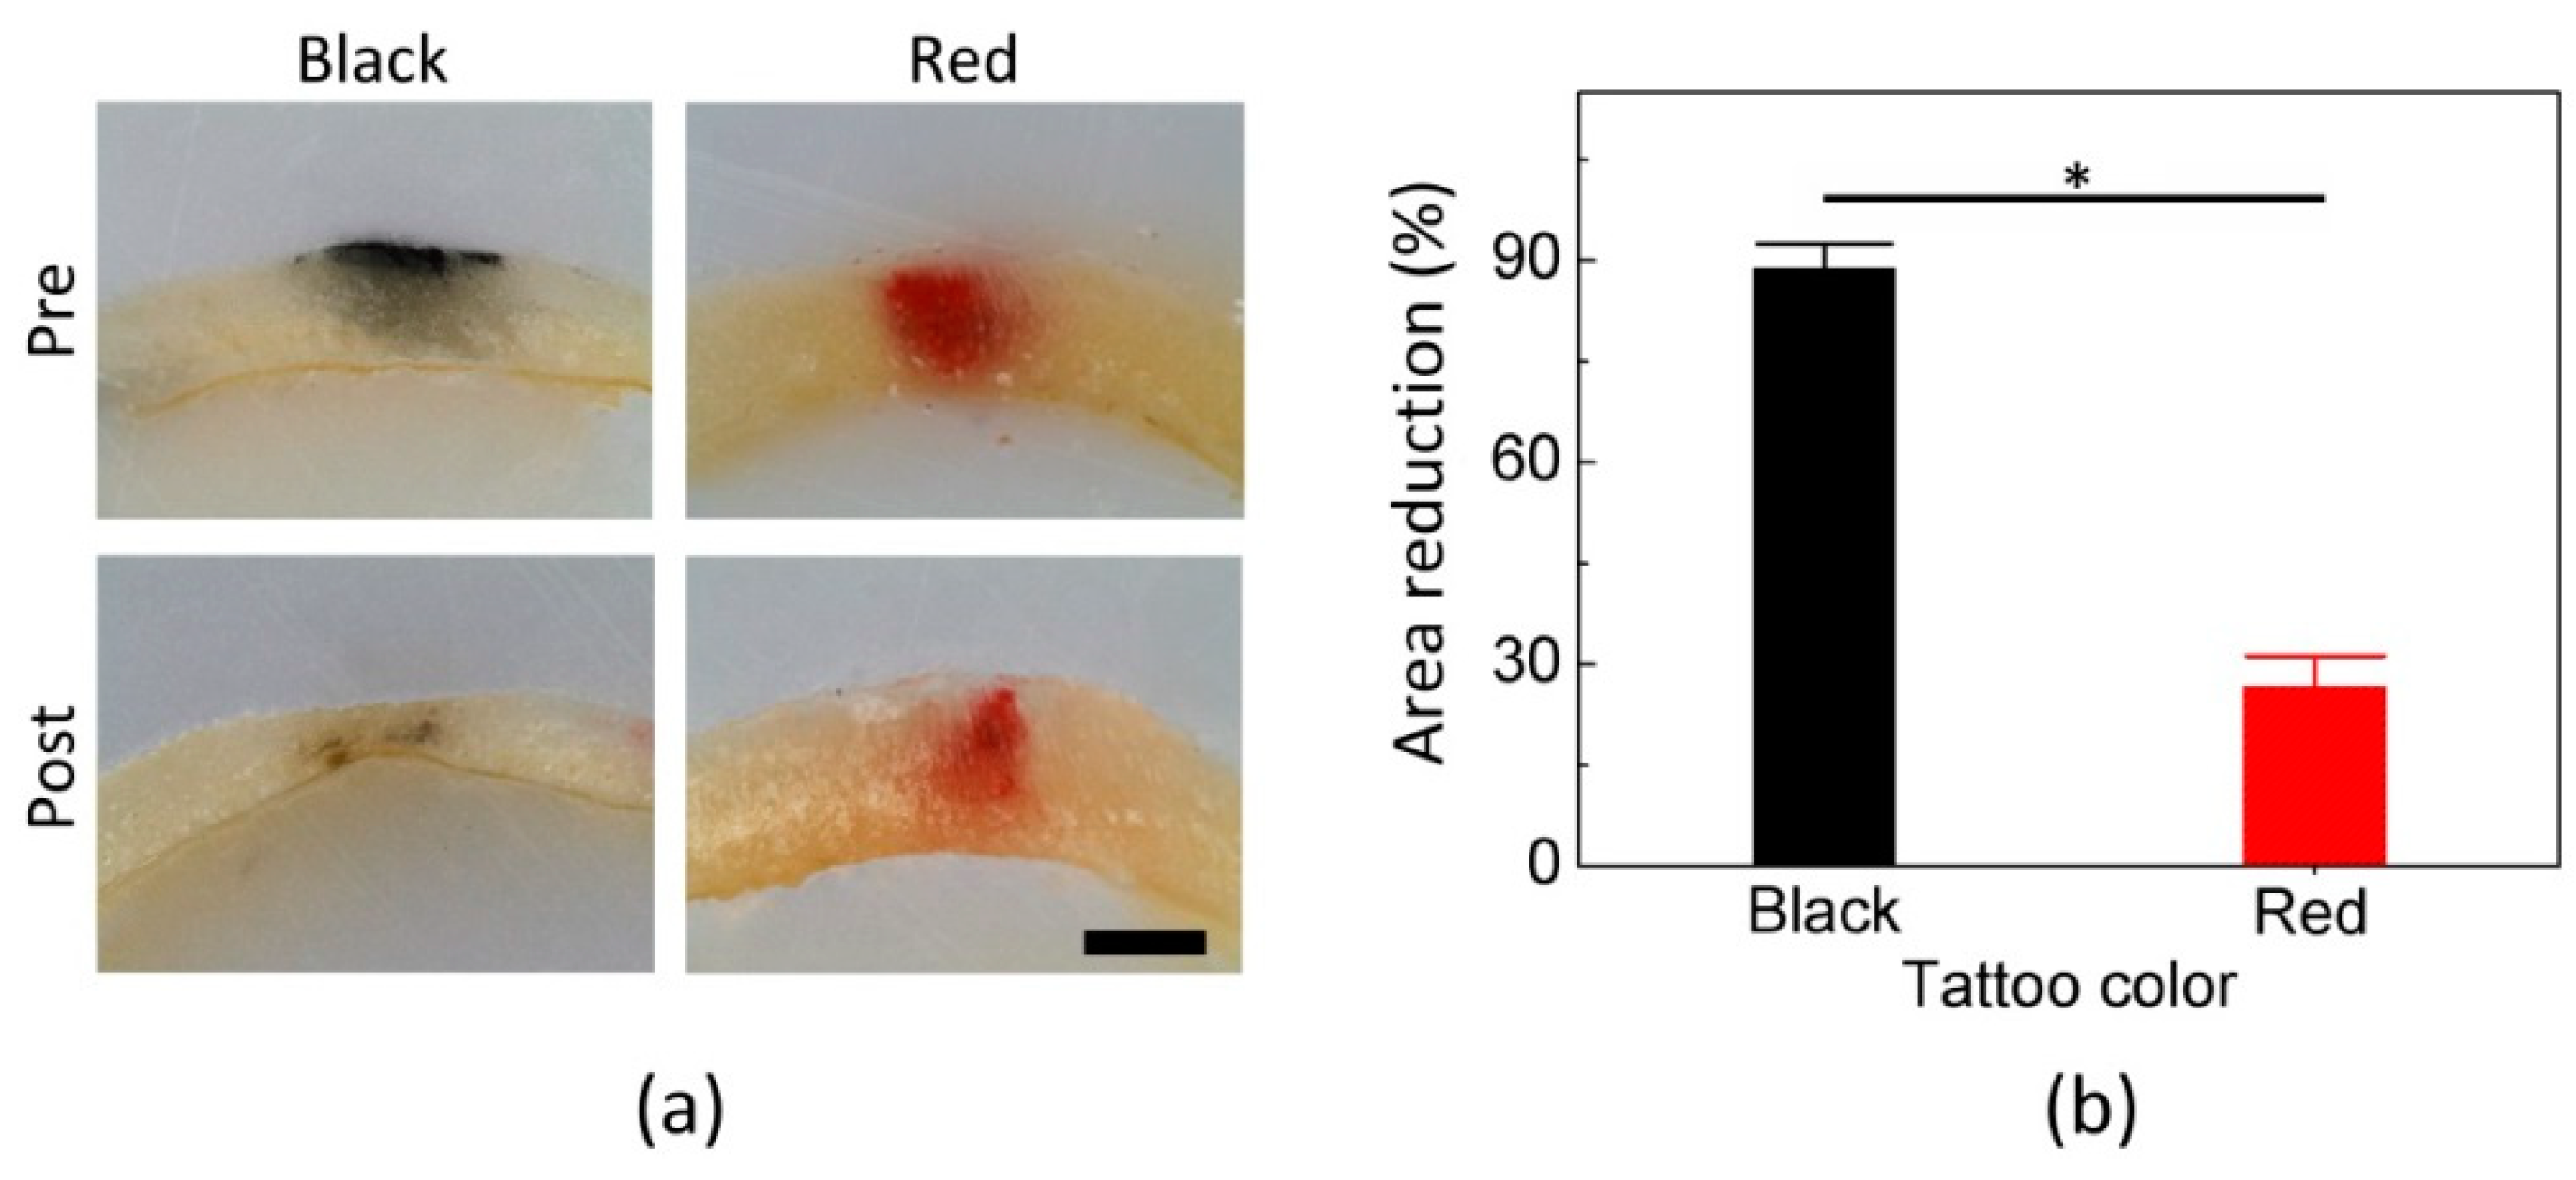
Figure 5 compares the cross-sectional distribution of the tattoos in mouse skin: untreated (upper) and treated (below) tattoo areas. Both the treated black and red tattoos became fainter, in comparison with the non-treated tattoos. According to
Figure 5a, the area distribution of the black tattoo significantly decreased after the laser treatment. Meanwhile, the red tattoo was partially removed from the surface (epidermal layer). Both the tattoos still remained at the deeper position (−400 µm) of the skin.
Figure 5b quantifies the degree of relative reduction in the tattoo areas after the treatment. The treated black tattoo area was reduced by 89%, compared with the untreated area (
p < 0.01). Meanwhile, the treated red tattoo area was removed by 27% more than the untreated red tattoo area (
p < 0.01), which was three-fold less than the reduction in the black tattoo area (
p < 0.001).
4. Discussion
The purpose of the current study is to investigate the feasibility of using a multicolor LED-assisted CMOS camera to detect visual changes in tattoo after laser treatment in terms of image intensity and contrast. Regardless of the tattoo color, the proposed method was able to detect variations in the intensity from both the background and the tattoo area (
Figure 3 and
Figure 4). A clear distinction was also found in the contrast changes between the pre and post treatment (black = 72% and red = 27%;
Table 2), and corresponded well to the degree of tattoo reduction in the tissue (black = 89% and red = 27%;
Figure 5). Therefore, we conclude that the proposed imaging method may provide an indirect assessment of laser tattoo treatment in terms of contrast variations. Unlike the black tattoo, the red tattoo yielded different contrast variations in the LED color-dependent manner, implicating that the multicolor LEDs can facilitate in a remission increase (i.e., scattering and specular reflection) from the tattoo area and eventually affect the contrast of the tattooed area after the treatment. Thus, the proposed LED-assisted CMOS camera can be a feasible tool to estimate the variations in the tattoo contrast after the laser treatment.
According to previous studies [
5,
11,
13,
17], black pigment is associated with constant and high light absorption in the visible spectra (ranging from 380 nm to 770 nm), leading to less light remission. In fact, the black tattoo demonstrated comparable contrast variations between the pre and post treatment under all the LED colors (
Figure 3). Thus, significant light absorption (i.e., insignificant remission) implies that any LED color may facilitate the CMOS camera in detecting the black tattoo position as well as the residual tattoo contrast after the laser treatment. Meanwhile, the optical responses of the red tattoo are contingent upon the incident wavelength over the visible spectra [
5,
11]. Strong light reflection at 635 nm (up to 60%) could be responsible for the indistinctive intensity profiles as well as the negligible contrast variations from the treated red tattoo (
Figure 4). However, both the green and blue LEDs presented evident intensity profiles as well as contrast decrease possibly due to the selective high light absorption of the red pigment at 450 nm and 532 nm. Hence, the LED color-dependent responses imply that multicolored tattoo can selectively be detected using various LED colors in association with high absorption characteristics.
The partial removal of tattoo distribution in the skin after laser treatment substantiated the ostensible variations in contrast between the pre and post treatments (
Figure 5). Despite the 1.5-fold higher total fluence (i.e., 1.5 J/cm
2 for black vs. 0.5 J/cm
2 for red), the black tattoo still yielded approximately three-fold higher contrast reduction as well as more tattoo removal than the red tattoo (contrast reduction = 71.8–72.8% for black vs. 23.2–28.7% for red; area reduction = 89% for black vs. 27% for red). Thus, a correlation between the detected contrast and the residual tattoo distribution still needs to be elucidated in a quantitative manner to evaluate the feasible performance of the LED-assisted camera for clinical applications.
Although the current study demonstrated the feasible application of an LED-assisted camera to detect variations in tattoo contrast after laser treatment, experimental limitations still remain prior to clinical translation. As only two types of tattoo colors (black and red) were used for the current study, the proposed technique needs to be examined with various tattoo colors (e.g., blue, green, and yellow) as well as multicolored (mixed colors) tattoos to confirm the diagnostic validation. Owing to the ease of handling, a mouse was selected as the animal model for the proof of concept [
5]. However, compared with human skin (dermis of ≥1 mm), the small animal has typically thinner dermis (≤1 mm). Upon laser treatment, tattoo pigments are fragmented and removed from the skin through the lymphatic system or trans-epidermal elimination [
2,
13]. Thus, the thinner skin could accelerate the pigment fragmentation owing to the rapid wound healing. To emulate clinical conditions and to validate clinical translations, larger animal models should be tested further with the proposed method. Hence, a contrast scale and a dynamic range for tattoo monitoring need to be validated with other extrinsic factors such as the melanin concentration in the skin, ink concentration, spatial distribution of ink within the tissue, and geometrical conditions of the tissue.


