5.1. S-N Fatigue Equation
The S-N fatigue equation was established by Chaboche [
27,
28]
where
D is the damage;
N is the cycle number;
M,
α and
γ are the material parameters related to temperature, stress amplitude and average stress; and
σ is the stress level.
Through the integration of Equation (9), Equation (10) can be obtained:
When
D(N) = 1, then
N =
Nf, the equation of fatigue life
Nf can be obtained from Equation (10):
where
Nf is the fatigue life.
Let
,
n =
γ, and Equation (11) can be transformed to:
where
k and
n are the fitting parameters of the fatigue equation;
Let
,
, and Equation (11) can be transformed to:
where
St is the strength obtained by the standard strength test; and
t is the nominal stress ratio in fatigue test,
t=
σ/
St.
Equations (12) and (13) are the conventional S-N fatigue equations, which have been widely used in characterizing the fatigue performance of pavement materials.
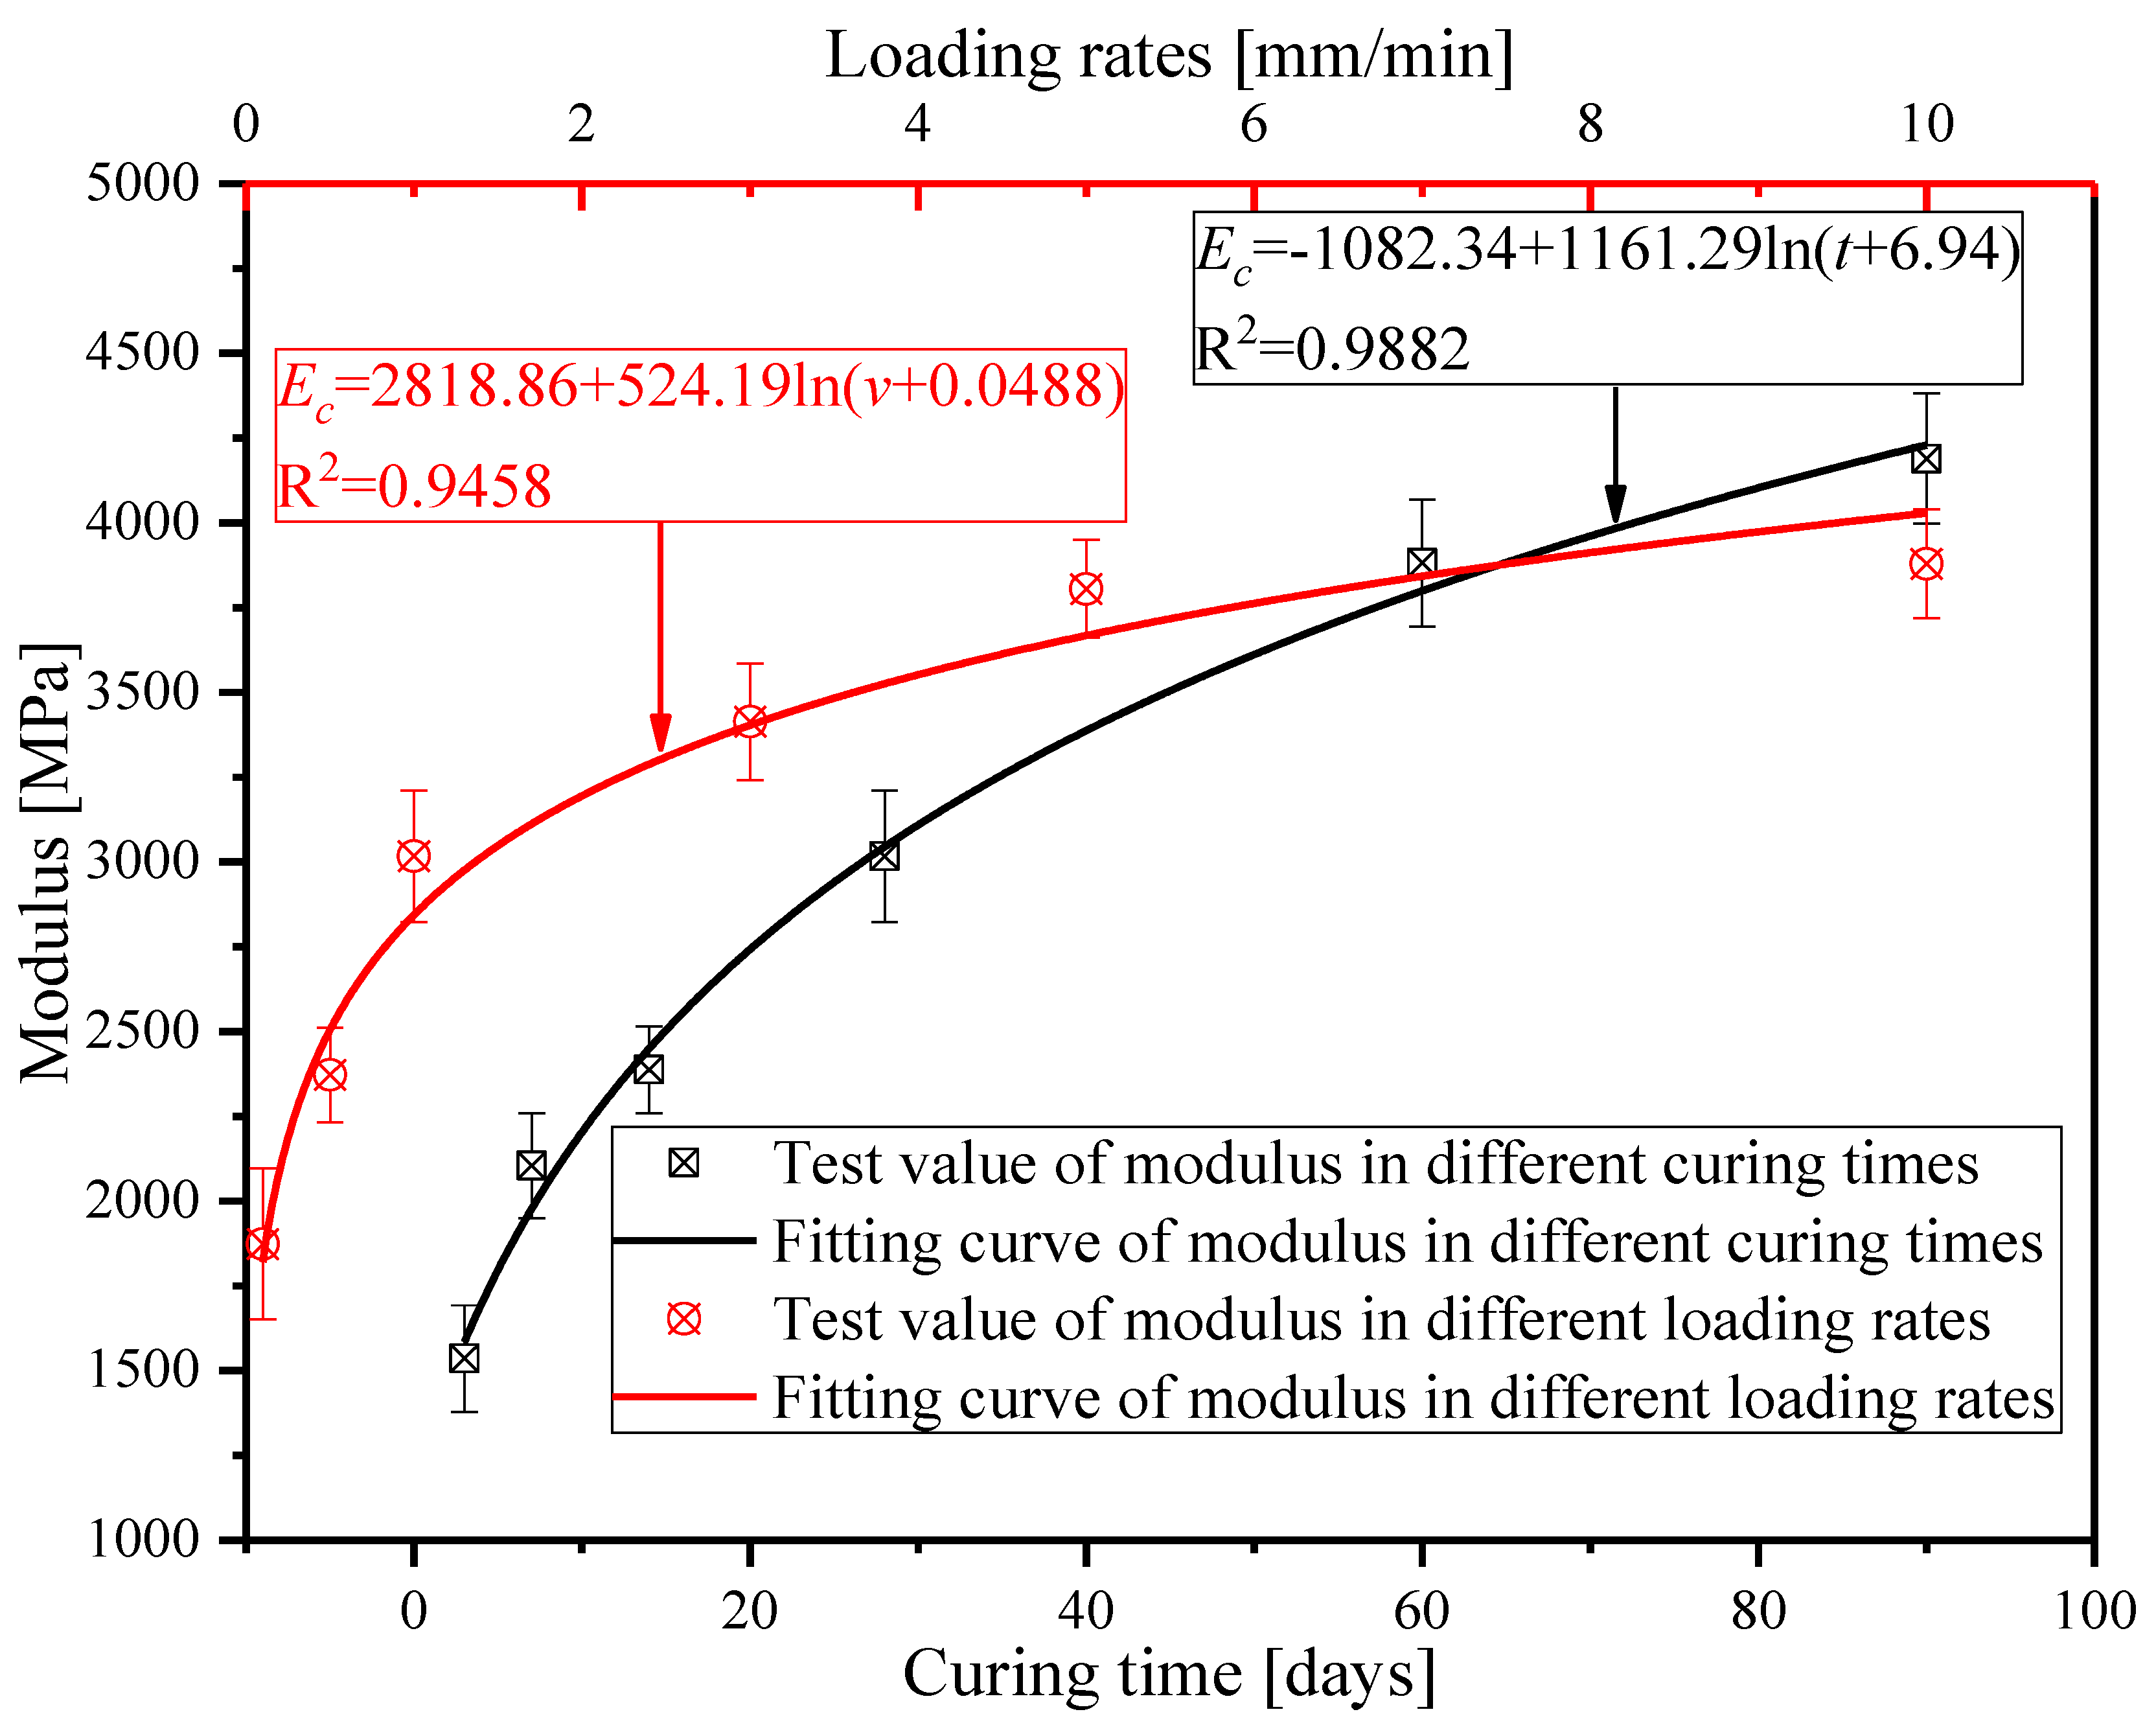
From the definition of the S-N equation, it could be noted that the stress ratios were determined with a certain strength value, obtained by the standard strength test method. The loading rates of the standard strength test are fixed, such as 1 mm/min or 50 mm/min. However,
Section 3.1 showed that the strength of the cement-treated aggregate base material varied with the loading rates. Thus, it might bring a large error into the fatigue properties. When the stress level is larger than the failure strength obtained by the standard strength test, the stress ratio calculated by the standard strength was larger than 1, which means that the fatigue life of cement-treated aggregate base material under this stress level will be less than 1. However, the actual fatigue life is much greater than 1, according to the lab test. Therefore it is necessary to establish an improved S-N fatigue equation, which can consider the effects of the loading rates on the strength of the cement-treated aggregate base material.
5.2. Establishment of the Fatigue Model Based on the True Stress Ratio
- (1)
Fatigue tests
In this paper, the four-point bending fatigue test was employed to characterize the fatigue properties of the cement-treated aggregate base material. The specimens for the four-point bending fatigue test were prepared using the static compaction method and the size of specimen was 100 mm × 100 mm × 400 mm, as shown in
Figure 10.
Prior the flexural fatigue test, the flexural strength tests were conducted under the standard loading rate of 13 MPa/s, which was calculated by the strength value and the loading time of the strength test. In this way the nominal stress ratio can be determined. Then the strength tests under different loading rates (5 MPa/s, 20 MPa/s, 30 MPa/s, 40 MPa/s, and 50 MPa/s) were conducted to determine the true stress ratio of the fatigue test. The true stress ratio refers to the ratio of fatigue stress level to strength and the strength is related to the loading rates. The procedure of flexural strength tests is the same for the unconfined compressive strength tests described in
Section 3.2. The flexural strength of the specimen can be calculated according to Equation (14).
where
Sf is the flexural strength (MPa);
P is the ultimate failure loads (kN);
L is the distance between two supporting points (mm);
b is the width of the specimen (mm); and
h is the height of the specimen (mm).
The test results are presented in
Table 5.
As mentioned above, the standard loading rate was 13 MPa/s. From
Table 5, it can be observed that the corresponding standard strength was 1.3 MPa when the standard loading rate was 13 MPa/s. The corresponding standard strength of 1.3 MPa was used to calculate the nominal stress ratio.
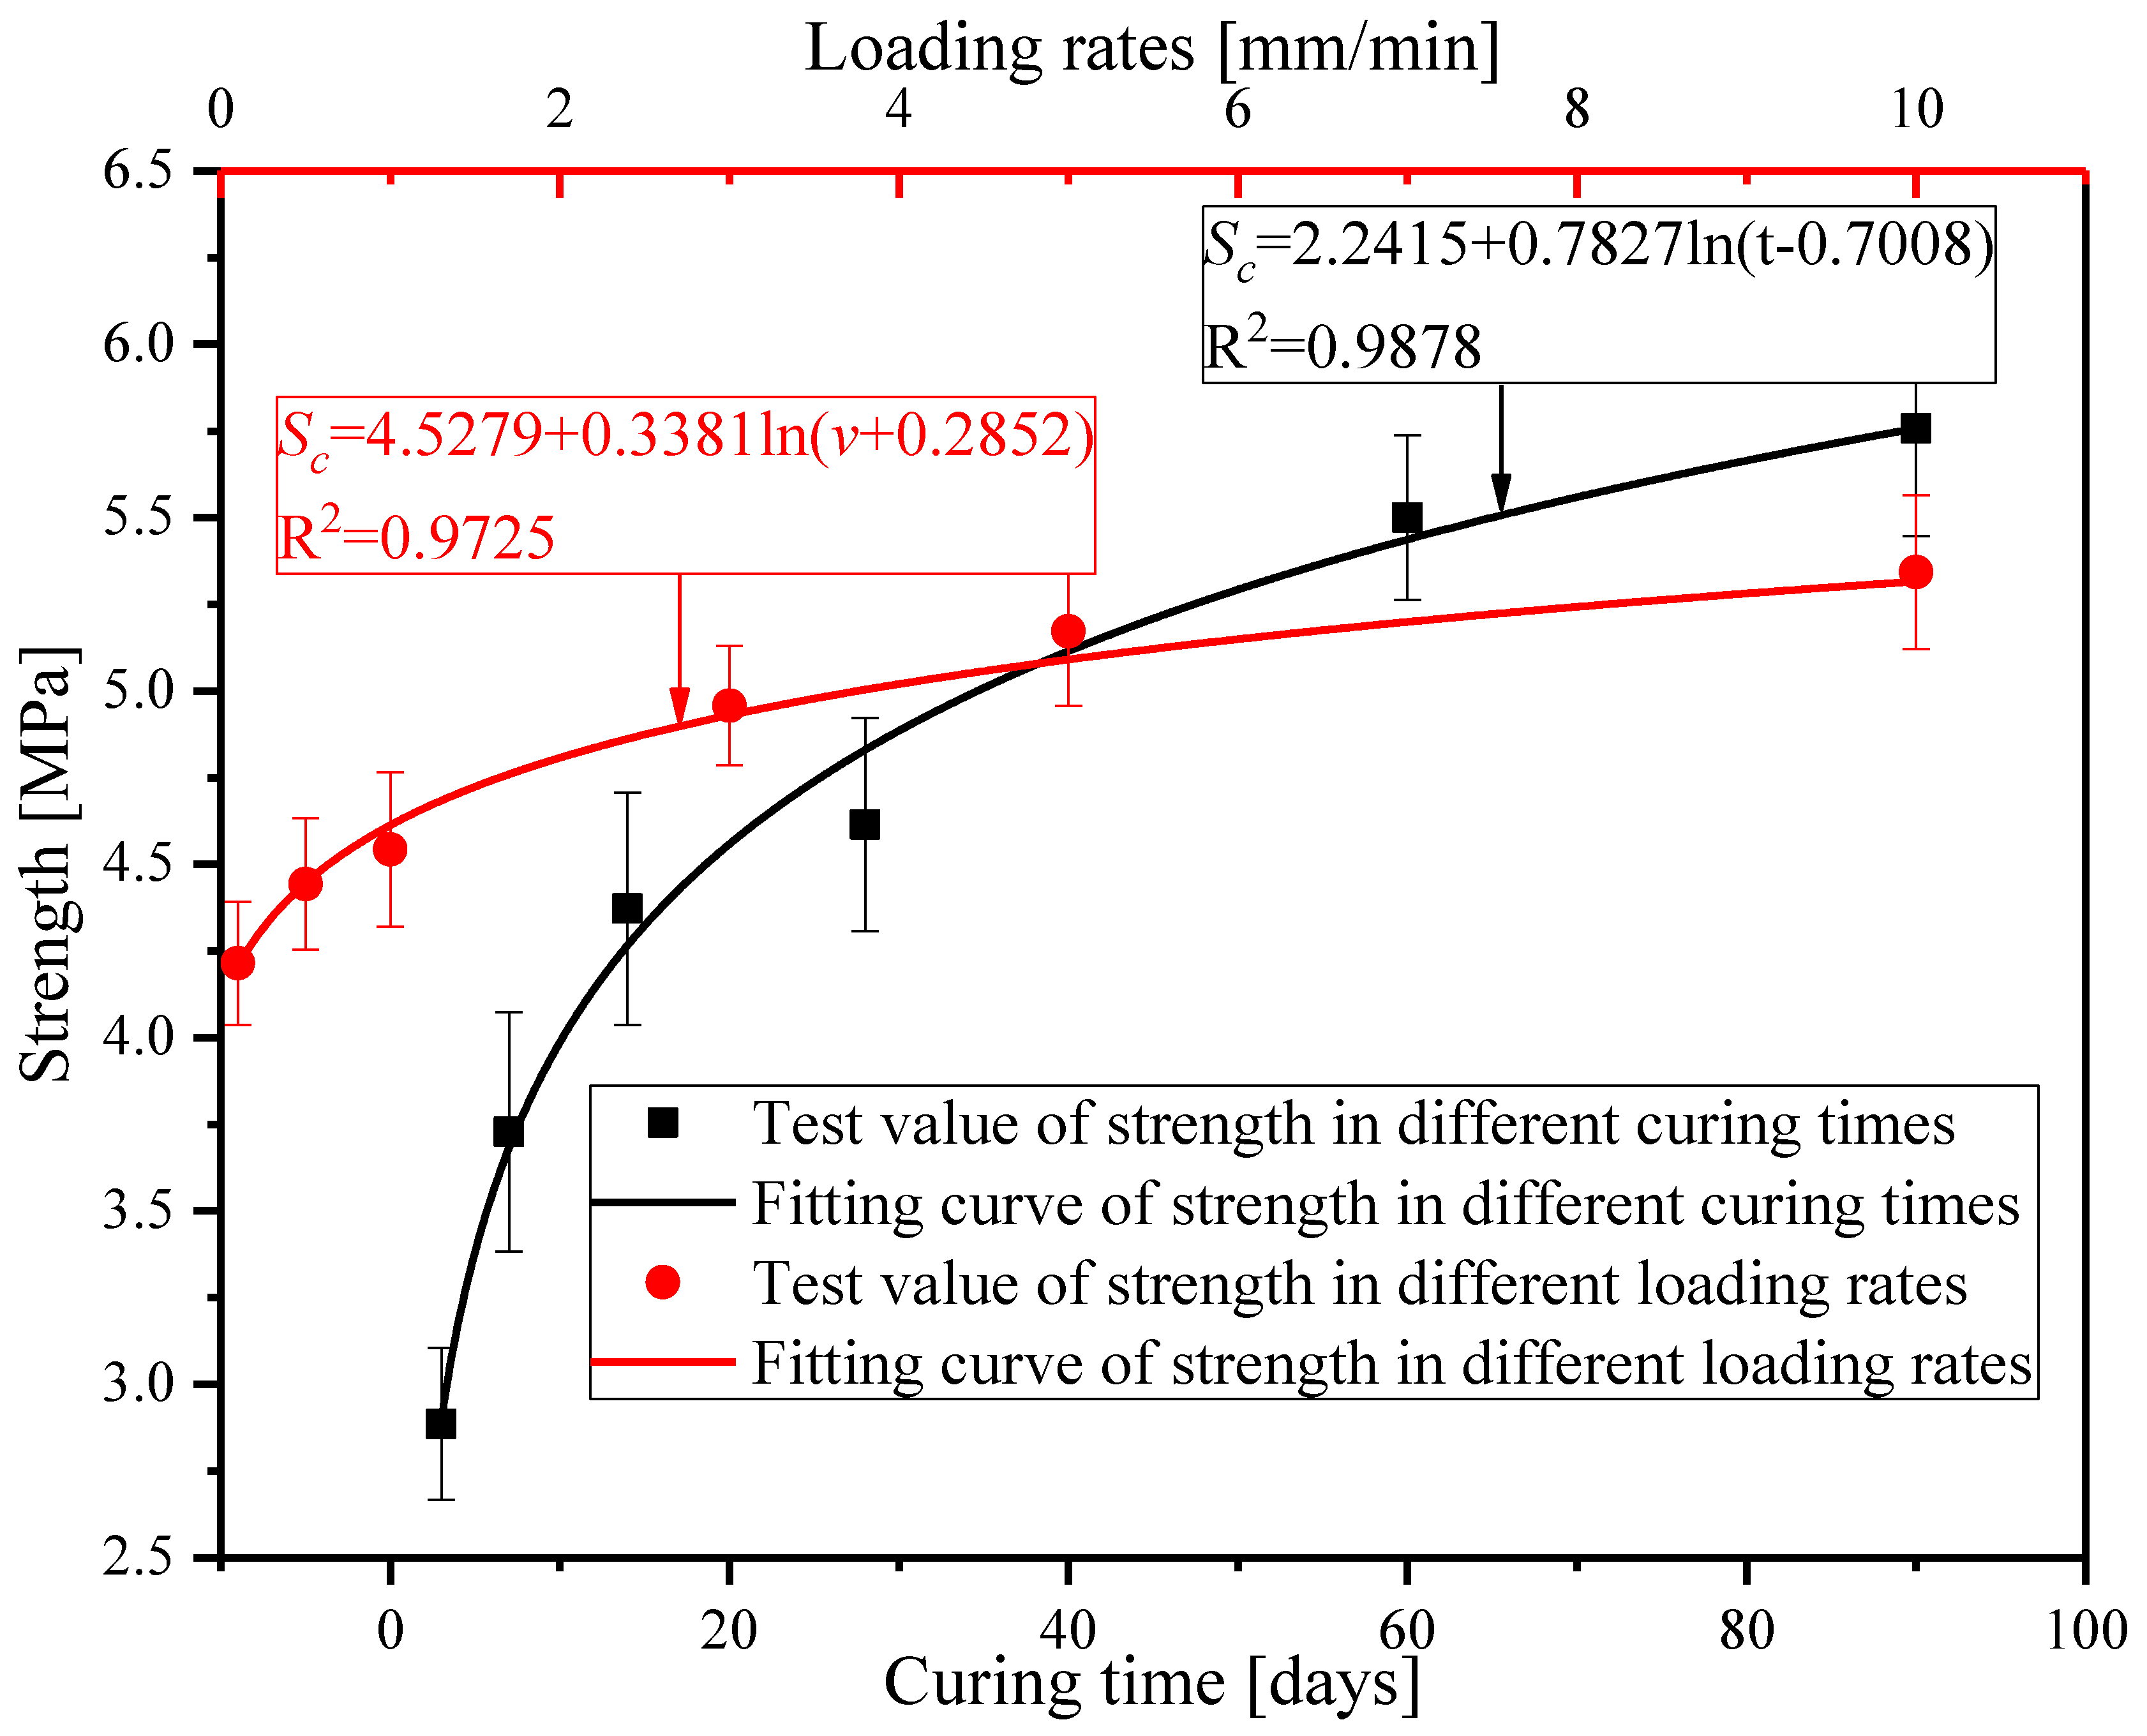
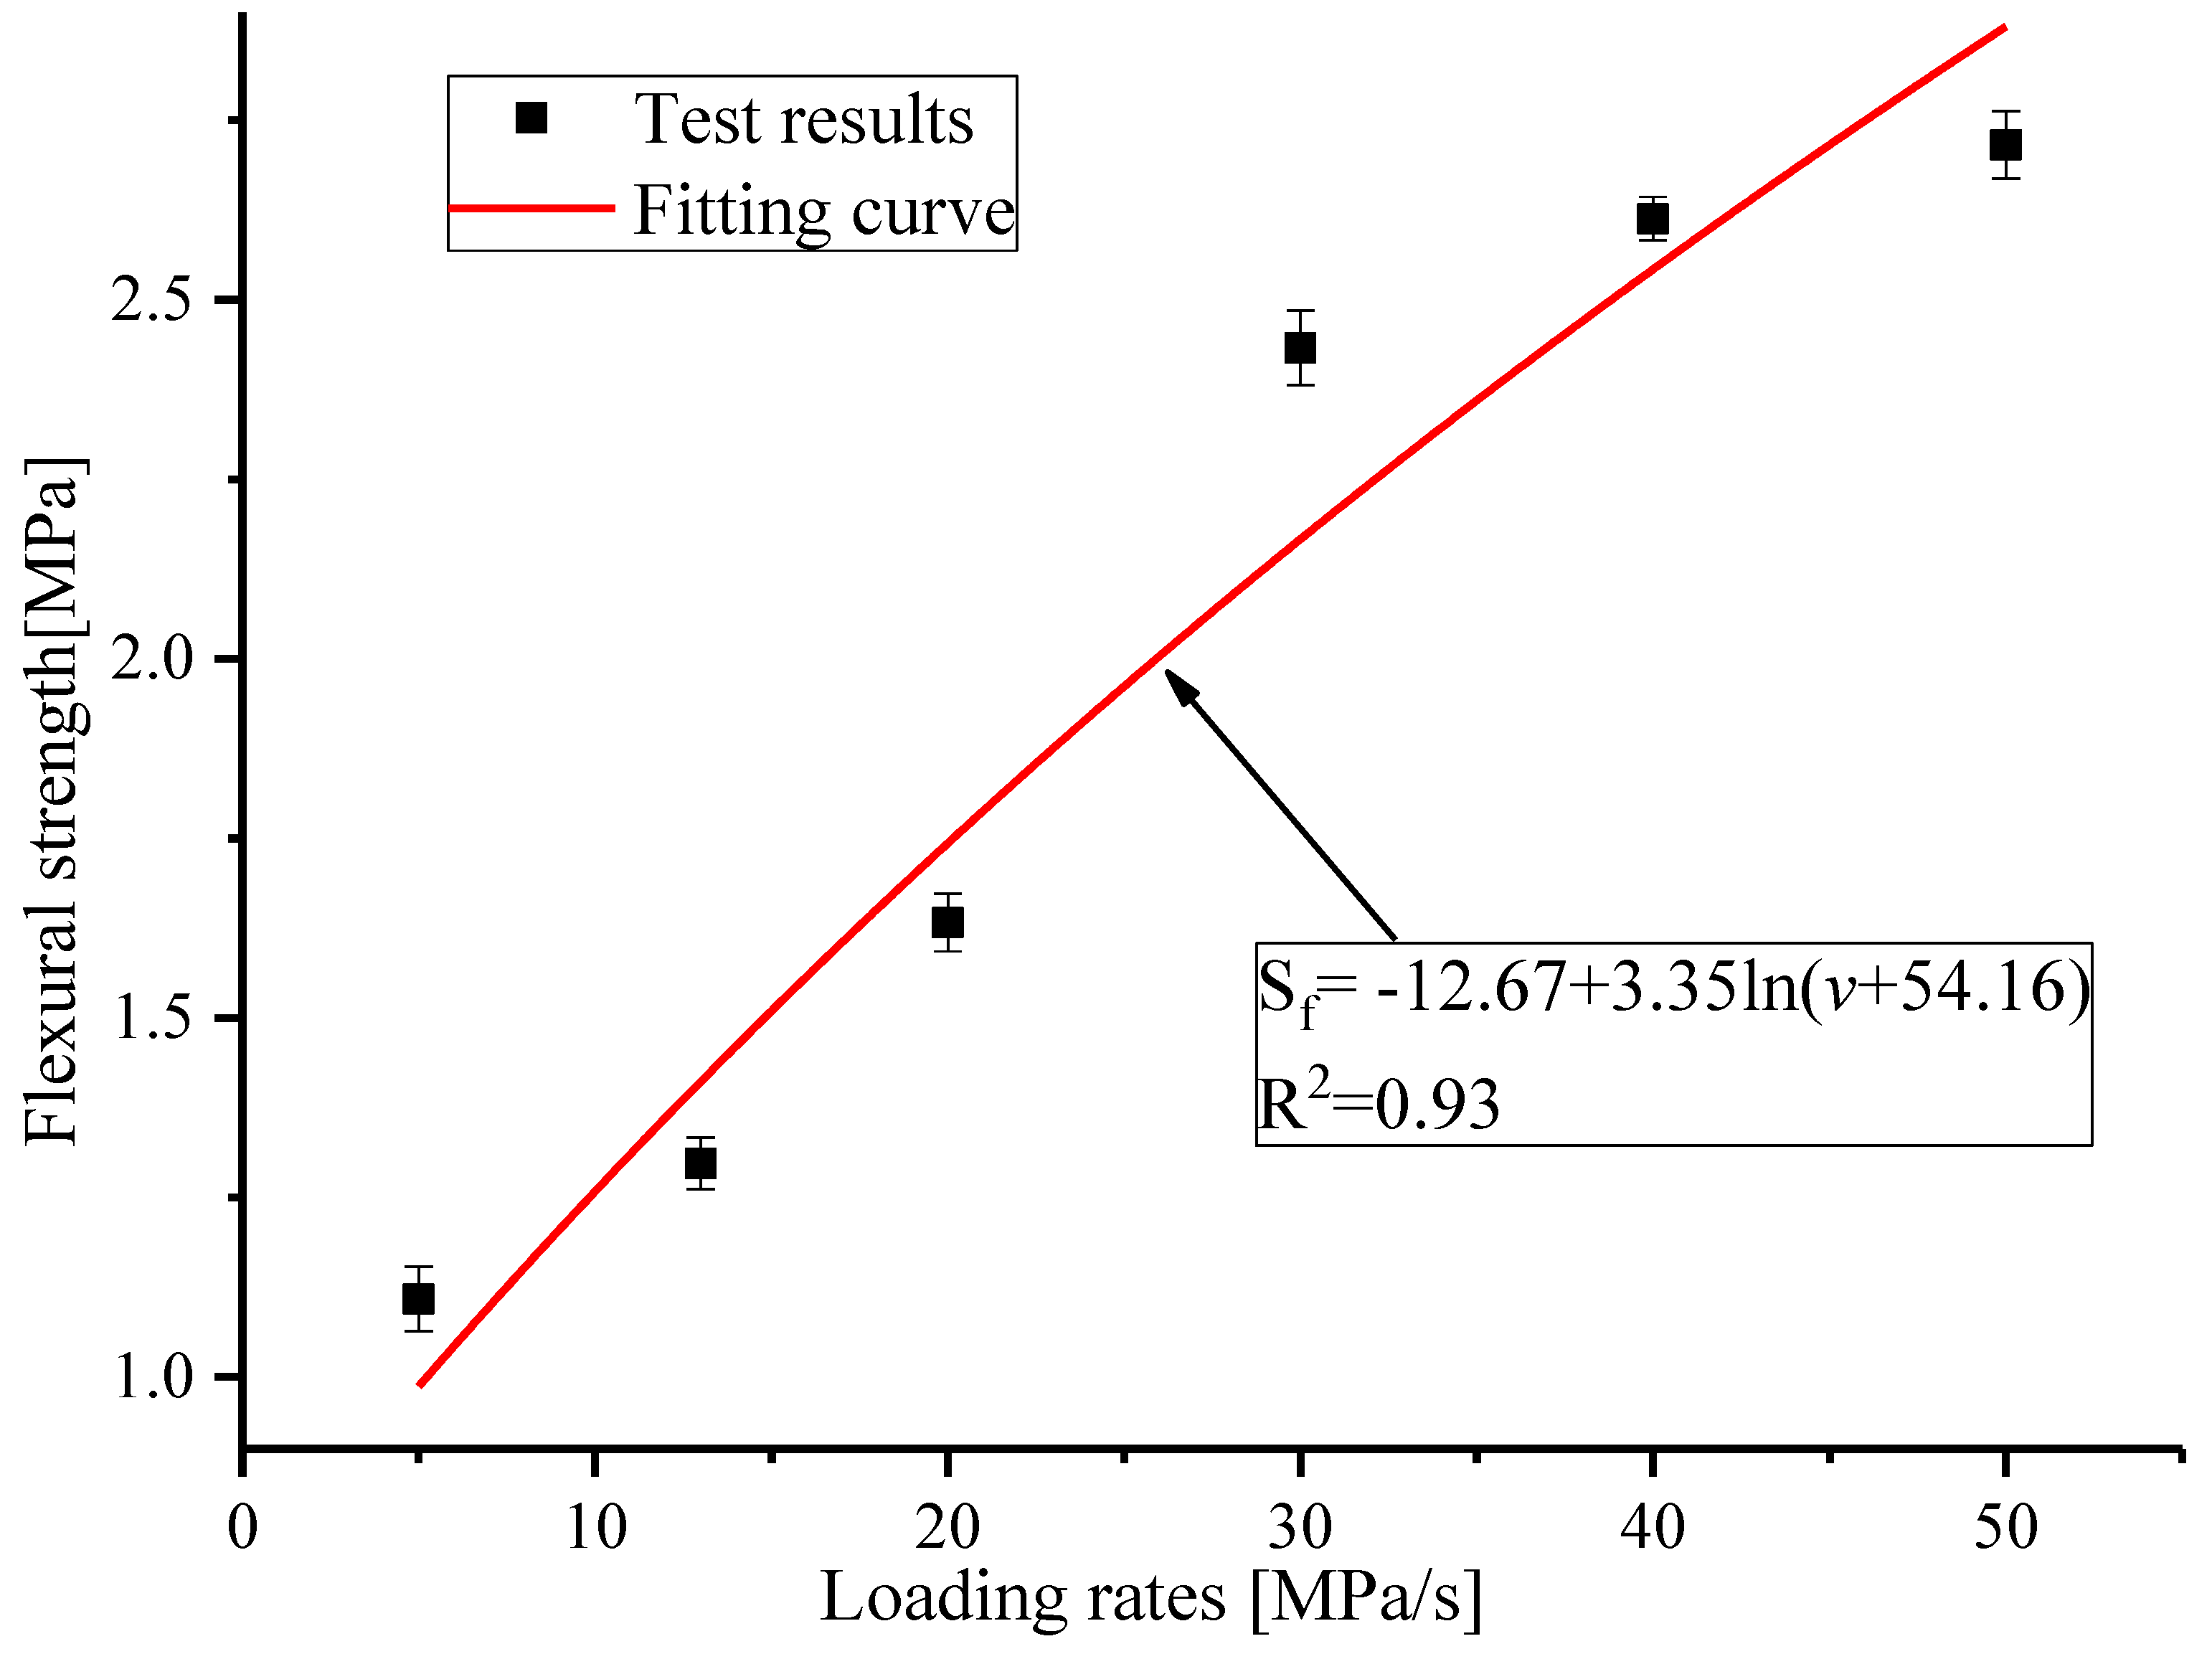
The fitting result for flexural strength with loading rates is shown in
Figure 11;
R2 is the correlation coefficient.
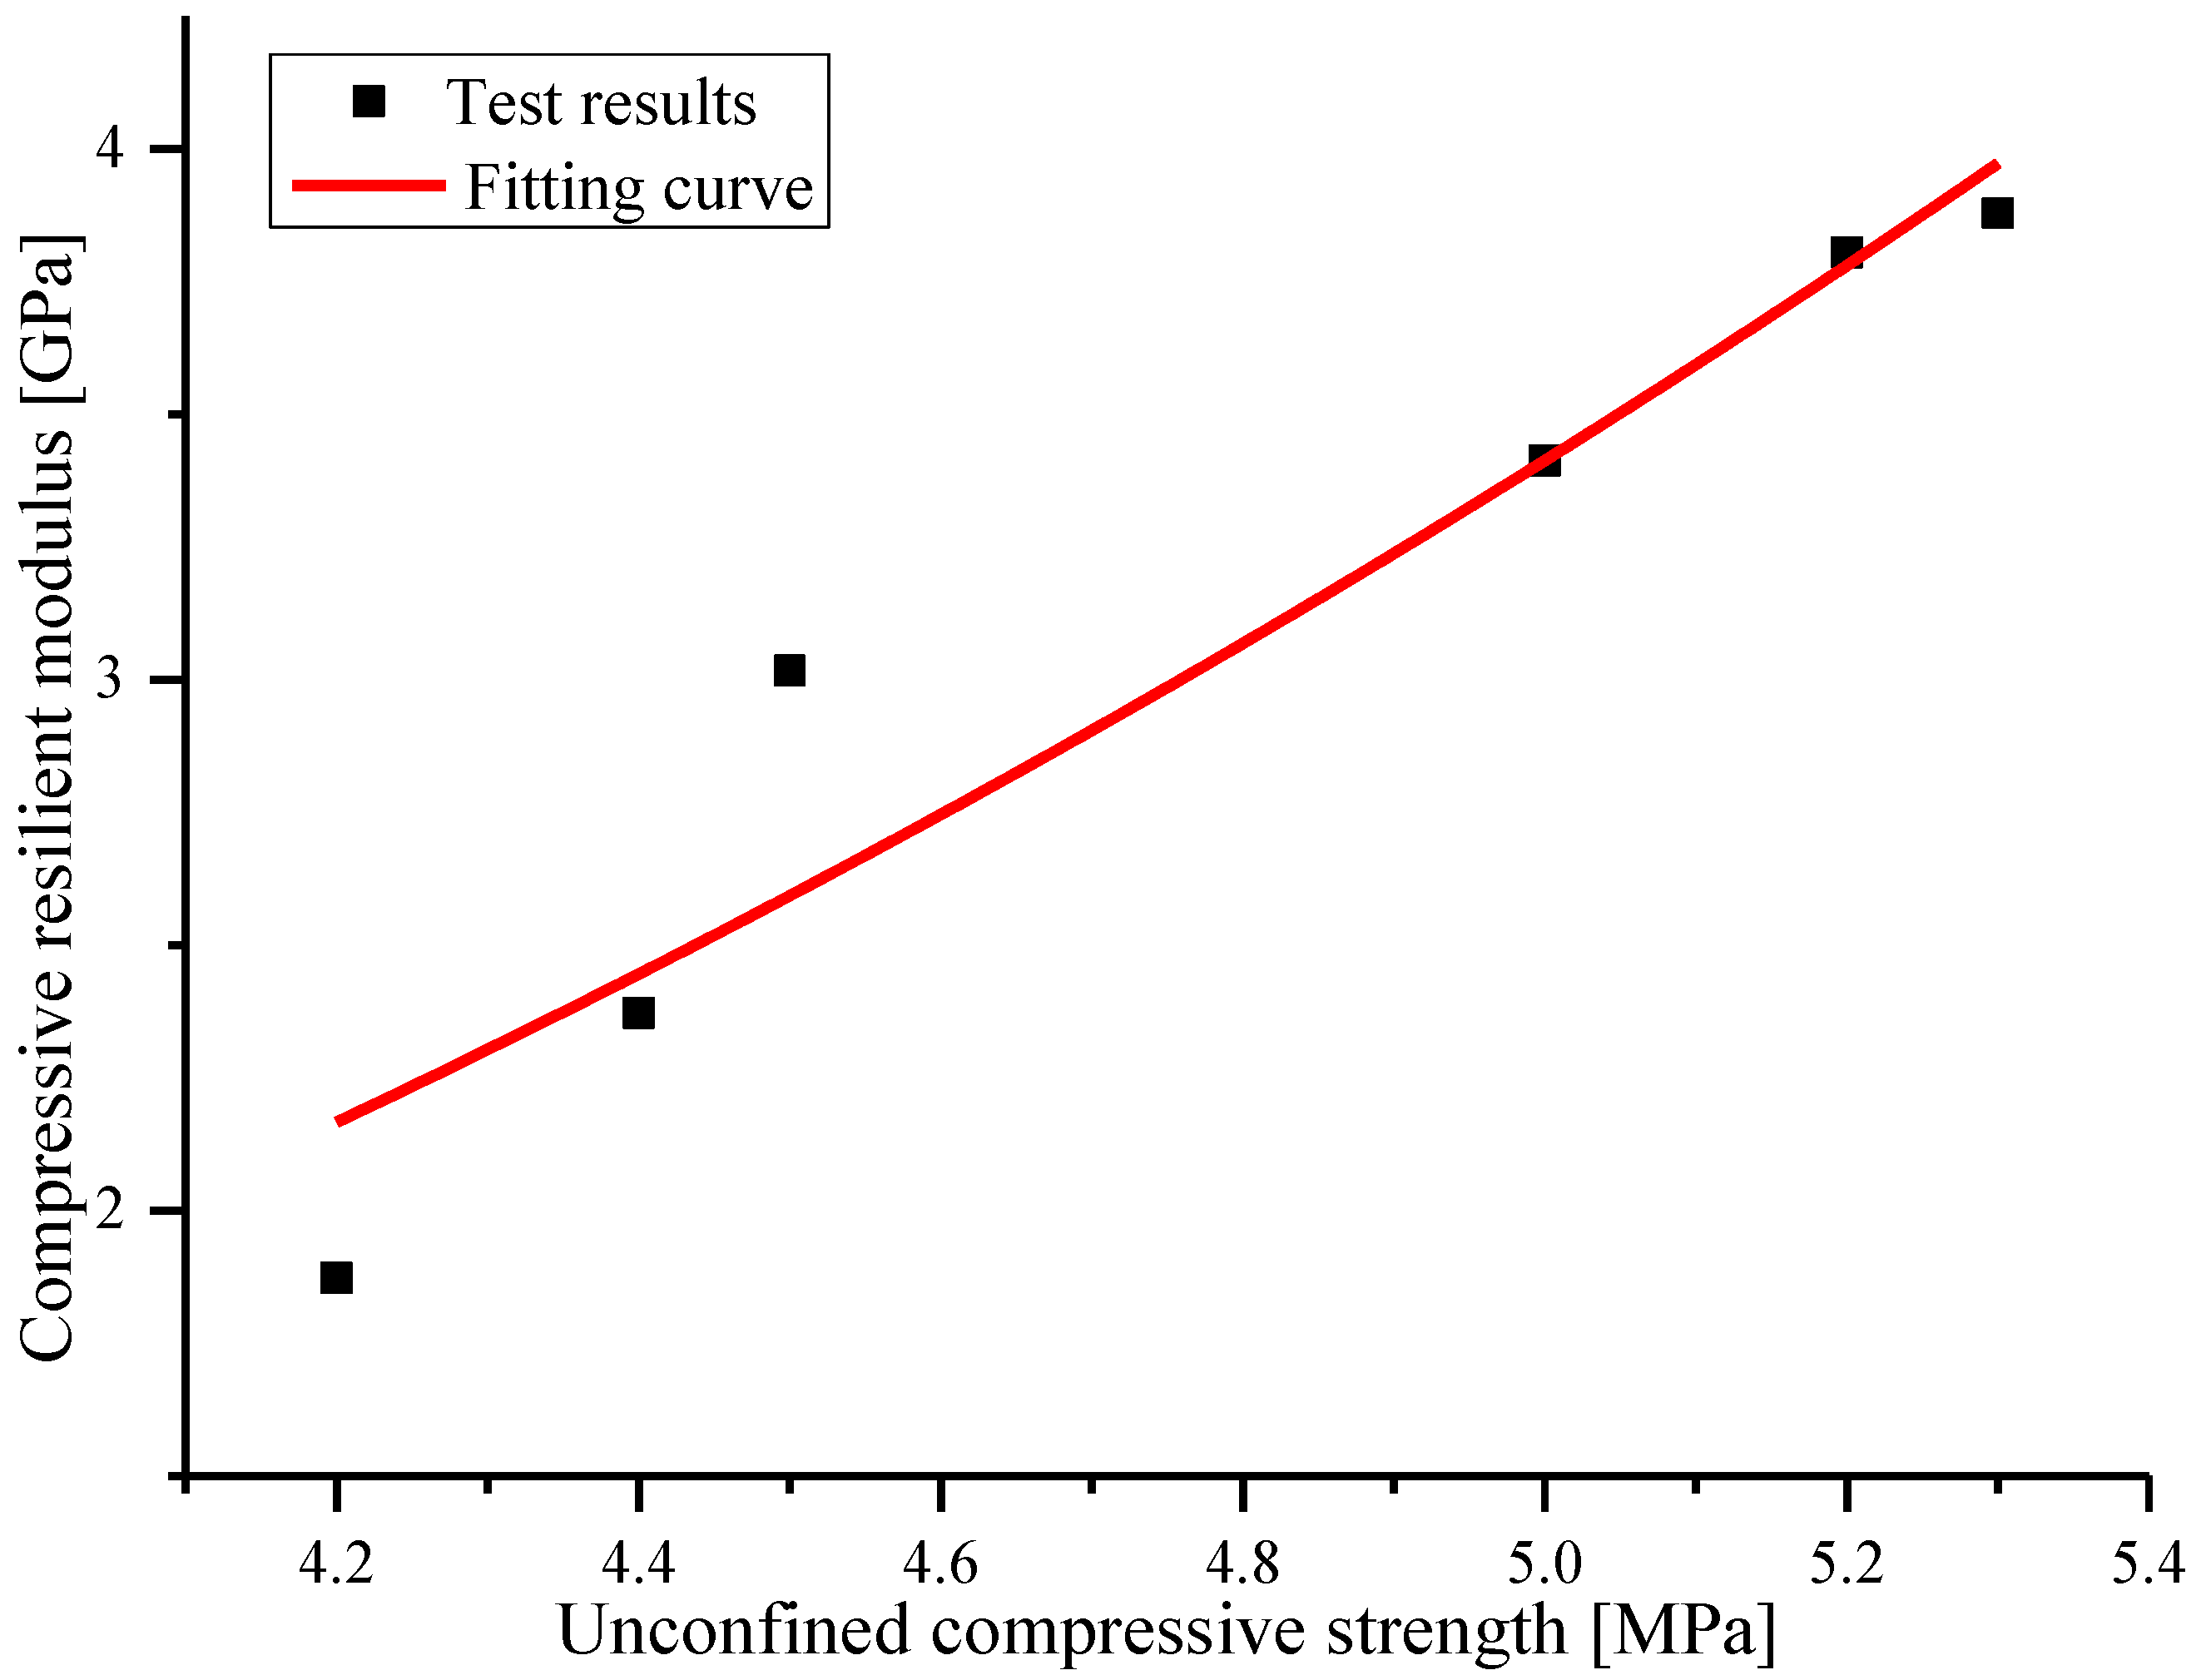
From the fitting results, it can be noted that the patterns of the variation of flexural strength with loading rates are similar to those of unconfined compressive strength.
- (2)
S-N fatigue equation characterized by nominal stress ratio and true stress ratio
Generally, the average speed of vehicles on the road is about 60~80 km/s, at which point the pavements receive a loading frequency nearly equivalent to 10 Hz. Thus 10 Hz was taken as the loading frequency of the fatigue tests. The sinusoidal wave illustrated in
Figure 12a was implemented as the loading waveform, and σ is the stress level. Based on the resulst of the flexural strength tests and the loading frequency, the control parameters of the four-point bending fatigue tests, namely stress level, nominal stress ratio and true stress ratio, could be calculated. The calculated results are presented in
Table 6. According to the test setting parameters in
Table 6, the four-point bending fatigue tests were carried out as shown in
Figure 12b, and the test results are presented in
Table 6.
The fatigue life of the cement-treated aggregate base material was fitted by S-N fatigue equation with a nominal stress ratio and true stress ratio, respectively. The fitting results are shown in
Figure 13.
① When stress levels of 1.5 MPa, 2.0 MPa and 2.5 MPa were exerted on the specimens during the four-point bending fatigue tests, the nominal stress ratios calculated by the standard strength 1.30 MPa were larger than 1. For these stress ratios, the fatigue life should theoretically be less than 1. However, their actual average fatigue lives were 312, 34 and 8, respectively, as shown in
Table 6. Meanwhile, when the nominal stress ratio was 1, the actual fatigue life was 247, as shown in
Figure 13, which means that the fatigue curve will not go through the point of (1, 1). The reason for this is that the strength of the cement-treated aggregate base material increases with the loading rates. However, the fatigue equation characterized by the nominal stress ratio could not consider it.
② When the true stress ratios were adopted in the
S-N fatigue equation to reveal the characteristics of the cement-treated aggregate base material, the discrepancy mentioned above was eliminated. Based on the test and fitting results, the fatigue curve characterized by the true stress ratio will pass through the point of (1, 1), as shown in
Figure 13. The parameter k′ of the fatigue equation N
f = k′(1/
t)
n′ was 1, so the equation can be expressed as N
f = (1/
t)
n′. This indicates that the fatigue life N
f will be 1 when the stress ratio
t is 1, which means the fatigue equation curve based on the true stress ratio can be extended to the strength failure point of (1, 1), where both the true stress ratio and the fatigue life are 1. The N
f = 1 represents the strength failure where the fatigue life is 1. Therefore, based on the test and fitting of the results, the fatigue curve reveals the internal relationship between the strength failure and the fatigue failure.
The fatigue equation based on the true stress ratio is more rational than the fatigue equation of the nominal stress ratio. The fatigue test results can be extended in both directions of the fatigue curve. However, if the fatigue curve characterized by the nominal stress extends in the two directions, it will lead to a larger deviation. The greater the scope of the extension, the greater the deviation.
The effect of the loading rates on strength can be considered in the S-N fatigue equations characterized by the true stress ratio. It increases the accuracy of the fatigue life prediction for the cement-treated aggregate base material.

 ,
, 


