1. Introduction
The Internet of Things (IoT) paradigm will be the next wave in the era of computing [
1]. IoT is the basic concept of basically enabling a global connectivity of any devices with an on and off switch to the Internet between the real world and a virtual world. Considering the increasingly popular smart devices that intuitively adjust the temperature, humidity, and light based on residents’ preferences and climatic conditions, IoT smart space applications [
2,
3] aim to enable features such as dramatically more efficient building operations, automation and environment control. Smart buildings is the highest user of IoT in 2017 according to Gartner’s recent smart city forecasts report [
4].
The majority of Heating, Ventilation and Air Conditioning (HVAC) systems [
5] for thermal comfort are either based on a single temperature control loop or, in some cases, on a multivariable temperature and relative humidity control loop. Nonetheless, when considering the optimization of human thermal comfort, other parameters should also be considered in order to meet the comfort requirements of residents in the building [
6]. The thermal comfort model is designed to take into account all these considerations. Predicted Mean Vote (PMV) is among the most widely adopted comfort models for evaluating global thermal comfort in buildings with mechanical cooling. Thermal comfort is roughly half from air convection and half from the mean radiant temperature [
7]. For a certain temperature, the PMV index can vary as air temperature and mean radiant temperature change, with a consequent shift of the environmental category. Reading both air temperature and the mean radiant temperature gives the more accurate operative temperature, which keeps people more comfortable and uses less energy at the same time.
In general, control and optimization methodologies of the thermal comfort can be generalized into two approaches that are real-time based control of the building [
8,
9] or offline-based strategic choices for structural changes [
10,
11]. Moreover, in order to reach an optimal comfort situation and reduce the energy consumption in the meantime, the trade-off between users’ comfort and energy efficiency should be taken into consideration. As a result, Model-based Predictive Control (MPC) systems are universally used to design and build control systems with the purpose of minimizing the optimal cost function to reach the best trade-off point between users’ comfort and energy consumption without affecting users’ welfare. MPC is intended to forecast the future evolvement of the control system by using the model of the plant and buildings [
12,
13]. It has successfully been accepted as the occupation standard in the process industry for complex constrained multi-variable control problems [
14] due to its unique capacity to effectively deal with hard constraints on control and states.
In the past few years, many researchers have made efforts in dealing with MPC for building energy control and management. Among them, the work presented in Pˇcolka et al. [
15] is possible to bring attention to, where a linear time-dependent based MPC model is presented. The benefits that an MPC can provide towards especially old buildings designed with poor construction materials and systems are shown and commented in Carrascal et al. [
16]. RC models are utilized to model the residence and experimental results indicate that the proposed system results in lower energy usage between 10% and 15% compared to traditionally used simple ON-OFF controllers.
Generally, these systems are only designed with constant parameters schemes and they don’t consider direct knowledge of the control system. Most of the control strategies only have a concern with energy consumption savings disregarding the human comfort factor [
17], which bring about many limitations for Indoor Environmental Quality (IEQ) control. Although some of the control methods apply the PMV model, they give priority to the indoor thermal environment, thus simply treating all occupants without discrimination and not thinking about outdoor environment conditions. Outdoor climatic factors have different influences on interior environments through different ways and means. For example, strong solar radiation in summer can affect the interior temperature of buildings so as to increase the cooling energy consumption.
Our contributions in this work are as follows: first, we propose the architecture of the enhanced MPC-based thermal control system for controlling and optimizing the thermal comfort in the building. A PMV regression model has been designed and a simplified conventional PMV equation has been proposed. Secondly, a fuzzy controller is designed, aimed at being under real-time control and optimization of the thermal comfort level in the building. The most relevant part of this work, which makes it a step forward for building HVAC systems, is that the fuzzy controller taking account of the outdoor weather conditions such as season and outside temperature. As a result, the fuzzy controller is capable of automatically regulating the indoor comfort conditions according to the seasons. Lastly, an IoT smart space prototype is implemented as the proof of concept for the designed system to evaluate the performance of the designed system. Intel Edison boards, which support the wireless communication and computing capabilities, have been used to integrate with these physical sensors and actuators. The performance of the prototype is experimentally tested in summer in a lab of a building on Jeju Island, Korea.
The remainder of this paper is organized as follows:
Section 2 gives a brief introduction on HVAC systems for thermal comfort and discusses some of the similarly related research.
Section 3 provides a brief introduction of PMV index along with its equations.
Section 4 details the proposed MPC comfort control system by describing the multiple linear regression (MLR) based predictive model and the fuzzy logic controller, respectively.
Section 5 provides some insight into the implementation of the case study.
Section 6 overviews the experimental setup and reports the results of the proposed thermal control system.
Section 7 outlines the significance of the proposed work by a comparative analysis with the existing approach.
Section 8 discusses a specific application that could benefit from the significance of this work. Finally,
Section 9 summarizes the main conclusions and discusses the future direction of this paper.
2. Related Work
The idea that buildings play a major role in IoT is well established since they are responsible for almost half (48%) of all energy consumption costs by humans [
18]. The occupants of the building feel comfortable when energy-efficient buildings are effective [
19]. Otherwise, they will take selective means of heating or cooling a space by turning on electric heaters or air conditioners, which could increase energy costs much more than ordinary HVAC systems [
20,
21,
22]. It is hard to measure the thermal comfort due to its high subjectivity. In addition, it can be a little bit different for each individual to experience these sensations in terms of his or her physiology and state [
23]. As a result, thermal comfort is the condition of mind that expresses satisfaction with the thermal environment [
24]. Tremendous potential of control systems has been widely adopted for maintaining the comfort of occupants in order to improve their productivity and reduce the building energy consumption. Recently, a number of separated studies have been conducted in various disciplines that focus on specific issues and challenges regarding assessing, creating and maintaining indoor comfort conditions for building occupants.
Soft computing and machine learning techniques are widely applied in weather parameter forecasts according to several scientific papers. Fuzzy logic controller (FLCs) of indoor thermal parameters is one of the typical applications in this research. The PMV index is characterized by nonlinear features, which cause lots of complications in the control of HVAC system. Calvino et al. [
25] proposed an adaptive fuzzy controller for the microclimate control of confined indoor environments to overcome these issues. The PMV, used as the core for the control objective, reduced the difficulties of modeling the indoor environments. In [
26], the authors presented an intelligent control system incorporated fuzzy controllers, intelligent coordinator and the users’ behaviors. The comfort was modeled by a 3D fuzzy set in a fuzzy cube to define the membership functions grade using a fuzzy equality measure. The authors used genetic algorithms in order to optimize parameters of the fuzzy controller. The proposed system had the capability to manage the thermal comfort, indoor air quality and energy conservation according to the occupants’ preferences. In [
27], a model-free method using a reinforcement learning scheme was proposed to tune a supervisory controller for the building energy system online. The learning time could be substantially reduced by using fuzzy sets to partition the state space and parameterizing the candidate rule bases. One optimal parameter was additionally used to select the most appropriate set of rules. In these works, set-points for temperature and air velocity are defined by the fuzzy logic controller to partition the thermal comfort level. However, some works treating thermal comfort as a comfort zone were presented in the sequence. A fuzzy ventilation control approach [
28] was proposed, aimed at using the free cooling and dehumidification available by maintaining the zone conditions at preferred set point values applied to the ventilation system and by using the HVAC plant when necessary. Another study related to thermal comfort and energy saving purposes was presented in [
29] where a hierarchical and adaptive control strategy was proposed combining the classical control techniques with fuzzy logic rules. The main idea of this approach was to regulate the solar gain by acting on window blinds and avoiding glare at the working place. In [
30], the author proposed the first approach where a PMV index was applied in the MPC scheme based HVAC system, in order to optimize occupants’ thermal comfort sensation. The manipulated variable was the input provided to the HVAC device like a heater while the controlled variables are temperature and relative humidity. In [
31], a neural network based thermal comfort controller was proposed, which was capable of providing the highest comfort level for specific users by learning the user’s comfort zone, and optimizing the indoor comfort level within the desired range in achieving energy saving. In [
32], the energy consumption of an HVAC system was optimized by using a dynamic neural network. A model was built with data mining algorithms to optimize controllable set points of the HVAC system. Three modified multi-objective particle swarm optimization algorithms were applied to solve the designed model.
To the best of our knowledge, these above-mentioned systems either use the fuzzy rule based control approach or MPC techniques relying on the principles of the classical control. Additionally, they do not take into account the outdoor environment conditions and treat all occupants equally. It is necessary to adapt the thermal comfort conditions according to the change with the season. We believe that the advantages of both paradigms can be integrated to design an enhanced HVAC system and thus advance in performance.
3. Predicted Mean Vote Index
The definition and control of indoor thermal environment conditions for reaching the optimal level in buildings are difficult to be established. The heat transfer of the human body is proportional to temperature difference. In cold environments, the body loses more heat to the environment and in hot environments the body does not exert enough heat, which leads to discomfort [
33]. Thermal comfort can be stated as the condition of the mind that expresses satisfaction with the thermal environment in agreement with ANSI/ASHRAE Standard 55 [
34]. Similar to ASHRAE Standard 55, there are other comfort standards like EN 15251 [
35] and the ISO 7730 standard [
36].
However, the PMV model stands among the most disseminated models for evaluating indoor thermal comfort. It was developed using principles of heat balance and experimental data collected in a controlled climate chamber under steady state conditions [
37].
The PMV refers to a thermal scale that runs from Cold (−3) to Hot (+3) as shown in
Figure 1. In addition, 0 is the ideal level, considering a comfortable environment recommended by the international standard [
38], and the comfort zone is defined within a certain tolerance (−0.5 to +0.5). Positive values of the PMV indicate warm environments while negative values denote cold environments. Furthermore, the PMV index is mainly influenced by the following six variables from indoor-air and human condition: metabolic rate, clothes’ thermal insulation, air temperature, relative humidity, air velocity and mean radiant temperature. Most of these variables can be easily gained through sensors or by means of simple methodologies [
39]. However, some variables like metabolic rate and clothes’ thermal insulation are difficult to calculate since they are on the basis of the location of people and the season, tabulated values have been procured for them [
40]. For example, 1 and 0.5 are the associated clothing insulation values for the winter and summer season, respectively. Moreover, for a relaxed seated person, the corresponding metabolic rate is fixed to 1.0 met. In some research, the mean radiant temperature was assumed to equal the air temperature due to the requirement of multiple sensors and the difficulty of measurement [
41]. However, this is not the case of buildings with powerful ventilation or near heating or cooling facilities where deviations between the mean radiant temperature and the air temperature can be bigger with uncertain effects in terms of PMV values [
42]. In addition, the mean radiant temperature has a strong variation with the room shape including room height and length [
43]. In well-designed low energy buildings, the accuracy of PMV values are acceptable only if the difference between mean radiant temperature and air temperature is less than 2 °C [
44]. The PMV index within an indoor environment can be obtained according to Equation (1).
Where
W (
) is the rate of mechanical work performed by human for the development of a certain task,
M (
) is the metabolic rate which measures the human activity level,
is the air temperature,
is the clothes thermal insulation and the
represents the vapor pressure in the indoor air,
The clothing surface temperature
can be given by Equation (2):
In Equations (2) and (3),
is the clothes area coefficient,
(
) represents the convection heat transfer coefficient and
(
) stands for the mean radiant temperature.
in which the
(
) represents the air relative velocity:
can be obtained in Equation (4):
4. Proposed Architecture of Model-Based Predictive Control for Thermal Comfort in Building
MPC is a simple and satisfyingly intuitive approach to constrained control that has been successfully applied in many areas over the last few decades. During each sampling interval, a finite horizon optimal control problem is formulated and solved over a finite prediction horizon. The result is a trajectory of inputs and states into the future satisfying the dynamics and constraints of the building while optimizing some given criteria. A convolutional MPC strategy consists of the following steps: first, a model is established to compute the predicted variable as the process output. Then, a cost function is defined and minimized in relation to the control signals. Finally, the first of these control signals is applied to the process.
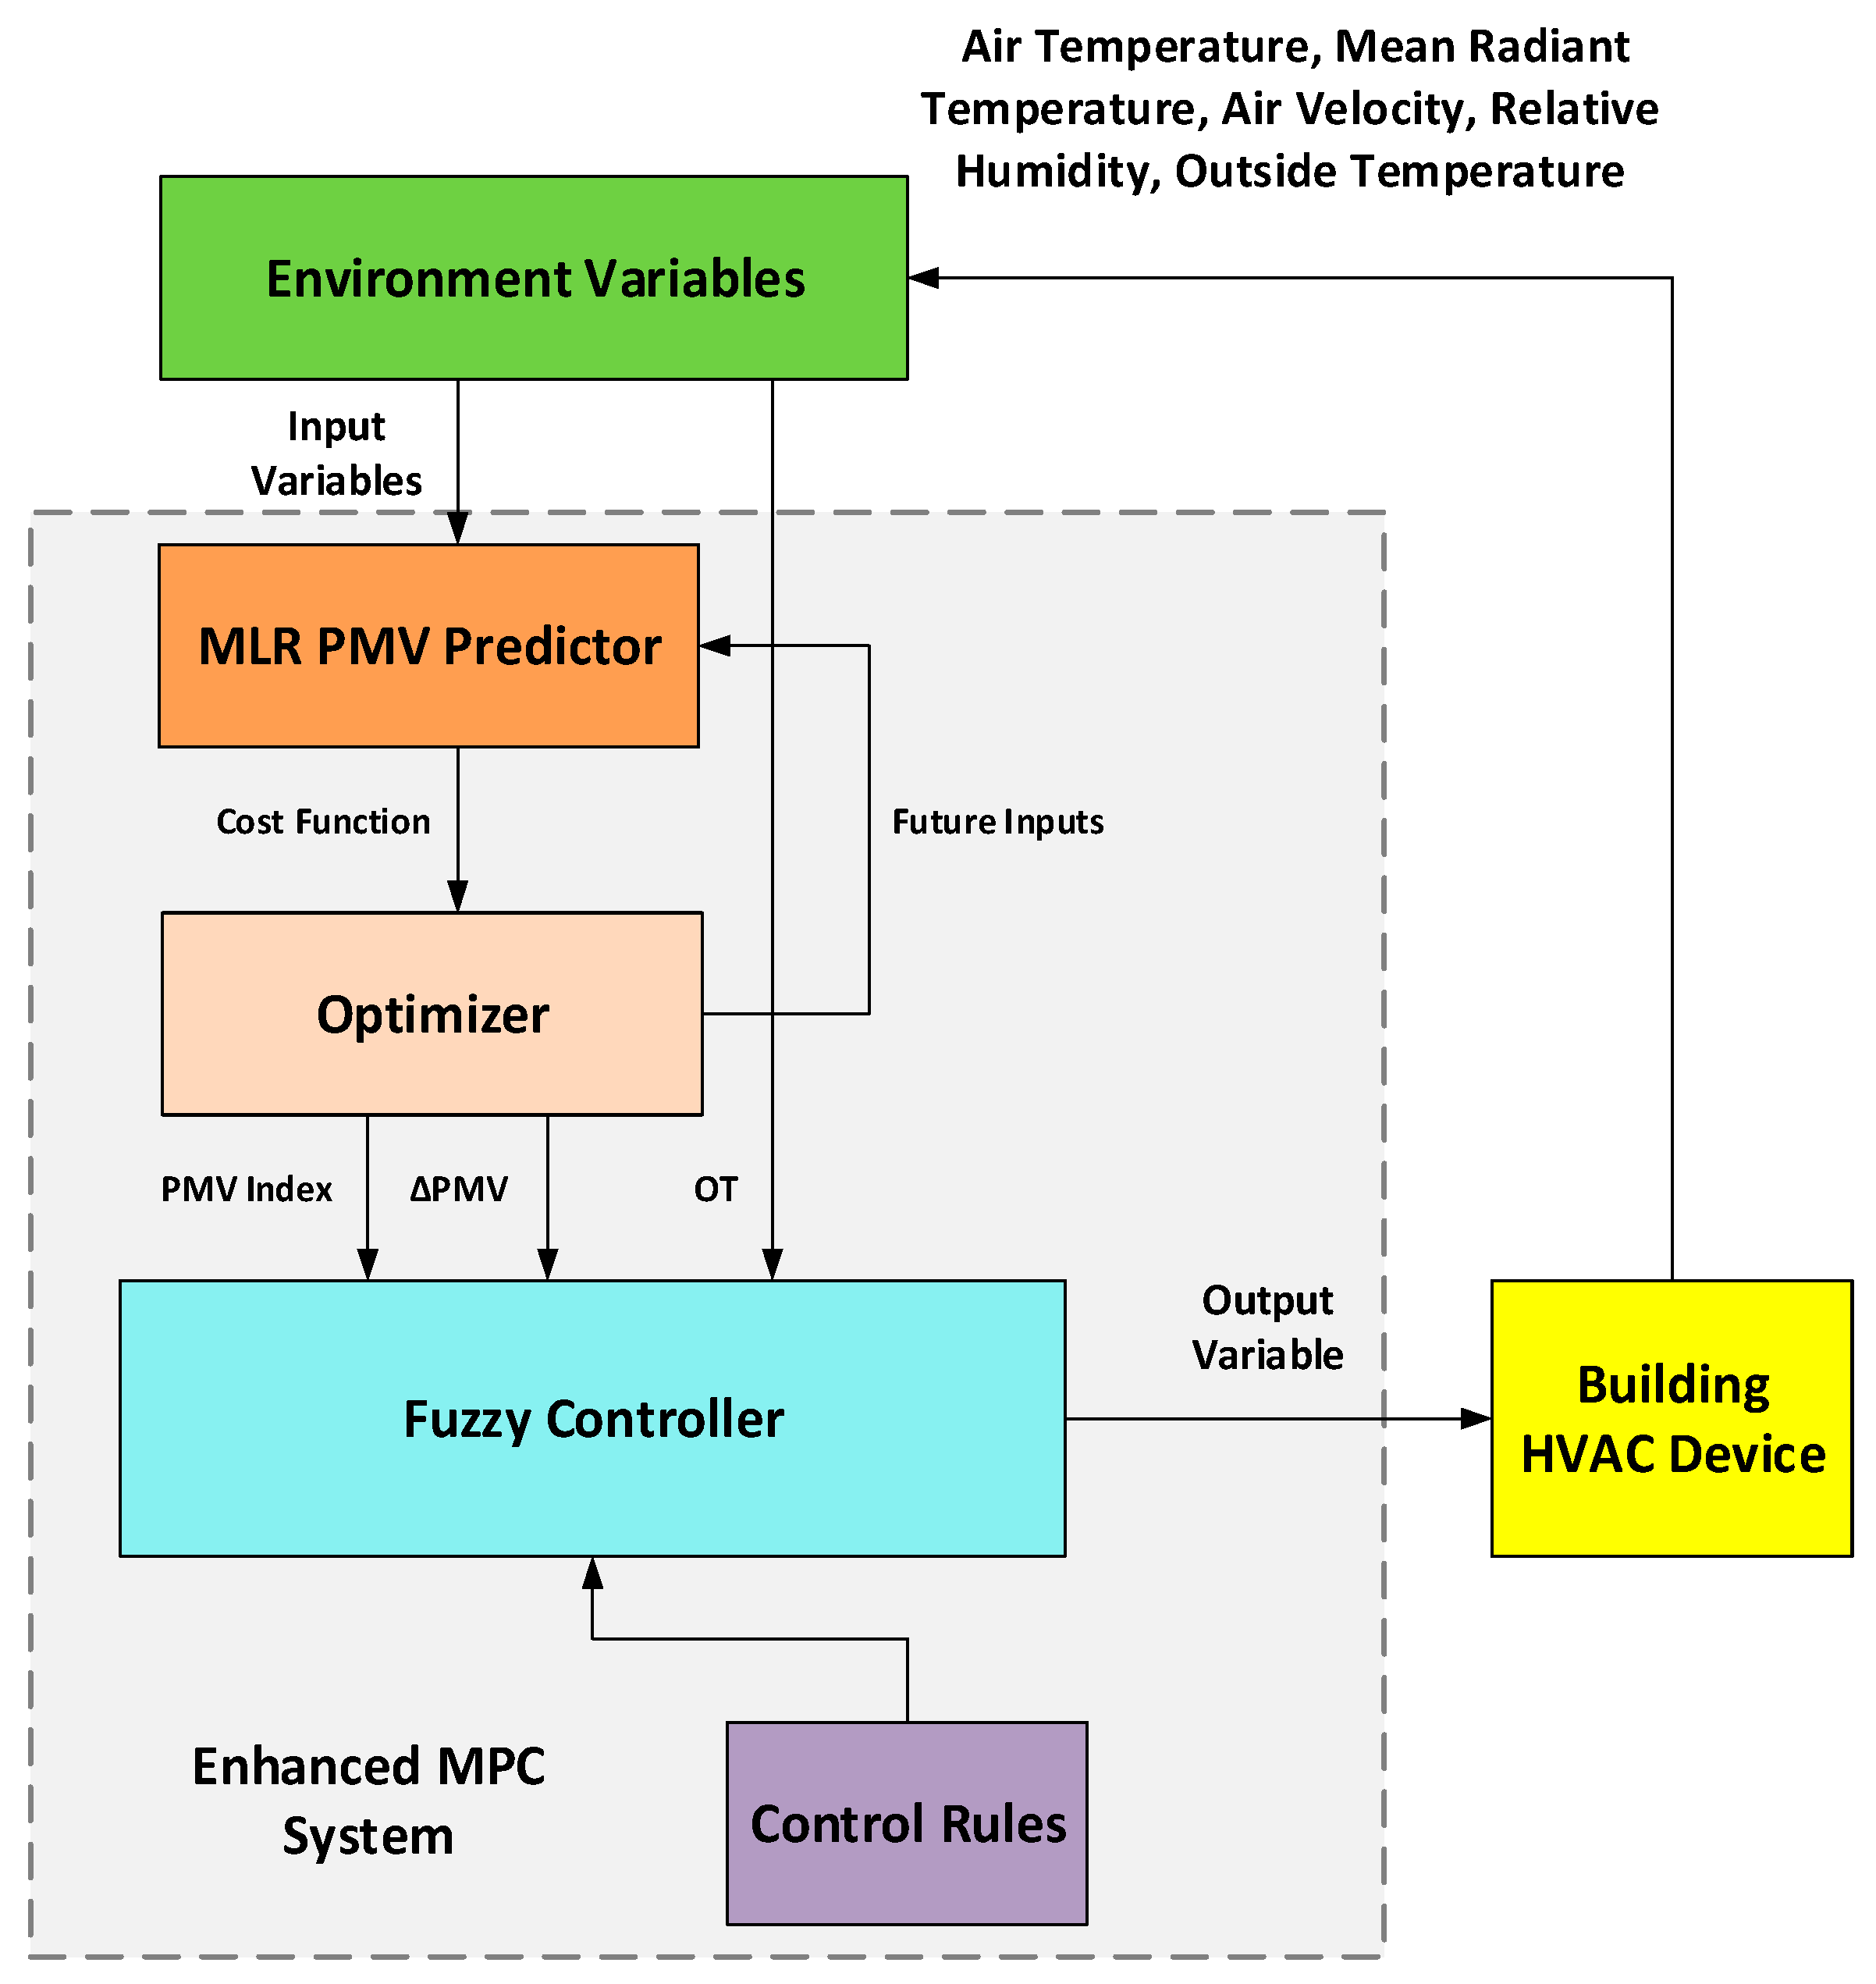
Figure 2 depicts the conceptual architecture of the proposed enhanced MPC system for thermal comfort control. The way that the thermal comfort issue is included in the control law is based on the PMV index. To reach this objective, the control system will follow a reference in order to reach an optimal indoor temperature that allows for obtaining a PMV index close to zero.
More specially, the model is designed in a MISO (Multiple-Input/Single-Output) architecture of an indoor home coupled the home HVAC system. The manipulated values (i.e., air temperature, relative humidity, air velocity, etc.) from the indoor environment are inputs of the control system and the control variable is provided to the HVAC device (e.g., fan). These input variables are used by the MLR predictor to estimate the PMV index. The optimizer sets the optimal inputs of the regression model depending on the cost function. The Fuzzy controller takes the estimated PMV index values, OT (outside temperature), and (variation of PMV index) to compute the control signal by referring to the predefined control rules. OT allows the control system to identify and capture knowledge about the outdoor seasonality when optimizing the indoor comfort conditions. The control signal is then applied to the building HVAC system for regulating the cooling devices. These are the main points that make the thermal comfort control system presented in this paper different from the existing ones. The detail processes the PMV prediction and the fuzzy control based on PMV optimization will be described in the following subsections.
4.1. Multiple Linear Regression Based PMV Prediction Model
Regression equations can be used for predicting environment factors such as temperature and relative humidity in single-zone buildings [
45]. A linear regression model that contains more than one regressor variable is called an MLR model. The MLR model can be formulated as follows:
Y is the dependent variable or response,
k is the number of independent or regressor variables,
is the independent or regressor variable,
k ranges from 0 to
k,
is the regression coefficient, and
is the intercept that includes the effects of un-modelled sources of variability that affect the dependent variable. In this paper, we apply the MLR for modeling the PMV index.
Table 1 details the way of data collection including gathering period, time, and data interval. It also represents measured environmental parameters for building the PMV regression model as well as their measure ranges. It can be seen from the table that the metabolic rate was set at 1.2 (met that is equal to 70 W/
) for a static activity and the clothing insulation at 0.5 (
) for average clothing in summer. Some of the air temperature and humidity data can be considered as outliers as they are out of the range according to ISO 7730; however, they only count for a very small percent (3.1%), hence we consider these data to be valid.
The cost function
e is given by:
where
m is the number of training samples,
is the true value of each sample and
is the predicted value. Each regression coefficient represents the mean change in response variable per unit change in the predictor variable while other predictors are held constant. For example, in the regression equation, if the air temperature variable increases by 1 and the other variables remain the same, PMV index increases by about 0.1 on the average. The coefficients of each variable are listed in the order of lower influence as shown in
Table 2. Coefficient of Determination (R-square) that ranges from 0 to 1 is a widely used measure for a regression model. R-square is the proportion of the variance in the dependent variable that is predictable from the independent variable(s). It can be seen from the table that the designed predictive model has a high R-square (0.8945). The simplified PMV regression model is generated by four parameters that are used as the independent variables: air temperature (
), mean radiant temperature (
), air velocity (
) and relative humidity (
), as shown in Equation (7):
4.2. Fuzzy Based Control Model
A fuzzy control system is a control system based on fuzzy logic that has been widely employed in many areas such as air condition, refrigeration and robotic control systems. Some other approaches like genetic algorithms and neural networks can perform as well as fuzzy logic in many cases; however, fuzzy logic has the advantage that the solution to the problem can be cast in terms by using the common sense or experience that makes human operators understand easily. Among the most successful applications of this theory has been the area of fuzzy logic control (FLC) initiated by the work of Mamdani [
46]. Mamdani fuzzy inference is the most commonly seen fuzzy methodology and was among the first control systems built using fuzzy set theory. The FLC provides an algorithm that can convert the linguistic control strategy based on expert knowledge into an automatic control strategy. A linguistic variable is a linguistic expression labeling an information granular, such as age for persons or temperature for weather. Since natural languages do not always contain enough value terms to express a fuzzy value scale, it is common practice to modify linguistic values with adjectives or adverbs. In this paper, the Mamdani rule structure with the linguistic fuzzy modeling has been applied in the PMV based thermal control. Two kinds of membership functions, triangular or trapezoidal functions, are contained in the fuzzy system to define the fuzzy variables. The characteristic function
assigned by four quantified variables: (
a,
b,
c,
d), describes the trapezoidal fuzzy set
A. Equation (8) interprets the mathematical representation of the proposed membership function:
It is noteworthy that the trapezoidal function can be regarded as a triangular one if
b =
c. Equation (9) defines the intersection operation between two fuzzy sets
A and
B, where
and
x can be any element in the
U universe:
and their union is defined by Equation (10):
The circumstance of the environment conditions can be described by means of linguistic rules, which opens to the adoption of fuzzy controller. The proposed fuzzy controller takes input variables including the PMV index value, the PMV index variation value, and outside temperature while the output variable of the controller is the fan coil speed. The input membership functions for the PMV, PMV variation and outside temperature are represented in
Figure 3,
Figure 4 and
Figure 5, respectively, while the output membership functions for the fan coil speed is depicted in
Figure 6.
Table 3 illustrates the linguistic terms of the input and output variables and their corresponding trapezoidal fuzzy sets. The following equation is applied in the proposed fuzzy control system to calculate the quantifiable results of the given fuzzy sets and corresponding membership degrees:
The Modified Center of Area (mCoA) defuzzification method is considered as it takes into account all of the area covered by the scaled membership functions, even if this area extends beyond the range of the output variable. The interval of integration lies between the minimum membership function value and the maximum membership function value.
The comfort control process of the fuzzy controller is detailed in
Figure 7. The fuzzifier module takes the PMV index value and its variation value every ten minutes as well as the OT. These parameters are converted into fuzzy sets to the fuzzy inference system (FIS) and then the output sets are computed, which are referenced by the control rules. The defuzzifier module infers the output value V from the output set, in a range from 0–100%, which stands for the minimum to maximum speed of the fan coil unit.
The proposed fuzzy controller focuses on maintaining the indoor comfort level in a summer comfort condition if the outside temperature is very high. Otherwise, the environment comfort level is set to neutral by the controller when the outside temperature is high. In simple terms, the controller acts more like a regulator of HVAC equipment according to the PMV index value and its variation.
Table 4 shows a sample of the fuzzy rules and, in total, 175 rules have been built.
5. Implementation Details
A Wireless Sensor Network (WSN) based experimental prototype of the control system is designed in order for verifying the feasibility of the designed procedure. The conceptual architecture of the proposed prototype consists of three types of IoT nodes as illustrated in
Figure 8: sensor node, proxy node and actuator node. The sensor node is responsible for collecting and delivering environment data using various physical sensors like air temperature, relative humidity and air velocity sensor. The proxy node that contains the data collection, PMV regression model, and the fuzzy controller module processes the environment data and generates control signals accordingly. The actuator node takes charge of adjusting the surroundings indoors such as speeding up the fan for air cooling. Lastly, the communication channel between nodes specifies the communication protocol—for example, Constrained Application Protocol (CoAP) [
47] released by Internet Engineering Task Force (IETF), for data exchange and command transmission in WSN.
The following contents give an overview of the implementation tools, hardware, and technologies used to develop the smart space use case. The prototype consists of three kinds of computing nodes as shown in
Figure 8 so that the development environments have been concluded into three tables to describe the development environment for each node separately.
Table 5 depicts the development tools and technologies used for implementing the IoT sensor nodes hosted on the Intel Edison (City, US State abbrev. if applicable, Country). The operating system on Intel Edison [
48] is flashed into Android Things so that the applications can be developed using Java programming language. Physical sensors including air temperature, relative humidity, etc. have been implemented into CoAP resources as part of the sensor node server. Each resource is assigned with a unique Uniform Resource Identifier (URI) so that it can be identified by the server.
Table 6 presents the developer kits and technologies used for the IoT proxy node. The CoAP server is also deployed on the proxy node and is developed in Java programming language. The proxy node sends a request to each sensor node on the appointed port and performs the operation on the corresponding sensor to obtain environment data for computing the PMV index. SQLite database is used as the repository to hold sensing information from the IoT sensor nodes. The Weka and jFuzzyLogic are two open source machine learning libraries used to implement the MLR predictive model and the fuzzy controller.
Table 7 presents the technology stack for developing the IoT actuator node. In this case, only one control unit has been used to regulate the indoor environment conditions. Similar to those sensor devices on the sensor nodes, the fan actuator is implemented as the CoAP resource of the actuator node server. The actuator node listens for the request from the proxy node and performs the fan unit accordingly.
6. Use Case Study: Smart Space
Figure 9 presents the finalized form of the smart space case study in
Section 5. This prototype has been developed as a miniature representation of a smart space scenario where multiple sensing devices are deployed to capture the contextual data and an actuating device is deployed to adjust the surroundings in the indoor environment. The prototype consists of the following sensing and actuating devices that are clearly labeled in
Figure 9. The technical characteristics of all devices used are illustrated in
Table 8.
The thermistor produced by Tinkerkit is a resistor whose resistance varies significantly (more than in standard resistors) with temperature. The output approaches to 5 V as the temperature rises while approaches to 0 V as the temperature falls down. This module also features a signal amplifier, a standard TinkerKit 3pin connector, a green LED that indicates the power and a yellow LED whose brightness changes according to the temperature. The relative humidity sensor is the model HIH-4030. With a typical current draw of only 200 μA, it is often ideally suited for low drain, battery operated systems. In addition, the sensor’s near linear voltage output makes it possible to direct input to a controller or other device. These two sensors are hung on the west wall of the lab. The GT-1 globe temperature sensor uses a thermistor inside a hollow block sphere, in order to measure mean radiant temperature. This sensor is hung on the north wall near the windowsill at a certain distance from other devices since the mean radiant temperature value can be affected by the presence of the subject or other artefacts. The DSB18B20, put on the windowsill outside the lab, is used to measure the temperature outside. This module provides a unique 64-bit serial code, which makes it easier to control multiple DS18B20s distributed over a large area by using one microprocessor and thus benefits HVAC environment controls and temperature monitoring systems inside or outside buildings. The SKU: SEN0170 is a three-cup wind speed sensor that is located on the desk. It is composed of a shell, the wind cup and the circuit module. Electronic components are all imported industrial chips, which creates extremely reliable electromagnetic interference resistance overall, and can ensure that the host can work normally in most environments. The L9110 fan module unit acts as part of the HVAC system in order to perform the control signals by setting the fan coil speed. It can control positive and negative going motion by setting the logic signals to two pins INA and INB while two other pins are supplied with 5 V and Gnd. The fan module is also put on the desk, used as the only unit for the entire indoor condition without making any modification of the structural configuration. The IoT hardware used to implement the smart prototype is the model Intel Edison, which is a small-sized computer with a processing unit, integrated Wi-Fi, storage and memory. Intel Edison boards have been used as they provide a large spectrum of I/O options for interfacing with physical devices. The proxy is an embedded server, which collects the measurements from other sensors to estimate the PMV index value and generates the control signal to the fan module, and this information is visible through the PC screen. The control system has been tested in a lab of the engineering building of Jeju National University, Korea throughout June in 2017. These devices wirelessly communicate with each other via a router, which is connected to the local network. The internal area of this lab was around 5 with a door near the central aisle and one outdoor windowsill, which is directly exposed to the sun (north oriented). In general, the interior temperature is around 22 and the outside temperature is around 31.3 in Jeju during the summer period.
In order to evaluate the performance of the designed system, a number of experiments have been carried out to validate whether indoor comfort conditions could be achieved in different weather conditions. We select partial experimental data from 2:00 p.m. to 4:40 p.m. on 24 June and these results are summarized into three different line charts accordingly.
Figure 10 represents the trend line of the PMV index during the experiment in the summer period. It can be seen that the extremely hot condition from the beginning, where PMV > 1.2, is changed to a relatively comfortable condition in less than one hour. In addition, about 70 min later, the control system can bring the room to an optimal comfort condition (−0.5< PMV < 0.5), which has been maintained since then.
Figure 11 reports the change of rotating speed percentage of the fan with respect to the measured PMV index in
Figure 10. At the beginning, the control system induced the maximum speed to the fan, until the measured PMV index value entered within the comfort range. When the system entered that point, consequently, the fan speed is reduced. Furthermore, the trend of the observed indoor temperature accompanied by the PMV index is depicted in
Figure 12.
7. Comparison and Significance
A measurable performance comparison analysis is required to be regulated as it is not persuasive enough to assess the performance of the controller by only error qualitative analysis. Specifically, thermoregulation can greatly vary from one to the other depending on the environment configuration and its thermal properties. We choose to compare our proposed system with the existing approaches, which do not consider the outdoor environment conditions. Thus, the input parameters used by the fuzzy controller are modified and the testing process is performed, which relies on the following steps:
Test the proposed approach under the fixed inside and outside temperature set point in beginning;
Compute the steady stable temperature reached, which is used as the set point to compute the error as well as the related performance indices. For instance, the steady stable temperature was 25.03
which can be seen from the test result shown in
Figure 12;
Test the existing approach to reach the computed set point under the same environmental conditions;
Compute the related performance indexes.
In order to adjust the controller parameters to produce an optimal controlled response, we need to decide what constitutes a good response. In fact, many different measures that can be used to compare the quality of controlled responses. Three commonly performance indices are used in the comparison process:
ISE is the integral square error over time, which will penalize large errors since the square of a large error can be much bigger. Control systems specified to minimize
ISE will tend to eliminate large errors quickly, but will tolerate small errors persisting for a long period of time;
IAE represents the integral of the absolute value of error, it doesn’t add weight to any of the errors in a systems response and tends to produce slower response than
ISE optimal systems but usually with less sustained oscillation; and the
ITAE integrates the absolute error multiplied by the time over time to weight errors that exist after a long time much more heavily than those at the start of the response.
ITAE tuning produces systems that settle much more quickly than the other two tuning methods. The error signal
in a control system is given by the Equation (12):
where
r (
t) is the input signal while
c (
t) represents the output signal. The performance indices can be calculated according to Equations (13)–(15). We consider the time function on an interval within
<
t <
+
T, where
is the starting point while
T denotes the ending point. The
represents the integration over
t from
to
+
T:
All the measures require a fixed experiment to be performed on the system (i.e., a fixed set point or disturbance change) and the integrals are evaluated over a fixed time period usually until a time long enough for the responses to settle. The experiment results are summarized in
Table 9 and it can be seen that the proposed approach improves the controller performance by 4.1% according to ISE and by 16.1% on the basis of ITAE index. The results demonstrate that the proposed approach considering the outdoor environment condition shows more excellent performance than the existing approach only taking into account indoor thermal conditions.
8. Featured Application
This paper presents a real-life case study in smart space to verify the feasibility and scalability of the proposed approach. We believe this approach has the potential to be extended to more large-scaled scenarios, which additionally profits by the significance of the work. For example, this work can be applied into a hospital as the thermal comfort has a strong link to human health. It is helpful in stabilizing emotions of patients and promoting in their treatments if the physician understands patients’ requirements to the thermal environment. However, the current standards for hospitals are still missing the concept of thermal comfort, which is considered part of the treatment process of patients. As a result, it is emergent to look for solutions to reconcile the different thermal comfort conditions required by different occupants in hospitals. The proposed thermal comfort control approach can be applied into the existing cooling and heating systems of hospitals for patients with lower immunity such as cancer and infectious patients. It also provides automatic control, which is useful, especially when patients and their family caregivers have to stay in the room for a long time. The demands to have a universal thermal comfort control tool that are effective, extensible, and easy to implement in different application areas are increasing sharply, and this paper reveals the potential to solve all these issues.
9. Conclusions
This work outlines an enhanced MPC system for measuring human comfort index and maintaining the indoor thermal comfort in the optimal level. An MLR based PMV predictive model is proposed with a simplified PMV equation. The biggest novelty of the presented work is the fuzzy controller, taking outdoor environment conditions into account in order to maintain the proper comfort level with the seasons. An IoT smart space prototype with various IoT devices has been implemented as the proof of concept and experimentally tested in an indoor lab of a building on Jeju Island, Korea to validate the performance of the proposed approach. These physical devices are integrated with Intel Edison boards and all communication among them happens over CoAP. A series of experiments are performed throughout June in 2017, which indicate a very stable behavior, allowing effective and fast control of the indoor thermal comfort condition according to the outdoor environment. In addition, the temperature regulating capabilities of the proposed approach have been validated by a comparison study with respect to existing approaches without adopting outdoor environment factors, performing better in accordance with IAE, ISE and ITAE performance indices. These features make the proposed system a promising HVAC controller for indoor environments. It is necessary to point out that this work can be applied to any other space not just in buildings. The only requirement is that the space should provide a suitable network of physical sensors in order to estimate the PMV index. For instance, it can be extended to the application case like hospitals, which also have high demands for environment conditions. The future research directions of this work are to deploy the designed approach into larger scale space while using more environment sensors and to apply other algorithms to reduce energy consumption.


