Incorporating Grey Total Influence into Tolerance Rough Sets for Classification Problems


Abstract
:1. Introduction
2. Tolerance Rough Sets
2.1. Rough Set Theory
2.2. Traditional Similarity Measure
2.3. Computational Steps of a TRS-Based Classifier
- Step 1.
- Determine 〈TC(x), TC(x)〉With x, TC(x) is composed of patterns certainly similar to x, and TC(x) is composed of patterns possibly similar to x. For subset and concept approximations, TC(x) is identical to TC(x), but TC(x) is not.
- Step 2.
- Classification using lower approximationsIf TC(x) = {x}, the classification of x can be left to the next step. If the cardinality of TC(x) is at least two, TC(x) − {x} is used to determine the relative frequency of the class inclusion of the training patterns in TC(x) − {x}. Then, x can be assigned to the class with the highest relative frequency by majority vote. However, if the highest relative frequency is not unique, the classification of x can be left until the next step.
- Step 3.
- Classification using upper approximationsThe boundary region BNDA(TC(x)) (TC(x) − TC(x)) of x can be used to determine the class label of x. Assume that patterns belonging to class Ci constitute Xi. With y in BNDA(TC(x)) ≠ φ, the rough membership function denoted by defined as:where |TC(y)| denotes the cardinality of TC(y). Then, the average rough membership function of x regarding Ci is computed as:where m is the cardinality of BNDA(TC(x)). x can be assigned to a class with the largest degree of average rough membership. However, the class label of x cannot be confirmed if BNDA(TC(x)) = φ.
3. Grey-Total-Influence-Based Tolerance Rough Sets
3.1. Studies Related to Measuring Total Influence
3.2. Grey Relational Analysis
3.3. Determining Grey Total Influence
3.3.1. Generating a Direct Influence Matrix Using GRA
3.3.2. Generating a Grey Direct Influence Matrix for Pattern Classification
- (1)
- Z11: z(x1l, x1p) (1 ≤ l ≤ m1) is obtained using x11, x12, …, as comparative sequences and x1i as a reference sequence, so that z(x1l, x1p) = ϒ(x1l, x1p).
- (2)
- Z12: z(x1p, x2q) is obtained using x11, x12, …, as comparative sequences and x2j as a reference sequence, so that z(x1p, x2q) = ϒ(x1p, x2q).
- (3)
- Z21: As the testing patterns are unseen by the training patterns, they do not have any impact on the training patterns. Therefore, z(x2q, x1p) is set to zero, so that Z21 = 0.
- (4)
- Z22: As the testing patterns are unseen, they do not have any impact on themselves. Therefore, z(x2k, x2q) (1 ≤ k ≤ m2) is set to zero, so that Z22 = 0.
3.3.3. Generating a Grey Total Influence Matrix
3.4. Grey-Total-Influence-Based Tolerance Relation
3.5. Illustrative Example
3.5.1. Training Phase
3.5.2. Testing Phase
4. Genetic-Algorithm-Based Learning Algorithm
| Algorithm 1 The pseudo-code of the learning algorithm |
| Set 0 to k; //1 ≤ k ≤ nmax |
| Initialize population (k, nsize); |
| Evaluate chromosomes (k, nsize); |
| While not satisfying the stopping rule do |
| Set k + 1 to k; |
| Select (k, nsize); //Select generation k from generation k − 1 |
| Crossover (k, nsize); |
| Mutation (k, nsize); |
| Elitist (k, nsize); |
| Evaluate chromosome (k, nsize); |
| End while |
- (1)
- Initialize population: The most common population size is between 50 and 500. Generate an initial population of nsize chromosome. Each parameter in a chromosome is assigned a real random value ranging from zero to one.
- (2)
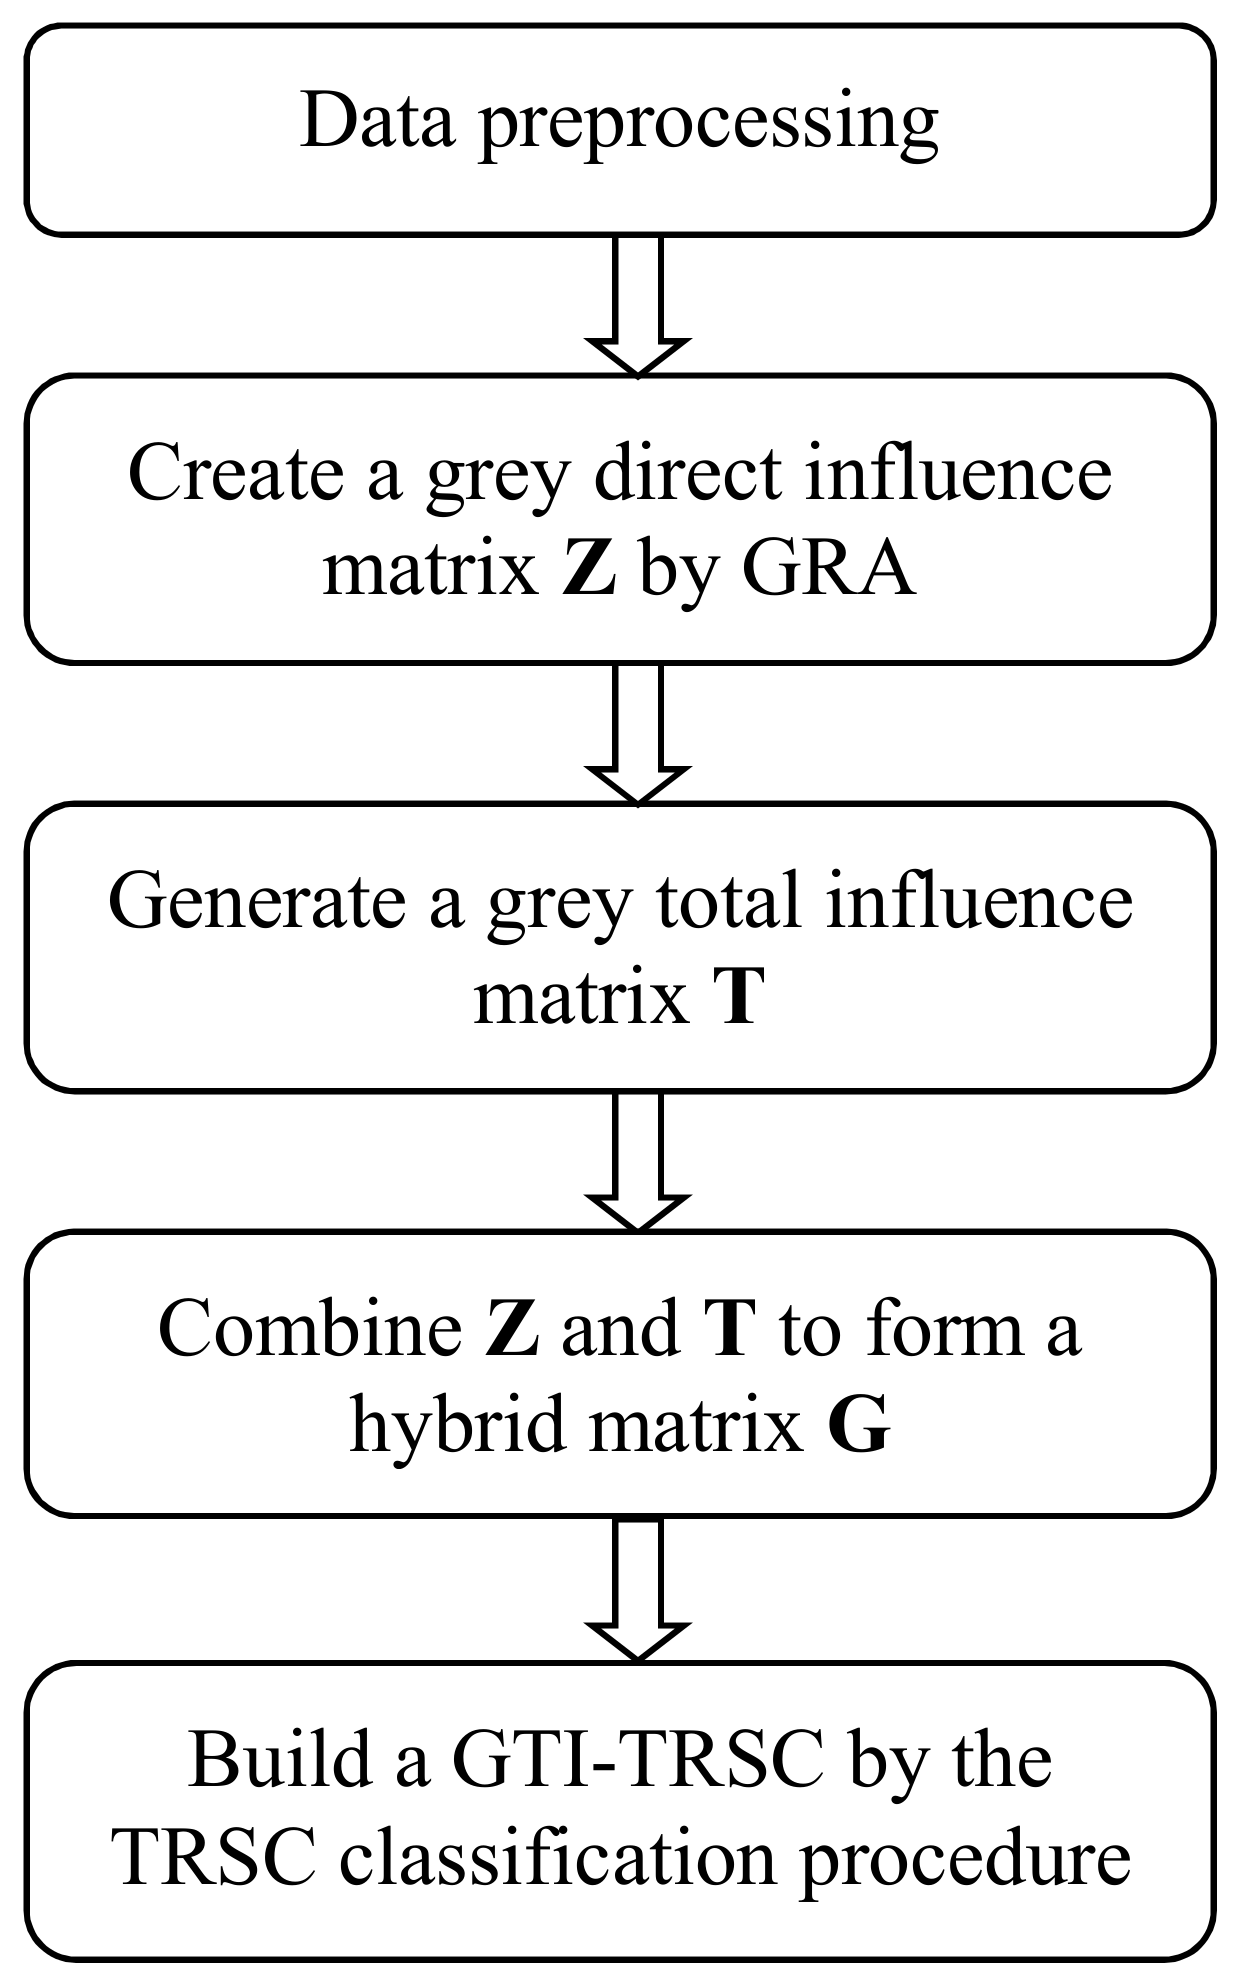
- Evaluate chromosomes: Each chromosome corresponds to a GTI-TRSC that can be generated by the process shown in Figure 1. For each pattern, determine the lower and upper approximations for a GTI-based tolerance class. Furthermore, correct classification serves as a fitness function. Classification accuracy is the number of correct predictions made divided by the total number of predictions made, multiplied by 100 to turn it into a percentage.
- (3)
- Select: To produce generation k, randomly select two chromosomes from generation k − 1 by a binary tournament and place the one with higher fitness in a mating pool.
- (4)
- Crossover: Let be randomly selected chromosomes (1 ≤ i, j ≤ nsize) from generation k. Prc determines whether crossover can be performed on any two real-valued parameters. Two new chromosomes, are generated and are added into Pk+1. The related crossover operations are performed as:where aw, b, c, and d are random numbers ranging from zero to one.
- (5)
- Mutation: Prm determines whether a mutation can be performed on each real-valued parameter of a newly generated chromosome. With a mutation, the affected gene is altered by adding a random number selected from a prespecified interval, such as (−0.01, 0.01). A smaller Prm is required to avoid excessive perturbation.
- (6)
- Elitist strategy: Randomly remove ndel chromosomes from generation k. Insert ndel chromosomes with the maximum fitness from generation k − 1. A smaller ndel is required to generate a smaller perturbation in generation k.
- (7)
- Stopping rule: When nmax generations have been created, the algorithm reaches the stopping condition.
5. Computer Simulations
5.1. Evaluating Classification Performance
- (1)
- HLM: The lattice machine generates hypertuples as a model of the data. Some more general hypertuples can be used in the hierarchy that covers objects covered by the hypertuples. The covering hypertuples locate various levels of the hierarchy.
- (2)
- RSES-O: RSES-O is implemented in RSES. An optimal threshold for the positive region is used to shorten all decision rules with a minimal number of descriptors.
- (3)
- RSES-H: RSES-H can be obtained by constructing a hierarchy of rule-based classifiers. The levels of the hierarchy are defined by different levels of minimal rule shortening. A new pattern can be classified by a single hierarchy of the classifier.
- (4)
- RIONA: RIONA is also implemented in RSES. It uses the nearest neighbor method to induce distance-based rules. For a new pattern, the patterns most similar to it can vote for its decision, but patterns that do not match any rule are excluded from voting.
- (1)
- GTRSC: Instead of a simple distance measure used to evaluate the proximity of any two patterns, the GRG (grey relational grade) is used here to implement a relationship-based similarity measure that generates a tolerance class for each pattern. As mentioned above, only direct relationships were considered in the GTRSC.
- (2)
5.2. Statistical Analysis
- (1)
- GTI-TRSC-SU significantly outperformed TRSC-CO (9.15 − 2 = 7.15), TRSC-SU (9.55 − 2 = 7.55), RSES-H (7.90 − 2 = 5.90), RSES-O (8.80 − 2 = 6.00), RIONA (8.80 − 2 = 6.80), and HLM (9.20 − 2 = 7.2).
- (2)
- GTI-TRSC-CO significantly outperformed TRSC-CO (9.15 − 1.80 = 7.35), TRSC-SU (9.55 − 1.80 = 7.75), RSES-H (7.90 − 1.80 = 6.10), RSES-O (8.80 − 1.80 = 6.20), RIONA (8.80 − 1.80 = 7.00), and HLM (9.20 − 1.80 = 7.40).
- (3)
- There was no significant difference between GTI-TRSC and GTRSC for both set and concept approximations. Even so, GTI-TRSC outperformed GTRSC on seven out of ten datasets.
- (4)
- Although GTI-TRSC did not significantly outperform the FTRSC, the difference between GTI-TRSC-CO and FTRSC-SU was slightly less than CD (6.35 − 1.80 = 4.50). Therefore, it is reasonable to conclude that GTI-TRSC-CO was superior to FTRSC-SU. Even so, it is interesting to investigate the applications that can render GTI-TRSC and FTRSC significantly different.
6. Discussion and Conclusions
Author Contributions
Funding
Conflicts of Interest
References
- Pawlak, Z. Rough sets. Int. J. Comput. Inf. Sci. 1982, 11, 341–356. [Google Scholar] [CrossRef]
- Pawlak, Z. Rough Sets: Theoretical Aspects of Reasoning about Data; Kluwer: Dordrecht, The Netherlands, 1991. [Google Scholar]
- Bazan, J.G.; Szczuka, M. RSES and RSESlib-A collection of tools for rough set computation. In Lecture Notes in Computer Science; Figueira, W., Yao, Y., Eds.; Springer: Berlin, Germany, 2001; pp. 106–113. [Google Scholar]
- Bazan, J.G.; Szczuka, M. The rough set exploration system. In Lecture Notes in Computer Science; James, F.P., Andrzej, S., Eds.; Springer: Berlin, Germany, 2005; pp. 37–56. [Google Scholar]
- Bazan, J.G.; Szczuka, M.; Wroblewski, J. A new version of rough set exploration system. In Lecture Notes in Computer Science; Alpigini, J.J., Peters, J.F., Skowron, A., Zhong, N., Eds.; Springer: Berlin, Germany, 2002; pp. 397–404. [Google Scholar]
- Pawlak, Z.; Skowron, A. Rough sets and boolean reasoning. Inf. Sci. 2007, 177, 41–73. [Google Scholar] [CrossRef]
- Pokowski, L. Rough Sets: Mathematical Foundations; Physica-Verlag: Heudelberg, Germany, 2002. [Google Scholar]
- Walczak, B.; Massart, D.L. Rough set theory. Chemom. Intell. Lab. Syst. 1999, 47, 1–16. [Google Scholar] [CrossRef]
- Zhang, X.; Dai, J.; Yu, Y. On the union and intersection operations of rough sets based on various approximation spaces. Inf. Sci. 2015, 292, 214–229. [Google Scholar] [CrossRef]
- Shu, W.; Shen, H. Incremental feature selection based on rough set in dynamic incomplete data. Pattern Recognit. 2014, 47, 3890–3906. [Google Scholar] [CrossRef]
- Jensen, R.; Shen, Q. Tolerance-based and fuzzy-rough feature selection. In Proceedings of the IEEE International Conference on Fuzzy Systems (FUZZ-IEEE’07), London, UK, 23–26 July 2007; pp. 877–882. [Google Scholar]
- Parthaláin, N.M.; Shen, Q. Exploring the boundary region of tolerance rough sets for feature selection. Pattern Recognit. 2009, 42, 655–667. [Google Scholar] [CrossRef] [Green Version]
- Stepaniuk, J. Rough Granular Computing in Knowledge Discovery and Data Mining; Springer: Berlin, Germany, 2008. [Google Scholar]
- Kim, D.; Bang, S.Y. A handwritten numeral character classification using tolerant rough set. IEEE Trans. Pattern Anal. Mach. Intell. 2000, 22, 923–937. [Google Scholar]
- Kim, D. Data classification based on tolerant rough set. Pattern Recognit. 2001, 34, 1613–1624. [Google Scholar] [CrossRef]
- Ma, J.; Hasi, B. Remote sensing data classification using tolerant rough set and neural networks. Sci. China Ser. D Earth Sci. 2005, 48, 2251–2259. [Google Scholar] [CrossRef]
- Skowron, A.; Stepaniuk, J. Tolerance approximation spaces. Fund. Inform. 1996, 27, 245–253. [Google Scholar]
- Yun, O.; Ma, J. Land cover classification based on tolerant rough set. Int. J. Remote Sens. 2006, 27, 3041–3047. [Google Scholar] [CrossRef]
- Hu, Y.C. Pattern classification using grey tolerance rough sets. Kybernetes 2016, 45, 266–281. [Google Scholar] [CrossRef]
- Yang, Y.P.O.; Shieh, H.M.; Leu, J.D.; Tzeng, G.H. A novel hybrid MCDM model combined with DEMATEL and ANP with applications. Int. J. Oper. Res. 2008, 5, 160–168. [Google Scholar]
- Peng, K.H.; Tzeng, G.H. A hybrid dynamic MADM model for problems-improvement in economics and business. Technol. Econ. Dev. Econ. 2013, 19, 638–660. [Google Scholar] [CrossRef]
- Hu, Y.C. Flow-based tolerance rough sets for pattern classification. Appl. Soft Comput. 2015, 27, 322–331. [Google Scholar] [CrossRef]
- Hu, Y.C. Tolerance rough sets for pattern classification using multiple grey single-layer perceptrons. Neurocomputing 2016, 179, 144–151. [Google Scholar] [CrossRef]
- Tzeng, G.H.; Huang, J.J. Multiple Attribute Decision Making: Methods and Applications; CRC Press: Boca Raton, FL, USA, 2011. [Google Scholar]
- Lin, C.L.; Hsieh, M.S.; Tzeng, G.H. Evaluating vehicle telematics system by using a novel MCDM techniques with dependence and feedback. Expert Syst. Appl. 2010, 37, 6723–6736. [Google Scholar] [CrossRef]
- Grzymala-Busse, J.W.; Siddhaye, S. Rough set approaches to rule induction from incomplete data. In Proceedings of the International Conference on Information Processing and Management of Uncertainty in Knowledge-Based Systems, Perugia, Italy, 4–9 July 2004; pp. 923–930. [Google Scholar]
- Liu, S.; Lin, Y. Grey Information: Theory and Practical Applications; Springer-Lerlag: London, UK, 2006. [Google Scholar]
- Hu, Y.C.; Chen, R.S.; Hsu, Y.T.; Tzeng, G.H. Grey self-organizing feature maps. Neurocomputing 2002, 48, 863–877. [Google Scholar] [CrossRef]
- Deng, J.L. Control problems of grey systems. Syst. Control Lett. 1982, 1, 288–294. [Google Scholar]
- Bai, C.; Sarkis, J. A grey-based DEMATEL model for evaluating business process management critical success factors. Int. J. Prod. Econ. 2013, 146, 281–292. [Google Scholar] [CrossRef]
- Liang, H.W.; Ren, J.Z.; Gao, Z.Q.; Gao, S.Z.; Luo, X.; Dong, L.; Scipioni, A. Identification of critical success factors for sustainable development of biofuel industry in China based on grey decision-making trial and evaluation laboratory (DEMATEL). J. Clean. Prod. 2016, 131, 500–508. [Google Scholar] [CrossRef]
- Asad, M.M.; Mohajerani, N.S.; Nourseresh, M. Prioritizing Factors Affecting Customer Satisfaction in the Internet Banking System Based on Cause and Effect Relationships. Procedia Econ. Financ. 2016, 36, 210–219. [Google Scholar] [CrossRef]
- Rajesh, R.; Ravi, V. Modeling enablers of supply chain risk mitigation in electronic supply chains: A Grey-DEMATEL approach. Comput. Ind. Eng. 2015, 87, 126–139. [Google Scholar] [CrossRef]
- Shao, J.; Taisch, M.; Ortega-Mier, M. A grey-DEcision-MAking Trial and Evaluation Laboratory (DEMATEL) analysis on the barriers between environmentally friendly products and consumers: Practitioners’ viewpoints on the European automobile industry. J. Clean. Prod. 2016, 112, 3185–3194. [Google Scholar] [CrossRef]
- Su, C.M.; Horng, D.J.; Tseng, M.L.; Chiu, A.S.F.; Wu, K.J.; Chen, H.P. Improving sustainable supply chain management using a novel hierarchical grey-DEMATEL approach. J. Clean. Prod. 2016, 134, 469–481. [Google Scholar] [CrossRef]
- Xia, X.Q.; Govindan, K.; Zhu, Q.H. Analyzing internal barriers for automotive parts remanufacturers in China using grey-DEMATEL approach. J. Clean. Prod. 2015, 87, 811–825. [Google Scholar] [CrossRef]
- Goldberg, D.E. Genetic Algorithms in Search, Optimization, and Machine Learning; Addison-Wesley: Boston, MA, USA, 1989. [Google Scholar]
- Man, K.F.; Tang, K.S.; Kwong, S. Genetic Algorithms: Concepts and Designs; Springer: London, UK, 1999. [Google Scholar]
- Rooij, A.J.F.; Jain, L.C.; Johnson, R.P. Neural Network Training Using Genetic Algorithms; World Scientific: Singapore, 1996. [Google Scholar]
- Osyczka, A. Evolutionary Algorithms for Single and Multicriteria Design Optimization; Physica-Verlag: New York, NY, USA, 2002. [Google Scholar]
- Ishibuchi, H.; Nakashima, T.; Nii, M. Classification and Modeling with Linguistic Information Granules: Advanced Approaches to Linguistic Data Mining; Springer: Heidelberg, Germany, 2004. [Google Scholar]
- Zeng, X.; Martinez, T.R. Distribution-balanced stratified cross-validation for accuracy estimation. J. Exp. Theor. Artif. Intell. 2000, 12, 1–12. [Google Scholar] [CrossRef]
- Wang, H.; Düntsch, I.; Gediga, G.; Skowron, A. Hyperrelations in version space. Int. J. Approx. Reason. 2004, 36, 223–241. [Google Scholar] [CrossRef]
- Skowron, A.; Wang, H.; Wojna, A.; Bazan, J.G. Multimodal classification: Case studies. In Lecture Notes in Computer Science 4100; Peters, J.F., Skowron, A., Eds.; Springer: Berlin, Germany, 2006; pp. 224–239. [Google Scholar]
- Skowron, A.; Wang, H.; Wojna, A.; Bazan, J. A hierarchical approach to multimodal classification. In Lecture Notes in Artificial Intelligence 3642; Slezak, D., Yao, J.T., Peters, J.F., Ziarko, W., Hu, X., Eds.; Springer: Berlin, Germany, 2005; pp. 119–127. [Google Scholar]
- Bazan, J.G.; Szczuka, M.; Wojna, A.; Wojnarski, M. On the evolution of rough set exploration system. In Lecture Notes in Artificial Intelligence 3066; Tsumoto, S., Słowiński, R., Komorowski, J., Grzymala-Busse, J.W., Eds.; Springer: Heidelberg, Germany, 2004; pp. 592–601. [Google Scholar]
- Brans, J.P.; Marechal, B.; Vincke, P. PROMETHEE: A new family of outranking methods in multicriteria analysis. Oper. Res. 1984, 84, 477–490. [Google Scholar]
- Brans, J.P.; Vincke, P.; Marechal, B. How to select and how to rank projects: The PROMETHEE method. Eur. J. Oper. Res. 1986, 24, 228–238. [Google Scholar] [CrossRef]
- Friedman, M. A comparison of alternative tests of significance for the problem of m rankings. Ann. Math. Stat. 1940, 11, 86–92. [Google Scholar] [CrossRef]
- Nemenyi, P.B. Distribution-Free Multiple Comparisons. Ph.D. Thesis, Princeton University, Princeton, NJ, USA, 1963. [Google Scholar]
- Hu, Y.C.; Chiu, Y.J.; Hsu, C.S.; Chang, Y.Y. Identifying key factors of introducing GPS-based fleet management systems to the logistics industry. Math. Probl. Eng. 2015. [Google Scholar] [CrossRef]
- Hu, J.W.S.; Hu, Y.C.; Yang, T.P. DEMATEL and analytic network process for evaluating stock trade strategies using Livermore’s key price logic. Univers. J. Account. Finance 2017, 5, 18–35. [Google Scholar]
- Wang, W.; Wang, Z.; Klir, G.J. Genetic algorithms for determining fuzzy measures from data. J. Intell. Fuzzy Syst. 1998, 6, 171–183. [Google Scholar]
- Hu, Y.C. Nonadditive grey single-layer perceptron with Choquet integral for pattern classification problems using genetic algorithms. Neurocomputing 2008, 72, 332–341. [Google Scholar] [CrossRef]


| Pattern | Conditional Attribute | Decision Attribute | |||
|---|---|---|---|---|---|
| 1 | 2 | 3 | 4 | ||
| x1 | 51.1 | 35.2 | 14.0 | 2.0 | 1 |
| x2 | 53.0 | 37.0 | 15.0 | 2.0 | 1 |
| x3 | 50.0 | 32.1 | 12.0 | 2.0 | 2 |
| x4 | 52.0 | 27.0 | 39.0 | 14.6 | 1 |
| x5 | 59.0 | 30.0 | 42.3 | 15.0 | 2 |
| x6 | 56.7 | 25.4 | 39.0 | 11.0 | 2 |
| Data | # Patterns | # Attributes | # Classes |
|---|---|---|---|
| Australian approval | 690 | 14 | 2 |
| Glass | 214 | 9 | 6 |
| Hepatitis | 155 | 19 | 2 |
| Iris | 150 | 4 | 3 |
| Pima Indian diabetes | 768 | 8 | 2 |
| Sonar | 208 | 60 | 2 |
| Statlog Heart | 270 | 13 | 2 |
| Tic-Tac-Toe | 958 | 9 | 2 |
| Voting | 435 | 16 | 2 |
| Wine | 178 | 13 | 3 |
| Dataset | Classification Methods | |||||
|---|---|---|---|---|---|---|
| HLM | RSES-H | RSES-O | RIONA | TRSC-SU | TRSC-CO | |
| Australian approval | 92.0 | 87.0 | 86.4 | 85.7 | 85.9 | 87.1 |
| Glass | 71.3 | 63.4 | 61.2 | 66.1 | 65.7 | 68.1 |
| Hepatitis | 78.7 | 81.9 | 82.6 | 82.0 | 83.9 | 83.5 |
| Iris | 94.1 | 95.5 | 94.9 | 94.4 | 95.7 | 95.2 |
| Diabetes | 72.6 | 73.8 | 73.8 | 75.4 | 74.1 | 73.6 |
| Sonar | 73.7 | 75.3 | 74.3 | 86.1 | 74.3 | 75.0 |
| Statlog Heart | 79.0 | 84.0 | 83.8 | 82.3 | 82.9 | 83.3 |
| TTT | 95.0 | 99.1 | 99.0 | 93.6 | 82.3 | 82.3 |
| Voting | 95.4 | 96.5 | 96.4 | 95.3 | 93.4 | 94.0 |
| Wine | 92.6 | 91.2 | 90.7 | 95.4 | 93.0 | 95.3 |
| Average rank | 9.20 | 7.90 | 8.80 | 8.80 | 9.55 | 9.15 |
| Dataset | Classification Methods | |||||
|---|---|---|---|---|---|---|
| FTRSC-SU | FTRSC-CO | GTRSC-SU | GTRSC-CO | GTI-TRSC-SU | GTI-TRSC-CO | |
| Australian approval | 88.0 | 87.7 | 89.3 | 89.1 | 91.0 | 90.9 |
| Glass | 69.1 | 69.4 | 70.1 | 69.9 | 79.8 | 79.7 |
| Hepatitis | 85.6 | 84.3 | 86.0 | 87.0 | 88.7 | 89.8 |
| Iris | 95.7 | 96.2 | 96.1 | 96.3 | 96.3 | 96.4 |
| Diabetes | 75.7 | 75.9 | 76.5 | 76.0 | 77.9 | 81.6 |
| Sonar | 78.8 | 79.5 | 83.0 | 82.8 | 86.7 | 87.8 |
| Statlog Heart | 83.9 | 84.1 | 84.4 | 84.0 | 86.9 | 86.1 |
| TTT | 97.3 | 97.8 | 98.5 | 98.5 | 98.9 | 98.5 |
| Voting | 96.6 | 96.3 | 96.0 | 96.2 | 97.4 | 97.7 |
| Wine | 93.2 | 95.1 | 97.4 | 97.9 | 97.9 | 98.1 |
| Average rank | 6.35 | 5.60 | 4.40 | 4.55 | 2.00 | 1.80 |
© 2018 by the authors. Licensee MDPI, Basel, Switzerland. This article is an open access article distributed under the terms and conditions of the Creative Commons Attribution (CC BY) license (http://creativecommons.org/licenses/by/4.0/).
Share and Cite
Hu, Y.-C.; Chiu, Y.-J. Incorporating Grey Total Influence into Tolerance Rough Sets for Classification Problems. Appl. Sci. 2018, 8, 1173. https://doi.org/10.3390/app8071173
Hu Y-C, Chiu Y-J. Incorporating Grey Total Influence into Tolerance Rough Sets for Classification Problems. Applied Sciences. 2018; 8(7):1173. https://doi.org/10.3390/app8071173
Chicago/Turabian StyleHu, Yi-Chung, and Yu-Jing Chiu. 2018. "Incorporating Grey Total Influence into Tolerance Rough Sets for Classification Problems" Applied Sciences 8, no. 7: 1173. https://doi.org/10.3390/app8071173