Automated Diabetic Retinopathy Screening System Using Hybrid Simulated Annealing and Ensemble Bagging Classifier


Abstract
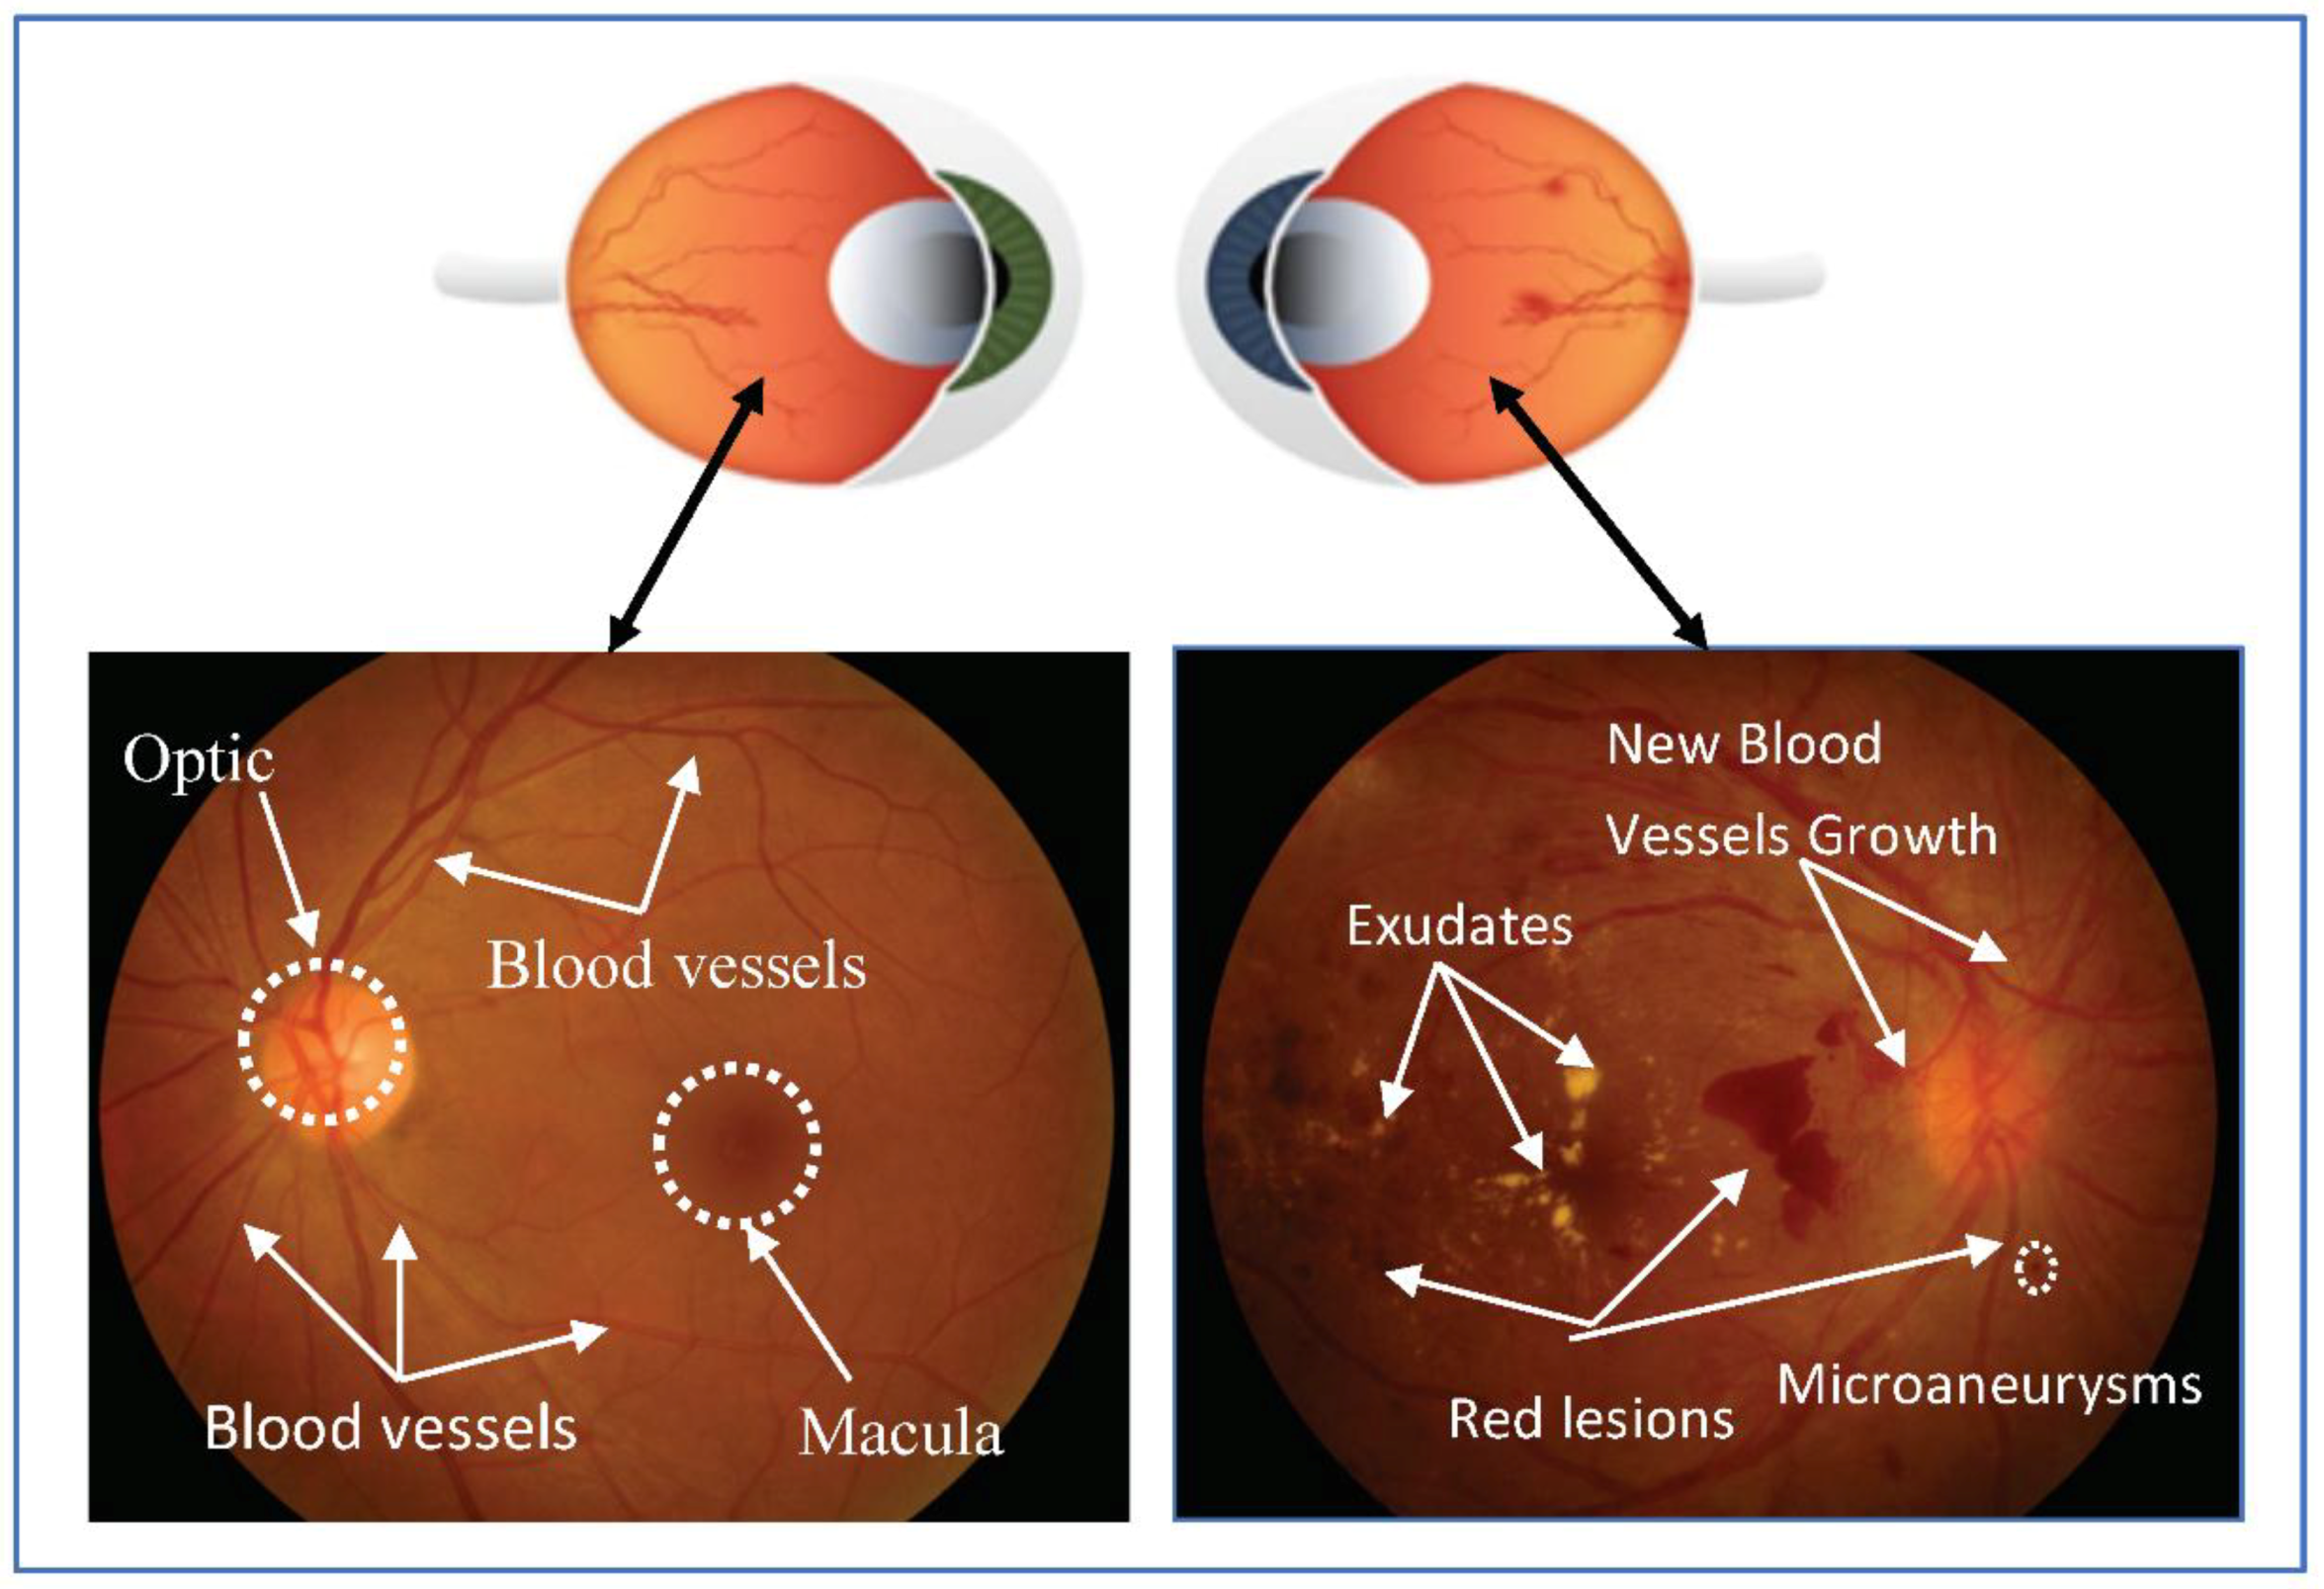
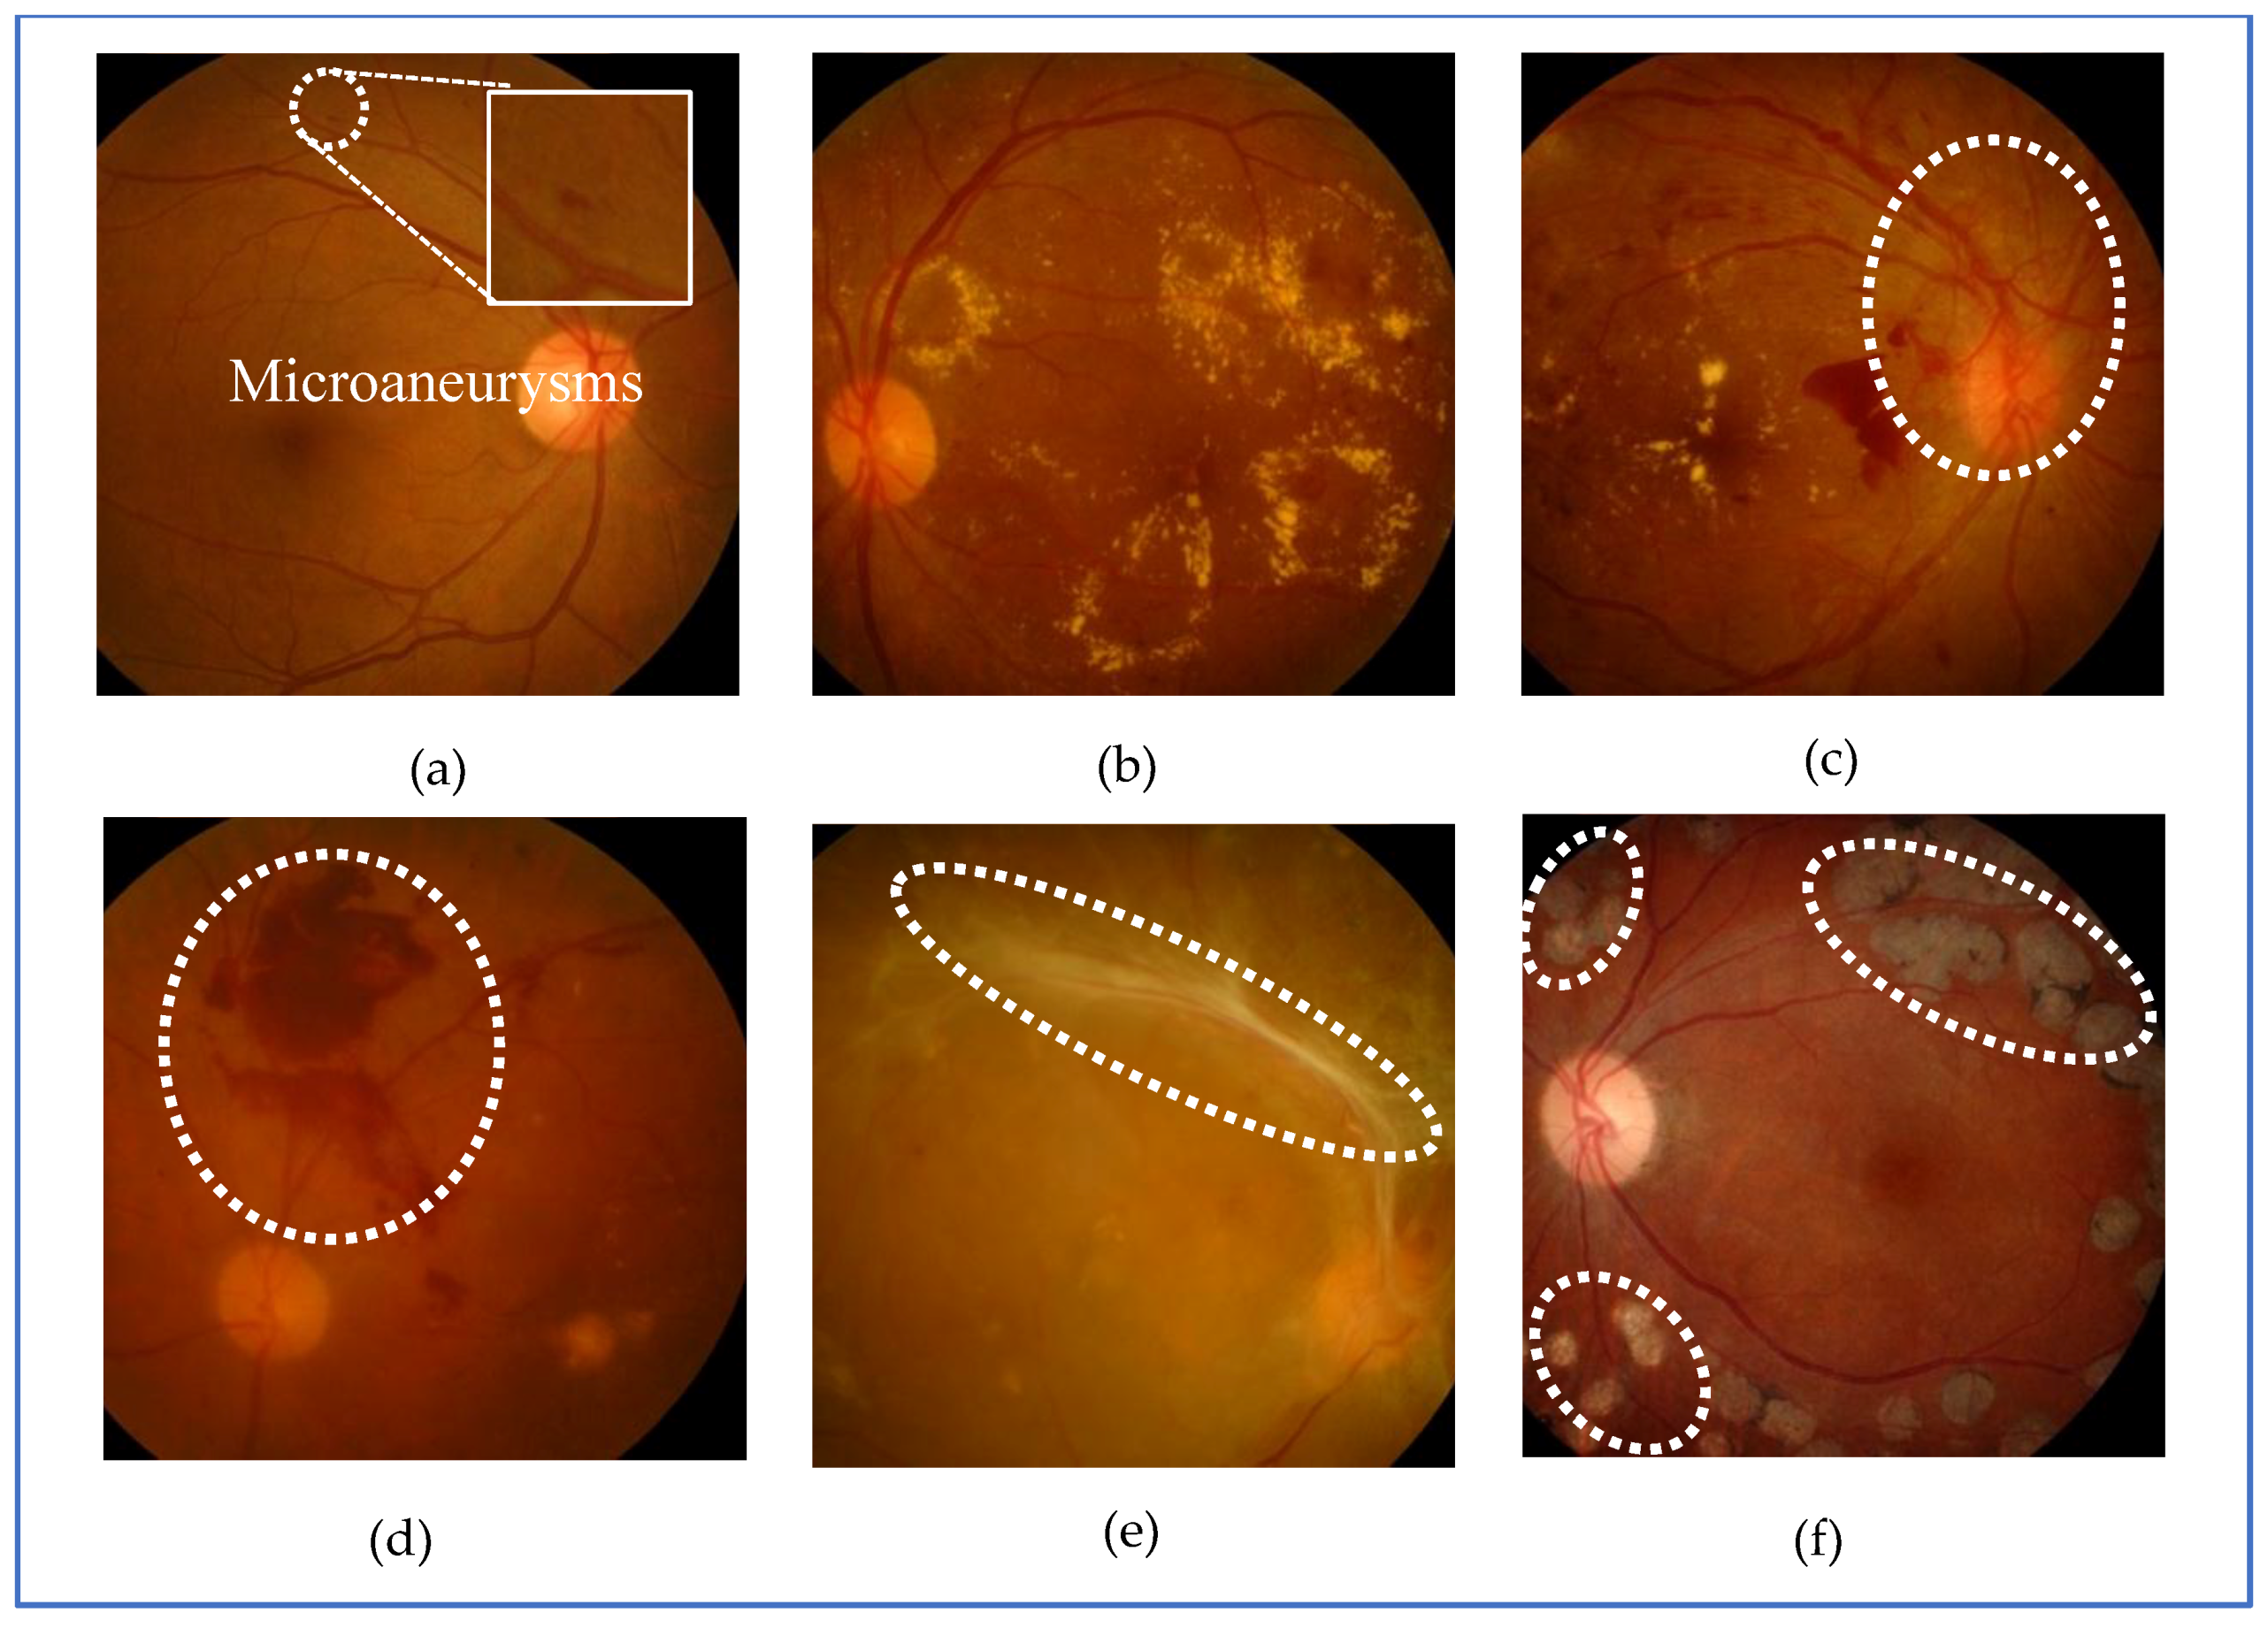
:1. Introduction
2. Methodology
2.1. Image Preprocessing
- Image resizing to 576 720 pixels to standardize the image size and reduce the computation time.
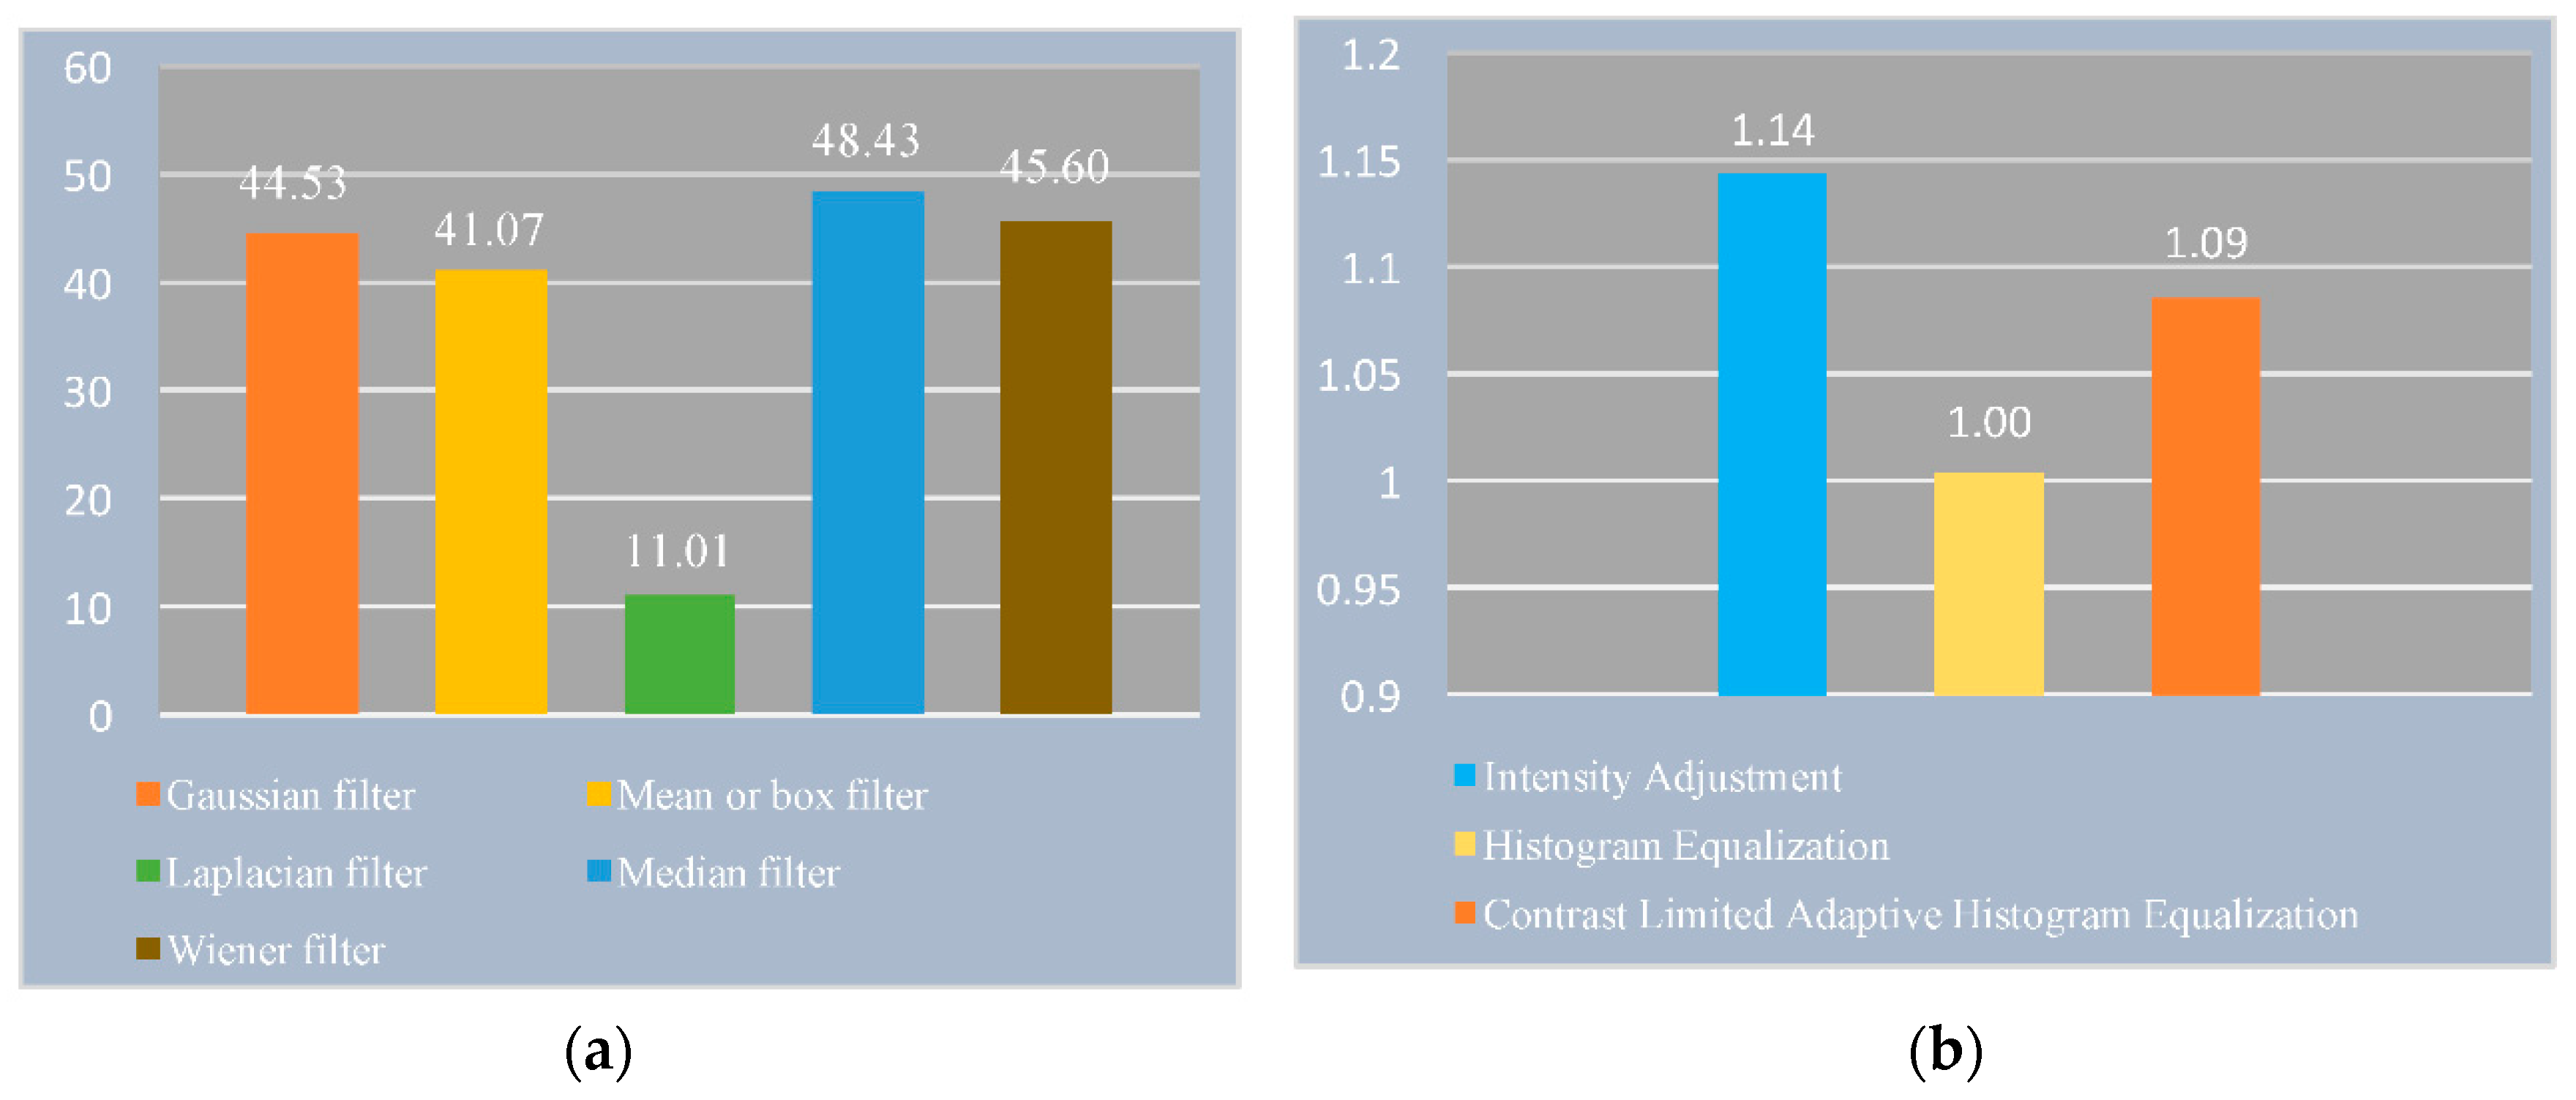
- RGB color image conversion to the green channel, followed by removal of small noise using a median filter.
- Gamma correction to improve the intensity values for image binarization.
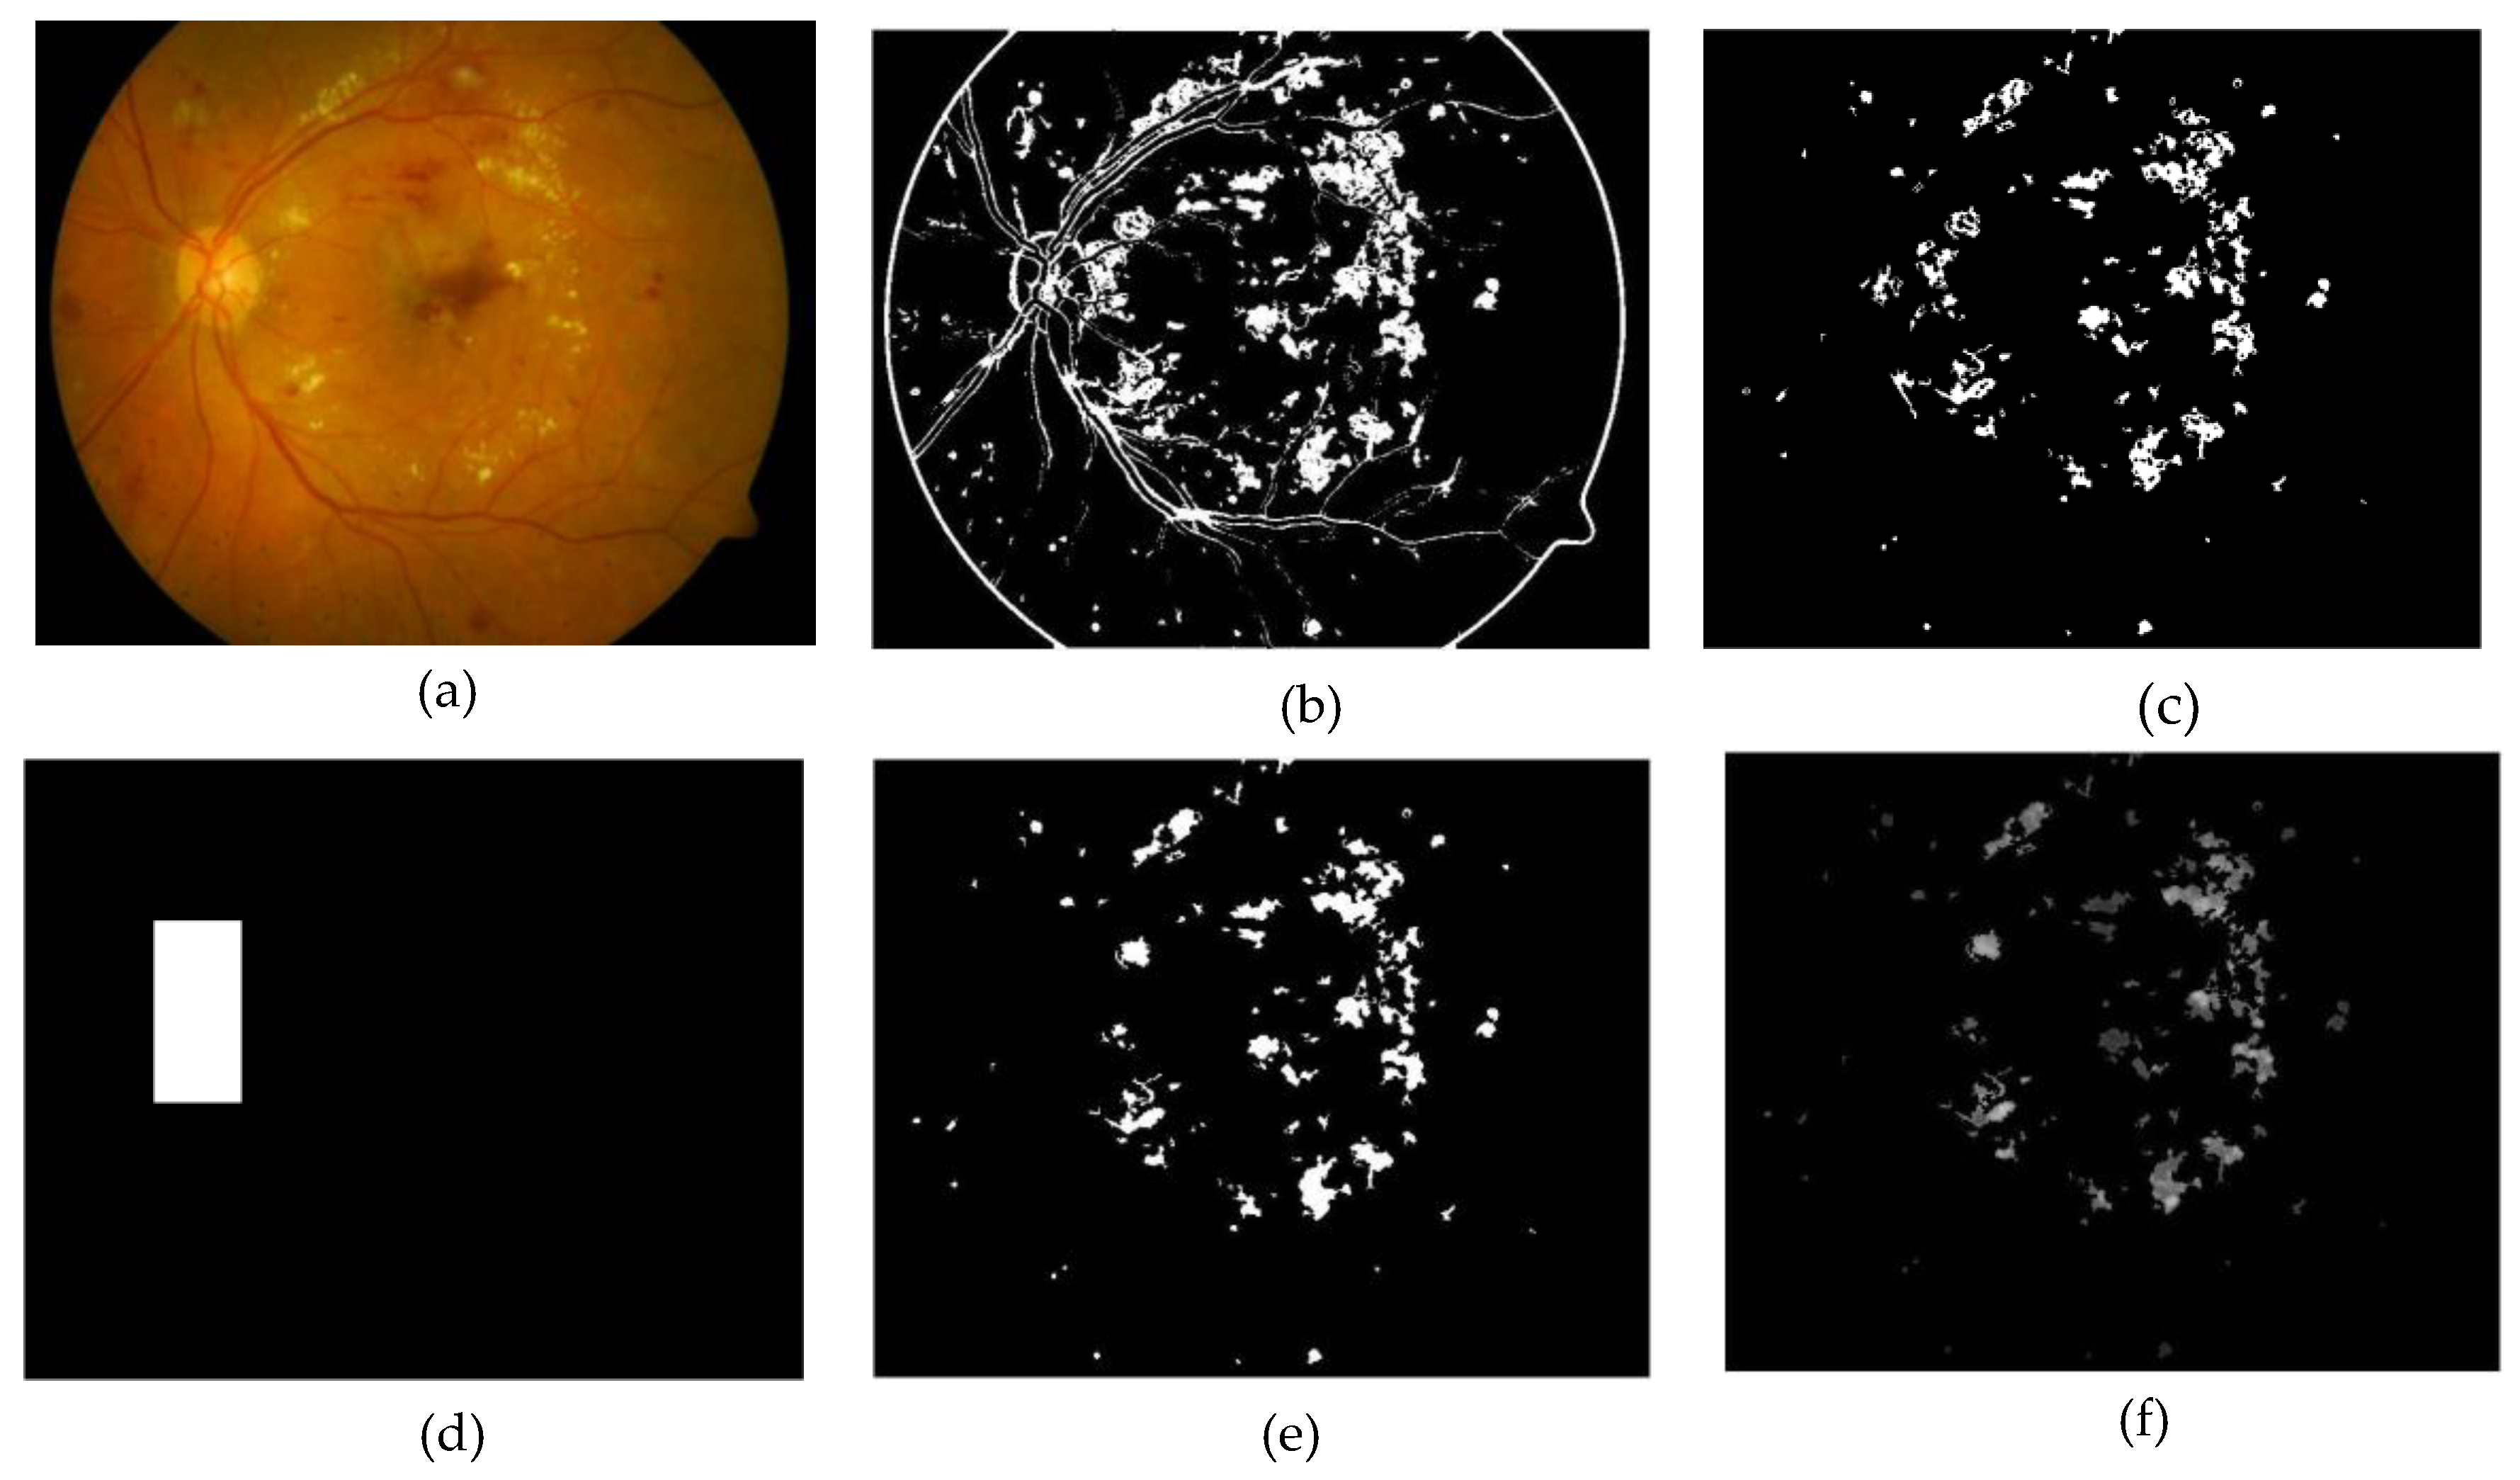
2.2. Image Segmentation
2.3. Feature Extraction
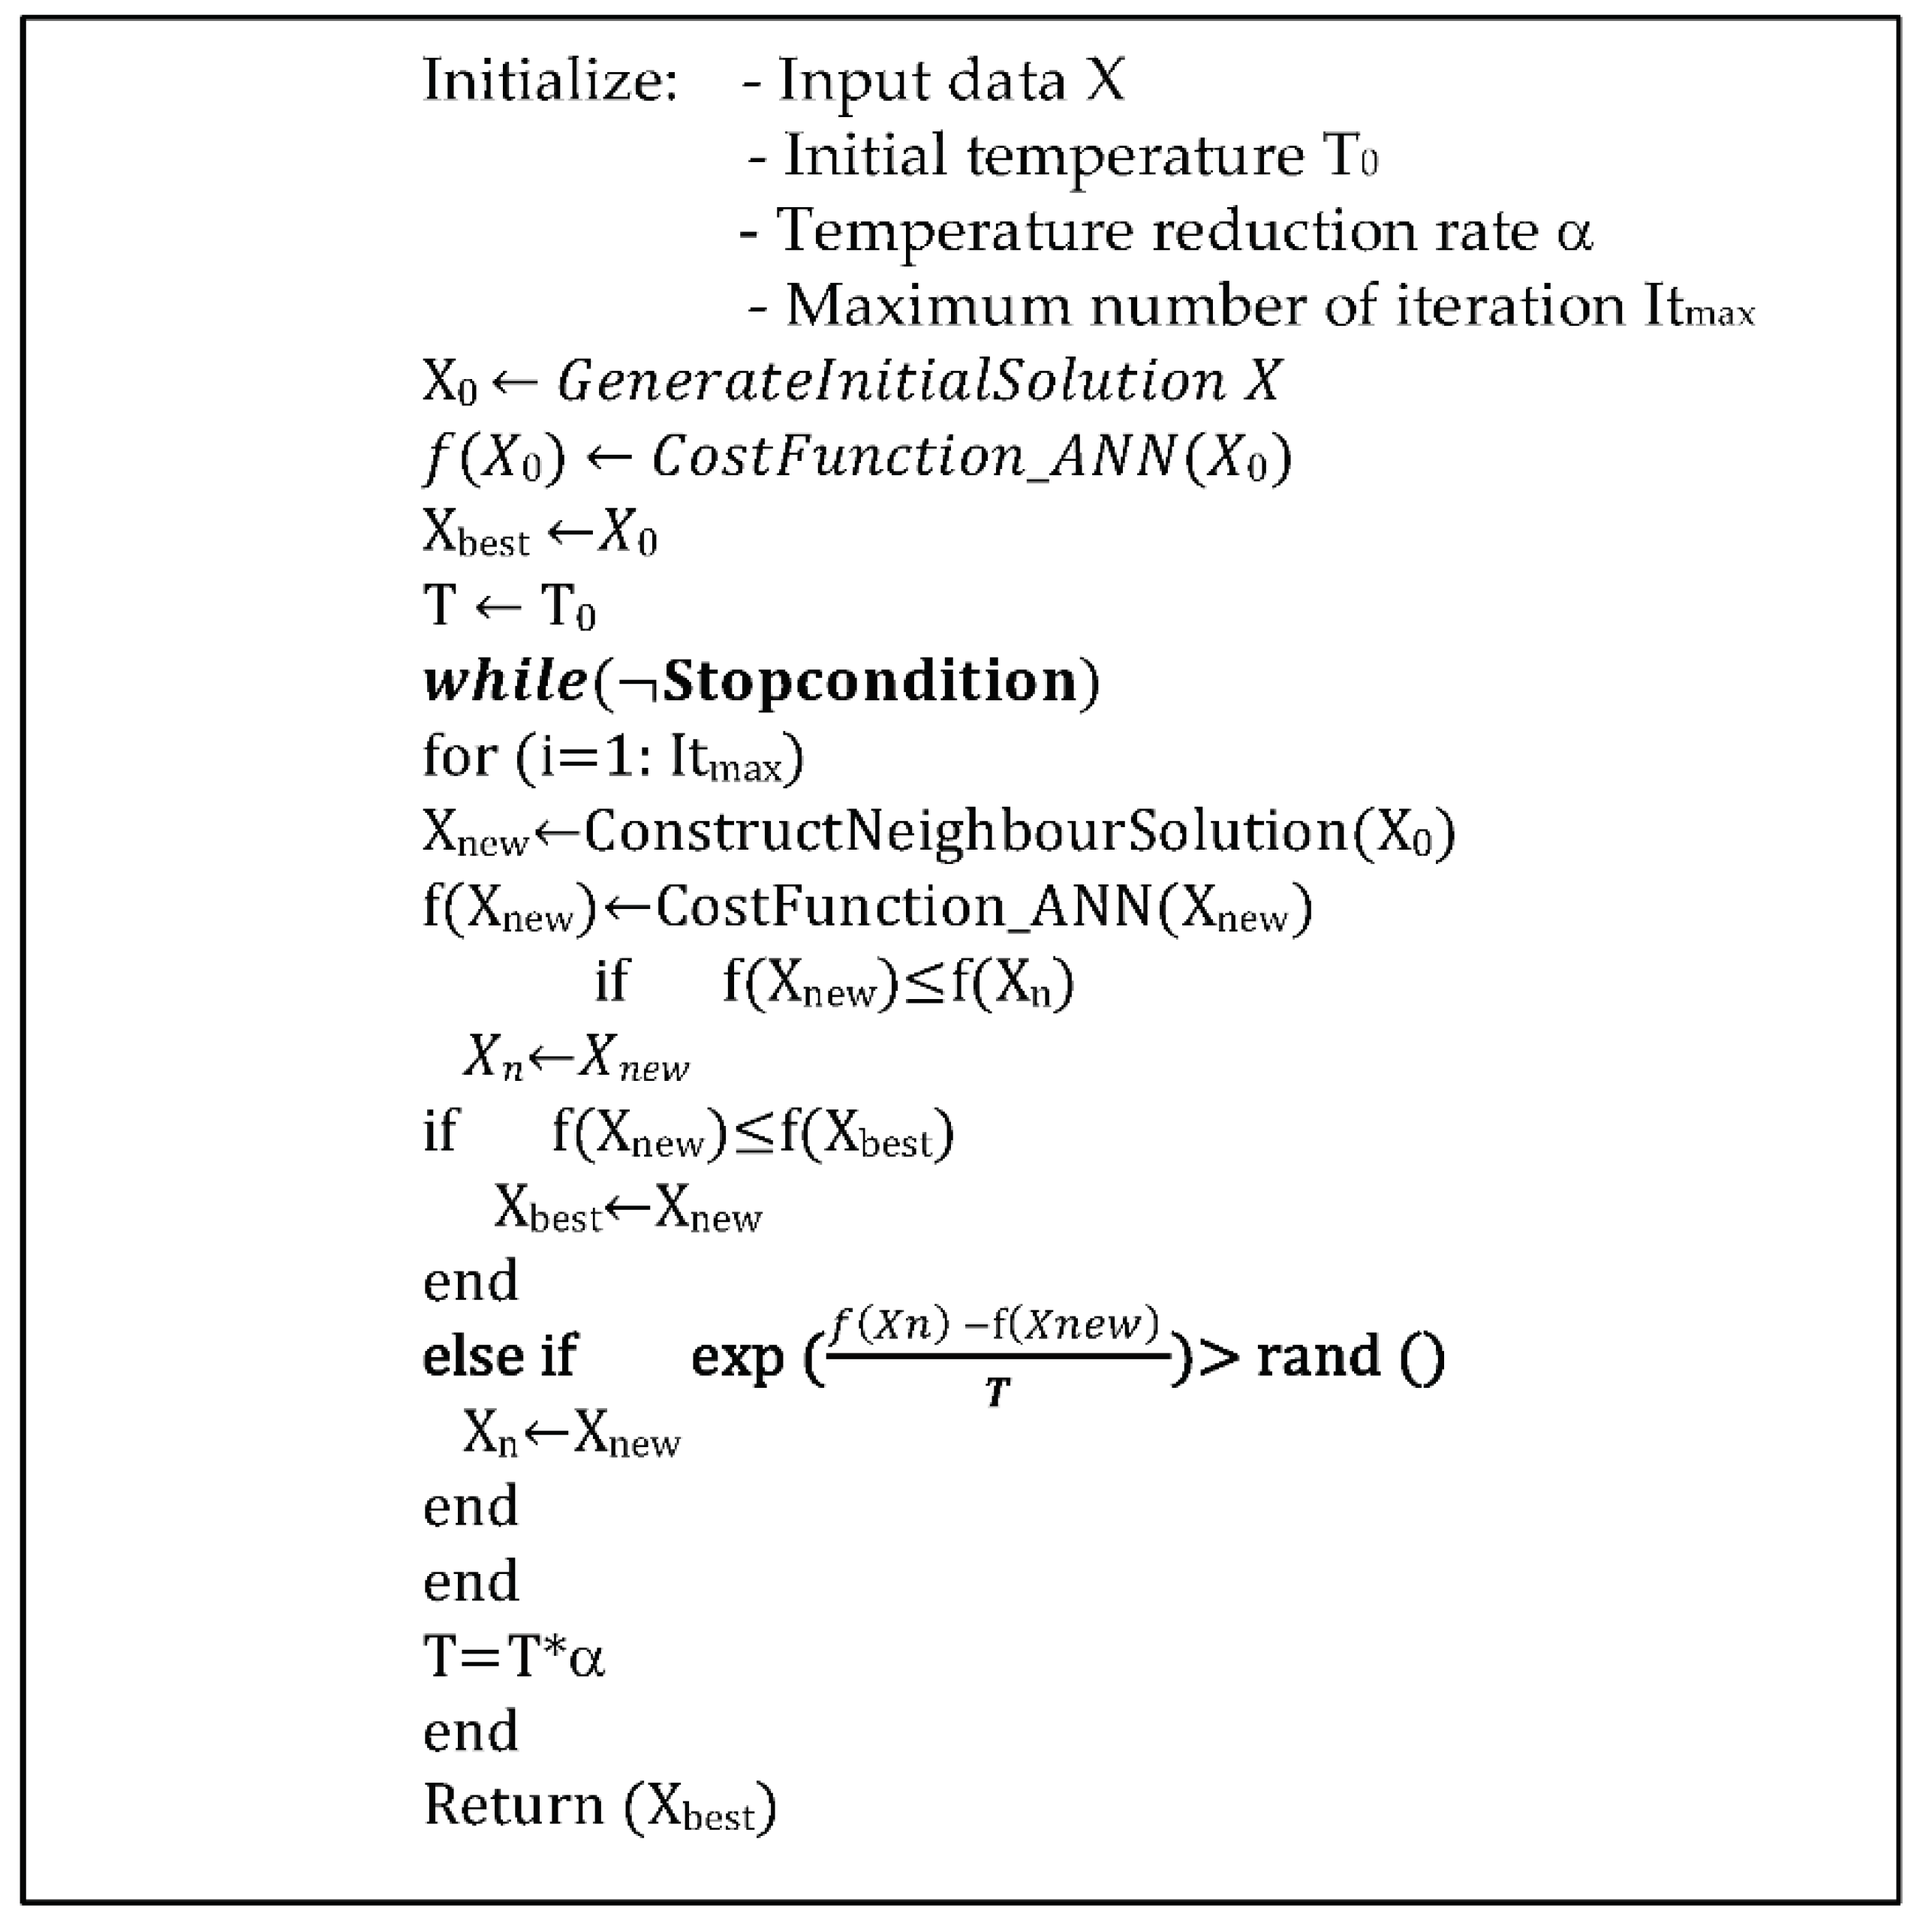
2.4. Feature Selection
2.5. Classification
3. Experimental Results
- All appeared lesions were segmented by improving our previous method in Reference [17].
- Eight feature sets namely morphological features, intensity features, color features, first order statistical features, Gray Level Co-occurrence Matrix (GLCM) features, Gray Level Run Length Matrix (GLRLM) features, local binary pattern features and Tamura’s texture features were extracted.
- The optimal feature set was used as input to classifiers. Support Vector Machine (SVM), Decision Tree (DT), Logistic Regression (LR), Linear Discriminant Analysis (LDA), K-Nearest Neighbors (KNN), Ensemble Bagging (EB) based classifiers were employed.
- The performance of each classifiers coupling GA, PSO, HACO, and HSA were respectively evaluated using six performance measures: sensitivity, specificity, accuracy, F-measure, precision and the Area Under Receiver Operating Characteristic curve (AUROC).
4. Discussion
5. Conclusions
Author Contributions
Funding
Acknowledgments
Conflicts of Interest
References
- World Health Organization. Global Report on Diabetes; WHO: Geneva, Switzerland, 2016. [Google Scholar]
- International Diabetes Federation. IDF Diabetes Atlas, 8th ed.; IDF: Brussels, Belgium, 2017; Available online: http://www.diabetesatlas.org (accessed on 27 June 2018).
- Scanlon, P.H.; Aldington, S.; Wilkinson, C.; Matthews, D. Practical Manual of Diabetic Retinopathy Management; John Wiley & Sons: Chichester, UK, 2009; pp. 46–57. ISBN 978-1-405-17035-2. [Google Scholar]
- Acharya, U.R.; Mookiah, M.R.K.; Koh, J.E.; Tan, J.H.; Bhandary, S.V.; Rao, A.K.; Fujita, H.; Hagiwara, Y.; Chua, C.K.; Laude, A. Automated screening system for retinal health using bi-dimensional empirical mode decomposition and integrated index. Comput. Biol. Med. 2016, 75, 54–62. [Google Scholar] [CrossRef] [PubMed]
- Koh, J.E.; Acharya, U.R.; Hagiwara, Y.; Raghavendra, U.; Tan, J.H.; Sree, S.V.; Bhandary, S.V.; Rao, A.K.; Sivaprasad, S.; Chua, K.C.; et al. Diagnosis of retinal health in digital fundus images using continuous wavelet transform (CWT) and entropies. Comput. Biol. Med. 2017, 84, 89–97. [Google Scholar] [CrossRef] [PubMed]
- Kumar, P.S.; Deepak, R.U.; Sathar, A.; Sahasranamam, V.; Kumar, R.R. Automated Detection System for Diabetic Retinopathy Using Two Field Fundus Photography. Procedia Comput. Sci. 2016, 93, 486–494. [Google Scholar] [CrossRef]
- Kumar, P.S.; Kumar, R.R.; Sathar, A.; Sahasranamam, V. Automatic detection of exudates in retinal images using histogram analysis. In Proceedings of the 2013 IEEE Recent Advances in Intelligent Computational Systems (RAICS), Trivandrum, India, 19–21 December 2013; pp. 277–281. [Google Scholar]
- Kumar, P.S.; Kumar, R.R.; Sathar, A.; Sahasranamam, V. Automatic detection of red lesions in digital color retinal images. In Proceedings of the Contemporary Computing and Informatics (IC3I), Mysore, India, 27–29 November 2014; pp. 1148–1153. [Google Scholar]
- Imani, E.; Pourreza, H.R.; Banaee, T. Fully automated diabetic retinopathy screening using morphological component analysis. Comput. Med. Imaging Graph. 2015, 43, 78–88. [Google Scholar] [CrossRef] [PubMed]
- Goh, J.; Tang, L.; Saleh, G.; Al Turk, L.; Fu, Y.; Browne, A. Filtering normal retinal images for diabetic retinopathy screening using multiple classifiers. In Proceedings of the 9th International Conference on Information Technology and Applications in Biomedicine, Larnaca, Cyprus, 4–7 November 2009; pp. 1–4. [Google Scholar]
- Akram, M.U.; Khalid, S.; Tariq, A.; Khan, S.A.; Azam, F. Detection and classification of retinal lesions for grading of diabetic retinopathy. Comput. Biol. Med. 2014, 45, 161–171. [Google Scholar] [CrossRef] [PubMed]
- Aliahmad, B.; Kumar, D.K.; Jain, R. Automatic analysis of retinal vascular parameters for detection of diabetes in Indian patients with no retinopathy sign. Int. Sch. Res. Not. 2016, 2016, 8423289. [Google Scholar] [CrossRef] [PubMed]
- Siva Sundhara Raja, D.; Vasuki, S. Automatic detection of blood vessels in retinal images for diabetic retinopathy diagnosis. Comput. Math. Methods Med. 2015, 2015, 419279. [Google Scholar] [CrossRef] [PubMed]
- Rajashekar, D.; Srinivasa, G.; Vinekar, A. Comprehensive Retinal Image Analysis for Aggressive Posterior Retinopathy of Prematurity. PLoS ONE 2016, 11, e0163923. [Google Scholar] [CrossRef] [PubMed]
- Li, H.; Liu, K.R.; Lo, S.C. Fractal modeling and segmentation for the enhancement of microcalcifications in digital mammograms. IEEE Trans. Med. Imaging 1997, 16, 785–798. [Google Scholar] [CrossRef] [PubMed] [Green Version]
- Akram, F.; Garcia, M.A.; Puig, D. Active contours driven by local and global fitted image models for image segmentation robust to intensity inhomogeneity. PLoS ONE 2017, 12, e0174813. [Google Scholar] [CrossRef] [PubMed]
- Sreng, S.; Maneerat, N.; Isarakorn, D.; Hamamoto, K.; Panjaphongse, R. Primary screening of diabetic retinopathy based on integrating morphological operation and support vector machine. In Proceedings of the International Conference on Intelligent Informatics and Biomedical Sciences (ICIIBMS), Okinawa, Japan, 24–26 November 2017; pp. 250–254. [Google Scholar]
- Sreng, S.; Maneerat, N.; Isarakorn, D.; Pasaya, B.; Takada, J.I.; Panjaphongse, R.; Varakulsiripunth, R. Automatic exudate extraction for early detection of Diabetic Retinopathy. In Proceedings of the International Conference on Information Technology and Electrical Engineering (ICITEE), Yogyakarta, Indonesia, 7–8 October 2013; pp. 31–35. [Google Scholar]
- GLCM texture features. Available online: https://www.mathworks.com/matlabcentral/fileexchange/22187-glcm-texture-features (accessed on 8 June 2018).
- Tang, X. Texture information in run-length matrices. IEEE Trans. Image Process. 1998, 7, 1602–1609. [Google Scholar] [CrossRef] [PubMed]
- Ojala, T.; Pietikainen, M.; Maenpaa, T. Multiresolution Gray Scale and Rotation Invariant Texture Classification With Local Binary Patterns. IEEE Trans. Pattern Anal. Mach. Intell. 2002, 24, 971–987. [Google Scholar] [CrossRef]
- Ojala, T.; Pietikäinen, M.; Harwood, D. A comparative study of texture measures with classification based on featured distributions. Pattern Recognit. 1996, 29, 51–59. [Google Scholar] [CrossRef]
- Kirkpatrick, S.; Gelatt, C.D.; Vecchi, M.P. Optimization by simulated annealing. Science 1983, 220, 671–680. [Google Scholar] [CrossRef] [PubMed]
- Lee, J.S.; Park, C.H.; Ebrahimi, T. Theory and applications of hybrid simulated annealing. In Handbook of Optimization; Springer: Berlin, Heidelberg, 2013; pp. 395–422. [Google Scholar]
- Anghinolfi, D.; Paolucci, M. Simulated Annealing as an Intensification Component in Hybrid Population-Based Metaheuristics. In Simulated Annealing; InTechOpen: Vienna, Austria, 2008. [Google Scholar]
- Kalami, S.M. Feature Selection using Metaheuristics and EAs. Available online: www.yarpiz.com (accessed on 7 May 2018).
- Breiman, L. Bagging predictors. Machine Learn. 1996, 24, 123–140. [Google Scholar] [CrossRef] [Green Version]
- Holland, J.H. Adaptation in Natural and Artificial Systems: An Introductory Analysis with Applications to Biology, Control, and Artificial Intelligence; University Michigan Press: Ann Arbor, MI, USA, 1975. [Google Scholar]
- Kennedy, J. Particle swarm optimization. In Encyclopedia of Machine Learning; Springer: Boston, MA, USA, 2011; pp. 760–766. [Google Scholar]


| Features | Description | |
|---|---|---|
| Morphological features | F1 | Total area of detected regions |
| F2 | Total length of boundary of detected regions | |
| Intensity features | F3–F5 | The mean values of maximum intensity, mean intensity and minimum intensity of the segmented image. |
| Color features | F6–F8 | The mean intensity in hue, saturation and value in HSV color space of the segmented image. |
| First order statistical features | F9–F15 | The mean, standard deviation, smoothness, variance, skewness, kurtosis and energy of intensity of the segmented image. |
| Gray Level Co-occurrence Matrix (GLCM) features | F16–F103 | Four orientations of 22 features in GLCM matrix of the segmented image [19] |
| Gray Level Run Length Matrix (GLRLM) features | F104–F147 | Four orientations of 11 features in GLRLM matrix of the segmented image [20] |
| Local Binary Pattern Features | F148–F206 | 59 features from local binary pattern features [21] |
| Tamura’s Texture Features | F207–F208 | Coarseness value and Contrast value from Tamura’s texture features of the segmented image [22] |
| Pathological Signs of Retinal Images | Number of Images |
|---|---|
| Healthy retinal images | 218 |
| Mild and Moderate NPDR | 318 |
| Severe NPDR | 312 |
| New blood vessels growing | 36 |
| Neovascularization | 115 |
| Fibrous proliferations | 160 |
| Scar | 41 |
| Total | 1200 |
| Classifiers | Sensitivity | Specificity | Accuracy | Precision | F-measure |
|---|---|---|---|---|---|
| SVM | 89.09% | 96.75% | 95.00% | 89.09% | 89.09% |
| DT | 87.27% | 94.05% | 92.50% | 81.35% | 84.21% |
| LR | 72.72% | 94.59% | 89.58% | 80.00% | 76.19% |
| LDA | 90.90% | 68.64% | 73.75% | 46.29% | 61.35% |
| KNN | 85.45% | 95.13% | 92.91% | 83.92% | 84.68% |
| EB | 90.90% | 98.92% | 97.08% | 96.15% | 93.45% |
| Classifiers | Sensitivity | Specificity | Accuracy | Precision | F-measure |
|---|---|---|---|---|---|
| SVM | 72.72% | 96.21% | 90.83% | 85.10% | 78.43% |
| DT | 81.81% | 97.29% | 93.75% | 90.00% | 85.71% |
| LR | 47.27% | 94.05% | 83.33% | 70.72% | 56.52% |
| LDA | 94.54% | 65.40% | 72.08% | 44.82% | 60,82% |
| KNN | 83.63% | 91.89% | 90.00% | 75.41% | 79.31% |
| EB | 85.45% | 97.83% | 95.00% | 92.16% | 88.68% |
| Classifiers | Sensitivity | Specificity | Accuracy | Precision | F-measure |
|---|---|---|---|---|---|
| SVM | 90.90% | 95.13% | 94.16% | 84.75% | 87.72% |
| DT | 89.09% | 95.67% | 94.16% | 85.96% | 87.50% |
| LR | 54.54% | 96.76% | 87.08% | 83.33% | 65.93% |
| LDA | 92.72% | 68.64% | 74.16% | 46.79% | 62.19% |
| KNN | 90.90% | 94.40% | 93.33% | 81.97% | 86.20% |
| EB | 90.90% | 97.83% | 96.25% | 92.59% | 91.74% |
| Classifiers | Sensitivity | Specificity | Accuracy | Precision | F-measure |
|---|---|---|---|---|---|
| SVM | 85.45% | 95.13% | 92.92% | 83.93% | 84.68% |
| DT | 80.00% | 96.21% | 92.50% | 86.27% | 83.02% |
| LR | 58.18% | 95.13% | 86.67% | 78.05% | 66.67% |
| LDA | 90.90% | 68.65% | 73.75% | 46.29% | 61.35% |
| KNN | 90.90% | 94.05% | 93.33% | 81.97% | 86.20% |
| EB | 90.90% | 96.75% | 95.42% | 89.28% | 90.90% |
| AUROC | ||||
|---|---|---|---|---|
| Classifiers | HSA | GA | PSO | HACO |
| DT | 93.40% | 89.11% | 92.06% | 90.57% |
| SVM | 98.15% | 95.25% | 97.91% | 94.94% |
| LR | 94.75% | 89.34% | 94.07% | 91.62% |
| LDA | 87.79% | 89.29% | 87.37% | 87.53% |
| KNN | 97.87% | 95.00% | 97.31% | 97.86% |
| EB | 98.34% | 97.31% | 97.93% | 97.79% |
| Authors | No. of Images | Methods/Input Features/Classifiers | Performance |
|---|---|---|---|
| Goh et al. 2009 [10] | 1000 |
| Sen = 92.00% Sp = 91.00% |
| Imani et al., 2015 [9] | 930 |
| Acc = 92.82% Sen = 92.01% Sp = 95.45% |
| Kumar et al., 2016 [6] | 1344 |
| Sen = 80% Sp = 50% |
| Acharya et al., 2016 [4] | 800 |
| Acc = 88.63% Sen = 86.25% SP = 91% |
| Koh et al., 2017 [5] | 1486 |
| Sen = 89.37% SP = 95.58% Acc = 92.48% |
| Proposed method | 1200 |
| Sen = 90.90% Sp = 98.92% Acc = 97.08% Pre = 96.15% F = 93.45% AUROC = 98.34% |
© 2018 by the authors. Licensee MDPI, Basel, Switzerland. This article is an open access article distributed under the terms and conditions of the Creative Commons Attribution (CC BY) license (http://creativecommons.org/licenses/by/4.0/).
Share and Cite
Sreng, S.; Maneerat, N.; Hamamoto, K.; Panjaphongse, R. Automated Diabetic Retinopathy Screening System Using Hybrid Simulated Annealing and Ensemble Bagging Classifier. Appl. Sci. 2018, 8, 1198. https://doi.org/10.3390/app8071198
Sreng S, Maneerat N, Hamamoto K, Panjaphongse R. Automated Diabetic Retinopathy Screening System Using Hybrid Simulated Annealing and Ensemble Bagging Classifier. Applied Sciences. 2018; 8(7):1198. https://doi.org/10.3390/app8071198
Chicago/Turabian StyleSreng, Syna, Noppadol Maneerat, Kazuhiko Hamamoto, and Ronakorn Panjaphongse. 2018. "Automated Diabetic Retinopathy Screening System Using Hybrid Simulated Annealing and Ensemble Bagging Classifier" Applied Sciences 8, no. 7: 1198. https://doi.org/10.3390/app8071198
APA StyleSreng, S., Maneerat, N., Hamamoto, K., & Panjaphongse, R. (2018). Automated Diabetic Retinopathy Screening System Using Hybrid Simulated Annealing and Ensemble Bagging Classifier. Applied Sciences, 8(7), 1198. https://doi.org/10.3390/app8071198