Review

Mini-LED and Micro-LED: Promising Candidates for the Next Generation Display Technology

1
Department of Electronic Science, Fujian Engineering Research Center for Solid-State Lighting, Xiamen University, Xiamen 361005, China
2
Institute of Electro-Optical Engineering, National Chiao Tung University, Hsinchu 30010, Taiwan
3
HKUST Fok Ying Tung Research Institute, Nansha District, Guangzhou 511458, China
4
Department of Electronic Engineering, Xiamen University, Xiamen 361005, China
*
Authors to whom correspondence should be addressed.
Appl. Sci. 2018, 8(9), 1557; https://doi.org/10.3390/app8091557
Submission received: 31 July 2018 / Revised: 13 August 2018 / Accepted: 30 August 2018 / Published: 5 September 2018
(This article belongs to the Special Issue Group III-V Nitride Semiconductor Microcavities and Microemitters)

Abstract

:
Displays based on inorganic light-emitting diodes (LED) are considered as the most promising one among the display technologies for the next-generation. The chip for LED display bears similar features to those currently in use for general lighting, but it size is shrunk to below 200 microns. Thus, the advantages of high efficiency and long life span of conventional LED chips are inherited by miniaturized ones. As the size gets smaller, the resolution enhances, but at the expense of elevating the complexity of fabrication. In this review, we introduce two sorts of inorganic LED displays, namely relatively large and small varieties. The mini-LEDs with chip sizes ranging from 100 to 200 μm have already been commercialized for backlight sources in consumer electronics applications. The realized local diming can greatly improve the contrast ratio at relatively low energy consumptions. The micro-LEDs with chip size less than 100 μm, still remain in the laboratory. The full-color solution, one of the key technologies along with its three main components, red, green, and blue chips, as well color conversion, and optical lens synthesis, are introduced in detail. Moreover, this review provides an account for contemporary technologies as well as a clear view of inorganic and miniaturized LED displays for the display community.

1. Introduction

The traditional display technology features a cathode ray tube (CRT) based on the principle of a steered electron beam excitation of a fluorescent screen [1]. The structure of CRT is basically a vacuum tube with one or more built-in electron guns, which produce the electrons to be accelerated and steered. The steered electron beam excites one or more of the pixels on the screen designed to emit red, green, and blue (RGB), primary colors. By appropriate scanning, an image is produced on the phosphor pixelated screen. Since the invention of the first color CRT television (TV) in 1950, the CRT TV has dominated the display market for many decades because of its outstanding characteristics, such as excellent visual depth of field and high response rate. This dominance of CRT displays remained for a remarkably long time until the year of 2000, when two new display technologies, liquid-crystal display (LCD) and plasma display panel, were demonstrated [2,3,4]. Because of portability and power efficiency features, they are very popular with consumers. Later, owing to the continuous improvement in reducing the cost and performance improvements in the LCD technology, the plasma display shortly thereafter became uncompetitive. However, because LCD displays have major disadvantages, such as slow response time, poor conversion efficiency and low color saturation, the technology had been repeatedly criticized by consumers [5]. Consequently, the LCD manufacturers have taken steps to improve LCD displays, such as replacing the common liquid crystal materials with high response materials, using relatively larger conversion efficiency backlight modules, and utilizing high color saturation fluorescent materials. As a result, some high performance LCDs possess extremely short response times and thus are used in several virtual reality (VR) devices [6,7]. In recent years, new display technologies have become more mature, such as organic light-emitting diode (OLED) display and light-emitting diode (LED) displays [8]. The OLED display technology was developed in the 1990s. Compared with LCD displays, OLED displays have advantages, among which are self-luminous, wide viewing angle, high contrast, power saving, fast response, etc. [9,10]. However, due to limitations in material science and mass production capabilities, OLEDs are not as widely used in consumer electronics market as LCDs [11]. The LED-pixel based displays are mainly applied to large outdoor screens with the advantages of power saving, high color saturation and high brightness [12]. If LEDs are used as pixels of the display, the size of LEDs would need to be reduced according to the desired resolution. Because a growing number of manufacturers regard the LED display as the next- generation display technology, the onset of mini-LED and micro-LED has been triggered [13]. The comparison between mini-LED and micro-LED is shown in Table 1. The size of mini-LEDs is about 100~200 µm, which is between the size of conventional LEDs (>200 µm) and micro-LEDs (<100 µm).
According to the Research and Markets, a market research institution, the global micro-LED display market is predicted to soar from USD 0.6 billion in 2019 to USD 20.5 billion in 2025, with a compound annual growth rate of about 80% [14]. The main reason for the market outbreak is the sharp increase in demand for brighter and more energy-efficient display panels, needed for surging devices such as smart watches, mobile phones, TVs, laptops, augmented reality (AR) and VR. According to Yole’s optimistic estimate, the market of micro-LED display will reach 330 million units by 2025 (Figure 1) [15]. Although the prospects of market are highly optimistic at present, micro-LED displays still face technological challenges, especially in the cases for which some key technologies and process equipment have not yet been made sufficiently developed. Therefore, the relatively mature mini-LED is expected to be the first commercialized variety while the micro-LED display technology is still in its nascent state.

2. Mini-LED

High dynamic range (HDR) is one of the important features for next generation displays [16]. To achieve HDR with contrast ratio (CR) higher than 100000:1, high peak brightness and excellent dark state of the display system are simultaneously required [17]. Although the best requirement for HDR is pixel level dimming, which is described as micro-LED technology, there are still some technological bottlenecks that make micro-LED harder to realize quick commercialization. Therefore, a compromising way to realize multi-zone local dimming for LCD is direct-lit mini-LED backlight. Mini-LED technology has much smaller size of LED, which means it can divide more dimming blocks in a certain size LED backlight. Recently, LED manufacturers have turned to research and develop mini-LED. Most of existing processes and equipment for conventional LED can be used continuously for fabrication of mini-LED.
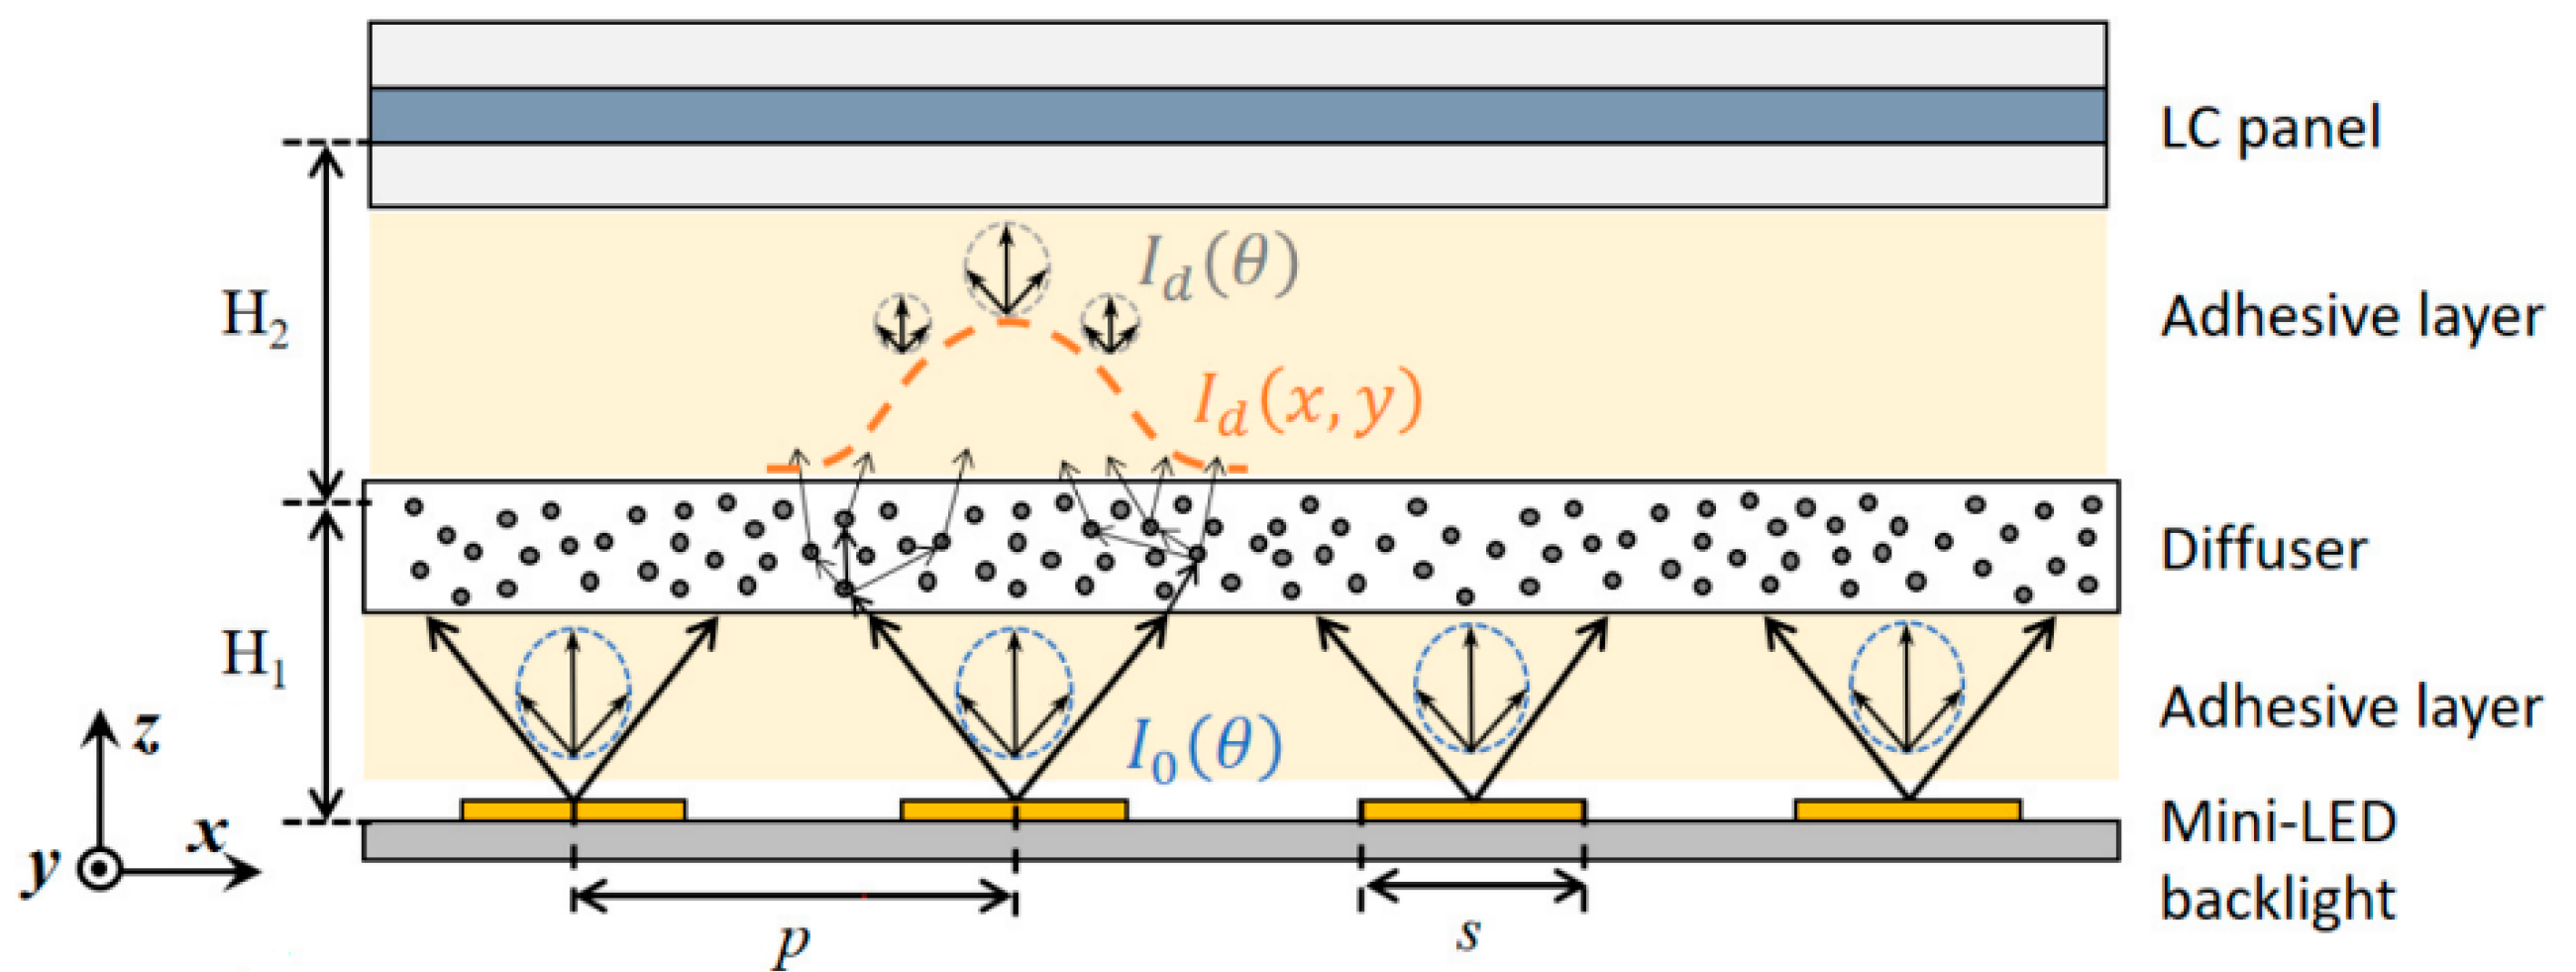
Tan et al. discussed the system modeling and performance evaluation of LCDs with mini-LED backlight [18]. First, a model of LCD system with a direct-lit mini-LED backlight is set up for simulation (Figure 2). The backlight unit consists of square-shaped mini-LED array. A diffuser plate is utilized to widen both spatial and angular distributions, and a liquid crystal (LC) panel is applied to control the output light. The parameters of the model, such as p, s, H1, and H2, are based on the device configuration reported in Reference [19]. To validate the model, four patterns are used to simulate the dynamic CR of the model, and the simulated results can agree with the measured data from Reference [19] reasonably well.
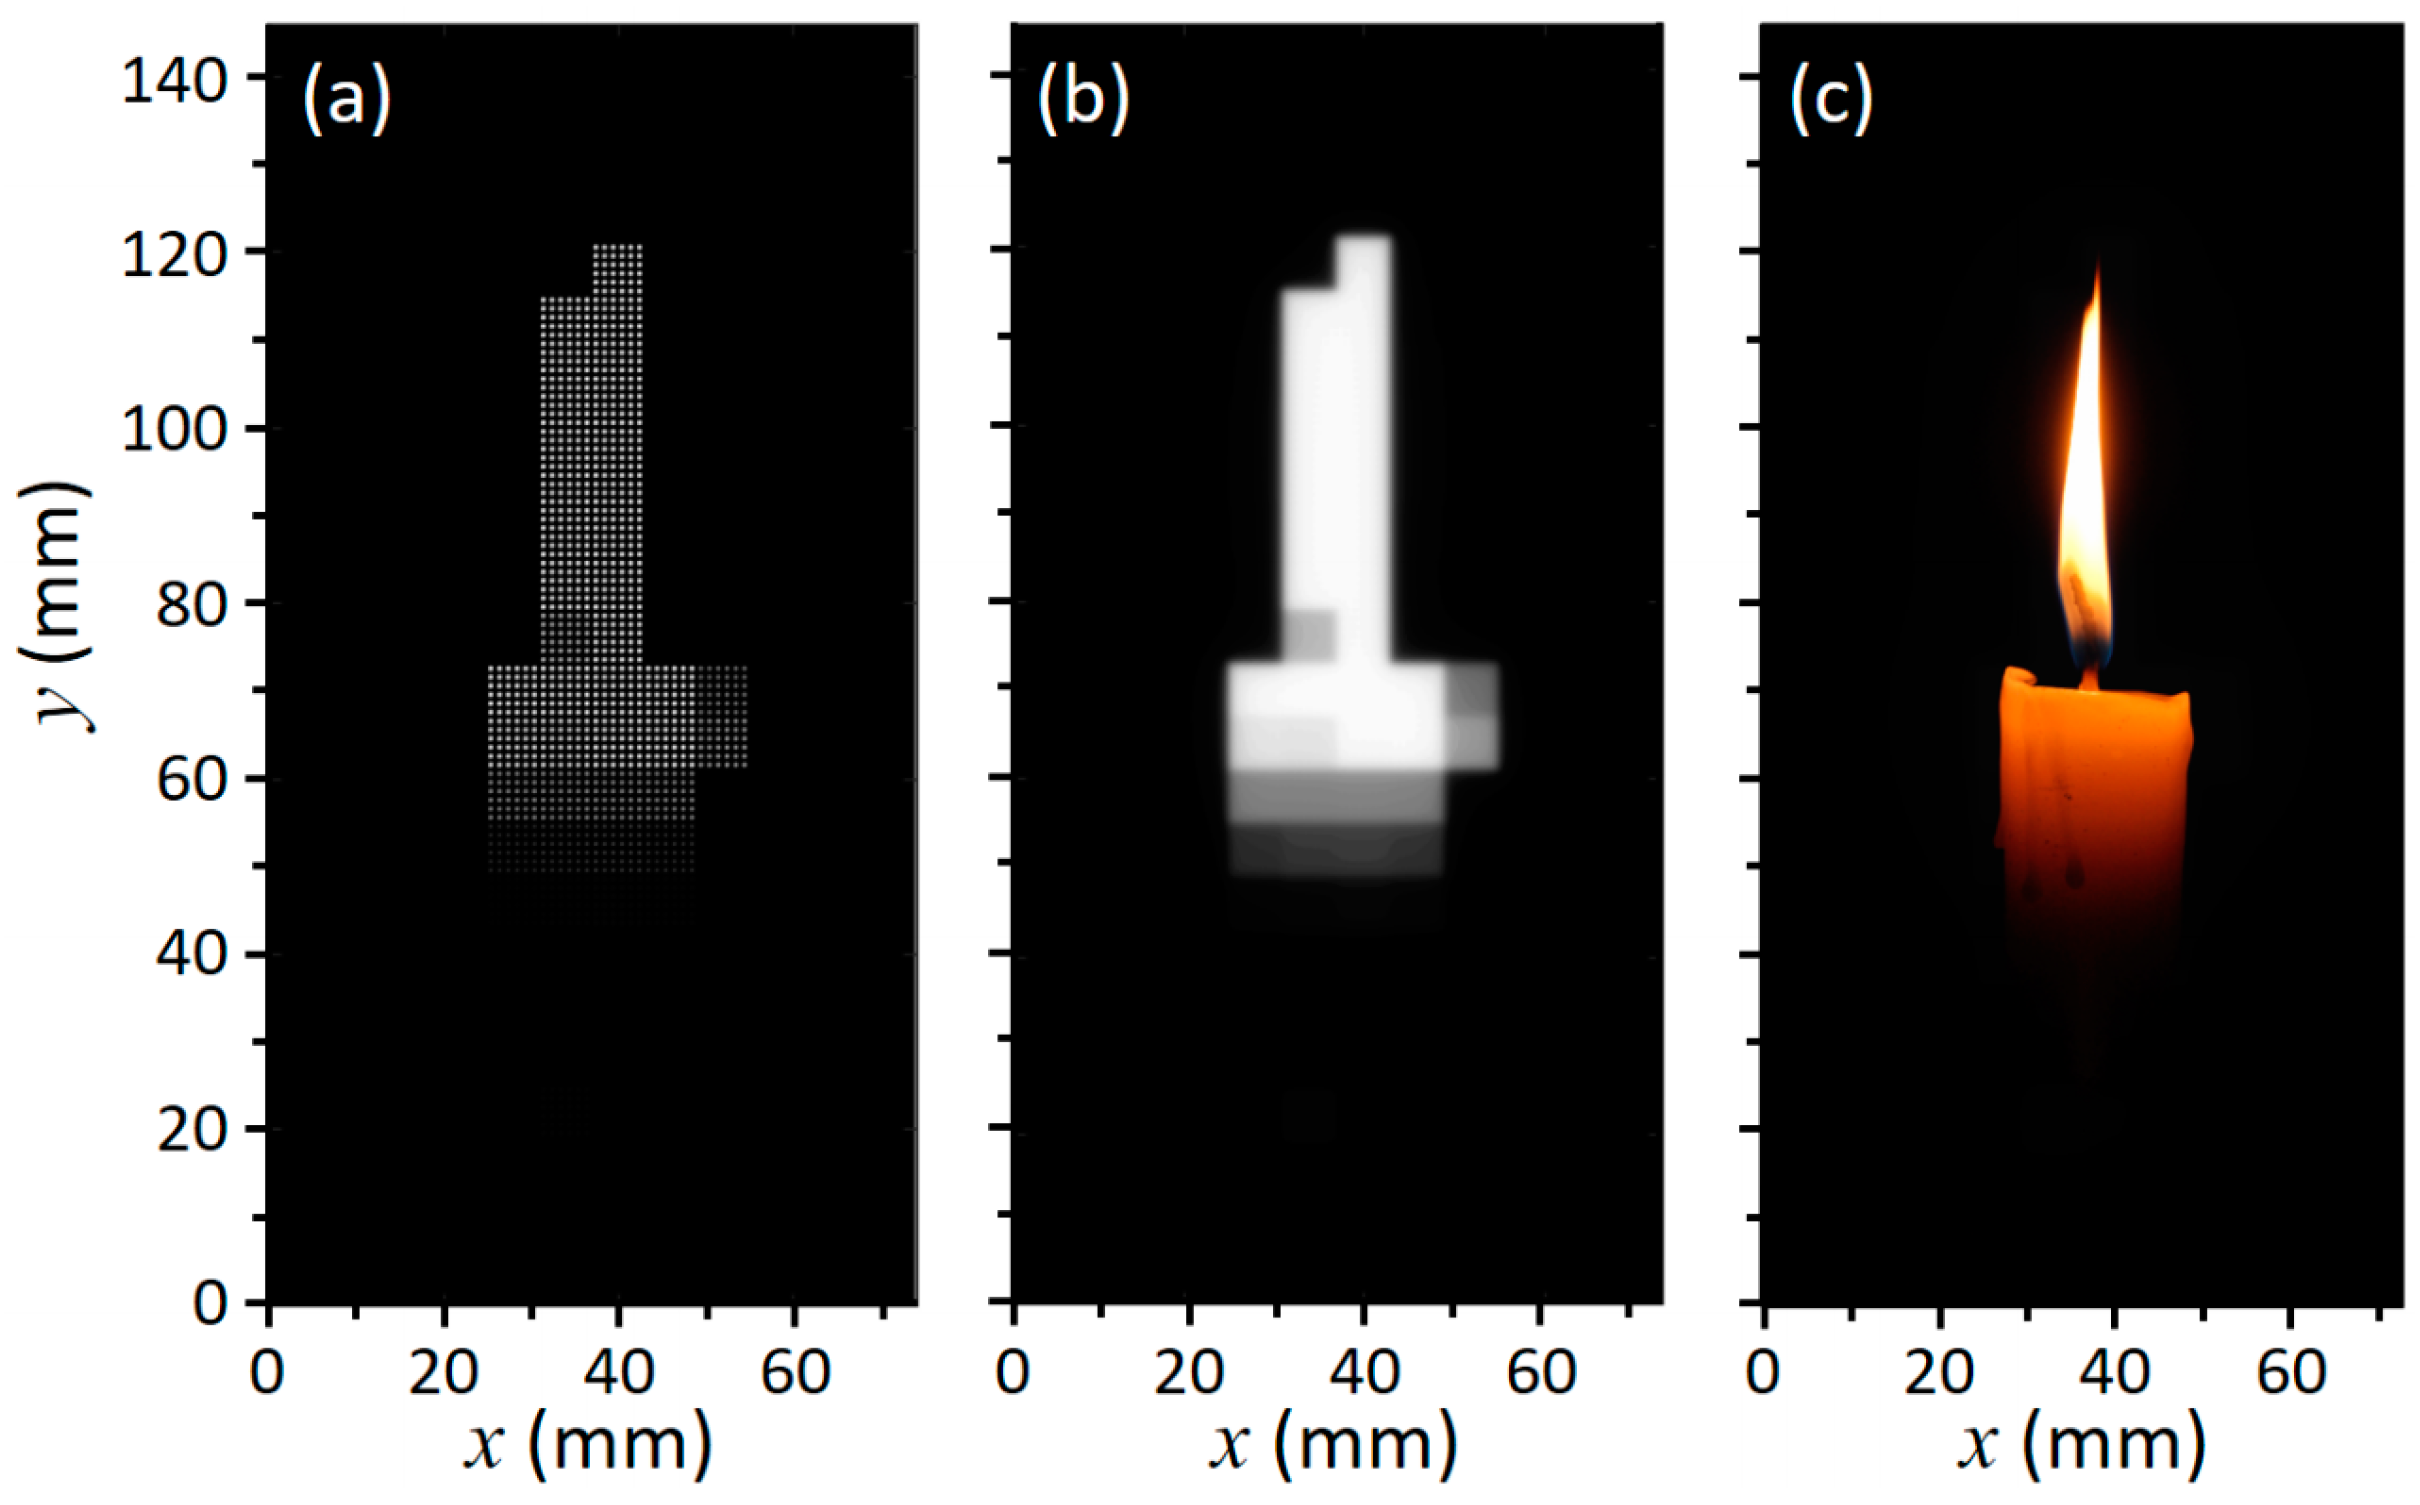
Next, the proved model is utilized to find out the relationship between the device structure to the final HDR display performance, especially the halo effect (Figure 3). Final HDR performance of displayed images are calculated via independently adjusting two key parameters of the device structure, the local dimming zone number and the LCD contrast ratio. According to simulation results, the dimming zone number mainly affects the halo area, while LCD contrast ratio influences the local image distortion, and more local dimming zones and higher LC contrast ratio can reduce the halo effect and improve the display performance.
Then, a subjective experiment is designed and carried out to determine the human visual perception limit of halo effect. The LabPSNR, an evaluation metric used to quantify the difference between displayed image and target image, should be larger than 47.4 dB. Based on this limit, the requirement of local dimming zone number can be proposed: over 200 local dimming zones for high CR ≈ 5000:1 LCD panels and more than 3000 dimming zones for CR ≈ 2000:1 LCDs (Figure 4).
Although the above simulations and experiments are all based on the small-size smartphone displays with viewing distance at 25 cm, the analysis and conclusion can also be applied to display devices with different sizes and resolutions via converting the results from spatial domain to angular domain (Figure 5). In summary, Tan et al. demonstrated the required local dimming zone number to exhibit comparable HDR performance with OLED, and the HDR performance could not be achieved by conventional segmented LED backlight. The simulation model can provide useful guidelines to theoretically optimize the mini-LED backlit LCDs for achieving excellent HDR display.
While mini-LED, an ideal backlight candidate for local dimming LCDs, is ready to be produced in volume at present, micro-LED still has to be processed inside laboratories and needs further preparation before entering the mass production. Many companies have joined the competition of mini-LED and tried to develop the mini-LED backlight technology to replace the traditional LCD backlight recently.
AU Optronics Corporation (AUO) demonstrated several high-end mini-LED backlit LCD displays, including a 27” 4K 144 Hz gaming monitor and a 1000 PPI 2” LTPS VR display (Figure 6) [20]. The gaming monitor used a straight down type mini-LED backlight to provide accurate local dimming with ultra-high brightness, creating a more realistic visual enjoyment for customer. However, the cost of mini-LEDs is still several times higher than traditional backlight technology at present. For head-mounted VR display, AUO shows a 2-inch panel equipped with an active matrix (AM) driver circuit which can achieve 1024 local dimming zones for vivid images.
JDI, a Japanese manufacturer, demonstrated an automotive central control panel based on a 16.7 inch curved screen with a straight down type mini-LED backlight at 2018 SID Display Week, shown in Figure 7a [21]. The contrast and color of the screen can be presented perfectly even in complex situations because of the local dimming with 104 dimming zones in the screen. BOE, one of the largest display makers in China, exhibited a 27-inch ultra-high-definition (UHD) panel, which used a mini-LED backlight with 1000 local dimming zones. Its brightness is up to 600 nits and its contrast is up to 1,000,000:1. In addition, BOE also showed a 5.9-inch mobile phone panel which was only 1.4 mm in thickness, shown in Figure 7b [21].

3. Micro-LED

As H. X. Jiang’s group in Texas Technique University reported the first fabrication of micro-LED chip with diameter of 12 µm in the year of 2000 [22,23,24], micro-LED has become a hot topic soon after the inception.
The application field of LEDs varies depending on the chip size. Due to the size difference, the traditional LED chip is mainly used in general lighting [25,26,27] and display backlight module [28]. The mini-LED is applied to backlight applications such as HDR and flexible displays [18], while the micro-LED is suitable for applications such as wearable watches, mobile phones, automotive head-up displays, AR/VR, micro projectors, and high-end televisions [29] (Table 2). Additionally, micro-LED can be combined with a flexible substrate to realize the flexible characteristics like OLED [30]. Therefore, micro-LED displays have the potential to match or exceed today’s OLED displays, with its high contrast, low power consumption, high brightness, and especially the high life-span [31].
At present, the micro-LED display technology still faces some challenges, like the transfer printing of micro-LED chips for mass production [32,33,34] and the full-color method for display applications [35,36,37]. With the rapid development of some transfer printing approaches summarized in Table 3, the first problem is expected to be effectively solved. Thus, we will focus on methods of fabricating the full-color display for micro-LEDs.

3.1. RGB Micro-LED Full-Color Display

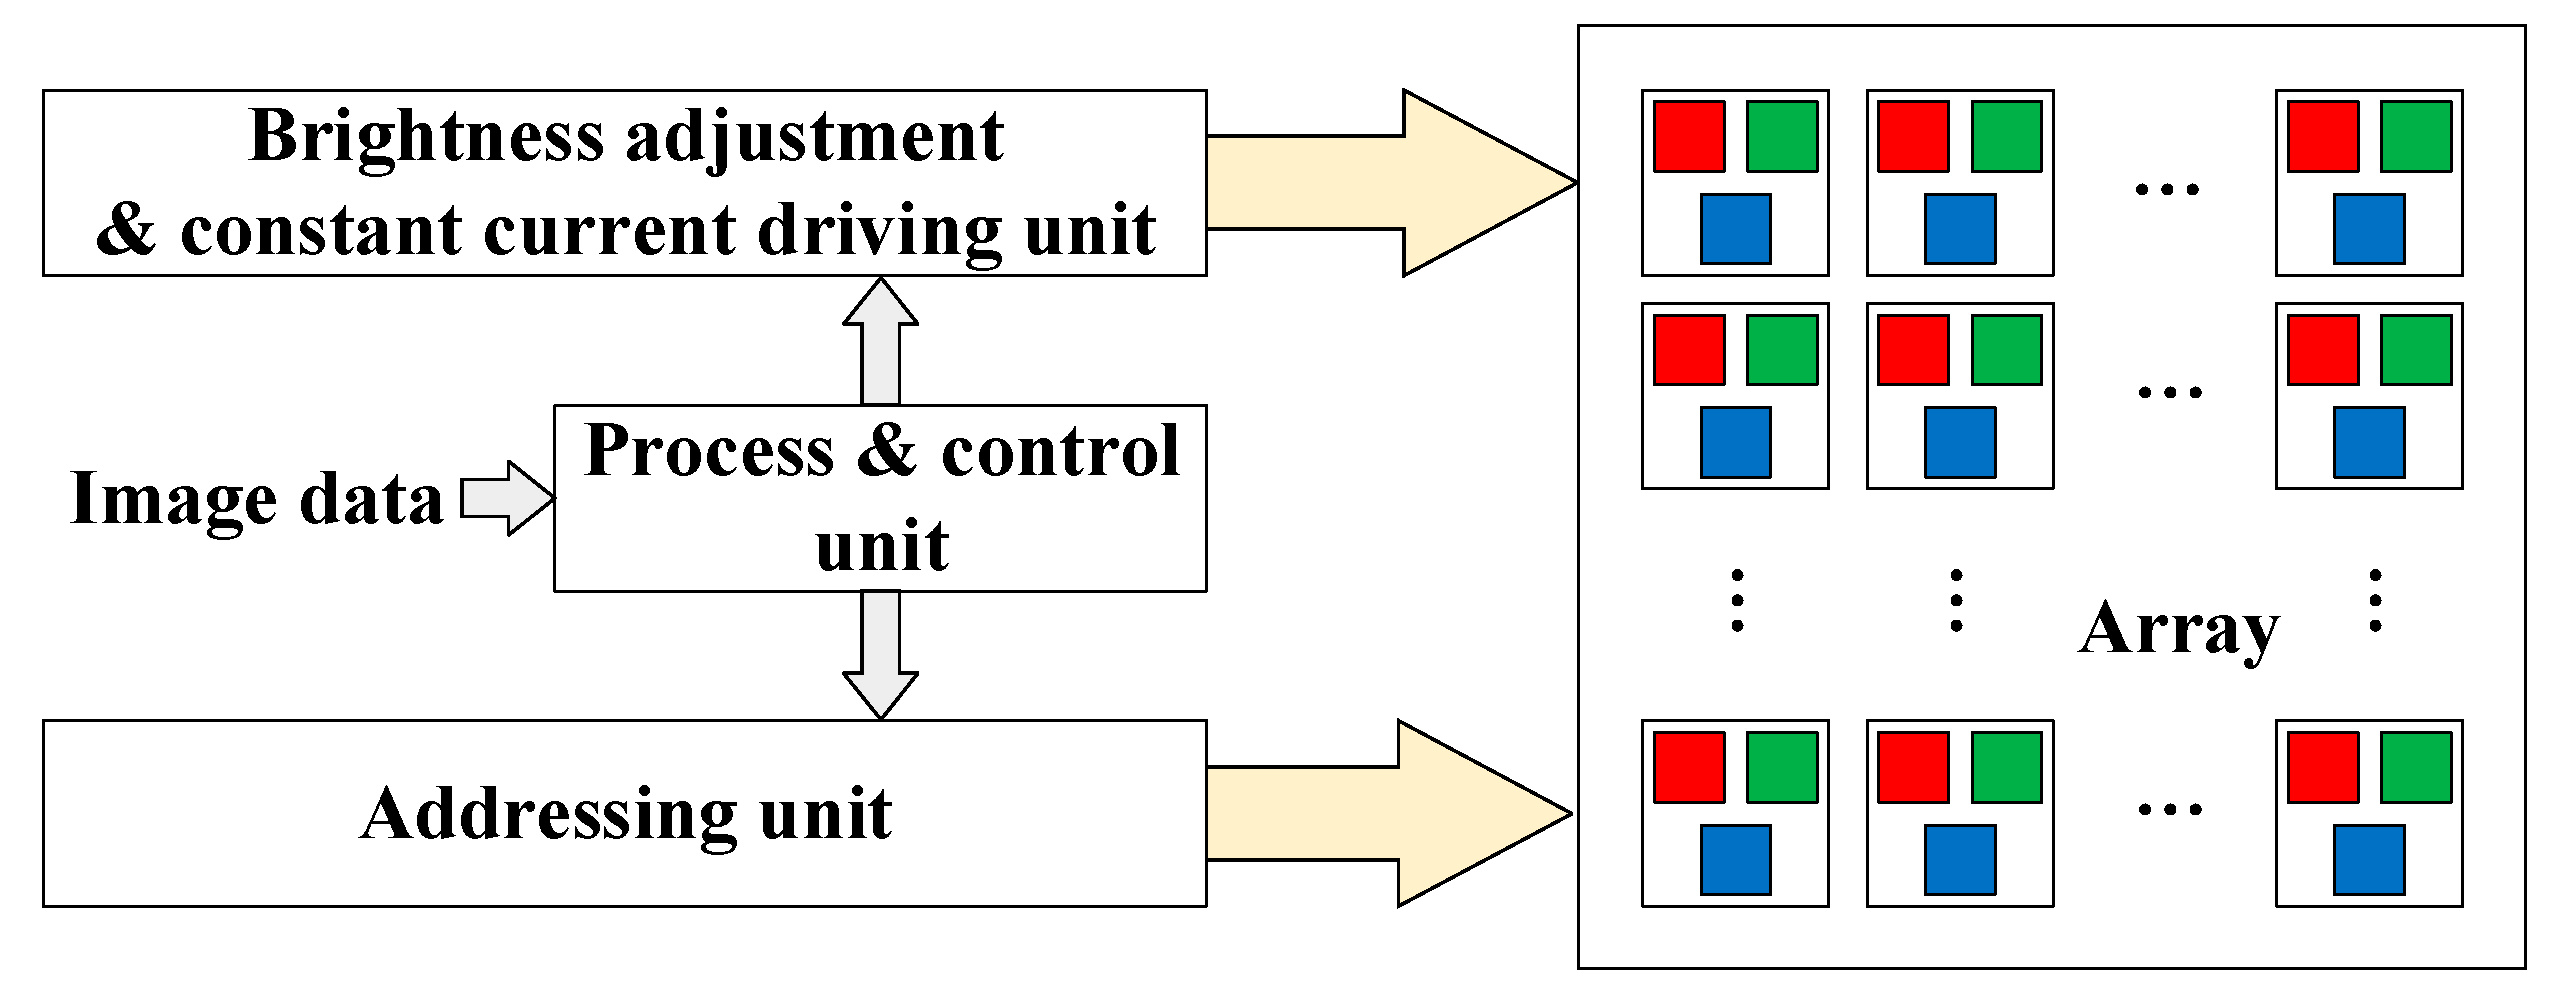
The principle of RGB full-color display is based on the law of three primary colors that can be combined to create all colors in nature via a certain ratio setting (Figure 8). Therefore, for RGB LEDs, different currents are applied to control the brightness of each LED to realize the combination of three primary colors and achieve the full-color display. It is the method that is usually employed in outdoor LED large screens.
In the RGB full-color display method, each pixel contains a set of RGB micro-LEDs. Generally, the P and N electrodes of the three-color micro-LEDs are connected to the circuit substrate by means of bonding or flip-chip.
After that, a dedicated full-color driver chip is used to drive each color of micro-LEDs via the pulse width modulation (PWM) current. The PWM current drive method can achieve digital dimming by setting the duty cycle of the current. For example, an 8-bit PWM full-color driver chip can achieve 28 = 256 kinds of dimming effects of a single-color micro-LED, then for a pixel containing three-color LED theoretically can achieve 2563 = 16,777,216 kinds of dimming effect which means the same number of colors can be displayed. Figure 9 demonstrates the specific full-color display driving principle [38].
However, the RGB micro-LED based technology suffers from a severe disadvantage in mass production. For example, in order to manufacture a 4K resolution display, nearly 25 million micro-LEDs are needed to be assembled and connected without a single error in an economical and efficient way, with placement accuracy of 1 µm or less. Obviously, it is very difficult to transfer or grow such a huge number of three different micro-LEDs on the same substrate.
As an ideal solution, all RGB micro-LEDs would be composed of the same material with the same behaviors and driving conditions. The challenge is to find one material capable of spanning the blue to red spectrum. Theoretically, the InGaN alloy can cover the entire visible range by adjusting the indium content to fine tune the peak emission wavelength. Unfortunately, high indium content in GaN-based LEDs results in poor quality because of lattice mismatches between the GaN buffer layers and the InGaN quantum wells.
To address these issues, A. Even et al. developed an innovative substrate called InGaNOS (InGaN pseudo-substrates) that overcomes lattice mismatch [39]. The substrate has a top relaxed InGaN layer that can be used as a seed layer for full InGaN LED growth, as shown in Figure 10a. The experimental results illustrate that InGaN structures grown on InGaNOS substrates can span the spectrum from blue (482nm) to red (617nm) [40], as shown in Figure 10b. InGaNOS technology can be used to create substrates with mixed lattice parameters, enabling growth of different color LEDs on the same substrate. This could drastically reduce the cost of micro-LED mass transfer for full-color display fabrication in the future.

3.2. Color Conversion Full-Color Display

The full-color display can be achieved by employing excitation sources, such as ultraviolet (UV) micro-LED or blue micro-LED, with color-conversion materials. RGB color-conversion materials are needed to achieve RGB three primary colors if UV micro-LEDs are used, while only red and green color-conversion materials are required if blue micro-LEDs are used (Figure 11). Generally, color-conversion materials can be divided into the phosphor and the quantum dots (QDs).

3.2.1. Phosphor

The phosphor can emit the light of a specific wavelength under the excitation of blue or UV LEDs. The color of the phosphor is determined by its material, and the production method is simple and easy to implement. After LEDs are integrated with the substrate of the drive circuit, the phosphor is deposited on the surface of LEDs via spin coating or pulse-spray coating [41]. Figure 12 shows an example of the deposition of phosphors.
However, this method still has some shortcomings. The layer of phosphor will absorb part of the energy and reduce the conversion efficiency. Moreover, the optimized size of the phosphor particles for lighting and display, which is about 1–10 micrometers, is still relatively large [42,43]. As sizes of micro-LED pixels continually decrease, the layer of phosphor will become uneven and reduce the luminance homogeneity. The disadvantages mentioned above give the technology of QDs a chance to shine.

3.2.2. Quantum Dots

To realize full-color display, colloidal QDs can be a great choice. The QDs are usually synthesized by chemical solution process [44] and possess unique properties such as high quantum yield, size-dependent emission wavelength, and narrow emission linewidth [45,46].
Combining UV micro-LEDs and RGB QDs together, Prof. Kuo et al. demonstrated a method to achieve full-color high-quality micro-LED displays via the aerosol jet (AJ) technique [47,48]. Additionally, a photoresist (PR) mold is fabricated to limit the optical cross-talk effect, and the QDs are deposited into the PR mold with clear separation between each other. Furthermore, a distributed Bragg reflector (DBR) covered above the PR mold can significantly enhance both the utilization of UV light and the emission intensity of RGB QDs.
As the core-shell type with ligands attached to the outer shells, RGB QDs in the experiment have the average particle sizes about 9.3 nm, 6.2 nm and 2.5 nm, and the emission spectra of them are 630 nm, 520 nm and 450 nm, respectively. Figure 13 shows the absorption and emission spectra as well as images of blue, green, and red QDs solution, respectively. Moreover, due to the narrow emission linewidths of RGB QDs, large color gamut can be readily achieved.
In order to fully excite RGB QDs and greatly raise color quality, an UV micro-LED array is prepared as an excitation source on an UV epitaxial wafer. The emission wavelength of the excitation source is 395 nm, while the size of micro-LED chip is 35 μm × 35 μm, as shown in Figure 14a. For reducing the cross-talk effect of QDs, a PR mold with open windows and blocking walls is fabricated via the simple lithography technique. The definition of the mask for the PR mold fabrication is adopted with the pitch size of 40 μm as the same as the micro-LED array. By aligning the mold windows to the micro-LED mesa, as shown in Figure 14b–e, UV micro-LEDs can accurately excite RGB QDs without the cross-talk effect.
The AJ system consists primarily of an ultrasonic atomizer and a spraying chamber (Figure 15). Inside the ultrasonic atomizer, ultrasonic vibrations first atomize the RGB QD suspension. Then, a nitrogen gas flow transfers the AJ to the nozzle to becoming small drops. Ultimately, QDs are deposited on the substrate with high resolution and narrow linewidth.
Table 4 lists the optimized parameters of the AJ system. The working distance and stage speed are fixed according to the experimental experience. Different sizes of the QDs will affect the deposition conditions. Therefore, different flow rates are required to control the AJ system. Generally, as the particle size of QDs increases, both the carrier gas flow rate and the sheath gas flow rate need to be increased to maintain the linewidth of the deposited QDs, which is about 35 μm in the study.
Figure 16a demonstrates the RGB pixel of the micro-LED display after the deposition of QDs on the PR mold lying above micro-LEDs. In this manner, RGB pixels have very clear boundaries between one another Figure 16b, compared with the previous case where cross-talk effect is observed without any PR mold Figure 16c. Therefore, the blocking walls in the PR mold can efficiently confine QDs to avoid the cross-talk effect.
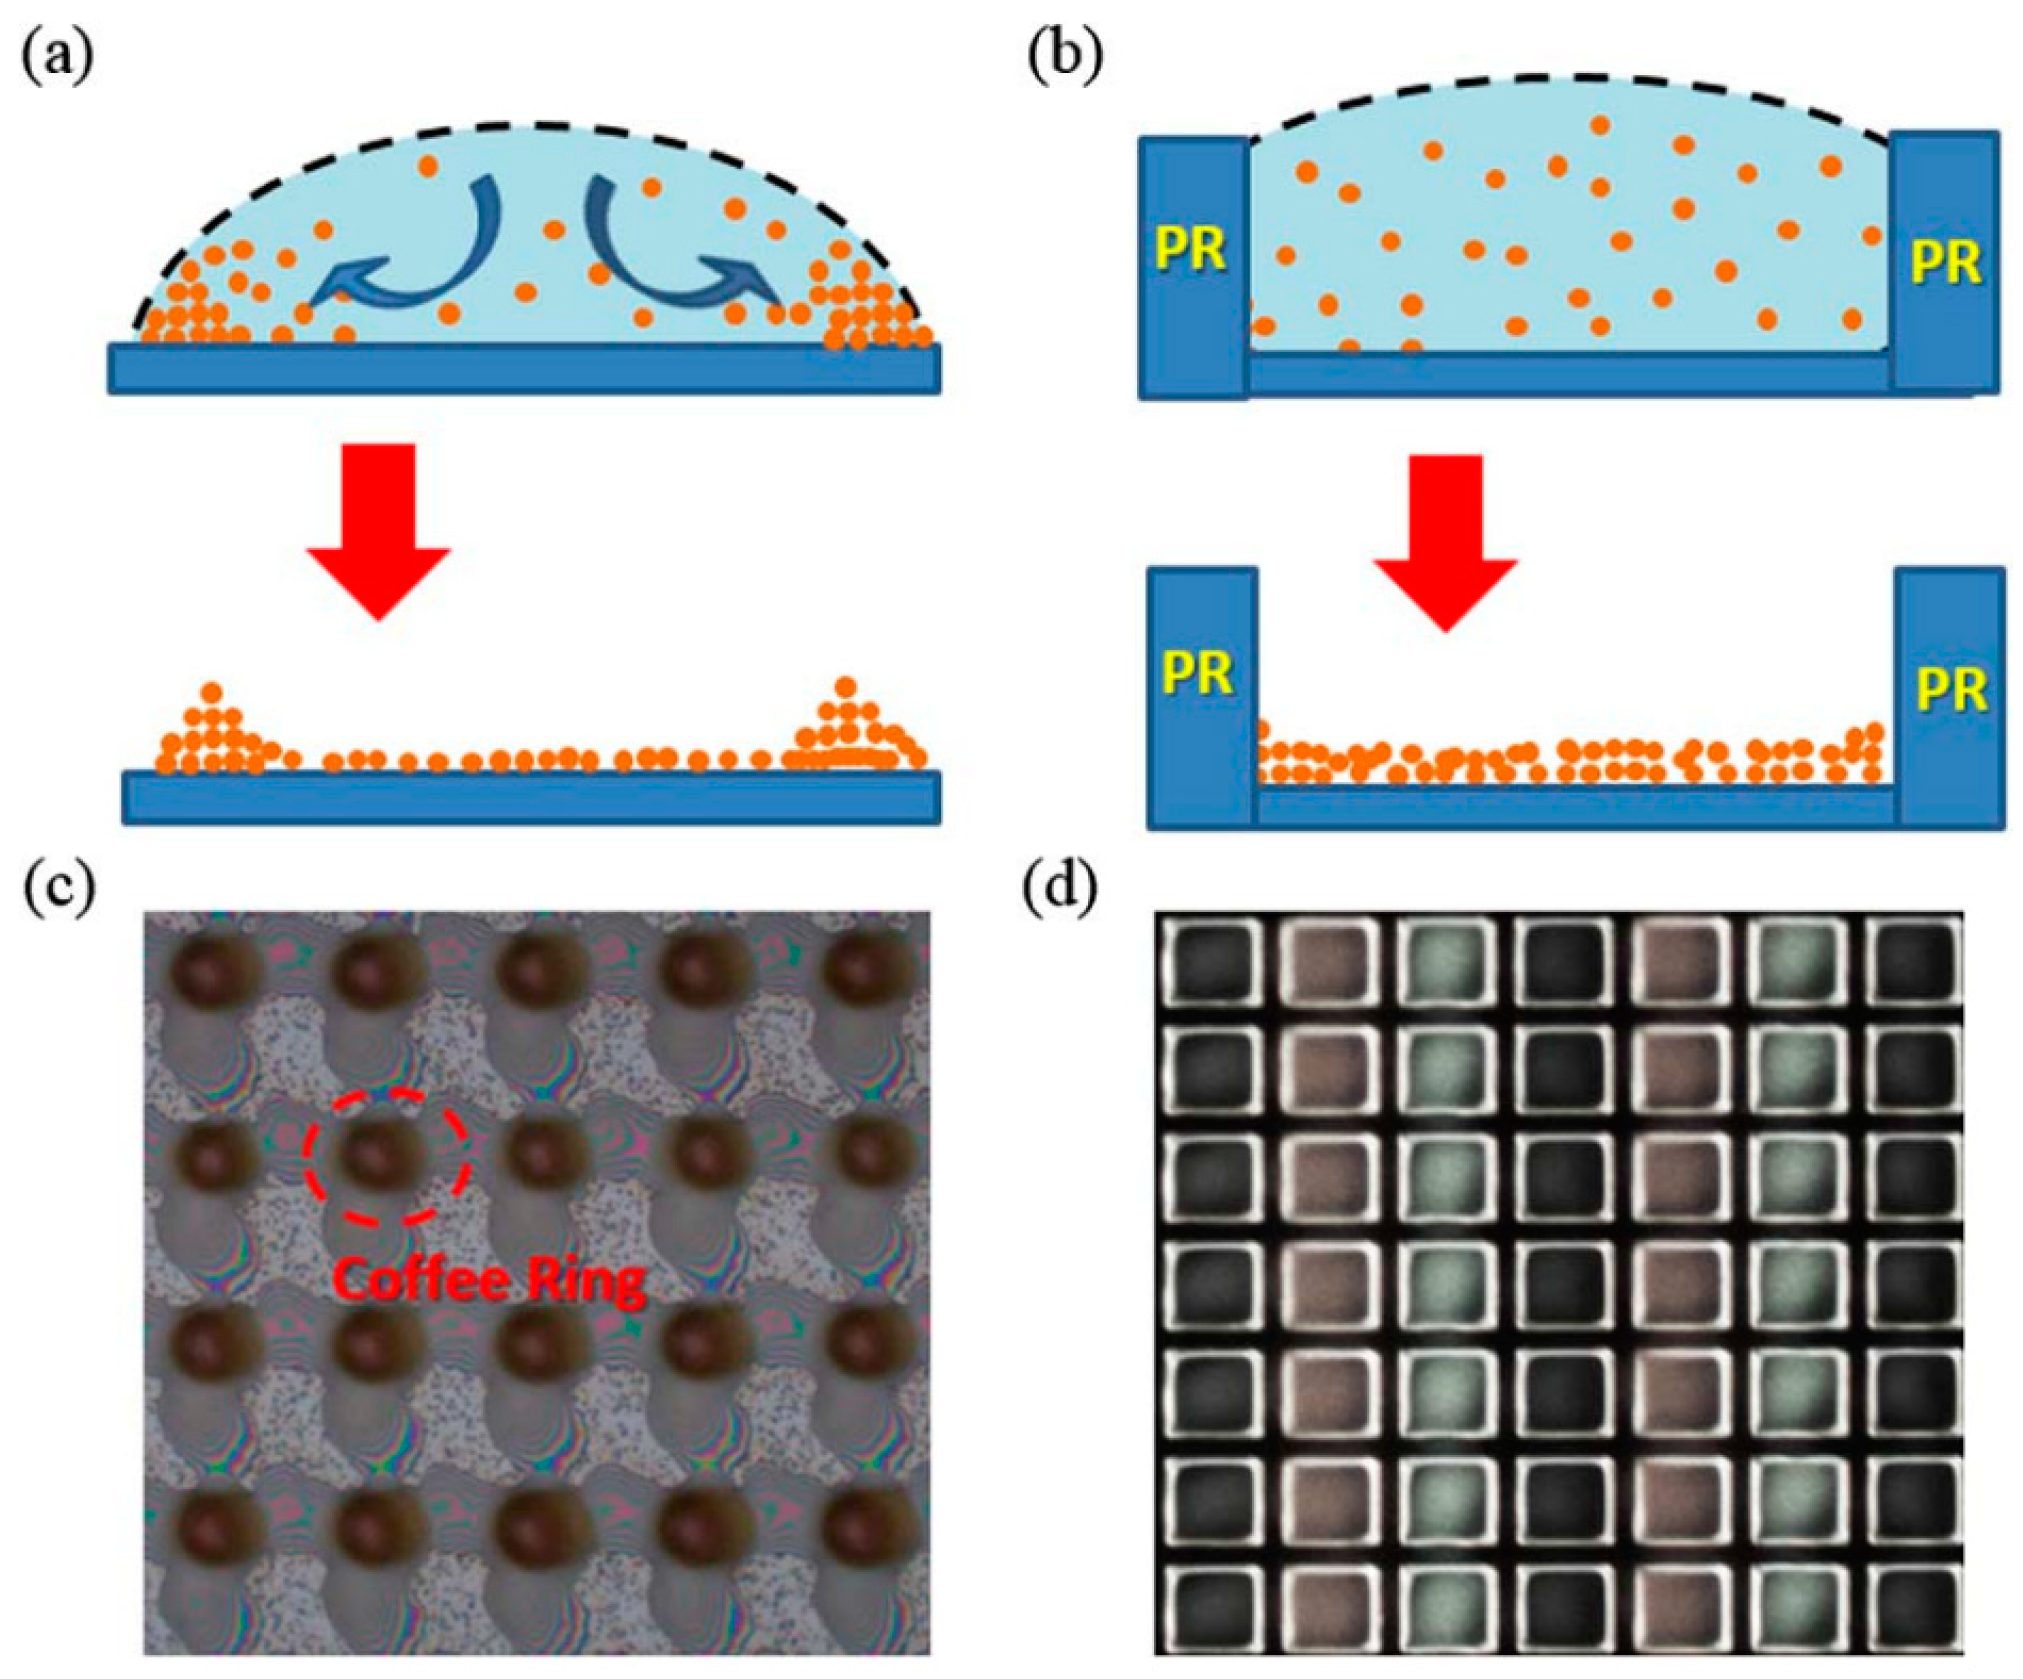
Moreover, the coffee ring effect Figure 17a [49] that the suspended particles are driven to the edge and deposited in a ring-like pattern can also be resolved by the PR mold. Figure 17c demonstrates the image of the coffee ring effect when QD drops directly deposited on a GaN substrate without the PR mold. The principle and the image of the PR mold to eliminate the coffee ring effect are shown in Figure 17b,d, respectively. With the help of the PR mold, the thickness of the liquid within a cell would be equalized, which leads to a similar speed at which the liquid will evaporate, preventing the QD particles from being driven to the perimeter or middle site by the solution.
The UV micro-LED array emits the 395 nm light which can excite the RGB QDs deposited on the PR mold. However, due to the thin thickness of the QD layer, the UV photons from the underneath LED cannot be absorbed completely [50]. Therefore, in order to increase the UV light utilization, and avoid bio-logical damage, a DBR structure has been designed for the micro-display. As shown in Figure 18a, the DBR provides 90% of reflectance at 395 nm and high transmission (around 90%) at RGB bands. as shown in Figure 18b, a pronounced UV peak (at 395 nm) is an indicator of less-efficient pumping, while the RGB signals are weak without the DBR. After the DBR is added, the strong reflection at UV band successfully suppressed the 395 nm peak and increase the visible intensities by 194% (blue), 173% (green) and 183% (red).
In addition to exciting QDs for full-color display via UV micro-LEDs, Chen G.S. et al. fabricated monolithic RGB micro-LEDs, using GaN-based 451 nm blue micro-LEDs to individually excite red and green QDs [50]. A black matrix photoresist with light-blocking capability is spun onto the micro-LEDs to improve the pixel CR and color purity by suppressing the crosstalk among the RGB light. A hybrid Bragg reflector (HBR) is deposited on the bottom side of the substrate to reflect the RGB light and the light output intensity, while a DBR with high reflection for the blue light is deposited on the top side of the QDs to further improve the color purity of the red and green light. Finally, the output intensities of red and green lights of the micro LEDs with HBR and DBR can be enhanced by about 27%.
These researches above achieve remarkable performance in full-color displays based on photoluminescence performance of QDs. Moreover, fast development and great enhancement in electroluminescence performance have been obtained for red, green and blue QD-LED whose external quantum efficiencies reach up to 20.5%, 23.68% and 19.8%, respectively [51,52,53]. In these applications, QDs are inserted between the p- and n-type of semiconductor layers, functioning as the active region, which excited by electrons and holes instead of photons. Therefore, QD-LEDs have become one of the most interesting research hotspots in high-end display fields [54]. However, some problems in the QD technology still require in-depth research currently, such as high cost, toxicity of certain types, high requirements for the heat dissipation as well as the encapsulation to ensure the stability.

3.3. Optical Lens Synthesis Full-Color Display

Optical lens synthesis refers to a method of synthesizing full-color display from RGB micro-LEDs using a trichroic prism. Liu et al. did a lot of comprehensive studies on fabricating a novel backlight-unit (BLU)-free full-color micro-LED based projector via this method [55,56]. After flip-chip bonding of the micro-LED arrays onto the AM panels, the RGB LED on silicon (LEDoS) chips are die-attached and wire-bonded onto individual packaging boards, which are connected to a control board. Then the packaging boards are mounted to a trichroic prism to form a full-color projection source, as shown in Figure 19a,b. Finally, the result of the 3-LEDoS projector prototype is illustrated in Figure 19c,d. Via the exiting projector lens, a 15-inch HKUST full-color logo is projected on a wall 2 m away.

4. Conclusions

This paper reviews the developments in mini-LEDs and micro-LEDs, while mainly focusing on the colorization method of the micro-LED displays. In general, micro-LEDs have the potential to improve the properties of miniature display systems such as LCDs and OLEDs displays, but the imperative mass production technology for micro-LEDs has still not yet been fully developed. A Mini-LED backlight significantly improves the performance of present LED backlight and the cost of the mini-LED is relatively easy to control. Due to the above advantages, the mini-LED runs ahead on the road towards commercialization, compared with micro-LEDs. For the latter, micro-LED, there are two major challenges before insertion in the market, the mass transfer printing, and the full-color solution, which, as introduced in this article, which have been under extensive research. It is reasonable to expect breakthroughs in these areas within a few years, as well as a bright future for micro-LED displays.

Author Contributions

Supervision, H.-C.K. and Z.C.; Writing-Original Draft Preparation, T.W. and S.L.; Project Administration, C.-W.S.; Writing-Review & Editing, Y.L. and C.-F.L.; Resources, Y.L., S.-W.H.C. and W.G.

Funding

This research was funded by the Strait Postdoctoral Foundation of Fujian Province, the National Natural Science Foundation of China (61504112, 11604285, and 51605404), the Science and Technology Project between University–Industry Cooperation in Fujian Province (2018H6022), the Technological Innovation Project of Economic and Information Commission of Fujian Province, and the Natural Science Foundation of Fujian Province (2018J01103).

Acknowledgments

The authors would like to thank Kei May Lau from HKUST and Zhaojun Liu from SUSTC for the technical support on micro-LED array.

Conflicts of Interest

The authors declare no conflict of interest.

References

  1. Robert, L.; Barbin, A.S.P. Cathode-ray tube displays. In Wiley Encyclopedia of Electrical and Electronics Engineering; Wiley Online Library: Hoboken, NJ, USA, 1999. [Google Scholar]
  2. Weber, L.F. History of the plasma display panel. IEEE Trans. Plasma Sci. 2006, 34, 268–278. [Google Scholar] [CrossRef]
  3. Chang, N.; Choi, I.; Shim, H. DLS: Dynamic backlight luminance scaling of liquid crystal display. IEEE Trans. Very Large Scale Integr. (VLSI) Syst. 2004, 12, 837–846. [Google Scholar] [CrossRef]
  4. Boeuf, J.P. Plasma display panels: Physics, recent developments and key issues. J. Phys. D Appl. Phys. 2003, 36, R53–R79. [Google Scholar] [CrossRef]
  5. Schadt, M. Milestone in the History of Field-Effect Liquid Crystal Displays and Materials. Jpn. J. Appl. Phys. 2009, 48. [Google Scholar] [CrossRef]
  6. Peng, F.L.; Chen, H.W.; Gou, F.W.; Lee, Y.H.; Wand, M.; Li, M.C.; Lee, S.L.; Wu, S.T. Analytical equation for the motion picture response time of display devices. J. Appl. Phys. 2017, 121. [Google Scholar] [CrossRef]
  7. Li, C.-H.; Lu, S.-H.; Lin, S.-Y.; Hsieh, T.-Y.; Wang, K.-S.; Kuo, W.-H. Ultra-fast moving-picture response-time LCD for virtual reality application. In SID Symposium Digest of Technical Papers; Wiley Online Library: Hoboken, NJ, USA, 2018; Volume 49, pp. 678–680. [Google Scholar]
  8. Tang, C.W.; Vanslyke, S.A. Organic electroluminescent diodes. Appl. Phys. Lett. 1987, 51, 913–915. [Google Scholar] [CrossRef]
  9. Geffroy, B.; Le Roy, P.; Prat, C. Organic light-emitting diode (OLED) technology: Materials, devices and display technologies. Polym. Int. 2006, 55, 572–582. [Google Scholar] [CrossRef]
  10. Chen, H.W.; Tan, G.J.; Wu, S.T. Ambient contrast ratio of LCDs and OLED displays. Opt. Express 2017, 25, 33643–33656. [Google Scholar] [CrossRef]
  11. Chen, H.-W.; Lee, J.-H.; Lin, B.-Y.; Chen, S.; Wu, S.-T. Liquid crystal display and organic light-emitting diode display: Present status and future perspectives. Light Sci. Appl. 2018, 7, 17168. [Google Scholar] [CrossRef]
  12. Lv, X.; Loo, K.H.; Lai, Y.M.; Tse, C.K. Energy-saving driver design for full-color large-area LED display panel systems. IEEE Trans. Ind. Electron. 2014, 61, 4665–4673. [Google Scholar] [CrossRef]
  13. Templier, F. GaN-based emissive microdisplays: A very promising technology for compact, ultra-high brightness display systems. J. Soc. Inf. Display 2016, 24, 669–675. [Google Scholar] [CrossRef]
  14. Micro-LED Market by Application, Display Panel Size, Vertical, and Geography-Global Forecast to 2025. Available online: https://www.researchandmarkets.com/reports/4535720/micro-led-market-by-application-display#pos-0 (accessed on 30 July 2018).
  15. MicroLED Displays Could Disrupt LCD and OLED. Available online: http://www.yole.fr/MicroLEDDisplays_Market.aspx#.W1lAV_knaEs (accessed on 30 July 2018).
  16. Seetzen, H.; Heidrich, W.; Stuerzlinger, W.; Ward, G.; Whitehead, L.; Trentacoste, M.; Ghosh, A.; Vorozcovs, A. High dynamic range display systems. In ACM Transactions on Graphics (TOG); ACM: New York, NY, USA, 2004; Volume 23, pp. 760–768. [Google Scholar]
  17. Daly, S.; Kunkel, T.; Sun, X.; Farrell, S.; Crum, P. Viewer preferences for shadow, diffuse, specular, and emissive luminance limits of high dynamic range displays. In SID Symposium Digest of Technical Papers; Wiley Online Library: Hoboken, NJ, USA, 2013; Volume 44, pp. 563–566. [Google Scholar]
  18. Tan, G.J.; Huang, Y.G.; Li, M.C.; Lee, S.L.; Wu, S.T. High dynamic range liquid crystal displays with a mini-LED backlight. Opt. Express 2018, 26, 16572–16584. [Google Scholar] [CrossRef] [PubMed]
  19. Deng, Z.; Zheng, B.; Zheng, J.; Wu, L.; Yang, W.; Lin, Z.; Shen, P.; Li, J. High dynamic range incell LCD with excellent performance. In SID Symposium Digest of Technical Papers; Wiley Online Library: Hoboken, NJ, USA, 2018; Volume 49, pp. 996–998. [Google Scholar]
  20. AUO’s Full Series of Mini LED Backlit LCDs Make Stunning Appearance to Establish Foothold in High-End Application Market. Available online: https://www.auo.com/en-global/New_Archive/detail/News_Archive_Technology_180522 (accessed on 30 July 2018).
  21. [Display Week 2018 Show Report]-Mini LED Backlight Business Opportunities Boost. Available online: https://www.ledinside.com/showreport/2018/5/display_week_2018_show_report_mini_led_backlight_business_opportunities_boost (accessed on 30 July 2018).
  22. Jin, S.X.; Li, J.; Li, J.Z.; Lin, J.Y.; Jiang, H.X. GaN microdisk light emitting diodes. Appl. Phys. Lett. 2000, 76, 631–633. [Google Scholar] [CrossRef]
  23. Jin, S.X.; Li, J.; Lin, J.Y.; Jiang, H.X. InGaN/GaN quantum well interconnected microdisk light emitting diodes. Appl. Phys. Lett. 2000, 77, 3236–3238. [Google Scholar] [CrossRef]
  24. Jiang, H.X.; Jin, S.X.; Li, J.; Shakya, J.; Lin, J.Y. III-nitride blue microdisplays. Appl. Phys. Lett. 2001, 78, 1303–1305. [Google Scholar] [CrossRef]
  25. Wu, T.; Lin, Y.; Zhu, H.; Guo, Z.; Zheng, L.; Lu, Y.; Shih, T.; Chen, Z. Multi-function indoor light sources based on light-emitting diodes-a solution for healthy lighting. Opt. Express 2016, 24, 24401–24412. [Google Scholar] [CrossRef] [PubMed]
  26. Wu, T.; Lu, Y.; Guo, Z.; Zheng, L.; Zhu, H.; Xiao, Y.; Shih, T.; Lin, Y.; Chen, Z. Improvements of mesopic luminance for light-emitting-diode-based outdoor light sources via tuning scotopic/photopic ratios. Opt. Express 2017, 25, 4887–4897. [Google Scholar] [CrossRef] [PubMed]
  27. Wu, T.; Lin, Y.; Zheng, L.; Guo, Z.; Xu, J.; Liang, S.; Liu, Z.; Lu, Y.; Shih, T.; Chen, Z. Analyses of multi-color plant-growth light sources in achieving maximum photosynthesis efficiencies with enhanced color qualities. Opt. Express 2018, 26, 4135–4147. [Google Scholar] [CrossRef] [PubMed]
  28. Wang, L.; Wang, X.; Kohsei, T.; Yoshimura, K.-I.; Izumi, M.; Hirosaki, N.; Xie, R.-J. Highly efficient narrow-band green and red phosphors enabling wider color-gamut LED backlight for more brilliant displays. Opt. Express 2015, 23, 28707–28717. [Google Scholar] [CrossRef] [PubMed]
  29. Jiang, H.X.; Lin, J.Y. Nitride micro-LEDs and beyond—A decade progress review. Opt. Express 2013, 21, A475–A484. [Google Scholar] [CrossRef] [PubMed]
  30. Tian, P.; McKendry, J.J.D.; Gu, E.; Chen, Z.; Sun, Y.; Zhang, G.; Dawson, M.D.; Liu, R. Fabrication, characterization and applications of flexible vertical InGaN micro-light emitting diode arrays. Opt. Express 2016, 24, 699–707. [Google Scholar] [CrossRef] [PubMed]
  31. Zhang, K.; Peng, D.; Lau, K.M.; Liu, Z. Fully-integrated active matrix programmable UV and blue micro-LED display system-on-panel (SoP). J. Soc. Inf. Display 2017, 25, 240–248. [Google Scholar] [CrossRef]
  32. Zhang, L.; Ou, F.; Chong, W.C.; Chen, Y.J.; Li, Q.M. Wafer-scale monolithic hybrid integration of Si-based IC and III-V epi-layersA mass manufacturable approach for active matrix micro-LED micro-displays. J. Soc. Inf. Display 2018, 26, 137–145. [Google Scholar] [CrossRef]
  33. Cok, R.S.; Meitl, M.; Rotzoll, R.; Melnik, G.; Fecioru, A.; Trindade, A.J.; Raymond, B.; Bonafede, S.; Gomez, D.; Moore, T.; et al. Inorganic light-emitting diode displays using micro-transfer printing. J. Soc. Inf. Display 2017, 25, 589–609. [Google Scholar] [CrossRef]
  34. Corbett, B.; Loi, R.; Zhou, W.D.; Liu, D.; Ma, Z.Q. Transfer print techniques for heterogeneous integration of photonic components. Prog. Quantum Electron. 2017, 52, 1–17. [Google Scholar] [CrossRef]
  35. Chanyawadee, S.; Lagoudakis, P.G.; Harley, R.T.; Charlton, M.D.B.; Talapin, D.V.; Huang, H.W.; Lin, C.H. Increased color-conversion efficiency in hybrid light-emitting diodes utilizing non-radiative energy transfer. Adv. Mater. 2010, 22, 602–606. [Google Scholar] [CrossRef] [PubMed]
  36. Zhuang, Z.; Guo, X.; Liu, B.; Hu, F.; Li, Y.; Tao, T.; Dai, J.; Zhi, T.; Xie, Z.; Chen, P.; et al. High color rendering index hybrid III-nitride/nanocrystals white light-emitting diodes. Adv. Funct. Mater. 2016, 26, 36–43. [Google Scholar] [CrossRef]
  37. Kang, C.-M.; Lee, J.-Y.; Park, M.-D.; Mun, S.-H.; Choi, S.-Y.; Kim, K.; Kim, S.; Shim, J.-P.; Lee, D.-S. Hybrid integration of RGB inorganic LEDs using adhesive bonding and selective area growth. In SID Symposium Digest of Technical Papers; Wiley Online Library: Hoboken, NJ, USA, 2018; Volume 49, pp. 604–606. [Google Scholar]
  38. Peng, D.; Zhang, K.; Chao, V.S.D.; Mo, W.J.; Lau, K.M.; Liu, Z.J. Full-color pixelated-addressable light emitting diode on transparent substrate (LEDoTS) micro-displays by CoB. J. Disp. Technol. 2016, 12, 742–746. [Google Scholar] [CrossRef]
  39. Even, A.; Laval, G.; Ledoux, O.; Ferret, P.; Sotta, D.; Guiot, E.; Levy, F.; Robin, I.C.; Dussaigne, A. Enhanced In incorporation in full InGaN heterostructure grown on relaxed InGaN pseudo-substrate. Appl. Phys. Lett. 2017, 110, 5. [Google Scholar] [CrossRef]
  40. Even, A. In Incorporation Improvement in InGaN Based Active Region Using InGaN Pseudo Substrate for Monolithic White LED Application. Ph.D. Thesis, Université Grenoble Alpes, Glenball, France, 2018. [Google Scholar]
  41. Liu, Z.J.; Wong, K.M.; Chong, W.C.; Lau, K.M. Active matrix programmable monolithic light emitting diodes on silicon (LEDoS) displays. In SID Symposium Digest of Technical Papers; Wiley Online Library: Hoboken, NJ, USA, 2011; Volume 42, pp. 1215–1218. [Google Scholar]
  42. Chen, D.C.; Liu, Z.G.; Deng, Z.H.; Wang, C.; Cao, Y.G.; Liu, Q.L. Optimization of light efficacy and angular color uniformity by hybrid phosphor particle size for white light-emitting diode. Rare Met. 2014, 33, 348–352. [Google Scholar] [CrossRef]
  43. Pust, P.; Weiler, V.; Hecht, C.; Tucks, A.; Wochnik, A.S.; Henss, A.K.; Wiechert, D.; Scheu, C.; Schmidt, P.J.; Schnick, W. Narrow-band red-emitting Sr LiAl3N4:Eu2+ as a next-generation LED-phosphor material. Nat. Mater. 2014, 13, 891–896. [Google Scholar] [CrossRef] [PubMed]
  44. Mattoussi, H.; Mauro, J.M.; Goldman, E.R.; Anderson, G.P.; Sundar, V.C.; Mikulec, F.V.; Bawendi, M.G. Self-assembly of CdSe-ZnS quantum dot bioconjugates using an engineered recombinant protein. J. Am. Chem. Soc. 2000, 122, 12142–12150. [Google Scholar] [CrossRef]
  45. Shirasaki, Y.; Supran, G.J.; Bawendi, M.G.; Bulovic, V. Emergence of colloidal quantum-dot light-emitting technologies. Nat. Photonics 2013, 7, 13–23. [Google Scholar] [CrossRef]
  46. Medintz, I.L.; Uyeda, H.T.; Goldman, E.R.; Mattoussi, H. Quantum dot bioconjugates for imaging, labelling and sensing. Nat. Mater. 2005, 4, 435–446. [Google Scholar] [CrossRef] [PubMed]
  47. Han, H.V.; Lin, H.Y.; Lin, C.C.; Chong, W.C.; Li, J.R.; Chen, K.J.; Yu, P.C.; Chen, T.M.; Chen, H.M.; Lau, K.M.; et al. Resonant-enhanced full-color emission of quantum-dot-based micro LED display technology. Opt. Express 2015, 23, 32504–32515. [Google Scholar] [CrossRef] [PubMed]
  48. Lin, H.Y.; Sher, C.W.; Hsieh, D.H.; Chen, X.Y.; Chen, H.M.P.; Chen, T.M.; Lau, K.M.; Chen, C.H.; Lin, C.C.; Kuo, H.C. Optical cross-talk reduction in a quantum-dot-based full-color micro-light-emitting-diode display by a lithographic-fabricated photoresist mold. Photonics Res. 2017, 5, 411–416. [Google Scholar] [CrossRef]
  49. Jiang, C.B.; Zhong, Z.M.; Liu, B.Q.; He, Z.W.; Zou, J.H.; Wang, L.; Wang, J.; Peng, J.B.; Cao, Y. Coffee-ring-free quantum dot thin film using inkjet printing from a mixed-solvent system on modified ZnO transport layer for light-emitting devices. ACS Appl. Mater. Int. 2016, 8, 26162–26168. [Google Scholar] [CrossRef] [PubMed]
  50. Chen, G.S.; Wei, B.Y.; Lee, C.T.; Lee, H.Y. Monolithic red/green/blue micro-LEDs with HBR and DBR structures. IEEE Photonics Technol. Lett. 2018, 30, 262–265. [Google Scholar] [CrossRef]
  51. Dai, X.L.; Zhang, Z.X.; Jin, Y.Z.; Niu, Y.; Cao, H.J.; Liang, X.Y.; Chen, L.W.; Wang, J.P.; Peng, X.G. Solution-processed, high-performance light-emitting diodes based on quantum dots. Nature 2014, 515, 96–99. [Google Scholar] [CrossRef] [PubMed]
  52. Zhang, H.; Sun, X.W.; Chen, S.M. Over 100 cd A−1 efficient quantum dot light-emitting diodes with inverted tandem structure. Adv. Funct. Mater. 2017, 27. [Google Scholar] [CrossRef]
  53. Wang, L.S.; Lin, J.; Hu, Y.S.; Guo, X.Y.; Lv, Y.; Tang, Z.B.; Zhao, J.L.; Fan, Y.; Zhang, N.; Wang, Y.J.; et al. Blue quantum dot light-emitting diodes with high electroluminescent efficiency. ACS Appl. Mater. Int. 2017, 9, 38755–38760. [Google Scholar] [CrossRef] [PubMed]
  54. Lee, K.H.; Han, C.Y.; Jang, E.P.; Jo, J.H.; Hong, S.; Hwang, J.Y.; Choi, E.; Hwang, J.H.; Yang, H. Full-color capable light-emitting diodes based on solution-processed quantum dot layer stacking. Nanoscale 2018, 10, 6300–6305. [Google Scholar] [CrossRef] [PubMed]
  55. Liu, Z.J.; Chong, W.C.; Wong, K.M.; Tam, K.H.; Lau, K.M. A novel BLU-free full-color LED projector using LED on silicon micro-displays. IEEE Photonics Technol. Lett. 2013, 25, 2267–2270. [Google Scholar] [CrossRef]
  56. Chong, W.C.; Wong, K.M.; Liu, Z.J.; Lau, K.M. A novel full-color 3LED projection system using R-G-B light emitting diodes on silicon (LEDoS) micro-displays. In SID Symposium Digest of Technical Papers; Wiley Online Library: Hoboken, NJ, USA, 2013; Volume 44, pp. 838–841. [Google Scholar]
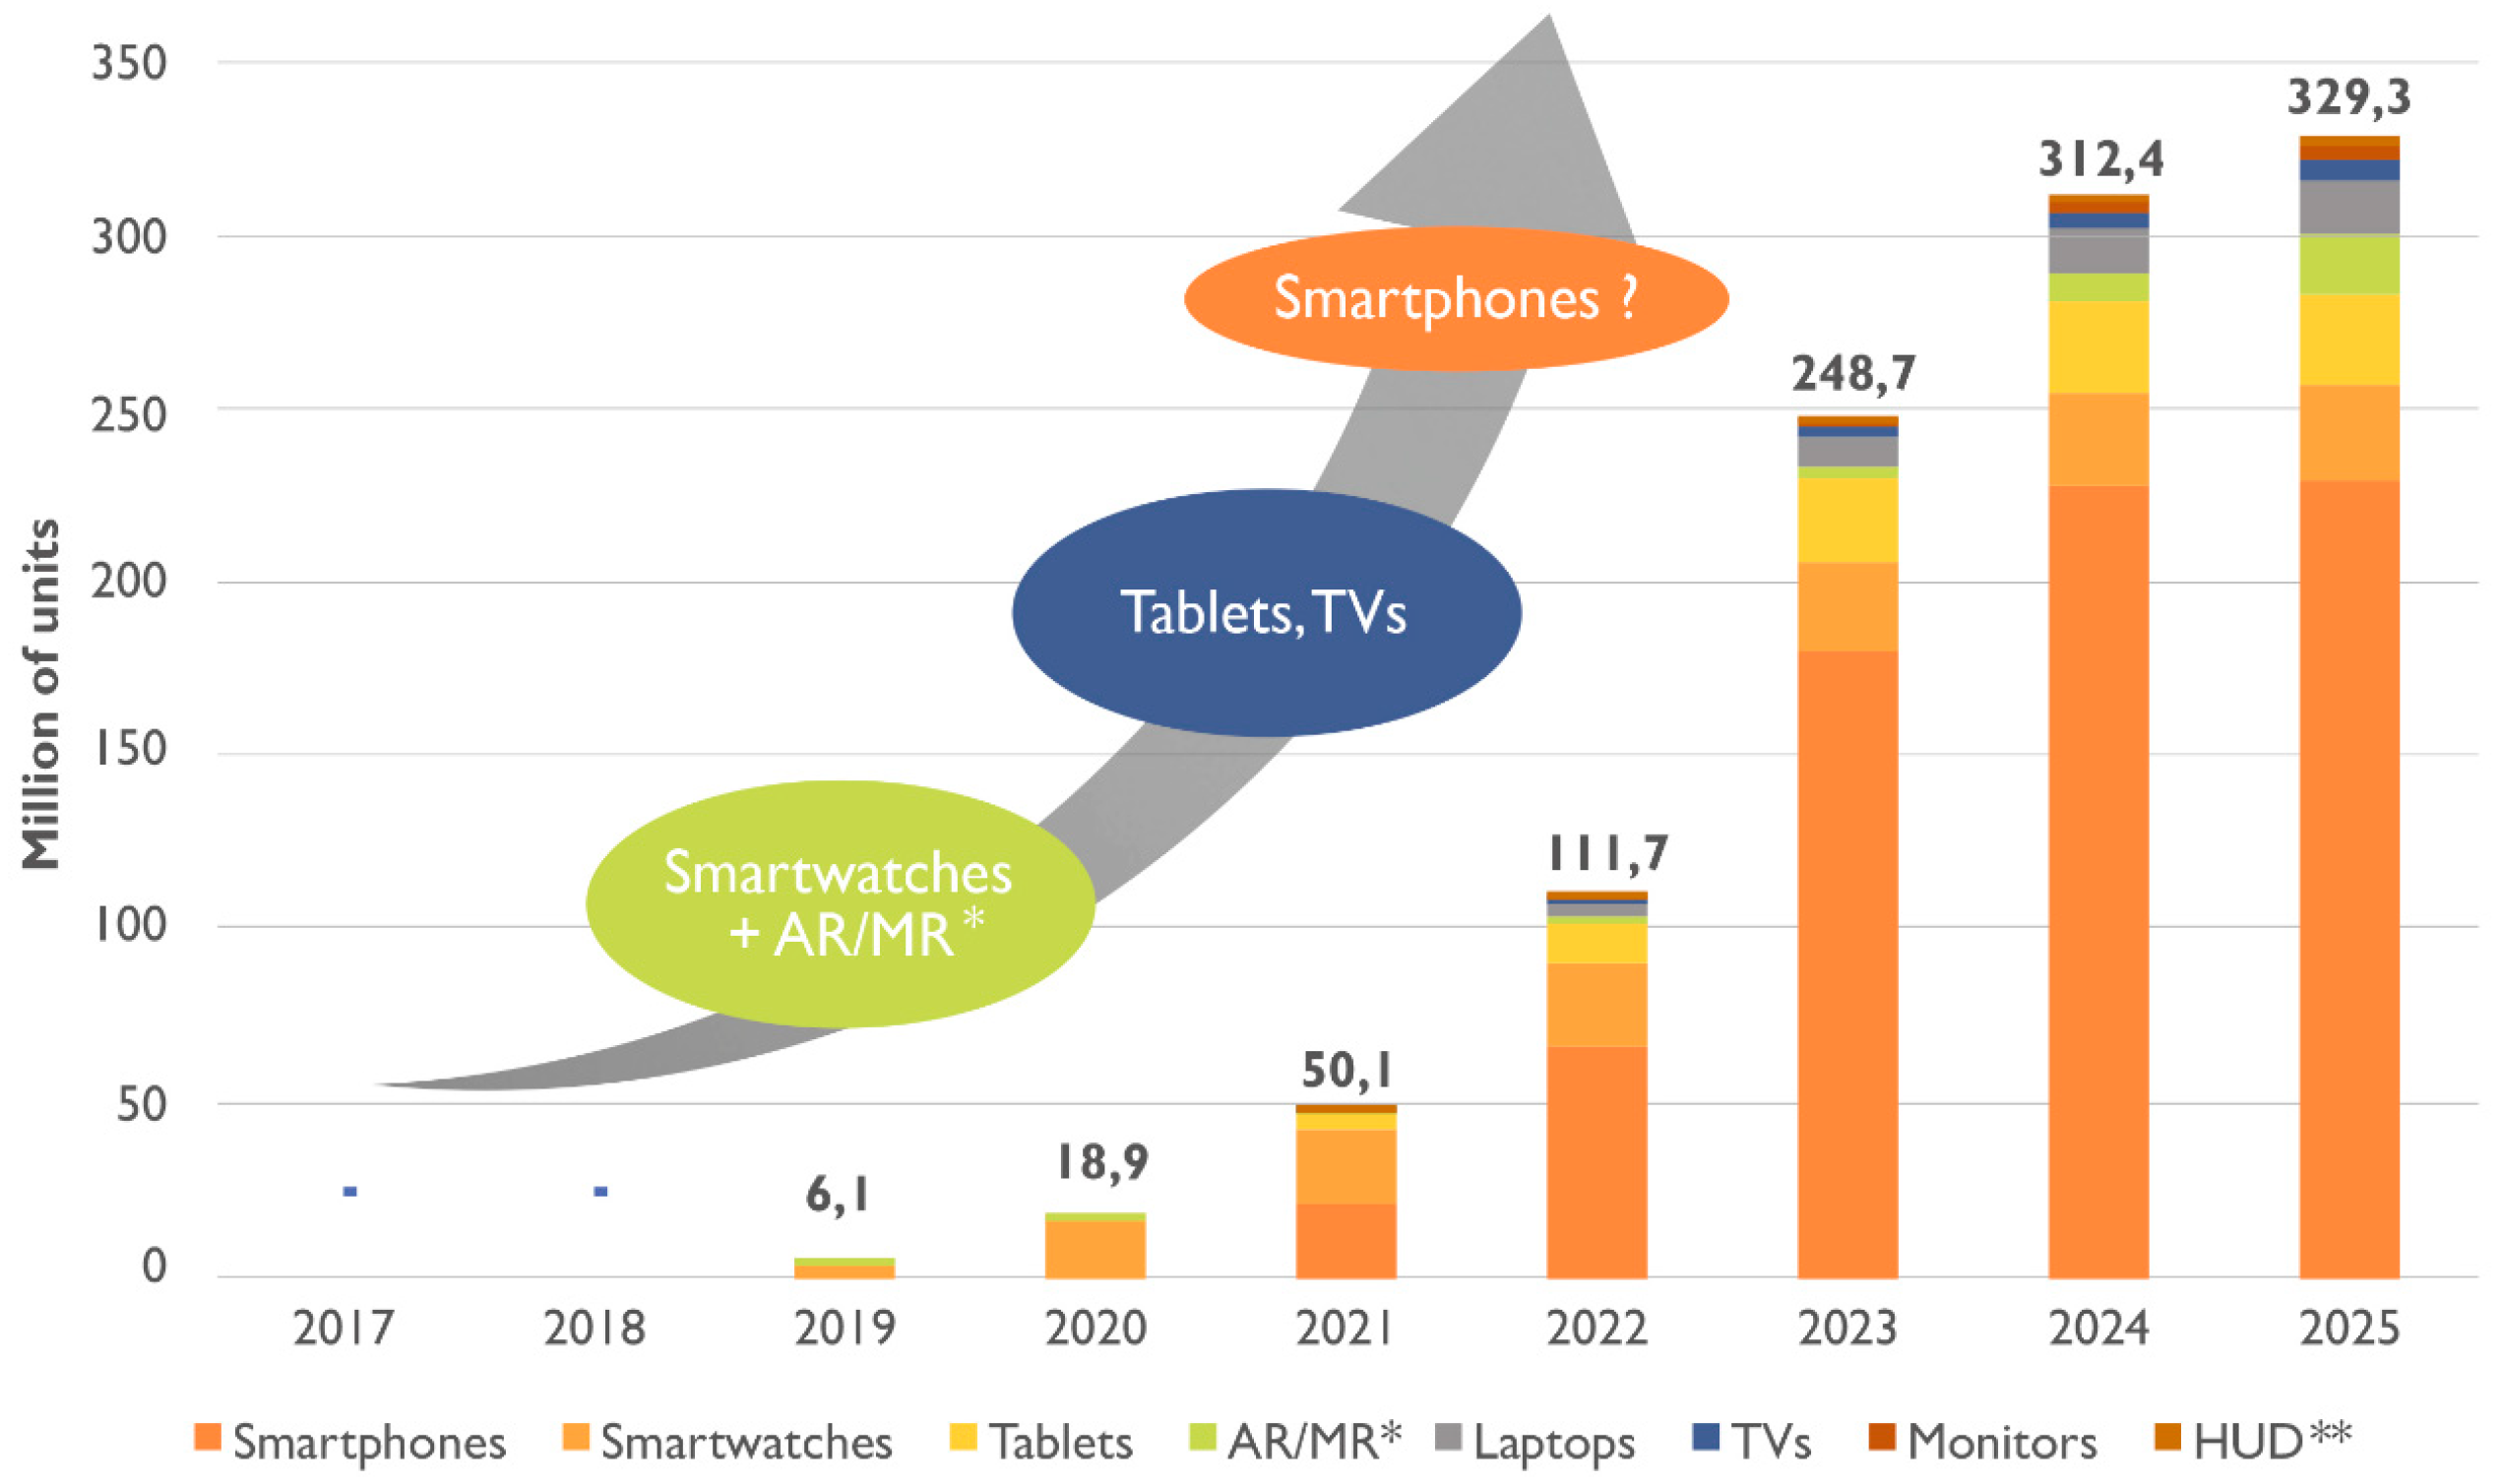
Figure 1. Forecast about the development of micro-LED displays.
Applsci 08 01557 g001
Figure 2. Schematic diagram of the model for the LCD with a mini-LED backlight [18]. Figure reproduced with permission from Optical Society of America.
Applsci 08 01557 g002
Figure 3. Displayed image simulation: (a) Mini-LED backlight modulation; (b) luminance distribution of the light incident on LC layer; and (c) displayed image after LCD modulation [18]. Figure reproduced with permission from Optical Society of America.
Applsci 08 01557 g003
Figure 4. Simulated LabPSNR for different HDR display systems with various local dimming zone numbers and LC contrast ratios [18]. Figure reproduced with permission from Optical Society of America.
Applsci 08 01557 g004
Figure 5. Conceptual diagram of scaling up display size based on same angular size [18]. Figure reproduced with permission from Optical Society of America.
Applsci 08 01557 g005
Figure 6. The 27” gaming monitor and the 2” VR display of AUO.
Applsci 08 01557 g006
Figure 7. (a) The 16.7 inch curved automotive display with direct backlight solution of JDI. (b) Ultra-High Contrast UHD Display of BOE.
Applsci 08 01557 g007
Figure 8. Mechanism of RGB micro-LED full-color display.
Applsci 08 01557 g008
Figure 9. Substituted scheme of the driving circuit for micro-LED display.
Applsci 08 01557 g009
Figure 10. (a) Schematic diagram of InGaNOS substrate, (b) photoluminescence spectra at room temperature of full InGaN structures grown on InGaNOS.
Applsci 08 01557 g010
Figure 11. Mechanism of color conversion full-color display.
Applsci 08 01557 g011
Figure 12. (a) One colorful pixel includes four sub-pixels in combination of RGGB and (b) a full-color display by excitation of RGB phosphors by UV LEDs [41]. Figure reproduced with permission from John Wiley and Sons.
Applsci 08 01557 g012
Figure 13. Absorption and emission spectra of (a) blue, (c) green and (e) red QDs as well as solution photos of (b) blue, (d) green and (f) red QDs [47]. Figure reproduced with permission from Optical Society of America.
Applsci 08 01557 g013
Figure 14. Process flow of the full-color micro-LED display. (a) The structure of the UV micro-LED array. (b) Aligning the PR mold to the micro-LED array. (ce) Consequently jetting the RGB QDs inside the PR mold window to form full-color pixels [48]. Figure reproduced with permission from Optical Society of America.
Applsci 08 01557 g014
Figure 15. The image and the schematic illustration of the AJ system [47,48]. Figure reproduced with permission from Optical Society of America.
Applsci 08 01557 g015
Figure 16. (a) Microscope image and (b) fluorescence microscopy image of the RGB QDs on the PR mold that is above micro-LEDs. (c) The cross-talk effect of the QD pixels without the PR mold [48]. Figure reproduced with permission from Optical Society of America.
Applsci 08 01557 g016
Figure 17. (a) Principle of the coffee ring effect. (b) Principle of reducing the coffee ring effect via the PR mold. (c) The coffee ring effect can be observed without the PR mold. (d)The PR mold confines the QD drops and resolve the coffee ring effect [48]. Figure reproduced with permission from Optical Society of America.
Applsci 08 01557 g017
Figure 18. (a) Measured reflectance spectrum of the DBR. (b) The emission spectra with and without the DBR structure [47]. Figure reproduced with permission from Optical Society of America.
Applsci 08 01557 g018
Figure 19. (a) The schematic of the optical architecture, (b) the 3-LEDoS projector prototype, (c) the HKUST logo from the lens of the projector (d) A 15-inch HKUST full-color logo is projected on a wall [56]. Figure reproduced with permission from John Wiley and Sons.
Applsci 08 01557 g019
Table 1. Comparison between mini-LED and micro-LED.
Mini-LEDMicro-LED
Size (μm)100~200<100
PurposeBacklight for LCDSelf-emitting display
FeaturesHigh dynamic range, power saving, thinHigh contrast, high efficiency, high resolution, high response time
Yield>80%Hard to estimate
ApplicationLCD backlight—From small to large LCD panelMicro-projection display, display from small to large size
Table 2. Requirements for mini-LED and micro-LED in typical applications.
ApplicationAuto DisplayTVDigital Display
Applsci 08 01557 i001 Applsci 08 01557 i002 Applsci 08 01557 i003
Panel Size (inch)6~1232~100150~220
PPI150~25040~8020~30
Chip volume (M)4.124.924.9
Chip Size (μm)50~10050~8080~100
ApplicationARWatchMobile
Applsci 08 01557 i004 Applsci 08 01557 i005 Applsci 08 01557 i006
Panel Size (inch)0.5~11~1.54~6
PPI450~2000200~300300~800
Chip volume (M)49.80.46.2
Chip Size (μm)1~510~3030~50
Table 3. Massively selective transfer printing methods.
CompanyPrincipleDescription
Electrostatic arrayLuxVue Applsci 08 01557 i007The transfer heads are divided by the dielectric layer to form a pair of silicon electrodes, which are positively and negatively charged, respectively, before picking up the target LED.
Magnetic arrayITRI Applsci 08 01557 i008Micro-LEDs are adsorbed and placed by the electromagnetic force generated by the coil.
Elastomer stampX-Celeprint Applsci 08 01557 i009The pick-up and transfer processes are aided by the Van der Waals forces between the viscoelastic elastomer stamp and the solid micro-LEDs.
Roll to plateKIMM Applsci 08 01557 i010A roll-based transfer technology for transferring nanoscale objects from a donor substrate to a target substrate with high yields and productivity.
Table 4. Parameters of the AJ system for RGB QDs [48]. Table reproduced with permission from Optical Society of America.
Color of QDWorking Distance (mm)Carrier Gas Flow Rate (sccm)Sheath Gas Flow Rate (sccm)Stage Speed (mm/s)
Red1831710
Green1721510
Blue1661110