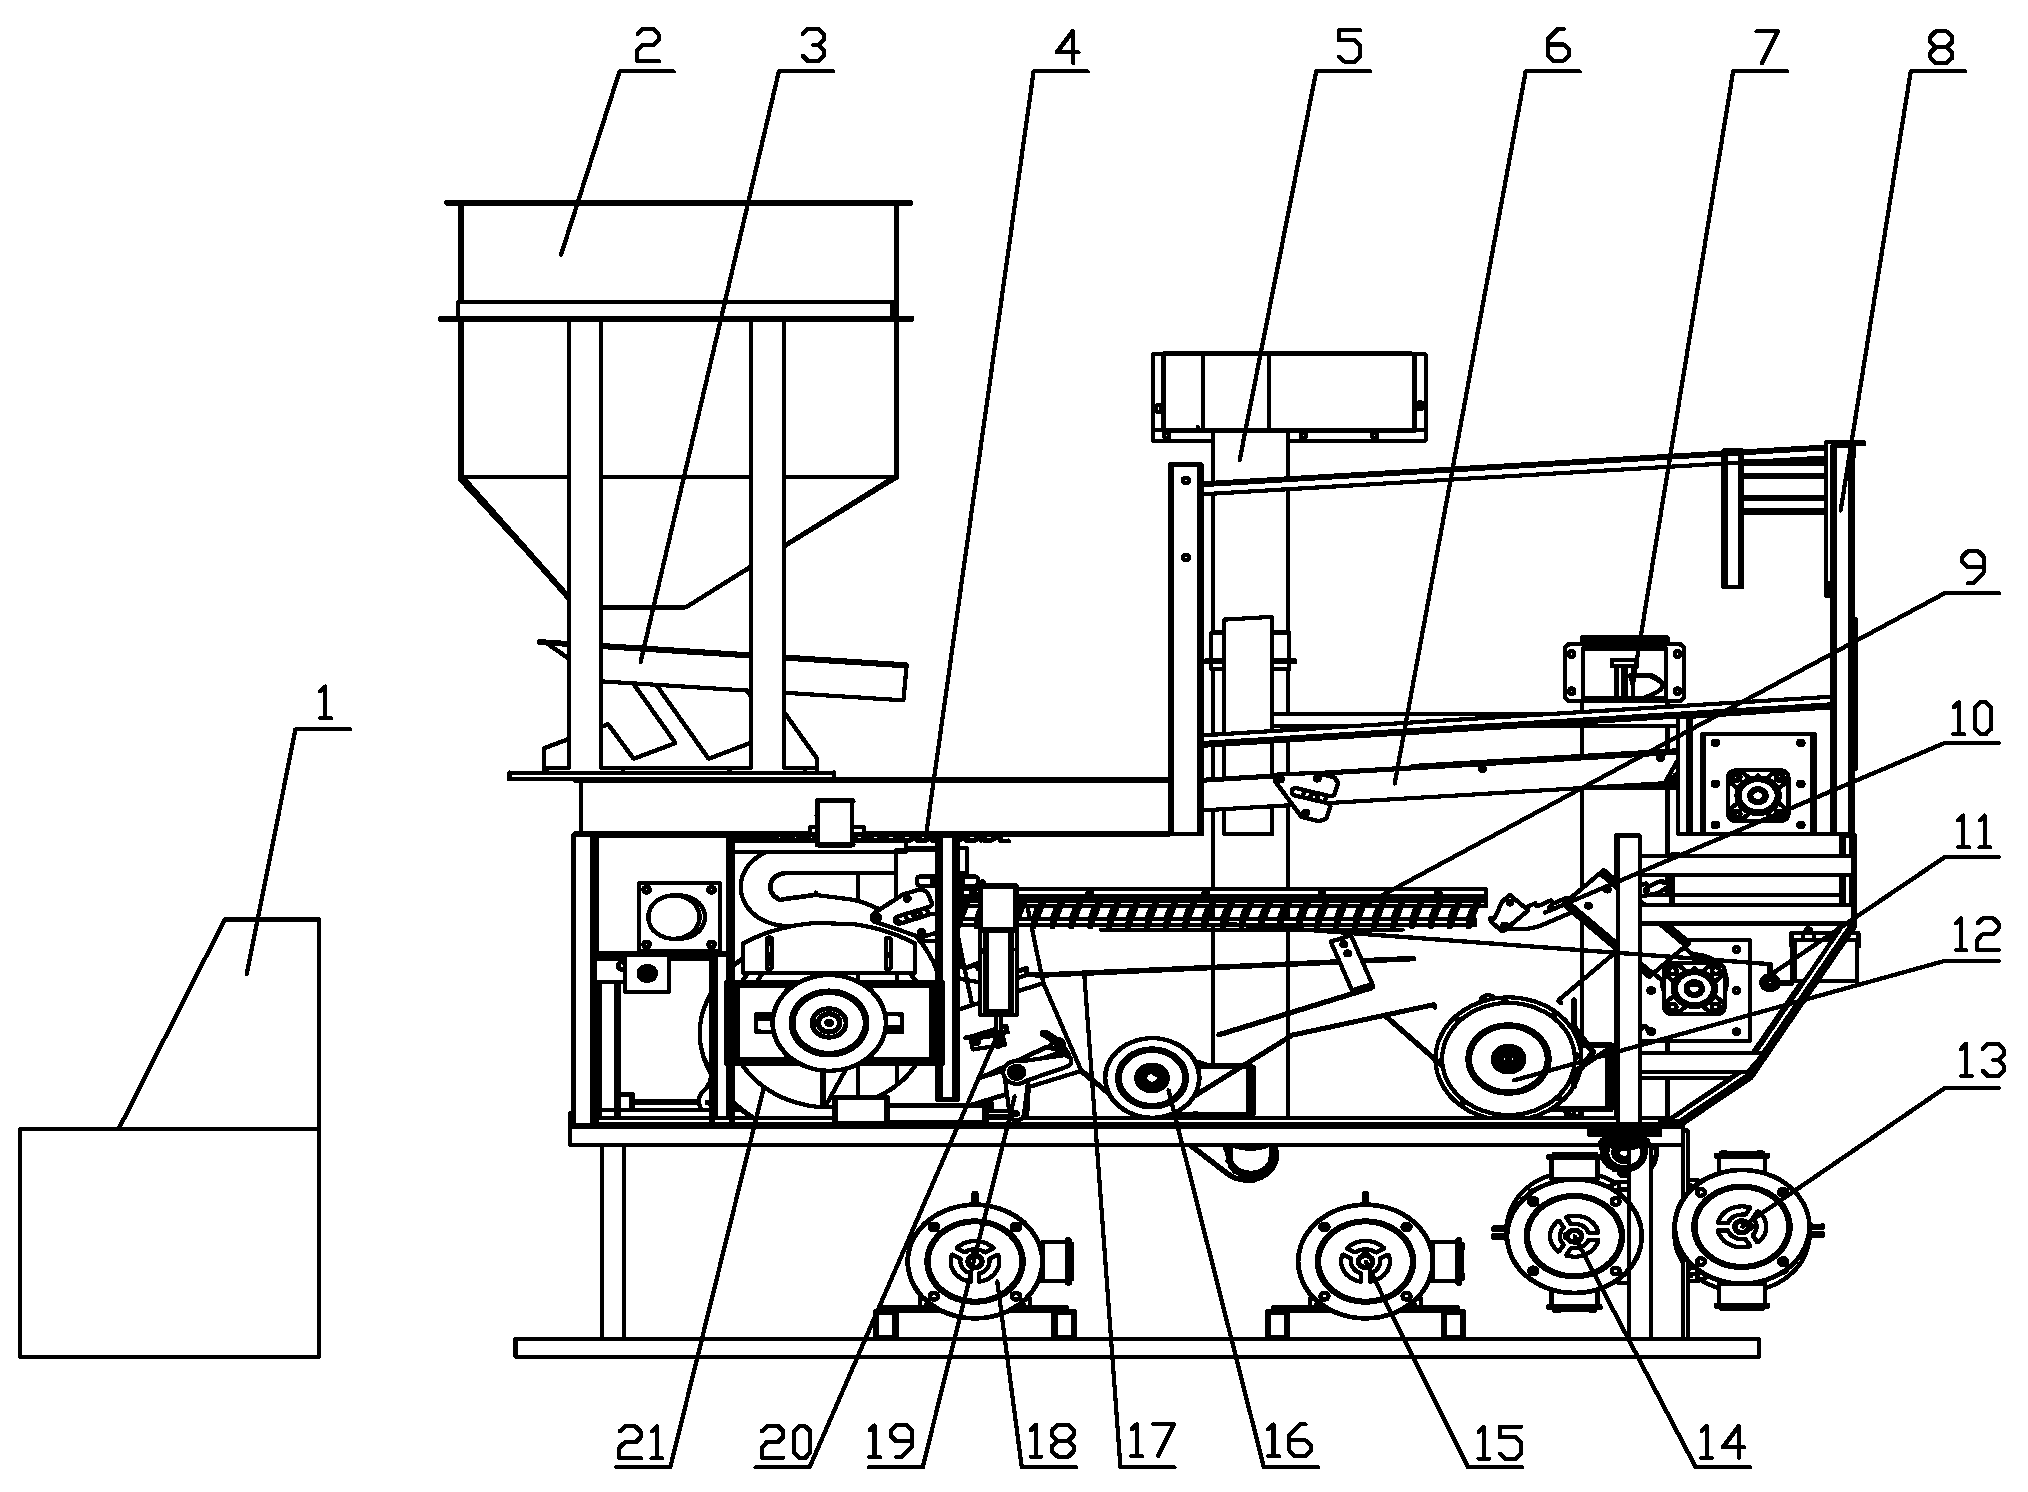
Article

Grain Sieve Loss Fuzzy Control System in Rice Combine Harvesters

Key Laboratory of Modern Agricultural Equipment and Technology, Ministry of Education, Jiangsu University, Zhenjiang 212013, China
*
Authors to whom correspondence should be addressed.
Appl. Sci. 2019, 9(1), 114; https://doi.org/10.3390/app9010114
Submission received: 20 October 2018 / Revised: 17 December 2018 / Accepted: 18 December 2018 / Published: 29 December 2018
(This article belongs to the Section Applied Biosciences and Bioengineering)

Abstract

:
The main working parts of the cleaning device of a rice combine harvester can be controlled by an established control strategy in real time based on the monitored grain sieve loss. This is an efficient way to improve their cleaning adaptability, since as a consequence, the main working parameters of combine harvesters can automatically adapt to crop and environment changes, and the corresponding cleaning performance can be improved. To achieve the target of cleaning control based on the monitored grain sieve loss, a fuzzy control system was developed, which selected S7-1200 PLC as the main control unit to build the lower computer hardware system, utilized ladder language to complete the system compilation, and used LabVIEW 14.0 software to design the host–computer interface. The effects of fan speed, guide plate angle, and sieve opening on the grain sieve loss and grain impurity ratio have been investigated through a large number of bench tests. The relevance level of the operating parameters on the performance parameters has been determined also, and finally, a fuzzy control model was developed for the cleaning system. The experiment results indicated that the designed fuzzy control model can control the cleaning section settings, such as fan speed and guide plate angle automatically, and reduce the grain sieve loss to some extent.

1. Introduction

The use of combine harvesters for harvesting rice fields is rapidly increasing year by year in China as the planting area and yield keep increasing [1]. As there are different rice varieties and harvesting times, the harvesting performance of the combine harvesters significantly fluctuates under different crop-harvesting conditions. The automation of the combine harvesters is one good way to guarantee the harvesting performance, and the flagship combine harvesters made by European companies have realized the functions of operation process fault diagnosis, forward speed control, adaptive threshing and cleaning, chassis lift control, and so on, significantly improving the overall operating efficiency and performance [2,3,4,5,6,7]. However, the relevant research on the state monitoring of the operation of combine harvesters is still in its infancy period in China. Most combine harvesters merely have engine revolution speed monitoring devices installed, parameter settings can only be adjusted when combine harvesters stop working based on the experience of the operator, and the cleaning performance varies dramatically. The cleaning device as one of the core parts of the machine and cleaning performance is another one of the major factors to weigh the performance of the whole machine. However, to date, automatic control systems for the cleaning units are not commercially available.
Scientists have carried out enormous relevant research on the cleaning processes of combine harvesters, and some investigations can be found investigating the effect of fan revolution speed, the area of the fan air inlet, sieve opening, and sieve vibration amplitude on the movement of grains and material other than grain (MOG) in the cleaning shoe, and several corresponding mathematical models have been developed [8,9,10,11]. Better insight into the characteristics of the cleaning process was obtained owing to the interpretation of these mathematical models. However, a complete mathematical model that is applicable to the cleaning process would need to include several equations that are difficult to obtain and would probably be very complex. On the other hand, on the basis of analyzing the existing experiment data, and comparing the merits and drawbacks of the existing control strategy, a common drawback of most standard modeling and control techniques is that they are always based on an accurate mathematical model, and cannot make effective use of the expert knowledge of experienced engineers and operators [12]. The fuzzy control methodology, which combines the advantages of the white-box and black-box approaches, is widely used in agriculture machinery control systems, and improves the performance greatly [13,14,15]. Therefore, utilizing sensor technology and fuzzy control theory to develop a control system that can monitor grain sieve loss and the main working parts of the cleaning system that can be controlled by the established control strategy in real time is an efficient way to improve their cleaning adaptability. On the basis of studying the grain sieve loss sensor [16,17], this paper mainly studies the correlation between grain sieve loss and the related working parameters (fan speed, guide plate angle, and sieve opening) to determine the main factors affecting cleaning performance; then, a cleaning process fuzzy control system was designed to maintain the cleaning system with a good cleaning performance.

2. Material and Methods

2.1. Overall Research Method

To achieve the cleaning process control based on the monitored grain sieve loss, the technical blueprint adopted in this paper is introduced as follows:
(1) First, we outline the working parameters, including on-line monitoring and automatic adjustment technology, and design relevant actuating devices to pave the way for the step-less of the working parameters to require less adjustment during cleaning.
(2) Experiment results have shown that the cleaning performance is affected by several working parameters, and the effect of each working parameter on cleaning performance varies significantly. Therefore, relationships among working parameters (sieve opening, fan speed, guide plate angle, etc.) and performance parameters (sieve losses, grain impurity rate) have to be investigated through a large set of bench tests, and it is important to determine the relevance of the parameter settings and performance results according to the obtained test results. The most important information should be extracted, then the candidate input variables need to be ranked as possible control variables.
(3) The control model is the key to the automation of the cleaning section. On the basis of analyzing the existing test data, and comparing the merits and drawbacks of the existing control algorithm, we establish a control strategy for cleaning control. At last, we verify the robustness and adaptability of the control model though a test bench experiment.

2.2. Working Principle of the Multi-Duct Cleaning System

A cleaning test bench is shown in Figure 1. Some working parameters of the test bench, such as sieve opening, vibration frequency, and fan revolution speed can be adjusted separately. In the working parameters’ adjustment process, a push rod is used to drive the relevant mechanism to fulfill the task of sieve opening and guide adjusting the plate angle. The fan speed and sieve vibration frequency can be controlled by adjusting the corresponding motors’ shaft revolution. In addition, the cleaning throughput can be adjusted within 0.5–4.0 kg·s−1 by controlling the vibration frequency of the electromagnetic vibration feeder. The test bench is also equipped with sensors to extract the airflow velocity, fan speed, and grain sieve loss. The working process of the multi-duct cleaning device is as follows: a return plate was added under the longitudinal axial flow threshing rotor to concentrate its threshed material and the tailings’ return to the start of the cleaning shoe, and evenly distribute them. The grain pan and sieve have the same vibration frequency and amplitude. However, they have an opposite vibration direction angle to reduce the overall vibration. Thus, all of the threshed outputs can enter into the sieve surface in a uniform way. Then, at the joint action of vibration and airflow from different fan outlets, the grain will penetrate the sieve promptly. The designed working parameter adjusting mechanism is shown in Figure 2 and Figure 3. The principle of the working parameter adjusting mechanism can be found in our patent (PCT/CN2015/074348). The adjustment range of the working parameters is shown in Table 1.

2.3. Hardware and Software System of the Test Bench

The hardware circuit of the control system mainly comprises the power circuit, working parameters’ knob-adjusting circuit, the displacement sensor signal-acquiring circuit, the motor revolution speed-controlling circuit and grain sieve loss, fan revolution speed, the return plate, and the sieve vibration frequency-acquisition circuit. The EPLAN 8.23 software (EPLAN, Mattis Nerheim, Germany) was used to design the corresponding circuit, integrate the above-mentioned circuits, and connect the electrical components according to the input/output (I/O) distribution to construct the hardware system. The software system is composed of the Human–Machine Interface (HMI) and the lower computer program. We selected the SIEMENS S7-1200 PLC, SM1231 AI8 analog input module, SM122 DQ16 digital output module, CM1241 RS485 communication module, frequency converter G120C (SIEMENS, Munich, Germany), and some transmitters to build the lower computer hardware system. Ladder language was utilized to complete the system compilation. The HMI was programmed by LabVIEW 14.0 software (National Instruments, Austin, TX, USA) to complete the information display and storage functions, and send instructions to the lower computer. Modbus-TCP communication protocol was utilized to fulfill the task of information exchange between the lower computer system and the HMI. The control strategy can be programmed in LabVIEW 14.0; once the control strategy is activated, the inherent algorithm selects the current grain sieve loss and current working parameters as input, and the target value of the ideal working parameters can be calculated out. Then, they were transferred into the lower computer system through communication protocol to finish process of adjusting the working parameters. The designed hardware structure of the operating monitoring and control system is shown in Figure 4.

2.4. Cleaning Performance Evaluation under Different Working Parameters

The sieve loss ratio and grain impurity ratio in the grain tank are two main factors that are used to judge the cleaning performance, and the higher those two values are, the worse the cleaning performance. Taking the fan speed, guide plate angle, and sieve opening as experimental factors, a cleaning experiment was carried out in the test bench (Figure 1) utilizing the threshed outputs from the thresh-separation test bench [18]. The total amount of threshed outputs was 60 kg, the feeding rate was 2.5 kg/s. An oil-skin was used to collect all the cleaning residual at the rear of the test bench; then, the full grains were filtered out from the MOG using the stationary re-cleaner (Agriculex ASC-3 Seed Cleaner, Guelph, Ontario, CA, Canada), weighed, and the grain sieve loss ratio was calculated. The grain impurity ratio can be calculated by sampling from the grain tank (0.2–6 kg with an accuracy of ± 1 g) according to the national standard in China (DG/T 014-2009). The grain sieve loss should be ≤1%, and the grain impurity ratio should be ≤2% (Chinese standards JB/T 5117-2006). A preliminary screening experiment was designed with D-optimal design criterion, which focuses on precise parameter estimation, and the experiment results indicated that the fan speed, guide plate II angle, and sieve opening are the main factors that affect the cleaning performance. In this paper, a response surface experiment was designed with I-optimal design criterion in JMP12.0 software (SAS, Cary, NC, USA) to learn the variation trends in the cleaning performance [19]. The basic characteristics of the rice used in the test are shown in Table 2.

2.5. Grain Loss Control Strategy and Performance Checking

Selecting the deviation of the monitored grain sieve loss and its deviation variation rate as input variables, a fuzzy model was developed to control the cleaning process. The grain sieve loss sampled frequency was 10 Hz. By analyzing the time series of the recorded grain sieve loss under different working conditions, the basic domain of grain sieve loss was obtained. The output variables were the controlled quantities obtained by applying fuzzy inference to the corresponding input variables. To check the control performance of the designed fuzzy cleaning controller, the fuzzy query tables for the working parameters were obtained separately according to the maximum membership principle. Then, the corresponding proportional coefficients were multiplied into the values in the fuzzy query tables to obtain the actual regulation. After converting the actual regulation into the ‘if–else’ control statements respectively, the experiment was carried out in the test bench to check the controller performance. Before the experiment, the threshed outputs container in the test bench was filled with 120-kg threshed outputs, and it was ensured that all of the threshed outputs could be fed into the cleaning system within 50 s, which took several trials. The control effect could be checked by comparing the monitored grain sieve loss variation. Airflow velocities at certain points inside the cleaning shoe were measured by self-heating hot-wire anemometry (VS110, Nanjing, Neng Zhao Technology Co., Ltd., Nanjing, China, with a scope of 0.5–50 m·s−1 and a resolution of 0.01 m·s−1) to reflect the changing of the cleaning working parameters. The cleaning experiment was carried out under the condition that the controller was not being activated first, and the initial working parameters of the cleaning system were defined as the combination that had the worst cleaning performance. Then, about 10 s later, when the cleaning system was filled with threshed materials and the anemometer monitoring value was stable, the controller was activated. The corresponding sieve loss number was continuously recorded, which was beneficial to analyze the control effect afterwards. At last, collecting all of the cleaning residue on the oil-skin, the grains were obtained by removing the MOG through using a re-cleaner (Agriculex ASC-3 Seed Cleaner, Guelph, ON, Canada), and the grain sieve loss ratio could be obtained immediately. The grain sieve loss ratio was compared through utilizing the controller and the grain sieve loss ratio at the initial working parameters. The experimental process and location of the anemometers and grain sieve loss sensor in the cleaning shoe were as shown in Figure 5.

3. Results and Discussion

3.1. Response Surface Experiment Results Analysis

The JMP 12.0 software was used to analyze the effects of the main working parameters on grain sieve loss utilizing the experimental results shown in Table 3, and the analysis results are shown in Table 4. From Table 3 can be learnt that the grain sieve loss ratio and grain impurity ration could meet the Chinese standard in the most of conditions, compared with the single duct cleaning device, the cleaning performance was improved significantly [20]. When using JMP and other professional statistical software for hypothesis testing, the p value (p value) is often used to quantify the statistical significance of the evidence. In general, p < 0.05 is significant, p < 0.01 is very significant, meaning that the probability of sampling errors caused by differences between samples is less than 0.05 or 0.01 [19].
From the sieve loss response surface experiment results shown in Table 4, it can be seen that the combination of fan speed and guide plate II angle can accurately reflect the variation trend of grain sieve loss. To establish the mathematical model for monitoring the grain sieve loss, the grain distribution at the tail sieve was studied under the different fan speeds and guide plate II angles. The interaction profiler for grain sieve loss is shown in Figure 6.

3.2. Relationship among Working Parameters and Grain Impurity Ratio

The analysis of the surface response experiment results regarding the grain impurity ratio is shown in Table 5. It can be seen from Table 5 that the correspondence p-value of the sieve opening is ≤0.05. Therefore, it is considered that the sieve opening is the main variable that affects the grain impurity ratio. To understand the variation in the grain impurity ratio under different working parameters, a prediction profiler for the grain impurity ratio is shown in Figure 7.
In Figure 7, the closer the desirability value is to 1, the more satisfactory the result; the closer the desirability value is to 0, the more unsatisfactory the result. From Figure 7, it can be learned that the value of the corresponding desirability of the sieve opening experiences a great fluctuation, while the corresponding desirability of the fan speed and guide plate II angle have a slight change. It further confirms that the sieve opening is the main parameter to judge the grain impurity ratio in a grain tank.

3.3. Fuzzy Controller for Cleaning System

There is no commercial grain impurity ratio monitoring system available at present; thus, it is currently impossible to obtain the grain impurity signals in a grain tank in real time. From the experiment shown in Table 5, it can be learned that when the sieve opening is 25 mm, the cleaning system has the lowest grain impurity ratio in a grain tank. Therefore, fixing the sieve opening at 25 mm, and selecting the fan speed and guide plate II as variables can establish the control strategy and thus ensure the grain impurity ratio ≤2% in the grain tank. As the control target is to keep the grain sieve loss ratio ≤0.5% under the condition of a grain impurity ratio ≤2% in the grain tank, according to the feeding rate of 2.5 kg/s, the optimal set point of the grain sieve loss ratio is 0.5%, the corresponding grain sieve loss is 12.5 g/s, and the grain sieve loss is about 420 gains/s, according to a 1000 grain mass of rice of 30 g. Based on the proportion of grain mass in the monitoring area, the control threshold is set to six gains/100 ms.
The control variables of the fuzzy controller are the fan speed and the guide plate II angle. The adjusting range of the fan speed is 1100–1500 rpm, while the guide plate II angle is distributed within 13–45°. As shown in Figure 8, the experimental results indicated that the grain sieve loss ratio increases at a rate of 0.75 g/r as the fan speed increases, and the decrease rate of the grain sieve loss is about 2.2 g/° with the increase of the guide plate II angle. The cleaning system has a good performance with the fan speed at 1300 rpm and a guide plate II angle of 29°, as the corresponding grain sieve loss and grain impurity ratio are relative low. Combined with the cleaning performance under different conditions, the grain sieve loss ratio is larger when the fan speed is 1500 rpm, which is not conducive to getting a better cleaning performance. Therefore, the fan speed can be adjusted in the range of 1100–1400 rpm, and the guide plate II angle can be changed within 23–41°.
Experiments have shown that the fan speed has a major effect on grain sieve loss. Thus, a faster loop (cycle time of five seconds), which regulates the fan speed, and a slower loop, which regulates the guide plate II angle (cycle time of 10 s), were designed to control the working process. During the working process, the cleaning controller checks whether the current grain sieve loss is approximate to the optimal set point. If the monitored grain loss number is much higher than the optimal set point, the faster loop is activated, and the fan speed is changed. Once the monitored grain sieve loss approaches the optimal set point, the slower control loop will manage the fine-tuning of the guide plate II angle to keep the grain sieve loss below the set point and without impairing the cleaning efficiency. If the monitored grain sieve loss number falls below the optimal grain sieve loss set point, the fan speed can be increased to some extent to ensure cleaning efficiency. The basic domain of the grain sieve loss is obtained as shown in Table 6. The membership functions are all triangular, as shown in Figure 9; its fuzzy domains were E and EC, and U represents their fuzzy domains. The fuzzy subsets of the input and output linguistic variables are expressed as negative big (NB), negative middle (NM), negative small (NS), zero (ZO), positive small (PS), positive middle (PM), and positive big (PB). The fuzzy system includes 49 strips of rules for the fan speed and guide plate II angle, as shown in Table 7 and Table 8.

3.4. Controller Performance Checking

The initial working parameters are as follows: the fan speed is 1500 rpm, the guide plate I angle is 26.5°, the guide plate II angle is 13°, and the sieve opening is 25 mm. The experimental results indicated that there is a large sieve loss under this condition. From Figure 10, it can be seen that when the controller was not activated in the first 10 s, the airflow velocity at the upper outlet and tail sieve is large because of the higher fan speed and the smaller guide plate II angle. Under the accelerated action of airflow, the threshed material is easily blown out, resulting in a sharp increase in grain sieve loss. After activating the controller at 10 s, the monitored grain loss is gradually decreasing. With the stability of the grain sieve loss, the controller adjusts the fan speed to increase the cleaning efficiency. The grain loss is increased as the fan speed increases. At last, the grain sieve loss is stable near the set point, and the grain sieve loss is reduced.
The combination of working parameters in the cleaning device determines the airflow distribution in the cleaning shoe. Therefore, the change of the airflow field is an indirect proof of the changes in the working parameters. The airflow velocity variation in the first 20 s is as shown in Figure 11, and the control performance of the controller is verified by the airflow velocity variation. From Figure 11, it can be seen that the airflow velocity at different measurement points varies dynamically during the cleaning process. It can be proven that the relevant working parameters are changing at the action of the controller. At 10 s, the airflow velocity distribution in the cleaning shoe is far from the ideal airflow velocity distribution form. According to previous experience, the grain sieve loss is larger and the relevant working parameters need to be adjusted in order to avoid the grain loss continuing to increase. After the control algorithm was activated in the first 10 s, the airflow velocity in the cleaning shoe rapidly reduced at 15 s, and the airflow velocity in the cleaning shoe gradually became close to the ideal airflow velocity distribution at 20 s. The calculated grain sieve loss with the activated controller was 0.53%. However, from Table 4, it can be known that the grain sieve loss is 0.83–2.01% under the working conditions that are similar to the initial working parameters: fan speed 1500 rpm, sieve opening 20–30 mm, guide plate II angle 13–45°, and guide plate I angle 26.5°. The grain sieve loss after the controller is activated is significantly reduced. Since the control algorithm was not activated in the first 10 s, the grain sieve loss was a bit higher.

4. Conclusions

Selecting S7-1200 PLC to build the lower computer hardware system, utilizing ladder language to complete the system compilation, and using LabVIEW 14.0 software to design the host–computer interface, a multi-duct cleaning device performance monitoring and control system was developed. The effects of fan speed, guide plate angle, and the sieve opening on the sieve loss ratio and grain impurity ratio were investigated through a large number of bench tests. The experimental results indicated that the combination of fan speed and guide plate II angle can accurately reflect the variation trend of grain sieve loss, and the grain sieve loss ratio increases at a rate of 0.75 g/r as the fan speed increases, and the decrease rate of the grain sieve loss is about 2.2 g/° with the increase of the guide plate II angle. Based on the proportion of grain mass in the monitoring area, the control threshold is set to six gains/100 ms. Then, a fuzzy control model of the cleaning process was developed for the multi-duct cleaning system, and the experimental results indicated that when the controller was not activated in the first 10 s, the airflow velocity at the upper outlet and tail sieve was large because of the higher fan speed and the smaller guide plate II angle. Under the accelerated action of airflow, the threshed material is easily blown out, resulting in a sharp increase in grain sieve loss. After activating the controller at 10 s, the monitored grain loss gradually decreased. With the stability of the grain sieve loss, the controller adjusts the fan speed to increase the cleaning efficiency. The grain loss increased as the fan speed increased. The designed fuzzy control model can fulfill the automated control of cleaning settings, such as fan speed and guide plate angle, and thus reduce grain sieve loss.

Author Contributions

Conceptualization, Z.L.; Methodology, Z.L.; Software, Z.L.; Validation, Z.L.; Formal Analysis, Z.L.; Writing–Original Draft Preparation, Z.L.; Writing–Review & Editing, L.X., Y.L.; Funding Acquisition, L.X.

Funding

This research was funded by [National Natural Science Foundation of China], grant number [51475217], [National Key Research and Development Program of China] grant number [2016YFD0702004]; and the China Scholarship Council (CSC); The APC was funded by [a Project Funded by the Priority Academic Program Development of Jiangsu Higher Education Institutions (PADP)].

Conflicts of Interest

The authors declare no conflict of interest.

References

  1. Yuan, L.P. Progress in super-hybrid rice breeding. Crop J. 2017, 5, 100–102. [Google Scholar] [CrossRef]
  2. Kruse, J. Computer controls for the combine. Agric. Eng. 1983, 64, 7–9. [Google Scholar]
  3. Reyns, P.; Missotten, B.; Ramon, H. A review of combine sensors for precision farming. Precis. Agric. 2002, 3, 169–182. [Google Scholar] [CrossRef]
  4. Coena, T.; Saeys, W.; Missotten, B.; De Baerdemaeker, J. Cruise control on a combine harvester using model-based predictive control. Biosyst. Eng. 2008, 99, 47–55. [Google Scholar] [CrossRef]
  5. Gomez, G.J.; Lopez Lopez, L.J.; Navas Gracia, L.M. The spatial low-pass filtering as an alternative to interpolation methods in the generation of combine harvester yield maps. Appl. Eng. Agric. 2011, 6, 1087–1097. [Google Scholar] [CrossRef]
  6. Sharanakumar, H.; Udhaykumar, R. Artificial neural network for assessment of grain losses for paddy combine harvester a novel approach. Control Comput. Inf. Syst. 2011, 140, 221–231. [Google Scholar]
  7. Zhang, Z.; Noboru, N.; Kazunobu, I. Optimization of steering control parameters based on a combine harvester’s kinematic model. Eng. Agric. Environ. Food 2014, 7, 91–96. [Google Scholar] [CrossRef]
  8. Lee, J.H.A.; Winfield, R.G. Influence of Oscillating Frequency on Separation of Wheat on a Sieve in an Airstream; American Society of Agricultural and Biological Engineers: St. Joseph, MI, USA, 1969. [Google Scholar]
  9. Miosz, T. Quality of combine-harvester performance as affected by construction of selected threshing-separating assemblies. Probl. Inzynierii Rolniczej 1994, 2, 23–34. [Google Scholar]
  10. Kutzbach, H.D.; Quick, G.R. Harvesters and Threshers CGIR Handbook of Agricultural Engineering; Plant Production Engineering; ASAE: St. Joseph, MI, USA, 1999; Volume III. [Google Scholar]
  11. Miu, P. Combine Harvesters’ Theory, Modeling, and Design; CRC Press: New York, NY, USA, 2015. [Google Scholar]
  12. Kovacic, Z.; Bogdan, S. Fuzzy Controller Design: Theory and Applications; China Machine Press: Beijing, China, 2010. [Google Scholar]
  13. Chen, Y.-J.; Chen, S.-C.; Zaeni, I.A.E.; Wu, C.-M. Fuzzy Tracking and Control Algorithm for an SSVEP-Based BCI System. Appl. Sci. 2016, 6, 270. [Google Scholar] [CrossRef]
  14. Craessaerts, G.; Baerdemaeker, J.D.; Missotten, B.; Wouter, S. Fuzzy control of the cleaning process on a combine harvester. Biosyst. Eng. 2010, 106, 103–111. [Google Scholar] [CrossRef]
  15. Omid, M.; Lashgari, M.; Mobli, H.; Alimardani, R.; Mohtasebi, S.; Hesamifard, R. Design of fuzzy logic control system incorporating human expert knowledge for combine harvester. Expert Syst. Appl. 2010, 37, 7080–7085. [Google Scholar] [CrossRef]
  16. Liang, Z.W.; Li, Y.M.; Zhao, Z.; Xu, L.Z. Optimum design of grain sieve losses monitoring sensor utilizing partial constrained viscoelastic layer damping (PCLD) treatment. Sens. Actuator A-Phys. 2015, 233, 71–82. [Google Scholar] [CrossRef]
  17. Liang, Z.W.; Li, Y.M.; Xu, L.Z. Sensor for monitoring rice grain sieve losses in combine harvesters. Biosyst. Eng. 2016, 147, 51–56. [Google Scholar] [CrossRef]
  18. Li, Y.M.; Xu, T.B.; Xu, L.Z.; Zhao, Z. Test bed of threshing and separating unit with multi cylinder. Chin. Soc. Agric. Mach. 2013, 44, 95–98. [Google Scholar]
  19. Goos, P. Optimal Design of Experiments: A Case Study Approach; Wiley: Hoboken, NJ, USA, 2011. [Google Scholar]
  20. Li, F.; Li, Y.M. Optimization and simulation research of the airway of tangential-axial combine Harvester cleaning room. J. Agric. Mech. Res. 2015, 2, 75–78. [Google Scholar]
Figure 1. Schematic diagram of the multi-duct cleaning device. 1. Human–Machine Interface (HMI), 2. Threshed outputs container, 3. Electromagnetic vibration feeder, 4. Grain pan, 5. Vertical grain auger, 6. Return plate, 7. Vertical tailings auger, 8. Framework, 9. Louver sieve, 10. Tailing sieve, 11. Sieve-opening adjusting mechanism, 12. Horizontal tailing auger, 13. Sieve-driven motor, 14. Return plate-driven motor, 15. Grain/tailing auger-driven motor, 16. Horizontal grain auger, 17. Woven screen, 18. Fan-driven motor, 19. Airflow deflector i adjustment mechanism, 20. Airflow deflector ii adjustment mechanism, and 21. Centrifugal fan.
Applsci 09 00114 g001
Figure 2. Working principle of the guide plate-angle adjusting system. 1. Direction converter, 2. Displacement sensor 1, 3. Push rod 1, 4. Airflow inlet adjust plate, 5. Displacement sensor 2, 6. Push rod 2, 7. Push rod 3, 8. Displacement sensor 3, 9. Joint bearing.
Applsci 09 00114 g002
Figure 3. Working principle of the sieve-opening adjusting system. 1. Displacement sensor, 2. Push rod, 3. Direction converter, 4. Joint bearing, 5. Connecter, 6. Active sieve.
Applsci 09 00114 g003
Figure 4. Hardware structure of operating monitoring and control system.
Applsci 09 00114 g004
Figure 5. Cleaning material acquire process for testing the performance of the controller, 1. Grain sieve loss sensor, 2. Residual flow, 3. Anemometer.
Applsci 09 00114 g005
Figure 6. Interaction profiler for grain sieve loss.
Applsci 09 00114 g006
Figure 7. Prediction profiler for grain impurity ratio.
Applsci 09 00114 g007
Figure 8. Effects of working parameters on grain loss with a confidence interval of 95%.
Applsci 09 00114 g008
Figure 9. Membership functions of the input and output variables.
Applsci 09 00114 g009
Figure 10. Comparison of grain sieve loss variation before and after activating the controller.
Applsci 09 00114 g010
Figure 11. Variation of airflow velocity distribution above the sieve within the first 20 s.
Applsci 09 00114 g011
Table 1. Adjustment range of the working parameters.
VariablesRange
Length of return plate/mm900/1100/1300
Return plate vibration frequency/HZ4–9
Sieve vibration frequency/HZ4–9
Fan speed/rpm0–1500
Grain auger speed/rpm800
Tail auger speed/rpm1000
Sieve opening/mm20–30
Guide plate I angle/°8–45
Guide plate II angle/°13–45
Table 2. Basic characteristics of the rice used in the test.
ParameterMeasured Value
Plant height/mm750~850
Ear height/mm150~170
Stalk moisture content/%58~67
Grain moisture content/%22~29
Straw/grain ratio1.9~2.2
One thousand grain weight/g31.2
Table 3. Response surface experiment results on cleaning performance.
Test No.Fan Speed/rpmSieve Opening/mmGuide Plate II Angle/°Grain Loss Ratio/%Impurity Ratio/%
1130025450.390.64
2130020290.151.22
3110020450.141.28
4150020451.020.78
5150030450.931.06
6130025130.621.31
7110020130.252.37
8150020132.011.73
9130030290.533.34
10110030450.241.76
11150030131.802.58
12150025291.280.75
13130025290.691.26
14110025290.450.52
15110030130.600.47
16130025290.561.31
Table 4. Surface response experiment results analysis for grain sieve loss.
SourceLog Worth p Value
Fan speed (1100,1500)4.016 Applsci 09 00114 i0010.0001
Guide plate II (13,45)2.338 Applsci 09 00114 i0020.0046
Fan speed ● guide plate II1.732 Applsci 09 00114 i0030.0185
Fan speed ● Fan speed1.463 Applsci 09 00114 i0040.0344
Fan speed ● Sieve opening0.918 Applsci 09 00114 i0050.1207
Sieve opening ● Sieve opening0.372 Applsci 09 00114 i0060.4250
Sieve opening ● Guide plate II0.197 Applsci 09 00114 i0070.6346
Guide plate II ● Guide plate II0.187 Applsci 09 00114 i0080.6505
Sieve opening (20,30)0.046 Applsci 09 00114 i0090.8991
Table 5. Surface response experiment results analysis for grain impurity ratio.
SourceLog Worth p Value
Sieve opening ● Sieve opening1.511 Applsci 09 00114 i0100.0309
Fan speed ● Sieve opening0.898 Applsci 09 00114 i0110.1265
Fan speed ● Fan speed0.695 Applsci 09 00114 i0120.2019
Sieve opening ● Guide plate II0.651 Applsci 09 00114 i0130.2232
Fan speed ● Guide plate II0.606 Applsci 09 00114 i0140.2479
Guide plate II (13,45)0.603 Applsci 09 00114 i0150.2494
Sieve opening (20,30)0.574 Applsci 09 00114 i0160.2665
Guide plate II ● Guide plate II0.217 Applsci 09 00114 i0170.6064
Fan speed (1100,1500)0.173 Applsci 09 00114 i0180.6707
Table 6. Changing range of the cleaning performance.
ItemDeviation DomainChange Rate of the Deviation
Grain sieve loss[−12, +12], grains/100 ms[−100, +100], grains/s
Table 7. Fuzzy control strategy for fan speed.
UNBNMNSZOPSPMPB
EC
E
NBPBPBPMPSNSNSZO
NMPBPMPSPSNSZOZO
NSPMPSPSPMZOZOZO
ZOPSPSZOZONSNSNM
PSNSNSZOPSNSNMNM
PMNSZOZONSNMNBNB
PBZOZOPSPMNMNBNB
Table 8. Fuzzy control strategy for guide plate II.
UNBNMNSZOPSPMPB
EC
E
NBZOZOZOZOPSPSZO
NMZOZOZOZOPSZOZO
NSZOZOZOZOZOZOZO
ZOZOZOZOZOZOPSPS
PSPSPSZOPSPSPSPM
PMPSZOZOPSPSPMPB
PBZOZOPSPMPMPBPB

