Article

Experimental Study on Axial Compression Behavior and Bearing Capacity Analysis of High Titanium Slag CFST Columns

Civil and Architectural Engineering Institute, Panzhihua University, Panzhihua 617000, China
*
Author to whom correspondence should be addressed.
Appl. Sci. 2019, 9(10), 2021; https://doi.org/10.3390/app9102021
Submission received: 9 March 2019 / Revised: 29 April 2019 / Accepted: 13 May 2019 / Published: 16 May 2019
(This article belongs to the Section Environmental Sciences)

Abstract

:

Featured Application

CFST axial compression members filled with high titanium slag have been widely used mainly in the columns of single-storey and multi-storey industrial plants, equipment frame columns, various supports, trestle columns, subway station platform columns, truss compression bars, steel tube piles, high-rise and super-high-rise buildings and bridge structures.

Abstract

In order to study the axial compression behavior of concrete-filled steel tubular (CFST) columns filled with high titanium slag, a total of 32 specimens, including normal CFST columns, half-high titanium slag CFST columns, and full-high titanium slag CFST columns, were used as experimental samples in this study. The axial compression behaviors of high titanium slag CFST columns and normal CFST columns with various parameters such as length–diameter ratio, strength grade of concrete, strength grade of steel tube, steel content ratio, etc., were evaluated and compared through axial compression testing under monotonic static loading. The results showed that the axial compressive behaviors of high titanium slag CFST columns with various length–diameter ratios were not significantly different from those of normal CFST columns, both of which showed good axial compression performance. In addition, the length–diameter ratio limit between short and medium long column was from 3.5 to 4.4. The length–diameter ratio was the main factor influencing the shape of load–deformation curve of CFST columns. The casing hoop coefficient also had a great influence on the bearing capacity of short columns, while the influence on that of middle and long columns was not obvious. In the end, the bearing capacities of all specimens were calculated by bearing capacity formulas in European EC4, American AISC360-10, and Chinese GB50936-2014 standards. The calculated values were in good agreement with the test results.

Graphical Abstract

1. Introduction

The blast furnace slag produced by Panzhihua Iron and Steel Group Co., Ltd. during steel-making is called high titanium blast furnace slag or high titanium slag for short, because it contains more than 20% TiO2 [1]. Piling of high titanium slag not only occupies a large amount of land resource, but also brings great pollution to the environment. Therefore, how to consume and make full use of it is an urgent but difficult problem to solve [2]. It is found that the high titanium slag crushed into particles of different sizes can partially or completely replace the coarse or fine aggregate in concrete with a good mechanical performance [3,4]. At present, high titanium slag concrete has been widely used in roads, bridges, and building structures in the Panzhihua–Xichang area. The research on the mechanical properties of high titanium slag concrete material has been very extensive [5,6,7], but the research on the stressed members or integral structure of high titanium slag concrete, especially in the field of steel–concrete composite structures, is limited [8,9,10,11].
In China, studies on stressed members with high titanium slag concrete mainly focus on reinforced concrete (RC) beams and columns. For example, Li Xiaowei, Jiao Tao, and other scholars carried out an experimental study on the seismic performance of high titanium slag RC columns [12,13,14,15,16], and the results showed that the seismic performance of high titanium slag concrete column was almost the same as that of normal concrete column. Huang Shuanghua, Chen Wei, Sun Jinkun, and other scholars carried out experimental study on the bending behavior of RC beams with high titanium slag [17,18,19,20]. According to their report, the bending capacity and ductility of high titanium slag concrete beams were improved slightly compared with that of normal concrete beams. Sun Jinkun, Li Xiaowei, and other scholars carried out an experimental study on the shear behavior of RC beams with high titanium slag [21,22], and the results showed that the high titanium slag RC beams had better shear strength than normal RC beams. The above researches indicated that the high titanium slag concrete used in RC structure had good mechanical properties. CFST columns, as a typical representative in the field of steel–concrete composite structures, have been extensively studied by scholars all over the world. However, no relevant literature has focused on the feasibility of applying high titanium slag concrete to steel–concrete composite structures. Therefore, it is necessary to carry out relevant experimental research on CFST columns filled with high titanium slag, which can provide the necessary theoretical basis for the application of high titanium slag concrete in steel–concrete composite structures.
Under the action of axial pressure, both steel tubing and the core concrete of CFST columns are in the state of three-dimensional stress, as a special feature of CFST [23,24]. The compressive strength and deformation capacity of concrete are greatly improved by means of the confinement effect of steel tubes in concrete, especially in the case of circular sections. Moreover, it transforms concrete from a brittle material to a plastic one. At present, each country has relatively complete design specifications of bearing capacity calculation for CFST columns, such as European EC4 (2004) [25], American AISC 360-10 (2010) [26], Japanese AIJ (1997) [27], German DIN18800-5:2007-03 [28], Chinese GB50936-2014 [29]. Except for Japan, which still adopts the allowable stress method, other countries adopt the limit state design method, and the strength and stiffness in the design formulas are basically calculated by the superposition method.
Although the design specifications are relatively complete, CFST is still a research hotspot for scholars around the world. Through relevant retrieval, the number of publications on “CFST” in the last five years has reached more than 20,000, mainly focusing on the following aspects: (1) Changing section shape, such as circle, square, rectangle, oval, etc. KojiroUenaka carried out an experimental study on the compressive performance of oval CFST short columns [30]; Kyung-Soo Chung et al. studied the hysteretic behavior of square CFST columns filled with high strength concrete under eccentric compression [31]. (2) CFST with a steel frame, with the steel frame comprising I-steel, T-steel, crisscross steel, etc. Ebrahim Farajpourbonab et al. conducted finite element analysis on the mechanical behavior of CFST columns with internal I-steel under axial and lateral cyclic loads [32]. (3) CFST with double-layer steel tubing, with the steel tubes being double-layered circular steel tubes, inner square steel tubes, outer circular steel tube, inner circular steel tubes, and outer square steel tubes. M.F. Hassanein et al. carried out finite element analysis on CFST columns filled with concrete between double-layered circular steel tubes [33]; M. Elchalakanib et al. carried out finite element analysis on the overall buckling performance of double-layered circular CFST long columns [34]; M. Pagoulatou et al. carried out finite element analysis on the bearing capacity of CFST short column filled with concrete between double-layered circular steel tubes [35]. (4) Studies on CFST columns filled with high strength concrete. J.M. Portolés et al. carried out experimental research on circular CFST columns filled with high strength concrete [36]. (5) Connectors arranged on the inner surface of steel tubes to increase the interfacial strength between the steel tubes and the concrete. Yongjian Liu et al. conducted extensive studies on CFST columns with PBL connectors on the inner surface of steel tubes [37,38]. (6) Thin-walled CFST. Marcin Abramski carried out an experimental study on CFST columns with low steel ratio [39]. (7) CFST columns with eccentric compression. J. Zeghichea carried out experimental research on CFST columns with eccentric compression [40].
Although the above studies on CFST are extensive and in-depth, no relevant studies and reports on CFST members filled with high titanium slag concrete have been conducted. High titanium slag is an industrial solid waste and the study on CFST columns filled with high titanium slag concrete is of great significance for the recycling and comprehensive utilization of solid waste. In Panzhihua and Xichang areas, CFST members filled with high titanium slag have been widely used in the columns of single-storey and multistorey industrial plants, equipment frame columns, various supports, trestle columns, subway station platform columns, power transmission and transformation poles, truss compression bars, piles, space structures, high-rise and super-high-rise buildings, and bridge structures, which have achieved good economic and social benefits. However, the design was mainly based on the theory of normal CFST, lacking theoretical basis and experimental proof. Therefore, the experimental study of CFST columns filled with high titanium slag concrete in this paper has practical significance.

2. Experiment Program

2.1. Specimen Design

In order to study the difference in axial compression properties between high titanium slag CFST columns and normal CFST columns, 32 CFST specimens were designed, as shown in Figure 1 and Table 1, taking into account the influences of length–diameter ratio, strength grade of concrete, strength grade of steel tube, and steel content. Among them, 12 were filled with full-high titanium slag concrete, 12 with half-high titanium slag concrete, and eight with normal concrete. The so-called full-high titanium slag concrete refers to concrete with its coarse or fine aggregates completely replaced by high titanium slag; and half-high titanium slag concrete refers to concrete with its coarse or fine aggregate partially replaced by high titanium slag. The concrete in a steel tube was compacted by jolting using a Φ 30 mm vibrator. At the same time, a set of 150 × 150 × 150 mm standard cube concrete blocks was reserved for each grade of concrete, with the same conditions as CFST specimens, which were naturally cured indoors with sack coverings and watering. The steel tubing adopted was welded straight-seam circular steel tubing of 114 mm diameter and grades Q235 and Q345. The material strength was tested by a universal testing machine according to the standard tensile testing method of metallic materials at ambient temperature. The measured elastic modulus and Poisson’s ratio of the two materials are shown in Table 2.

2.2. Preparation of Concrete

High-titanium slag crushed stone was continuously graded with 5–20 mm particle size. A proportion of about 15% slag sweet corn stone was added to improve the gradation and then was fully humidified. The natural stone was tailing natural bluestone with maximum particle size less than 20 mm. The moisture content of high titanium slag sand and natural sand was determined before mixing and considered in calculating the total water consumption. The natural sand used was medium or coarse sand with apparent density less than 2700 kg/m3. The cement varieties were Ruifeng P.C32.5R and P.O42.5R. The admixture used was FDN concrete admixtures. Secondary fly ash was used and water consumption was appropriately adjusted according to slump requirements [42,43]. The proportioning of the three types concrete used in the test are shown in Table 3.
In order to reflect the difference of the internal microstructure between high titanium slag concrete and normal concrete, the specimens of the two kinds of concrete were sliced and scanned by electron microscope, as shown in Figure 2. There is an obvious interface transition zone between the coarse aggregate of normal concrete and cement mortar, and the interface connection is not compact with obvious gaps (Figure 2a). There is no obvious interfacial transition zone between the coarse aggregate and cement mortar of high titanium slag concrete, and the interfacial connection is compact. The cement slurry can easily enter the pores inside the coarse aggregate of high titanium slag (Figure 2b), forming a dense “nested” structure, which acts as a “pin” and improves the interface strength between high titanium slag and cement mortar [44]. In addition, the moisture content in the coarse aggregate of high titanium slag will be released when the internal humidity of the concrete drops, which can compensate for the moisture content required for cement hydration. It can reduce concrete shrinkage, make the concrete structure more compact, optimize the pore structure, and improve the strength and durability of concrete [45].

2.3. Loading and Testing

The testing was carried out in the Structural Laboratory of Panzhihua University. The loading device was a hydraulic loading system composed of a 200 t hydraulic jack and self-made reaction frame (Figure 3a). The loading program was divided into two stages: preload and detection of load capacity. In the preload stage, the specimen was loaded to 20% of the nominal load capacity, and then unloaded to 0. The purpose of this stage was to check whether the loading device and data acquisition system could work normally, and more importantly, to perform mechanical alignment on the specimen. Strict alignment was the key to the success of this experiment. At the stage of detecting load capacity, the loading stage was firstly carried out with the loading step interval of 10% of the nominal bearing capacity, and the interval between stages is 5~10 min. After the yielding of the steel tube, the loading step interval was changed to 5% of the nominal bearing capacity until the specimen was destroyed.
The test content included: the pressure value of the jack which was measured with a 200 t force sensor, and the average longitudinal compression deformation, which was measured with four displacement transducers arranged around the specimen at the symmetrical positions of every 90 degrees. At the 1/2 height of the specimen, two longitudinal and transverse strain gauges (a total of eight strain gauges for each specimen) were arranged at symmetrical positions every 90 degrees to measure the longitudinal strain and the circumferential strain, respectively [46,47,48]. The force sensor, displacement transducer and strain gauge were all connected to the static strain indicator for automatic data collecting and recording. The layout of the displacement transducer and strain gauge is shown in Figure 3b.

3. The Test Results

3.1. Carrying Capacity Analysis

The measured values of the bearing capacity of the specimen take the maximum value collected by the force sensor. The measured values of 32 test pieces are summarized here, as shown in Table 4. It can be calculated from Table 4 that, on the premise that the length of the specimen, the thickness of the steel tube wall, the steel grade and the concrete grade are the same, the carrying capacities of CFST filled with three types of concrete are compared as follows: regarding 16 specimens with lengths of 300 mm and 400 mm, the load-carrying capacity of CFST with high titanium slag concrete exceeds that of CFST with half-high titanium slag concrete. The load-carrying capacity of CFST with half-high titanium slag concrete exceeds that of CFST with normal concrete, but with an insignificant difference of about 2%. Table 1 indicates that although three types of concrete have the same grade, the axial compressive strength is slightly different. The compressive strength of full-high titanium slag concrete is slightly greater than that of half-high titanium slag concrete, and the compressive strength of half-high titanium slag concrete is slightly greater than that of normal concrete, which is consistent with the tendency of the bearing capacities of three kinds of CFST. For 16 specimens with lengths of 500 mm and 600 mm, the bearing capacity of full-high titanium slag CFST is 3% larger than that of half-high titanium slag CFST and 2% smaller than that of normal CFST. The bearing capacity of half-high titanium slag CFST is 4% smaller than that of normal CFST. The carrying capacities of CFST filled with three types of concrete do not follow the above tendency. The reason is that achieving the ideal axial compression state is difficult when installing specimens, often with slight eccentricity. This small eccentricity has no obvious impact on the bearing capacity of short CFST, but has a relatively large impact on that of tall CFSTs. In short, the compressive strengths of these three kinds of concrete with the same grade are very close, as are the bearing capacities. Therefore, it can be proved that the replacement of normal coarse or fine aggregate by high titanium slag aggregate has little effect on the bearing capacity of CFST.

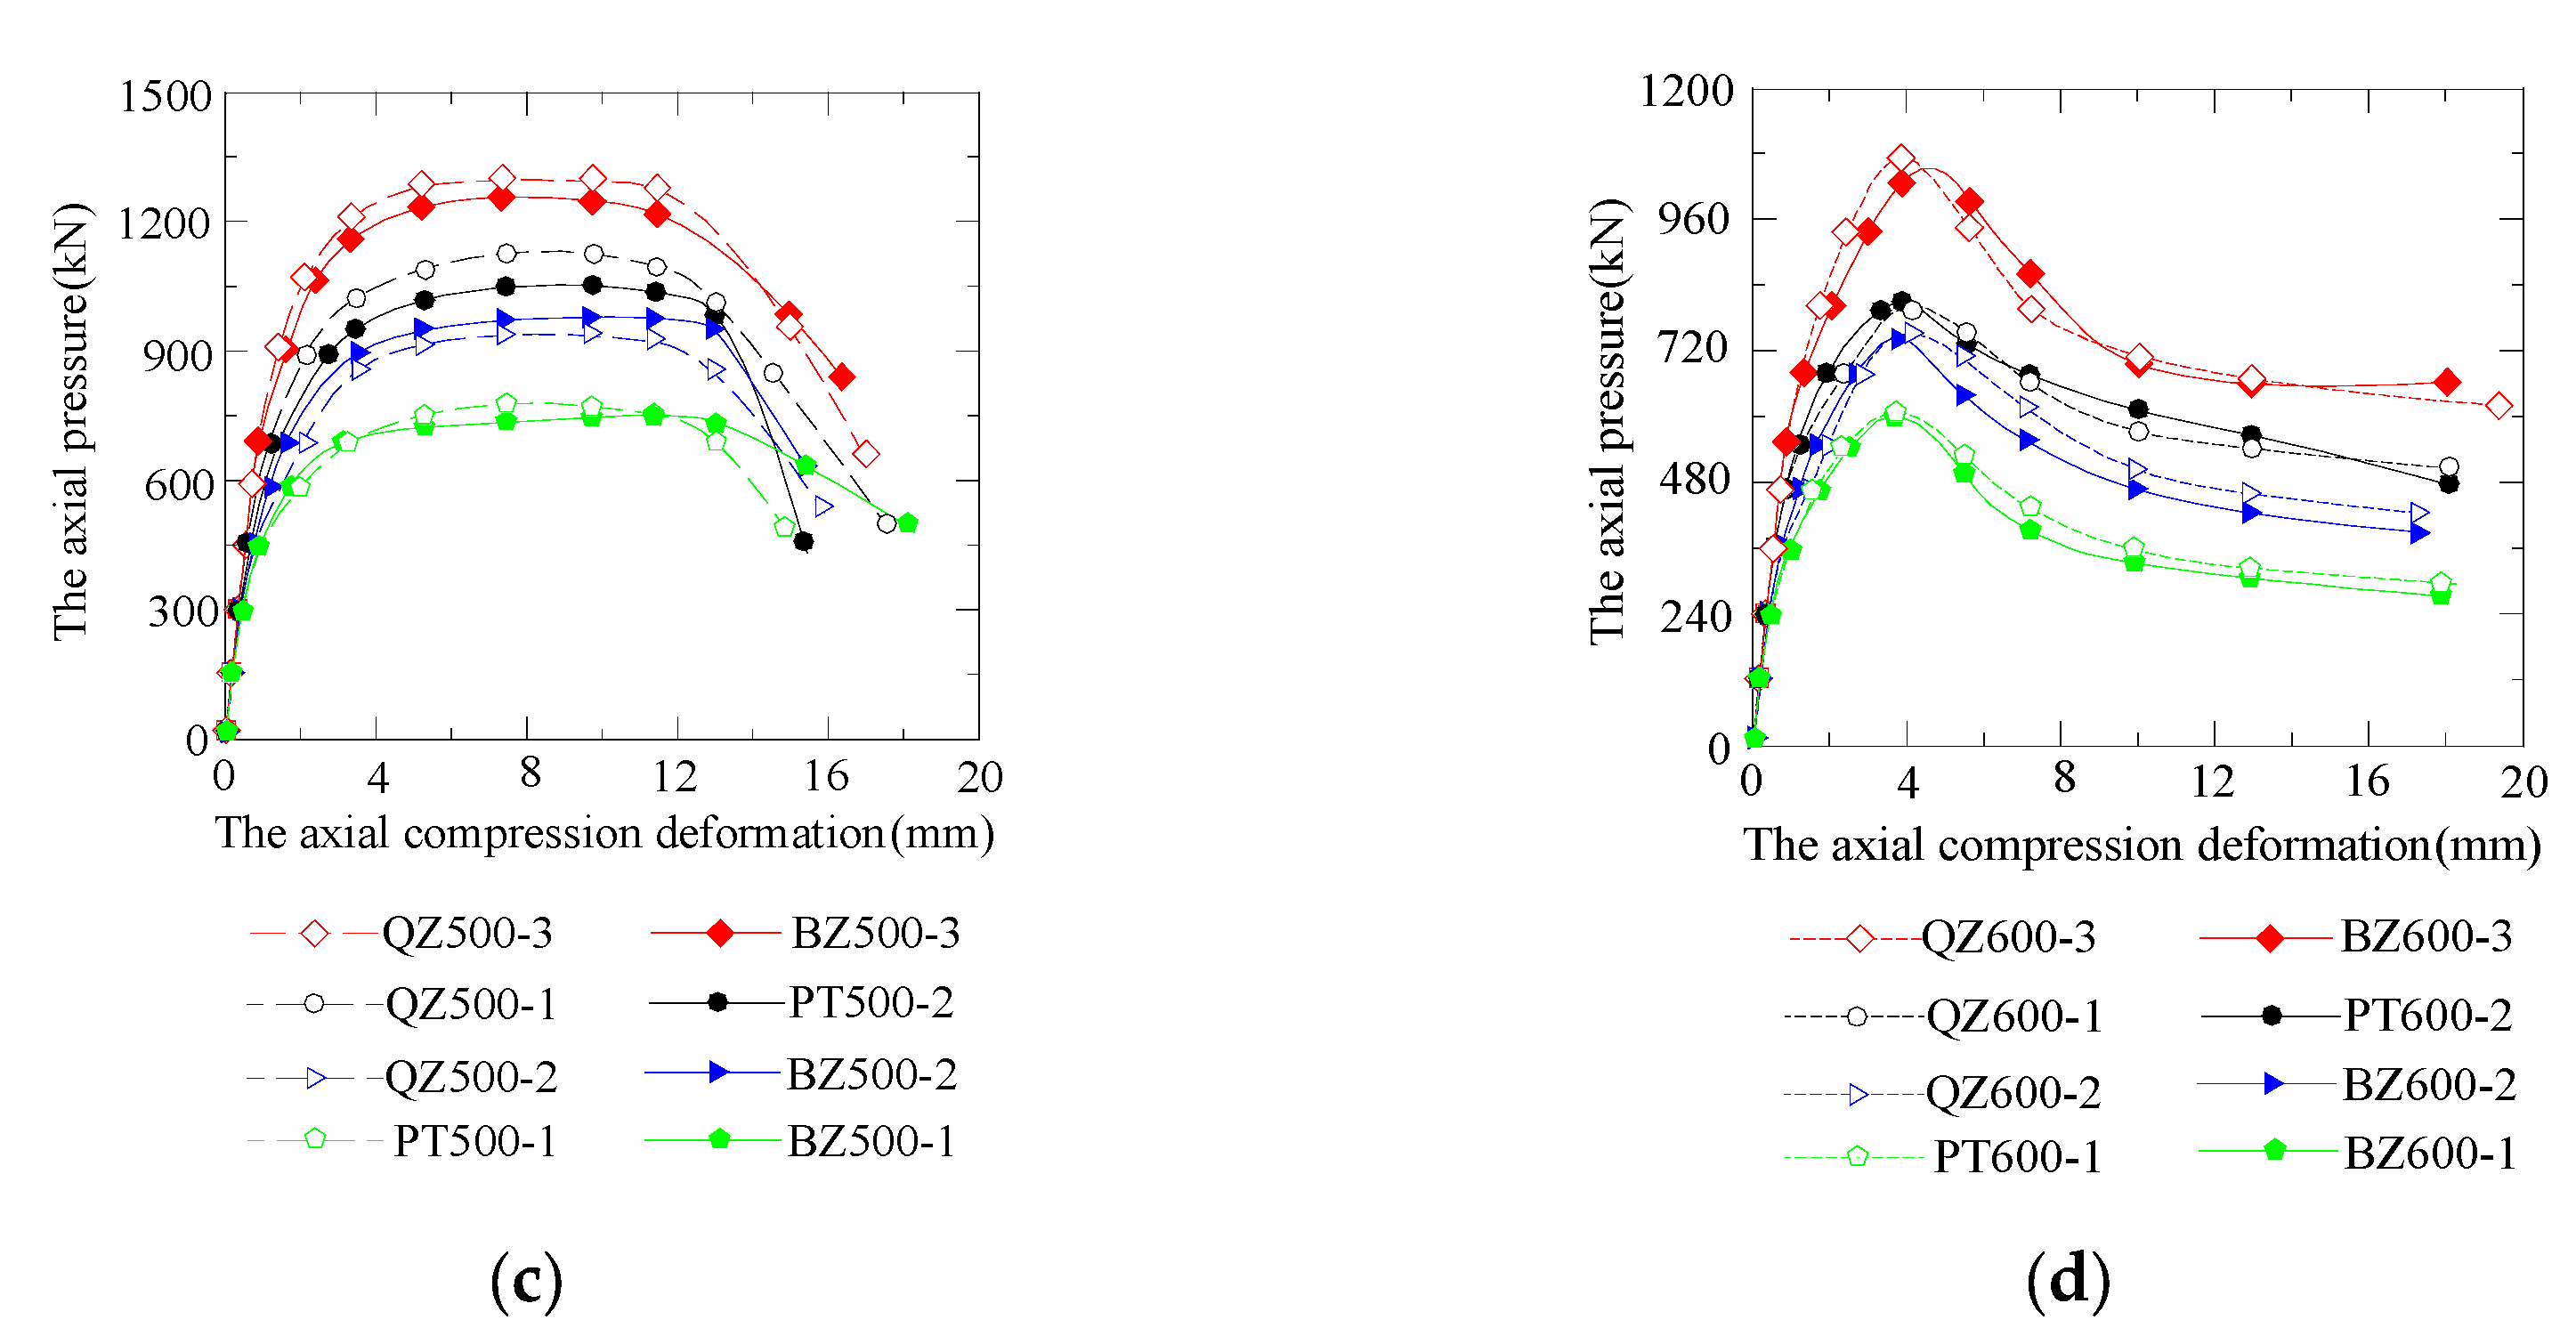
3.2. Failure Mode and Load–Displacement Curve

The failure modes of CFST specimens made of full-high titanium slag concrete, half-high titanium slag concrete, and normal concrete were basically the same, which was mainly related to length–diameter ratio λ (=L/D), but was not significantly related to other factors. The failure modes of the four length–diameter ratios specimens are shown in Figure 4.
The load–displacement curves of the specimen with length–diameter ratios λ equal to 2.6 and 3.5 are shown in Figure 5a,b. Both curves have an obvious elastic stage, elastic-plastic stage, and strengthening stage, but no descending stage. After entering the strengthening stage, the surface of the specimen started to swell locally, and oblique shear slip occurred on the upper and lower boundaries of swelling region when continuing to load. No bending phenomenon occurred in the whole process, indicating that the final failure mode was swelling failure or shear failure of the middle part.
The load–displacement curve of the specimen with length–diameter ratio λ equal to 4.4 is shown in Figure 5c, which is divided into four stages: elastic, elastic-plastic, plastic, and descending stages. After entering the late plastic stage, an oblique shear slip appeared on the surface of the specimen, and then a bending phenomenon quickly occurred. The load–displacement curve turned into a descending stage, indicating that the final failure mode was shear slip failure and overall bending buckling failure.
The specimen with length–diameter ratio λ equal to 5.3 has the deformation curve shown in Figure 5d. It is composed of elasticity, elastic-plastic, and descending stages. After entering the elastic-plastic stage, shear slip and bending occurred almost simultaneously in the specimen, and the deformation curve turned into the descending stage, indicating that the final failure mode was dominated by the overall bending and buckling failure, accompanied by shear slip failure.
By comparing the load–displacement curves of the four length–diameter ratios, it is obvious that the load–displacement curves of CFST filled with full-high titanium slag concrete, half-high titanium slag concrete, and normal concrete are relatively consistent, under the condition that other factors are the same.

3.3. Load–Strain Relationship

As shown in Figure 3b, the position with the maximum compression strain is marked as position 1.
With regard to the specimens with length–diameter ratios λ equal to 2.6 and 3.5, the changes of strain in four positions were relatively consistent, indicating that it was an ideal axial compression state, and there was no instability phenomenon before failure. Taking a group of specimens with λ equal to 2.6 (PT300-2, BZ300-1, BZ300-2, BZ300-3) for example, the relationship curve of the average strain of the four positions with the change of load is shown in Figure 6. At the elastic stage, the ratio of hoop strain to longitudinal strain μs varied from 0.26 to 0.29, with an average of 0.281. After entering the elastic-plastic stage, the value of μs increased gradually and reached 0.52 when entering the limit state.
With regard to the specimens with length–diameter ratios λ equal to 4.4 and 5.3, the strains at the four locations were relatively close at the start of loading, indicating that the specimen installation was correct. With the increase of load, the strain gap at the four locations became larger and larger. Soon after entering the elastic-plastic stage, the strain gap at the four locations suddenly multiplied, indicating that the overall instability of the specimen occurred. Limited by space, this paper only gives the load–strain relationship curve of sample QZ600-3, as shown in Figure 7. In the case of instability, the rate of longitudinal compression strain at position 1 suddenly increases; meanwhile, the longitudinal compression strain at the opposite position (position 3) suddenly decreases and then turns to tensile strain. The strain changes at position 2 and 4 are not obvious. The ratio of hoop strain to longitudinal strain μs changes from 0.25 to 0.30 at the elastic stage. From the elastic-plastic stage to the final failure, the μs at position 1 and position 3 increase to about 0.46, and the μs at position 2 and position 4 have no noticeable change.

4. Study on Ultimate Bearing Capacity

4.1. Relationship between Test Value of Bearing Capacity and Nominal Bearing Capacity

According to the superposition principle, it is easy to get the nominal bearing capacity formula of CFST [49,50].
Nk = Asfy + Acfck
where As is the sectional area of steel tube; fy represents is the yield strength of steel; Ac is the sectional area of concrete; fck represents the standard value of axial compression strength of concrete.
The ultimate bearing capacity test value Nt of 32 CFST and the nominal bearing capacity Nk calculated by Formula (1) are summarized in Table 4. In order to get a more intuitive understanding of the improvement of ultimate bearing capacity of CFST compared with that calculated by Formula (1), the change rule of Nt/Nk with length–diameter ratio λ is plotted as shown in Figure 8.
It can be seen from Figure 8 that for the specimens with length–diameter ratios λ equal to 2.6 and 3.5, the values of Nt/Nk vary from 1.7 to 1.9, and the curve tends to be horizontally distributed, indicating that the length–diameter ratio has no significant influence on the ultimate bearing capacity of CFST when the length–diameter ratio is less than 3.5. The values of Nt/Nk concentrate in the range of 1.6 to 1.7 for λ = 4.4, and 1.2 to 1.3 for λ = 5.3. This shows that as the length–diameter ratio exceeds 4.4, the length–diameter ratio has a great influence on the ultimate bearing capacity of CFST. With the increase of length–diameter ratio, the bearing capacity of CFST is greatly reduced due to the easy occurrence of overall instability.

4.2. Comparison between Test Values and Calculated Values in Specifications of Bearing Capacity

Circular CFST columns are widely used. The specifications of various countries have given clear calculation formulas of bearing capacity. The bearing capacity formulas of EC4, AISC360-10, and GB50936-2014 are briefly introduced here.
(1) Bearing capacity formula in European code EC4 [25].
N u = φ N p l
N p l = η 2 A s f y / γ s + ( 1 + η 1 ) t / d ( f y / f c k ) A c f c k / γ c
φ = 1 / ( ϕ + ϕ 2 λ ¯ 2 )
ϕ = 0.5 [ 1 + 0.21 ( λ ¯ 0.2 ) + λ ¯ 2 )
where φ is the stability coefficient; η 1 and η 2 both represent the coefficient considering the confinement effect, η 1 0 , η 2 1 ; t and d are the thickness and diameter of the steel tube, respectively; γ s and γ c are the partial factors for materials of steel tube and concrete, respectively; λ ¯ represents the equivalent slenderness ratio.
(2) Bearing capacity formula in American code AISC360-10 [26].
This code converts the strength of concrete into steel to obtain the nominal compressive strength of steel F c r , and then calculates the bearing capacity of CFST axial compression members from F c r :
N u = 0.85 A s F c r
{ F c r = ( 0.658 λ ¯ 2 ) F m y F c r = ( 0.877 / λ ¯ 2 ) F m y λ ¯ 1.5 λ ¯ > 1.5
F m y = f y + 0.85 f c ( A c / A s )
where f c represents the cylinder strength of concrete.
(3) Bearing capacity formula in Chinese code GB50936-2014 [29].
N u = φ e φ l N 0
{ N 0 = 0.9 A c f c ( 1 + α ξ ) N 0 = 0.9 A c f c ( 1 + ξ + ξ ) ξ 1 / ( α 1 ) 2 ξ > 1 / ( α 1 ) 2
where φ e represents the reduction coefficient of bearing capacity considering the effect of eccentricity; φ l is the reduction coefficient of bearing capacity considering the effect of slenderness ratio; α is the coefficient related to the strength grade of concrete; ξ represents the casing hoop coefficient of CFST members, as shown in Table 1.
According to above introduction, it can be summarized as the following points: (1) The three codes all adopt the superposition method, that is, the CFST bearing capacity is equal to the bearing capacity of steel tube plus that of concrete; (2) These three codes all consider the effect of slenderness ratio on bearing capacity; (3) Bearing capacity formulas in Chinese GB50936-2014 and European EC4 consider the confinement effect, while American AISC360-10 does not. Therefore, AISC 360-10 is safer; (4) GB50936-2014 considers the effect of eccentricity, while EC4 and AISC360-10 do not.
In order to compare the test values of bearing capacity of 32 specimens with the calculated values of EC4, AISC 360-10, GB50936-2014, and other specifications, the bearing capacities of 32 specimens are calculated by using Formulas (2), (6), and (9), as shown in Table 4 and Figure 9. Percentage error analysis between the calculated values in three specifications in Table 4 and the test values in this paper is carried out, as shown in Table 5.
As can be seen from Table 4 and Table 5, and Figure 9, the calculated values in specifications of various countries are generally in good agreement with the test values in this paper. GB50936-2014 ( μ = 98.59%, σ = 1.56%) fits best and the second is EC4 ( μ = 97.16%, σ = 1.93%). The calculated value of AISC360-10 ( μ = 90.47%, σ = 1.43%) is the most conservative, that is, with the highest security. Since the bearing capacity formulas in Chinese GB50936-2014 and European EC4 both consider the benefit of the confinement effect on bearing capacity, while American AISC360-10 does not, and the values of partial factors for materials vary from country to country, the percentage errors between the calculated values in specifications of different countries and the test values in this paper are different.
It can also be seen from the comparison of the PT, BZ, and QZ samples in Table 5 that the calculated values of normal concrete in specifications are in the best agreement, with the smallest error and percentage dispersion between the calculated values and the test values. However, the full-high titanium slag concrete has a poorer degree of coincidence, with relatively large error and dispersion degree. The half-high titanium slag concrete is in the middle. The reason is that the specifications of various countries all establish CFST bearing capacity formulas based on normal concrete, while high titanium slag concrete and normal concrete have obvious microscopic differences (Figure 2). Therefore, compared with normal concrete, the error and dispersion degree of high titanium slag concrete are slightly larger. In spite of this, there is no significant difference in the percentage between the calculated values of CFST bearing capacity with high titanium slag and those of normal CFST, indicating that the microscopic difference of the two kinds of concrete has little influence on the macroscopic mechanical behavior.

5. Conclusions

There was no significant difference between the axial compression performance of high titanium slag CFST columns and normal CFST columns, regardless of column length. High titanium slag concrete used in CFST columns had the same excellent compression properties as normal CFST columns.
The boundary length–diameter ratio of high titanium slag CFST columns between short and medium length columns was from 3.5 to 4.4. The main factor influencing the shape of the load–deformation curve of high titanium slag CFST was the length–diameter ratio, while the influences of other factors were not obvious.
The casing hoop coefficient had a great influence on the bearing capacity of short high titanium slag CFST columns, but the influence on medium–long columns was not obvious.
The bearing capacities of all specimens were calculated by the bearing capacity formulas in European EC4, American AISC360-10, and Chinese GB50936-2014 specifications, and the calculated values were in good agreement with the test values.

Author Contributions

All authors substantially contributed to this work. W.C. proposed the basic framework of the research scenario. C.Z. were the scientific coordinator of the research, designed the experimental campaign, analyzed the results and wrote the paper. X.R. and X.T. contributed on the experimental tests. All authors helped with the writing of the paper and give final approval of the version to be submitted and any revised versions.

Funding

The authors gratefully acknowledge financial support from the Scientific research project of Sichuan Education Department-Key Projects (18ZA0748).

Conflicts of Interest

The authors declare no conflict of interest.

References

  1. Li, L.Z. Research on Preparation High Titanium Slag Self-Compacting Concrete. Master’s Thesis, Xihua University, Chengdu, China, 2016. [Google Scholar]
  2. Zhong, S. Performance Experimental and Application Study on High-titanium Blast Furnace Slag No-sand Concrete. Master’s Thesis, Xihua University, Chengdu, China, 2017. [Google Scholar]
  3. Zhou, C.L. Experimental study on seismic behavior of blast furnace slag concrete shear wall. Chin. Concr. Cem. Prod. 2014, 4, 58–61. [Google Scholar]
  4. Sun, J.K.; Liu, J.; Zhang, Q.; Li, B. Research on Long-term Deformability and Durability of Complex High Titanium Heavy Slag Concrete. Build. Sci. 2015, 31, 216–219. [Google Scholar]
  5. Qian, B.; Hu, J.C.; Qi, M.Q.; Zheng, F.P.; Zhao, J. Experimental Research on Performance of C30 Concrete with Aggregate of High Titanium Heavy Slag in Xichang City. Bull. Chin. Ceram. Soc. 2018, 37, 2062–2066. [Google Scholar]
  6. Jiang, H.M.; Mu, T.M.; Ding, Q.J. Research on the working performance of high titanium heavy slag concrete. Concrete 2011, 42, 125–127. [Google Scholar]
  7. Zhou, C.L. Experimental Study on High-titanium Blast Furnace Slag Heat-resistant Concrete. Bull. Chin. Ceram. Soc. 2018, 37, 3119–3123. [Google Scholar]
  8. Huang, H.; Zeng, R.G.; Zhang, A.G.; Mou, T.M. Experimental study on eccentric compressive behaviors of reinforced concrete columns with high titanium heavy slag aggregate. Railw. Eng. 2015, 42, 162–166. [Google Scholar]
  9. Sun, J.K.; Chen, W.; Wang, J.; Guo, X.K.; Zhou, W.F. Experimental Research on the Cracks of HRB500E High-strength Anti-seismic Steel Bar High-titanium Heavy-slag Concrete Beams. Earthq. Resist. Eng. Retrofit. 2016, 38, 78–84. [Google Scholar]
  10. Li, Y.; Liu, X.f.; Ding, Q.J.; Wu, M.K.; Li, H. Study on the column performance of high titanium heavy slag reinforced concrete. Concrete 2015, 07, 49–51. [Google Scholar] [CrossRef]
  11. Mu, T.M.; Liu, X.F.; Ding, Q.J.; Li, Y. Bend Performance of High Titanium Heavy Slag Concrete Beam. Archit. Technol. 2015, 46, 495–498. [Google Scholar]
  12. Li, X.W.; Li, X.W.; Yuan, X. Seismic performance of high titanium heavy slag high strength concrete columns. Appl. Mech. Mater. 2012, 174–177, 455–459. [Google Scholar] [CrossRef]
  13. Li, X.W.; Chen, W.; Li, X.W. Experimental study on seismic performance of high strength concrete columns with high titanium heavy slag as coarse and fine aggregates. Build. Struct. 2013, 43, 96–100. [Google Scholar]
  14. Li, X.W.; Chen, W.; Li, X.W. Experimental study on seismic performance of HRC columns with high titanium heavy slag aggregate. World Earthq. Eng. 2013, 29, 39–45. [Google Scholar]
  15. Jiao, T.; Chen, W.; Li, X.W. Experiment on columns with pangang fine slag aggregate concrete subjected to horizontal low cyclic loading. Earthq. Resist. Eng. Retrofit. 2013, 35, 75–79. [Google Scholar]
  16. Jiao, T.; Li, X.W.; Chen, W.; Li, X.W. Ductility Test of reinforced concrete columns with full blast Furnace Slag. China Concr. Cem. Prod. 2013, 2, 60–63. [Google Scholar]
  17. Sun, J.K.; Chen, W.; Huang, S.H.; Li, Y.M. Mechanics performance of complex high titanium heavy slag reinforcement concrete beam. Adv. Mater. Res. 2010, 168–170, 2013–2022. [Google Scholar] [CrossRef]
  18. Chen, W.; Huang, S.H.; Sun, J.K.; Jiao, T. Experiment reseach on flexural performance of RC beam by high titanium blast furnance slag. SC. Build. Sci. 2009, 35, 51–55. [Google Scholar]
  19. Huang, S.H.; Wang, J.; Chen, B.; Duan, H.F. Study on normal section bending performance of blast furnace slag concrete beam with high strength carbon fiber rod. Build. Struct. 2017, 47, 65–69. [Google Scholar]
  20. Wang, J.; Xu, X.Q.; Huang, S.H. Experiment research on normal section flexural performance of flexural member by high titanium blast furnace slag. Constr. Technol. 2015, 58, 513–515. [Google Scholar]
  21. Sun, J.K.; Huang, S.H.; Chen, K.C.; Zhou, W.F.; Guo, X.K. Shear Performance Test Study of Complex High Titanium Heavy Slag Concrete Restrained Beams with Web Reinforcement of at Different Longitudinal Reinforcement Ratios. Build. Sci. 2016, 32, 78–85. [Google Scholar]
  22. Feng, S.Q.; Li, X.W.; Zhen, Q.; Zhang, Z.W.; Yang, J.F. Study on Shear behavior of High Titanium blast Furnace heavy Slag Beam. SC. Archit. 2016, 36, 114–116. [Google Scholar]
  23. Zhong, S.T. Concrete-Filled Steel Tubular Structures; Tsinghua University Press: Beijing, China, 2003. [Google Scholar]
  24. Kupfer, H.; Hilsdorf, H.K.; Rüsch, H. Behavior of Concrete under Biaxial Stress. ACI J. Proc. 1969, 66, 656–666. [Google Scholar]
  25. Eurocode 4: Design of Composite Steel and Concrete Structures-Part1-1: General Rules and Rules for Buildings; European Committee for Standardization: Brussels, Belgium, 2004.
  26. ANSI/AISC 360-10. Specification for Structural Steel Buildings; American Institute of Steel Construction: Chicago, IL, USA, 2010. [Google Scholar]
  27. AIJ. Recommendations for Design and Construction of Concrete Filled Steel Tubular Structures; Architectural Institute of Japan: Tokyo, Japan, 1997. [Google Scholar]
  28. Deutsch Norm DIN18800-5:2007-03. Steel Structures—Part 5: Composite Structures of Steel and Concrete—Design and Construction; Normenausschuss Bauwesen (NABau) im DIN: Berlin, Germany, 2007. [Google Scholar]
  29. Industry Standards of the People’s Republic of China. Technical Code for Concrete Filled Steel Tubular Structures (GB50936-2014); Ministry of Housing and Urban-Rural Development of the People’s Republic of China: Beijing, China, 2014.
  30. Uenaka, K. Experimental study on concrete filled elliptical/oval steel tubular stub columns under compression. Thin Wall. Struct. 2014, 78, 131–137. [Google Scholar] [CrossRef]
  31. Chung, K.S.; Kim, J.H.; Yoo, J.H. Prediction of hysteretic behavior of high-strength square concrete-filled steel tubular columns subjected to eccentric loading. Int. J. Steel Struct. 2012, 12, 243–252. [Google Scholar] [CrossRef]
  32. Farajpourbonab, E.; Kute, S.Y.; Inamdar, V.M. Steel-reinforced concrete-filled steel tubular columns under axial and lateral cyclic loading. Int. J. Adv. Struct. Eng. 2018, 10, 61–72. [Google Scholar] [CrossRef]
  33. Hassanein, M.F.; Kharoob, O.F. Analysis of circular concrete-filled double skin tubular slender columns with external stainless steel tubes. Thin Wall. Struct. 2014, 79, 23–37. [Google Scholar] [CrossRef]
  34. Hassanein, M.F.; Elchalakani, M.; Patel, V.I. Overall buckling behaviour of circular concrete-filled dual steel tubular columns with stainless steel external tubes. Thin Wall. Struct. 2017, 115, 336–348. [Google Scholar] [CrossRef]
  35. Pagoulatou, M.; Sheehan, T.; Dai, X.H.; Lam, D. Finite element analysis on the capacity of circular concrete-filled double-skin steel tubular (CFDST) stub columns. Eng. Struct. 2014, 72, 102–112. [Google Scholar] [CrossRef]
  36. Portolés, J.M.; Serra, E.; Romero, M.L. Influence of ultra-high strength infill in slender concrete-filled steel tubular columns. J. Constr. Steel Res. 2013, 86, 107–114. [Google Scholar] [CrossRef]
  37. Liu, S.M.; Liu, Y.J.; Chen, X.K.; Chen, P.X. Experimental study on steel fiber reinforcement high strength concrete-filled rectangular steel tubular column stiffened with perfobond strip under axial compression. J. Build. Struct. 2018, 39, 22–28. [Google Scholar]
  38. Liu, Y.J.; LI, H.; Zhang, N.; Liu, J.P.; Sun, X.B. Interface Bond-slip Performance of Rectangular Concrete-filled Steel Tube Stiffened by PBL. J. Archit. Civ. Eng. 2015, 32, 1–7. [Google Scholar]
  39. Abramski, M. Load-carrying capacity of axially loaded concrete-filled steel tubular columns made of thin tubes. Arch. Civ. Mech. Eng. 2018, 18, 902–913. [Google Scholar] [CrossRef]
  40. Zeghiche, J.; Chaoui, K. An experimental behaviour of concrete-filled steel tubular columns. J. Constr. Steel Res. 2005, 61, 53–66. [Google Scholar] [CrossRef]
  41. Chen, P.; Wang, Y.Y.; Liu, C.Y. Confinement Path-dependent Analytical Model for FRP-Confined Concrete and Concrete-filled Steel Tube Subjected to Axial Compression. Compos. Struct. 2018, 201, 234–247. [Google Scholar] [CrossRef]
  42. Industry Standards of the People’s Republic of China. Specification for Mix Proportion Design of Ordinary Concrete (JGJ55-2011); Ministry of Housing and Urban-Rural Development of the People’s Republic of China (MOHURD): Beijing, China, 2011.
  43. American Concrete Institute (ACI). Building Code Requirements for Structural Concrete (ACI 318-14); ACI: Farmington Hills, MI, USA, 2014. [Google Scholar]
  44. Cheng, Z.Q. Experimental Research Field of High Performance Shale Lightweight Aggregate Concrete. Master’s Thesis, Central South University, Changsha, China, 2007. [Google Scholar]
  45. Wuhan University of Technology. Technical Guide for Application of Manufactured Sand in Concretes; China Communications Press: Beijing, China, 2008. [Google Scholar]
  46. Zhang, Y.C.; Wang, Q.P.; Mao, X.Y. Research on Mechanics Behavior of Stub-column of Concrete-filled Thin-walled Steel Tube Under Axial Load. Build. Struct. 2005, 35, 22–27. (In Chinese) [Google Scholar]
  47. Saleh, S.M. Size effect on the load carrying capacity of normal and lightweight concrete filled square steel tube composite columns. Int. J. Appl. Eng. Res. 2017, 12, 5261–5266. [Google Scholar]
  48. Ye, Y.; Han, L.H.; Tao, Z.; Guo, S.L. Experimental behavior of concrete-filled steel tubular members under lateral shear loads. J. Constr. Steel Res. 2016, 122, 226–237. [Google Scholar] [CrossRef]
  49. Xiang, X.Y.; Zhao, R.D.; Liu, Y. Calculation Method of Bearing Capacity for Self-compacting Recycled Concrete-f illed Steel-Tube Short Column. Railw. Eng. 2017, 2, 34–37. [Google Scholar]
  50. Zhu, M.C.; Liu, J.X.; Wang, Q.X.; Feng, X.F. Experimental research on square steel tubular columns filled with steel-reinforced self-consolidating high-strength concrete under axial load. Eng. Struct. 2010, 32, 2278–2286. [Google Scholar] [CrossRef]
Figure 1. Photograph of the specimens.
Applsci 09 02021 g001
Figure 2. Microstructure of concrete: (a) Normal concrete; (b) High titanium slag concrete.
Applsci 09 02021 g002
Figure 3. Loading and testing: (a) Test setup; (b) Schematic diagram of the layout of displacement transducer and strain gauge.
Applsci 09 02021 g003
Figure 4. Failure mode: (a) λ = 2.6; (b) λ = 3.5; (c) λ = 4.4; (d) λ = 5.3.
Applsci 09 02021 g004
Figure 5. The load–displacement curve: (a) λ = 2.6; (b) λ = 3.5; (c) λ = 4.4; (d) λ = 5.3.
Applsci 09 02021 g005aApplsci 09 02021 g005b
Figure 6. λ = 2.6 load–strain relationship.
Applsci 09 02021 g006
Figure 7. QZ600-3 load–strain relationship.
Applsci 09 02021 g007
Figure 8. The relationship between Nt/Nk and λ.
Applsci 09 02021 g008
Figure 9. Comparison of measured values of bearing capacity and values calculated by various specifications.
Applsci 09 02021 g009
Table 1. Parameters of the specimens.
Specimen NumberL (mm)L/Dt (mm)afy (MPa)Concrete Numberfck (MPa)ξ
PT300-13002.630.114237PTC3020.71.31
BZ300-13002.630.114237BZC3021.11.28
PT300-23002.630.114336PTC4027.31.40
QZ300-13002.630.114336QZC4028.51.34
BZ300-23002.650.202231BZC3021.12.21
QZ300-23002.650.202231QZC3022.42.08
BZ300-33002.650.202332BZC4027.92.40
QZ300-33002.650.202332QZC4028.52.35
PT400-14003.530.114237PTC3020.71.31
BZ400-14003.530.114237BZC3021.11.28
PT400-24003.530.114336PTC4027.31.40
QZ400-14003.530.114336QZC4028.51.34
BZ400-24003.550.202231BZC3021.12.21
QZ400-24003.550.202231QZC3022.42.08
BZ400-34003.550.202332BZC4027.92.40
QZ400-34003.550.202332QZC4028.52.35
PT500-15004.430.114237PTC3020.71.31
BZ500-15004.430.114237BZC3021.11.28
PT500-25004.430.114336PTC4027.31.40
QZ500-15004.430.114336QZC4028.51.34
BZ500-25004.450.202231BZC3021.12.21
QZ500-25004.450.202231QZC3022.42.08
BZ500-35004.450.202332BZC4027.92.40
QZ500-35004.450.202332QZC4028.52.35
PT600-16005.330.114237PTC3020.71.31
BZ600-16005.330.114237BZC3021.11.28
PT600-26005.330.114336PTC4027.31.40
QZ600-16005.330.114336QZC4028.51.34
BZ600-26005.350.202231BZC3021.12.21
QZ600-26005.350.202231QZC3022.42.08
BZ600-36005.350.202332BZC4027.92.40
QZ600-36005.350.202332QZC4028.52.35
Note: PT in the sample number represents normal concrete, BZ represents half-high titanium slag concrete, and QZ represents full-high titanium slag concrete. L represents the length of the specimen; D represents the outer diameter of steel tube; t represents the thickness of steel tube wall; a represents the steel content, a = As/Ac; fy represents the yield strength of steel tube; the number of concrete is shown in Table 2; fck represents the standard value of axial compression strength of concrete, fck = 0.67fcu; ξ represents the hoop factor [41], and ξ = afy/fck.
Table 2. Measured values of elastic modulus and Poisson’s ratio.
MaterialStrength GradeElastic ModulusPoisson’s Ratio
Value (MPa)Standard Deviation (MPa)Variable CoefficientValueStandard DeviationVariable Coefficient
ConcretePTC3030,20018120.060.1890.013230.07
BZC3030,40030400.10.1860.011160.06
QZC3030,50036600.120.1910.017190.09
PTC4032,80026240.080.1940.01940.10
BZC4033,10033100.10.1930.015440.08
QZC4033,40023380.070.1970.021670.11
SteelQ235208,00083200.040.2840.005680.02
Q345206,00061800.030.2900.00290.01
Table 3. Mix proportion of concrete.
TypesDesign GradingCement
(kg)
Fly Ash
(kg)
Slag Sand
(kg)
Natural Sand
(kg)
Slag Stone
(kg)
Natural Stone
(kg)
Admixture
(kg)
Water
(kg)
Bulk Density
(kg/m3)
Varieties of CementConcrete Numbers
Full-high titanium slag concreteC303051209459428.52002521P.C32.5RQZC30
C403459591896510.62002534P.O42.5RQZC40
Semi-high titanium slag concreteC303151154504504984988.62002535P.C32.5RBZC30
C403518244344350850810.42002545P.O42.5RBZC40
Ordinary concreteC303209873511858.42002546P.C32.5RPTC30
C4036580698120110.72002555P.O42.5RPTC40
Note: High titanium slag crushed stone, slag sweet corn stone, high titanium slag sand, cement, and other materials were all produced by Panzhihua Huanye company (Panzhihua, China); The natural stone was the tailing natural bluestone collected from west Panzhihua city; The natural sand was river sand collected from Renhe district of Panzhihua city; Fly ash was the secondary fly ash produced by 504 power plant of Panzhihua Iron and Steel Group Co., Ltd (Panzhihua, China).
Table 4. Summary and comparison of test and calculated values of bearing capacity.
Specimen NumberNt (kN)EC4(2004)AISC360-10GB50936-2014Nk (kN)
Calculated Value (kN)RatioCalculated Value (kN)RatioCalculated Value (kN)Ratio
PT300-1810.6766.694.57%754.393.05%798.598.51%437.6
BZ300-1823.4782.995.08%761.692.49%798.997.02%441.2
PT300-21141.71107.497.00%1067.693.51%1138.799.74%601.6
QZ300-11150.51103.295.89%1059.892.12%1120.397.38%612.6
BZ300-21089.91060.697.31%1006.592.35%1082.999.36%574.8
QZ300-21107.31075.097.08%1020.592.16%1083.997.89%585.8
BZ300-31528.41484.497.12%1405.991.99%1490.097.49%805.4
QZ300-31539.11490.596.84%1413.091.81%1507.397.93%810.5
PT400-1792.9769.797.07%726.591.63%826.7104.26%437.6
BZ400-1799.7780.597.60%731.391.45%796.299.56%441.2
PT400-21091.41068.797.92%996.091.26%1107.2101.45%601.6
QZ400-11110.01086.697.89%1011.091.08%1093.098.47%612.6
BZ400-21075.81055.298.09%977.990.90%1074.399.86%574.8
QZ400-21094.51073.298.05%992.990.72%1096.4100.17%585.8
BZ400-31528.21494.697.80%1383.690.54%1499.498.12%805.4
QZ400-31537.11504.097.85%1388.990.36%1529.699.51%810.5
PT500-1723.0695.796.22%652.090.18%713.898.73%437.6
BZ500-1716.4685.495.67%644.189.91%712.499.44%441.2
PT500-21001.1965.396.42%899.089.80%977.697.65%601.6
QZ500-1995.7920.792.47%893.189.70%986.199.04%612.6
BZ500-2946.5924.797.70%848.089.59%940.399.34%574.8
QZ500-2961.4948.098.61%860.389.48%935.597.31%585.8
BZ500-31279.41217.795.18%1143.589.38%1262.698.69%805.4
QZ500-31323.31208.991.35%1181.389.27%1295.697.91%810.5
PT600-1556.2547.898.49%495.989.16%548.598.62%437.6
BZ600-1531.8538.3101.22%473.689.06%515.096.84%441.2
PT600-2771.4757.698.21%686.288.96%757.698.21%601.6
QZ600-1759.3759.199.97%674.688.84%748.198.52%612.6
BZ600-2743.6728.397.94%659.988.74%717.596.49%574.8
QZ600-2746.5737.298.75%661.788.64%725.697.20%585.8
BZ600-31022.11012.299.03%904.988.53%1000.797.91%805.4
QZ600-31034.01022.198.85%914.388.42%994.296.15%810.5
Note: Nt represents the test value of CFST; The ratio is the ratio between calculated value in specifications and test value of bearing capacity; Nk represents the nominal bearing capacity of CFST, as shown in formula (1).
Table 5. Percentage error analysis between calculated values and test values.
SampleEC4 (2004)AISC360-10GB50936-2014
μσμσμσ
Total sample97.16%1.93%90.47%1.43%98.59%1.56%
PT Sample97.48%1.27%90.94%1.16%99.65%1.19%
BZ Sample96.99%1.70%90.41%1.42%98.34%1.39%
QZ Sample96.37%2.60%90.22%2.02%98.12%2.23%
Note: PT Sample represents the normal CFST sample; BZ Sample represents the half-high titanium slag CFST sample; QZ Sample represents the full-high titanium slag CFST sample; μ and σ are the mean and standard deviation of percentages of calculated values and test values, respectively.

