Article

Using Social Media to Identify Consumers’ Sentiments towards Attributes of Health Insurance during Enrollment Season

by
Eline M. van den Broek-Altenburg
* and
Adam J. Atherly
Center for Health Services Research, The Larner College of Medicine, University of Vermont, Burlington, VT 05405, USA
*
Author to whom correspondence should be addressed.
Appl. Sci. 2019, 9(10), 2035; https://doi.org/10.3390/app9102035
Submission received: 27 April 2019 / Revised: 9 May 2019 / Accepted: 13 May 2019 / Published: 17 May 2019
(This article belongs to the Special Issue Sentiment Analysis for Social Media)

Abstract

:

Featured Application

The health insurance choice literature has found that financial considerations, such as premiums, deductible, and maximum out-of-pocket spending caps, are important to consumers. But these financial factors are just part of the cost-benefit trade-off consumers make. Publicly available datasets often do not include these other factors. Researchers in other fields have increasingly used web data from social media platforms, such as Twitter and search engines to analyze consumer behavior using Natural Language Processing. NLP combines machine learning, computational linguistics, and computer science, to understand natural language including consumer’s sentiments, attitudes, and emotions from social media. This study is among the first to use natural language from an online platform to analyze sentiments when consumers are discussing health insurance. By clarifying what the expressed attitudes or sentiments are, we get an idea of what variables we may want to include in future studies of health insurance choice.

Abstract

This study aims to identify sentiments that consumers have about health insurance by analyzing what they discuss on Twitter. The objective was to use sentiment analysis to identify attitudes consumers express towards health insurance and health care providers. We used an Application Programming Interface to gather tweets from Twitter with the words “health insurance” or “health plan” during health insurance enrollment season in the United States in 2016‒2017. Word association was used to find words associated with “premium,” “access,” “network,” and “switch.” Sentiment analysis established which specific emotions were associated with insurance and medical providers, using the NRC Emotion Lexicon, identifying emotions. We identified that provider networks, prescription drug benefits, political preferences, and norms of other consumers matter. Consumers trust medical providers but they fear unexpected health events. The results suggest that there is a need for different algorithms to help consumers find the plans they want and need. Consumers buying health insurance in the Affordable Care Act marketplaces in the United States choose lower-cost plans with limited benefits, but at the same time express fear about unexpected health events and unanticipated costs. If we better understand the origin of the sentiments that drive consumers, we may be able to help them better navigate insurance plan options and insurers can better respond to their needs.

Graphical Abstract

1. Introduction

In the Affordable Care Act health insurance marketplaces in the United States (USA), consumers are mandated to choose a health insurance plan. Plans may differ by premiums, benefits, and other plan attributes, such as the network of providers or how tightly managed the plan is. Consumers ideally pick the best combination of plan attributes, switching plans if necessary.
The health insurance choice literature has found that financial considerations, such as premiums, deductibles, and maximum out-of-pocket spending caps, are indeed important to consumers [1,2,3,4,5]. However, these considerations are just part of the cost‒benefit trade-off consumers make. Surveys and discrete choice experiments suggest that other plan attributes, such as choice of personal doctors [6,7], continuity of care [8,9,10,11], or how “tightly managed” the plan is [4], also have an effect on consumers’ choices. Information about quality of service or other aspects of care delivery may also play a role [12]. The more we know about the trade-offs consumers make and what factors play a role in insurance choice, the better we can predict or anticipate future choices.
This study identifies sentiments that consumers have when discussing health insurance in the USA by using an alternative data source: Twitter. Twitter has grown exponentially in recent years and computer and data scientists have learned how to extract information from the 328 million monthly active Twitter users, 70 million of whom live in the USA [13], Every second, on average, around 6000 tweets are sent via Twitter, which corresponds to 500 million tweets per day and around 200 billion tweets per year [14].
Twitter’s “tweets,” which were at the time of our study limited to 140 characters, have been shown to have surprising predictive power. Numerous studies across different academic fields have used Twitter as a tool for forecasting or prediction. Researchers in industrial organization and marketing have used Twitter data to analyze what consumers want and need. In fields like finance and macroeconomics, text from social media has been used to make predictions about the stock market [15,16,17], oil [18], sales [19], and unemployment rates [20,21], or as a surveillance tool to track messages related to security breaches [22]. In the political arena, Twitter has been used to predict the outcome of elections or to poll political sentiment [23,24,25]. It has been suggested that analysis of social media data more accurately predicted Trump’s win than election polls [26].
More recently, text mining of web content has been used in the context of public health. Twitter data have been used to evaluate health care quality, poll reactions to health policy reforms and in various other public health contexts. Additionally, researchers have used text from Twitter for influenza surveillance [27,28,29,30,31]. For example, an analysis of three million tweets between May and December 2009 showed that the 2009 H1N1 flu outbreak could have been identified on Twitter one week before it emerged in official records from general practitioner reports. Researchers at the Department of Computer Science at Johns Hopkins University created a model for Twitter that groups symptoms and treatments into latent ailments.
Other examples include using tweets to compute the average happiness of cancer patients for each cancer diagnosis [32], to measure patient-perceived quality of care in hospitals [33], and to predict asthma prevalence by combining Twitter data with other data sources [34]. The latter study provides evidence that monitoring asthma-related tweets may provide real-time information that can be used to predict outcomes from traditional surveys.
Some recent studies have used web data from search engines such as Google to analyze consumer behavior in health insurance. One study examined factors associated with health insurance-related Google searches during the first open enrollment period [35]. The authors found that search volumes were associated with local uninsured rates. Another study used text data from Twitter to identify consumers’ sentiments to predict insurance enrollment [36].
A number of studies have used Twitter data in a similar context to this study. Beyond the health insurance studies mentioned above, Twitter has also been used to assess public opinion about the Affordable Care Act over time: a study found substantial spikes in the volume of Affordable Care Act-related tweets in response to key events in the law’s implementation [37].
The aim of this study is to identify sentiments that consumers express on Twitter when they discuss health insurance. The first objective of this paper is to identify words that are associated with the word “switch” in the tweets. In the context of tweets gathered on the search “health insurance,” we assume that “switch” is related to health insurance at least some of the time. The second objective of this paper is to identify what attitudes or sentiments consumers have when communicating about health insurance in online social networks. The study is hypothesis-generating: gaining insights into the words consumers use when they communicate about health insurance on an online social network may lead to better-informed theory regarding health plan choices. By clarifying what the expressed attitudes or sentiments are, we may find variables we can include in future studies and we may be able to generate testable hypotheses.

2. Materials and Methods

2.1. Data

Using an Application Programming Interface (API), we gathered tweets from the Twitter server with the words “health insurance,” “health plan,” “health provider” or “doctor” in them during open enrollment period from 1 November 2016 until 31 January 2017. This is the yearly period when U.S. citizens can enroll in or switch a health insurance plan. Beyond this timeframe, they have to stay with the plan they have. API is code that allows two software programs, in our case Twitter and Python 3.6, to communicate with each other. With the API, Python authenticated, requested, and received the data from the Twitter server. The words “health insurance” and “health plan” generated approximately one tweet every 3 s, adding up to 28,800 per day; 892,800 per month; and 2,678,400 total tweets during the ACA open enrollment season for 2017.
We used the API to create a body of text, called “VCorpus,” in R 3.4. At each index of the “VCorpus object,” there is a PlainTextDocument object, which is essentially a list that contains the actual text data of the tweet, as well as some corresponding metadata such as the location from which the tweet was sent, the date, and other elements. In other words, the tweets were gathered in one text document and pre-processed for analysis. This pre-processing gets rid of punctuation, hashtags, and retweets, strips white space, and removes stop words and custom terms so that they are now represented as lemmatized plain words. To illustrate, the tweet text “Obama care is a joke fr. My health care plan is just not affordable no more. Cheaper to pay the penalty I guess” was changed to: “obama care joke fr health care plan just affordable cheaper pay penalty guess” after pre-processing.
The most important way that text differs from more typical data sources is that text is naturally high-dimensional, which makes analysis difficult, often referred to as the “curse of dimensionality.” For example, suppose that a sample of tweets, each of which is 20 words long, and that each word is drawn from a vocabulary of 2000 possible words. It follows that the unique representation of these tweets has a very high dimensionality, with 40,000 data columns.
To reduce dimensionality, we use the “bag of words” (BoW) model. The BoW model, also known as a vector space model, reduces dimensionality by simplifying the representation of the words used in natural language processing and information retrieval. In this model, a text document (such as a tweet) is represented as the bag (multiset) of its words, disregarding grammar and word order [38].
Subsequently, our “bag of words” model learned a vocabulary from the millions of tweets and then modeled each tweet by counting the number of times each word appears in the tweet [38]. Through automatic text categorization, we extracted features or “token sets” from the text by representing the tweets by the words that occur in it.
To explain how we converted text to numeric data, here is an example. Sentence 1: “The health insurance plan is too expensive to cover my health needs”; Sentence 2: “The health insurance company offers an expensive health plan.” We can see that, from these two sentences, our vocabulary is: {The, health, insurance, plan, is, too, expensive, to, cover, my, needs, company, offers, an}. To get the bags of words, the number of times each word occurs was counted in each sentence. In Sentence 1,” health” appears twice, and the other words each appear once, so the feature vector for Sentence 1 is: {1, 2, 1, 1, 1, 1, 1, 1, 1, 1, 1, 0, 0, 0} and Sentence 2: {1, 2, 1, 0, 0, 0, 0, 0, 0, 0, 0, 1, 1, 1} We created a Term-Document matrix (TDM) where each row is a 1/0 representation of whether a single word is contained within the tweet and every column is a tweet. We then removed terms with a sparse factor of less than 0.001. These are the terms that occur less than 0.01% of times in a tweet. The resulting matrix contained 1354 words.

2.2. Analytic Approach

To find which words are associated with switching, we used Word Association: a function that calculates the association of a word with another word in the TDM. We used the findAssocs() in R to calculate the association of a word with every other word in the TDM. The output scores range from 0 to 1, where a score of 1 means that two words always appear together, and a score of 0 means that they never appear together. To find associations, we set a minimum of 0.05, meaning that the program would look for all words that were associated in one tweet (that has a maximum of 140 characters) with “premium” at least 5% of the tweets. Since we were interested in attitudes to plan attributes, we tested three attributes of health insurance plans: “premium,” “access,” and “network.” We also looked for all the words that were associated with the word “switch” at least 5% of the time. We chose “premium” because we know from the literature that the premium matters when consumers buy health insurance, as well as “access” to doctors. Since we were particularly interested in whether provider networks, which refers to insurance coverage of doctors in-network, matters when consumers discuss health insurance, we also looked at “network.”
To identify sentiments in the tweets, we use methods of classification. We used sentiment lexicons, a dictionary-based approach, which depends on finding opinion seed words, and then searches the dictionary for their synonyms. While various sentiment lexicons all have their advantages and disadvantages in the context of topic-specific subjectivity scores, interpretation, and completeness, the choice for a specific sentiment lexicon is context-specific. We used the NRC Emotion Lexicon (NRC Emolex) [39], which classifies words in a binary yes/no for classes of attitude “positive” and “negative”; and for classes of emotion: anger, anticipation, disgust, fear, joy, sadness, surprise, and trust. We wanted to not only find out the overall sentiment of tweets, but also what specific emotion they embodied, and identify which words represented those emotions.

3. Results

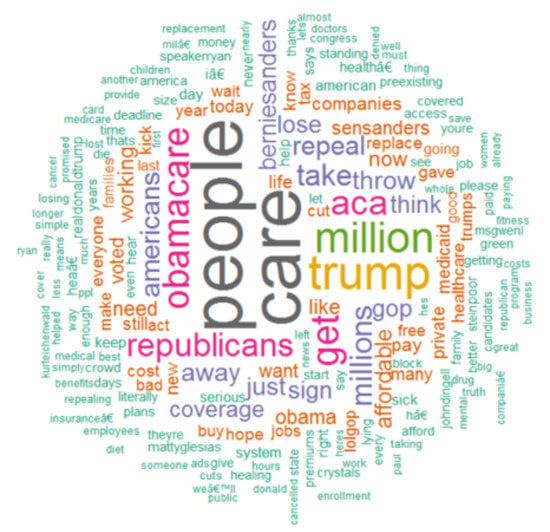
3.1. Word Association

Figure 1 shows that the most common word consumers used in combination with the word “switch” was the word “bait” (0.31), meaning that in 31% of tweets with the word “switch,” the word “bait” was also used. In 8% of the tweets that use the word “switch,” the word “premium” is also used.
This suggests that insurance was often described as a bait and switch, such as in this example tweet: “The healthcare bait-and-switch. In network hospital, out of network doctor.” This was followed by “lockedin” and “rxrights.” “Rxrights” refers RxRights.org, which serves as a forum for individuals to share experiences and voice opinions regarding the need for affordable prescription drugs. It is an example of how “switch” could be used in a different context than insurance, such as in this tweet: “In the USA, this is how we are forced to switch insulins without any regard to our health or to doctors’ orders.” The next most common word associated with switch was “network.” Networks were used in tweets about switching, such as in this example: “Gods blessings is like health insurance, you have in network benefits and out of network benefits, but in network is way better of course.” There were tweets discussing the role of provider networks in insurance such as this one: “$252 for a doctor visit. I wasn’t even there for 20 minutes. Thanks insurance for not letting me know the doc was no longer in my network.”
“Network” was associated with the word switch as often as “premium,” which was 0.08, meaning that 8% of tweets that had the word “switch” in them also contained the work “premium.” Consumers expressed concerns about premiums, deductibles, and co-pays, such as in this example: “Dude, as expensive as my insurance is. Copays, premiums, etc., I might as well not even have it. Costs 2 much to use.”

3.2. Sentiment Analysis

The results of the sentiment analysis showed that two emotions prevailed in tweets during enrollment season: “trust” and “fear” (Table 1). The emotion “trust” was the primary driver of positive sentiment expressed in tweets, while the emotion “fear” was the primary driver of negative sentiments and accounted for the slightly negative overall sentiment. Trust was expressed in the context of doctors, nurses, and other medical providers. Here is an example of a tweet discussing this trustworthy role: “Patients value their family doctor at the bedside when gravely ill. Healing presence is so powerful.”
In a tweet like this, the NRC Emolex classified the word “value” as positive and associated with “trust,” while the word “healing” is classified as positive and associated with the emotions of anticipation, joy, and trust. Another tweet referred to the importance of continuity of care: “Seeing anxiety in culture from lack of relationship with continuity of fam Doctor.” The word “anxiety” is classified by the NRC Emolex as negative and associated with the emotions of fear, anticipation, and sadness. In this way, the words used in tweets are given a subjectivity score and common ones are reported in Table 1.
Fear was conveyed in Tweets about medical events such as “lose,” “disease,” “emergency,” “surgery,” “cancer,” and unanticipated costs. Consumers expressed both negative and positive sentiments about choice, but the NRC Emolex could not specify the exact emotion. For example, one tweet stated: “I hate choice so much that I’ve essentially disregarded my doctor because I’ve had such a low care of my own wellbeing.” It also identified “pressure” as being negative but could not specify what kind of emotion consumers expressed. Overall, the sentiment of consumers toward health insurance was slightly negative, although most sentiments were not at either extreme (Figure 2).
The figure shows how the words used in the tweets were classified: either positive or negative. It follows from the histogram that most words were classified as “slightly negative” (‒1) and few words were classified as either extremely negative or extremely positive.
To understand what attitudes consumers expressed regarding specific attributes of health plans, we examined “premium,” “access,” and “network.” Table 2 illustrates that consumers used the insurance attribute “premium” most often in combination with words like “increase” or “relief.”
Access was associated most of the time with “nocopay,” suggesting that consumers who care about access also care about copays. The attribute “network” was associated with “narrow” 23% of the time, and with “providers” 16% of the time, suggesting that many consumers talk about narrow network plans when discussing health insurance.

4. Discussion

In this study, we used text data from Twitter to identify attitudes that consumers express towards health insurance, plan attributes, and health care providers. The health insurance choice literature focuses primarily on well-defined features of plans that are easily observable from administrative data such as benefit design, co-insurance rates, and deductibles. Previous studies found that financial considerations, such as premiums, deductibles, and maximum out-of-pocket spending caps, are important to consumers. This study reinforces some results from previous research. The sensitivity of consumers to higher premiums that our study finds is well documented in other literature. The role of provider networks has been debated recently—our study reinforces the importance of the networks to consumers.
There are limitations associated with the bag of words approach that we used. The main disadvantage is that it severely limits the context of the tweet and loses the order of specific information. Also, it requires supervised machine learning, which entails modeling linguistic knowledge through the use of dictionaries containing words that are tagged with their semantic orientation [39]. This means that we used an existing data dictionary, but we accept the classification of the English words to identify emotions.
It is a challenge to capture the essential meaning of a tweet in a machine-understandable format [40] as issues like short length, informal words, misspellings, and unusual grammar make it difficult to obtain a good representation to capture these text aspects. More recently, there has been a paradigm shift in machine learning towards using distributed representations for words [41] and sentences [42,43]. Most studies analyzing tweets have not been able to use a fully unsupervised approach for message-level and phrase-level sentiment analysis of tweets. The advantage to such an approach would have been, for example, that we would have been able to convey emotions in the same manner in the tweets as in newspaper articles or blogs, reviews, or other types of user-generated content. In everyday life, we rely on context to interpret a piece of text or comment, so with bag of words it is harder to capture context as it merely focuses on isolated words or term frequencies.
We do not know how the demographics of people tweeting about health insurance compares to the Affordable Care Act marketplace population, the Medicaid expansion population, and the uninsured. Tweets contain macro data about the user, but it is limited to whatever information the user decides to give. In practice, a small percentage of users provide personal information such as gender or age. We do have some information about location, but we lack this information for a substantial part of the sample and the level of information (city, state) differs by user.
Another limitation is that tweets have social network-oriented properties, and therefore we believe that a good representation of our tweets should also capture social aspects. A social network analysis is beyond the scope of this study, as well as conversational science approach looking at how a comment is influenced by the previous one.

5. Conclusions

This study suggests that other, non-financial factors, might be important in the choice of health insurance plan, such as the sentiments that consumers have. The discussion of “fear” in relation to health insurance plan choice may seem unusual; however, the basic economic model for health insurance posits risk aversion as a key motivator for individuals to buy coverage. In some sense, “fear” is simply “risk-averse” in the vernacular. In another sense, however, this study provides specificity about the nature of the risk aversion and suggests that consumers lack confidence in their choices and express fear towards adverse health events and unanticipated costs.
If we better understand the origin of the fear and other sentiments that drive consumers, we may be able to help them to better navigate insurance plan options and insurers can make sure to better respond to their needs. Additionally, plan finders often provide consumers with actuarial spending estimates for “average” consumers; our study suggests that the average outcome is not the outcome of interest to consumers. Even though some plan finders include individual-specific calculations [44], insurance companies may want to react to consumers’ sentiments in addition to financial considerations. Consumers are concerned about an unusual event—cancer, accident, surgery, or disease—and whether they can afford care when death is a real possibility. Plan finders could be reconfigured to give coverage data for consumers experiencing these extreme health events.
Text mining is an important addition to research in this area because of the sheer volume of information and the possibility of looking quantitatively at formative data. In social science in general, and public health research in particular, a common practice is to rely on small convenience samples to generate formative data that are qualitative to generate hypotheses. Potential testable hypotheses that were generated from the analysis may include “Provider networks are associated with health plan switching” or “Sentiments expressed on Twitter predict health insurance choice.” Where qualitative research usually involves very small samples, text data can yield similar insights with substantially larger sample sizes. This study illustrates that we can use another, perhaps equally effective, advanced method and data to generate testable hypotheses.

Author Contributions

Both authors made substantial contributions to the conception and design of the work. E.M.v.d.B.-A. was responsible for the acquisition, analysis, and interpretation of data; and for drafting the work. A.J.A. played an important role in the interpretation of the data and results and substantively revised the manuscript. Both authors have approved the submitted version and agree to be personally accountable for their own contributions and for ensuring that questions related to the accuracy or integrity of any part of the work are appropriately investigated, resolved, and documented in the literature.

Conflicts of Interest

The authors declare no conflict of interest.

References

  1. Atherly, A.; Dowd, B.E.; Feldman, R. The effect of benefits, premiums, and health risk on health plan choice in the Medicare program. Health Serv. Res. 2004, 39, 847–864. [Google Scholar] [CrossRef] [PubMed]
  2. Buchmueller, T.C. Consumer Demand for Health Insurance; NBER Reporter, National Bureau of Economic Research, Inc.: Cambridge, MA, USA, 2006; pp. 10–13. [Google Scholar]
  3. Short, P.F.; Taylor, A.K. Premiums, benefits, and employee choice of health insurance options. J. Health Econ. 1989, 8, 293–311. [Google Scholar] [CrossRef]
  4. Trujillo, A.J.; Ruiz, F.; Bridges, J.F.P.; Amaya, J.L.; Buttorff, C.; Quiroga, A.M. Understanding consumer preferences in the context of managed competition. Appl. Health Econ. Health Policy 2012, 10, 99–111. [Google Scholar] [CrossRef]
  5. Blumberg, L.J.; Long, S.K.; Kenney, G.M.; Goin, D. Factors Influencing Health Plan Choice among the Marketplace Target Population on the Eve of Health Reform; Urban Institute: Washington, DC, USA, 2013. [Google Scholar]
  6. Altman, D. What new data tells us about doctors choice. The Wall Street Journal. 4 February 2016. Available online: https://blogs.wsj.com/washwire/2016/02/04/what-new-data-tell-us-about-doctor-choice/ (accessed on 28 September 2017).
  7. Stokes, T.; Tarrant, C.; Mainous, A.G.; Schers, H.; Freeman, G.; Baker, R. Continuity of care: Is the personal doctor still important? A survey of general practitioners and family physicians in England and Wales, the United States, and The Netherlands. Ann. Fam. Med. 2005, 3, 353–359. [Google Scholar] [CrossRef] [PubMed]
  8. Guthrie, B.; Saultz, J.W.; Freeman, G.K.; Haggerty, J.L. Continuity of care matters. BMJ Br. Med. J. 2008, 337, a867. [Google Scholar] [CrossRef]
  9. Turner, D.; Tarrant, C.; Windridge, K.; Bryan, S.; Boulton, M.; Freeman, G.; Baker, R. Do patients value continuity of care in general practice? An investigation using stated preference discrete choice experiments. J. Health Serv. Res. Policy 2007, 12, 132–137. [Google Scholar] [CrossRef]
  10. Higuera, L.; Carlin, C.S.; Dowd, B. Narrow provider networks and willingness to pay for continuity of care and network breadth. J. Health Econ. 2018, 60, 90–97. [Google Scholar] [CrossRef]
  11. Mainous, A.G.; Goodwin, M.A.; Stange, K.C. Patient-physician shared experiences and value patients place on continuity of care. Ann. Fam. Med. 2004, 2, 452–454. [Google Scholar] [CrossRef]
  12. Enthoven, A.; Kronick, R. Competition 101: Managing demand to get quality care. Bus. Health 1988, 5, 38–40. [Google Scholar]
  13. Statistica. Number of Monthly Active Twitter Users in the United States from 1st Quarter 2010 to 1st Quarter 2017 (in Millions). 2017. Available online: https://www.statista.com/statistics/274564/monthly-active-twitter-users-in-the-united-states/ (accessed on 22 July 2017).
  14. Stats IL. Twitter Usage Statistics. 2017. Available online: http://www.internetlivestats.com/twitter-statistics/ (accessed on 22 July 2017).
  15. Ben-Ami, Z.; Feldman, R.; Rosenfeld, B. Using multi-view learning to improve detection of investor sentiments on twitter. Computación y Sistemas 2014, 18, 477–490. [Google Scholar] [CrossRef]
  16. Bing, L.; Chan, K.C.; Ou, C. Public sentiment analysis in Twitter data for prediction of a company’s stock price movements. In Proceedings of the 2014 IEEE 11th International Conference on e-Business Engineering (ICEBE), Guangzhou, China, 5–7 November 2014. [Google Scholar]
  17. Chen, R.; Lazer, M. Sentiment analysis of twitter feeds for the prediction of stock market movement. Stanf. Edu. Retrieved 2013, 25, 2013. [Google Scholar]
  18. Rao, T.; Srivastava, S. Using Twitter Sentiments and Search Volumes Index to Predict Oil, Gold, Forex and Markets Indices; Delhi Institutional Repository: Delhi, India, 2012. [Google Scholar]
  19. Dijkman, R.; Ipeirotis, P.; Aertsen, F.; van Helden, R. Using twitter to predict sales: A case study. arXiv 2015, arXiv:150304599. [Google Scholar]
  20. Antenucci, D.; Cafarella, M.; Levenstein, M.; Ré, C.; Shapiro, M.D. Using Social Media to Measure Labor Market Flows; National Bureau of Economic Research: Cambridge, MA, USA, 2014. [Google Scholar]
  21. Llorente, A.; Garcia-Herranz, M.; Cebrian, M.; Moro, E. Social media fingerprints of unemployment. PLoS ONE 2015, 10, e0128692. [Google Scholar] [CrossRef]
  22. Hao, J.; Hao, J.; Dai, H.; Dai, H. Social media content and sentiment analysis on consumer security breaches. J. Financ. Crime 2016, 23, 855–869. [Google Scholar] [CrossRef]
  23. Bermingham, A.; Smeaton, A.F. On using Twitter to monitor political sentiment and predict election results. In Proceedings of the Workshop at the International Joint Conference for Natural Language Processing (IJCNLP), Chiang Mai, Thailand, 13 November 2011. [Google Scholar]
  24. Tumasjan, A.; Sprenger, T.O.; Sandner, P.G.; Welpe, I.M. Predicting elections with twitter: What 140 characters reveal about political sentiment. ICWSM 2010, 10, 178–185. [Google Scholar]
  25. Tumasjan, A.; Sprenger, T.O.; Sandner, P.G.; Welpe, I.M. Election forecasts with Twitter: How 140 characters reflect the political landscape. Soc. Sci. Comput. Rev. 2011, 29, 402–418. [Google Scholar] [CrossRef]
  26. Perez, S. Analysis of Social Media Did a Better Job at Predicting Trump’s win than the Polls. Tech Crunch. 2016. Available online: https://techcrunch.com/2016/11/10/social-media-did-a-better-job-at-predicting-trumps-win-than-the-polls/ (accessed on 24 July 2017).
  27. Broniatowski, D.A.; Paul, M.J.; Dredze, M. National and local influenza surveillance through Twitter: An analysis of the 2012–2013 influenza epidemic. PLoS ONE 2013, 8, e83672. [Google Scholar] [CrossRef] [PubMed]
  28. Culotta, A. Towards detecting influenza epidemics by analyzing Twitter messages. In Proceedings of the First Workshop on Social Media Analytics, Washington, DC, USA, 25–28 July 2010. [Google Scholar]
  29. Lamb, A.; Paul, M.J.; Dredze, M. Separating fact from fear: tracking flu infections on Twitter. In Proceedings of the North American Chapter of the Association for Computational Linguistics—Human Language Technologies (NAACL HLT) 2013 Conference, Atlanta, GA, USA, 9–14 June 2013. [Google Scholar]
  30. Lampos, V.; De Bie, T.; Cristianini, N. Flu detector-tracking epidemics on Twitter. In Proceedings of the Joint European Conference on Machine Learning and Knowledge Discovery in Databases, Barcelona, Spain, 20–24 September 2010; pp. 599–602. [Google Scholar]
  31. Signorini, A.; Segre, A.M.; Polgreen, P.M. The use of Twitter to track levels of disease activity and public concern in the US during the influenza A H1N1 pandemic. PLoS ONE 2011, 6, e19467. [Google Scholar] [CrossRef] [PubMed]
  32. Crannell, W.C.; Clark, E.; Jones, C.; James, T.A.; Moore, J. A pattern-matched Twitter analysis of US cancer-patient sentiments. J. Surg. Res. 2016, 206, 536–542. [Google Scholar] [CrossRef]
  33. Hawkins, J.B.; Brownstein, J.S.; Tuli, G.; Runels, T.; Broecker, K.; Nsoesie, E.O.; McIver, D.J.; Rozenblum, R.; Wright, A.; Bourgeois, F.T.; et al. Measuring patient-perceived quality of care in US hospitals using Twitter. BMJ Qual. Saf. 2016, 25, 404–413. [Google Scholar] [CrossRef]
  34. Dai, H.; Lee, B.R.; Hao, J. Predicting asthma prevalence by linking social media data and traditional surveys. ANNALS Am. Acad. Polit. Soc. Sci. 2017, 669, 75–92. [Google Scholar] [CrossRef]
  35. Gollust, S.E.; Qin, X.; Wilcock, A.D.; Baum, L.M.; Barry, C.L.; Niederdeppe, J.; Fowler, E.F.; Karaca-Mandic, P. Search and you shall find: Geographic characteristics associated with google searches during the affordable care act’s first enrollment period. Med. Care Res. Rev. 2016. [Google Scholar] [CrossRef] [PubMed]
  36. Wong, C.A.; Sap, M.; Schwartz, A.; Town, R.; Baker, T.; Ungar, L.; Merchant, R.M. Twitter sentiment predicts affordable care act marketplace enrollment. J. Med. Internet Res. 2015, 17, e51. [Google Scholar] [CrossRef] [PubMed]
  37. Davis, M.A.; Zheng, K.; Liu, Y.; Levy, H. Public response to Obamacare on Twitter. J. Med. Internet Res. 2017, 19, e167. [Google Scholar] [CrossRef] [PubMed]
  38. Deepu, S.; Raj, P.; Rajaraajeswari, S. A Framework for Text Analytics using the Bag of Words (BoW) Model for Prediction. In Proceedings of the 1st International Conference on Innovations in Computing & Networking (ICICN16), Bangalore, India, 12–13 May 2016. [Google Scholar]
  39. Mohammad, S.M.; Kiritchenko, S.; Zhu, X. NRC-Canada: Building the state-of-the-art in sentiment analysis of tweets. arXiv 2013, arXiv:13086242. [Google Scholar]
  40. Ganesh, J.; Gupta, M.; Varma, V. Interpretation of semantic tweet representations. arXiv 2017, arXiv:170400898. [Google Scholar]
  41. Mikolov, T.; Sutskever, I.; Chen, K.; Corrado, G.S.; Dean, J. Distributed representations of words and phrases and their compositionality. In Proceedings of the Advances in Neural Information Processing Systems 26, 27th Annual Conference on Neural Information Processing Systems 2013, Lake Tahoe, NV, USA, 5–10 December 2013. [Google Scholar]
  42. Hill, F.; Cho, K.; Korhonen, A. Learning distributed representations of sentences from unlabelled data. arXiv 2016, arXiv:160203483. [Google Scholar]
  43. Le, Q.; Mikolov, T. Distributed representations of sentences and documents. In Proceedings of the 31st International Conference on Machine Learning (ICML-14), Bejing, China, 22–24 June 2014. [Google Scholar]
  44. Wong, C.A.; Polsky, D.E.; Jones, A.T.; Weiner, J.; Town, R.J.; Baker, T. For third enrollment period, marketplaces expand decision support tools to assist consumers. Health Aff. 2016, 35, 680–687. [Google Scholar] [CrossRef]
Figure 1. Word associations for plan attributes and switching among health insurance tweets.
Applsci 09 02035 g001
Figure 2. Sentiments expressed in health insurance-related tweets in 2016‒2017 Affordable Care Act enrollment season.
Applsci 09 02035 g002
Table 1. Positive and negative emotions expressed on Twitter, by the words used in the tweets.
PositiveNegative
Doctor (trust)Pressure (negative)
Physician (trust)Die (fear, sadness)
Hospital (trust)Emergency (fear, anger, disgust, sadness)
Nurse (trust)Disease (fear, anger, disgust, sadness)
Plan (anticipation)Pain, surgery (fear, sadness)
Save money (joy)Miscarriage (fear, sadness)
Choice (positive)Cancer (fear, anger, disgust, sadness)
Note: In brackets are the emotions that the NRC Emolex associated with the word used in the tweets.
Table 2. Words associated with premium, access, and network.
Term in TweetsWords UsedAssociation
PremiumIncrease
relief
Obamacare
0.17
0.16
0.08
AccessNo-copay
ppact (planned parenthood), birth, women
Affordable Care Act
0.74
0.66, 0.51, 0.40
0.15
Networknarrow
providers
covering
0.23
0.16
0.08
SwitchBait
lockedin
rxrights
premium
network
0.31
0.14
0.13
0.08
0.08

