Article

Effect of Height and Geometry of Stepped Spillway on Inception Point Location

Department of Hydraulic Engineering, College of Civil Engineering and Architecture, Zhejiang University, Hangzhou 310058, China
*
Author to whom correspondence should be addressed.
Appl. Sci. 2019, 9(10), 2091; https://doi.org/10.3390/app9102091
Submission received: 28 April 2019 / Revised: 15 May 2019 / Accepted: 17 May 2019 / Published: 21 May 2019
(This article belongs to the Section Energy Science and Technology)

Abstract

:
Air entrainment in a stepped spillway is very important to protect the spillway from cavitation damage. The inception point is the location where air starts entering the non-aerated flow zone. The inception point location depends on different parameters, such as the discharge, step height, and step shape. In this paper, various stepped spillways, including flat steps, pooled steps, and round steps with different step heights were numerically simulated using the volume of fluid and realizable k-ε models. The results indicate that the inception point location moves downwards with the increase of the discharge of the stepped spillways. The length of the non-aerated flow zone increases with the discharge. The inception point location moves downwards as the step height decreases and the step number increases at the same discharge. The inception point location of the round stepped spillway model is much closer to the spillway crest than that of the flat stepped spillway with the same number of steps. The inception point location of the pooled stepped spillway is closer to the spillway crest than that of the flat stepped spillway, but more downstream than that of the round stepped spillway.

1. Introduction

A stepped spillway is an important hydraulic structure widely used in hydraulic projects owing to its high energy dissipation function. Due to the increase of the energy dissipation rate, the stilling basin at the toe of the dam requires less size than that of a smooth spillway [1,2]. Aeration is a process in which air enters the surface of a spillway. Without aeration, the spillway may be subjected to cavitation damage. Thus, aeration is necessary to prevent cavitation damage in stepped spillways. Air entrainment starts when the turbulent boundary layer coincides with the water depth. The point at which air entrainment starts is called the inception point, i.e., the location where a non-aerated flow zone is converted into an aerated flow zone [3,4].
The performance of a stepped spillway depends on the air entrainment. Since cavitation often occurs in the non-aerated flow zone, measurement of the exact location of air entrainment is necessary to determine the area affected by cavitation. The inception point location indicates the length of the non-aerated flow zone. Thus, by measuring the exact location of the inception point, the aerated and non-aerated flow zones can be predicted [5,6,7]. The location of the inception point is also very important for measuring the length of the stilling basin, because energy dissipation in a stepped spillway depends on the location of the inception point. The energy dissipation downstream of the inception point is much larger than that upstream. In a smooth spillway, the location of the inception point is further downstream than in a stepped spillway. The location of the inception point in a stepped spillway depends on the discharge, the step height and step geometry [8,9].
In a stepped spillway, three kinds of flows occur: nappe flow regime, transition flow regime, and skimming flow regime. The nappe flow regime occurs at very low discharge, where free falling jets fall in the form of nappes from one step to another. Skimming flow occurs at high discharge. In the skimming flow regime, the water moves above the pseudo-bottom as a coherent stream, where the pseudo-bottom is formed by connecting the edges of the steps. Beneath the pseudo-bottom, recirculating vortices are formed causing energy dissipation in the stepped spillway [10,11].
Skimming flow in a stepped spillway consists of two regions: non-aerated flow zone and aerated flow zone. The line connected to the edges of the step is called the pseudo-bottom. Beneath the pseudo-bottom, recirculating vortices are formed [12,13]. In Figure 1, Li is the distance from the spillway crest to the inception point. The less Li is, the greater is the amount of air that enters the water and vice versa. At the inception point, the pseudo-bottom air concentration is 0.01 [14] and the air phase suddenly changes from entrapped to entrained. Entrained air is transported within the flow, while entrapped air is transported above the water surface and between the crest. The sum of the entrained and entrapped air in a stepped spillway is called the total air concentration. A 5–8% pseudo-bottom air concentration is required to prevent cavitation damage [15]. The point at which the pseudo-bottom air concentration reaches 5–8% is called the critical point [16]. Beyond the inception point, the air concentration increases rapidly at the pseudo-bottom and quickly reaches the critical point, and then increases to the maximum value. Air entrainment can prevent cavitation damage caused by the occurrence of low pressure [17].
On increasing the discharge, the length of the non-aerated flow zone and the risk of cavitation both increase. The zone near the inception point is closely related to cavitation damage. The inception point in a stepped spillway is observed when the boundary layer thickness reaches 80% of the flow depth. The flow upstream of the inception point is smooth, while it is very turbulent downstream [18,19]. A mathematical formula was developed to measure the length of the inception point from the spillway crest (Li) for determining the start of air entrainment with slope of 22° [20]. Alghazali and Jasmin [21] experimentally measured the inception point location of different stepped spillway configurations. In their study, 12 different empirical equations were derived based on the experimental results for different configurations of stepped spillways. Hua et al. [22] experimentally measured the inception point of a stepped spillway model with a slope of 39.29°. Different models of different step heights were used and an empirical formula was derived based on their experiments.
Energy dissipation in a round-shaped stepped spillway increases by 3% compared with that in a flat stepped spillway. A round stepped spillway dissipates more energy due to very quick air entrainment of the skimming flow. Hence, the length of the training wall height in a round stepped spillway decreases by approximately 20%. The risk of cavitation in a round stepped spillway is also less than that of a flat stepped spillway [23].
Felder and Chanson [24] conducted experiments on pooled and flat stepped spillways with slopes of 8.9° and 26.6°. The results showed that energy dissipation in the pooled stepped spillway is larger than in the flat stepped spillway with a smaller slope. In the pooled stepped spillway, the mean air concentration is larger than that in the flat stepped spillway. Munta and Otun [25] performed 40 experiments on three different stepped spillway models to study the relationship among the inception length, the discharge, and the chute angle. It was found that the inception length increases with the discharge but decreases with the chute angle.
Physical modelling of a stepped spillway is very difficult and does not always yield accurate results to develop physical models for experiments. Fortunately, with the development of high-performance computers, the computational fluid dynamics (CFD) technique has been developed. Chen et al. [26] found that CFD is a very authentic and reliable source to simulate the flow over a stepped spillway. The k-ε turbulence model was used to simulate turbulent flow in a stepped spillway. Imam and Mehdi [27] studied the energy dissipation in a stepped spillway by numerical modelling with different parameters and investigated the effects of these parameters on energy dissipation. The parameters involved in energy dissipation include the step height, the number of steps, the spillway slope and the unit discharge. Afshin and Mitra [28] used the well-known commercial software ANSYS Fluent with different numerical models. They used the volume of fluid (VOF) and the mixture model to simulate the flow in a stepped spillway and evaluated the performance of each model to determine which one accurately simulated the skimming flow over a stepped spillway. Parsaie et al. [29] performed numerical simulation with the help of turbulent modelling and concluded that turbulent modelling is a very good and efficient method to determine the complexity of stepped spillway flow. In their study, Flow 3D software was used for numerical simulation. Qian et al. [30] simulated a spillway model with the help of four different turbulence models: realizable k-ε, k-ω, shear stress transport k-ω, and large eddy simulation (LES). Spillway models were simulated using these four turbulence models and the results compared. The results obtained with the realizable k-ε model were more accurate than the other three turbulence models. Benmamar et al. [31] conducted a numerical simulation and developed a numerical model for determining the boundary layer in a stepped spillway with a steep slope. The numerical model was based on the implicit finite difference scheme. Cheng et al. [32] measured the air–water volume fraction of two-phase flow using k-ε models. Dong and Lee [33] used the VOF multiphase model to simulate the stepped spillway model with slope of 10° and to determine the characteristics of the skimming flow. Their results included velocity distribution, air concentration, and pressure distribution. It was concluded that the VOF model accurately simulates the flow pattern over a stepped spillway. Bombardelli et al. [34] used the VOF and renormalized group (RNG) turbulence model to simulate the stepped spillway with a slope of 53°. They obtained the velocity distribution, and turbulent kinetic energy. Tabbara et al. [35] numerically simulated the flow over a stepped spillway using different step configurations, using the ADINA software with the k-ε flow model. In the prediction of the water surface profile and energy dissipation values, the results showed good agreement between the numerical and experimental values. Cheng et al. [36] used ANSYS Fluent software to simulate the flow over a stepped spillway. A mixture flow model was used as the numerical model and the RNG k-ε model was used as the turbulence model. They studied the skimming flow region and determined the interaction between cavity recirculation and air bubbles present in the skimming flow zone. The velocity distribution on the steps was also determined in their investigation. Mohammad et al. [37] used the VOF model and the turbulence models RNG and LES to simulate the interaction between air and water using stepped spillway models with a steep slope. Bai and Zhang [38] simulated a different type of stepped spillway called the V-type stepped spillway. They analyzed the pressure distribution by five different turbulence models and compared it with the physical values. By comparing the values with the physical model, it was suggested that the realizable k-ε model gave better results for simulating the pressure distribution than the others turbulence models. Li and Zhang [39] simulated pooled stepped spillways with four types of pool weirs (full pool, full pool and two-sided pool, full pool and central pool, two-sided and central pool) using the VOF and RNG turbulence models. It was suggested that the energy dissipation rate in the different types of pooled weirs followed the order, two-sided and central pool, full pool and central pool, full pool and two-sided pools, and full pool. Cheng et al. [40] measured the logarithmic velocity profile in a stepped spillway using numerical simulation and compared it with experiments. According to their researches, the air inception location over stepped spillways exits until the boundary layer thickness is between the range of 0.72 and 0.79. Ljubicic et al. [41] studied the adverse slope stilling basins with stepped chutes. They studied the momentum, the length of the hydraulic jump, and the energy dissipation by the numerical model, and then compared the results with the experimental data. Wan et al. [42] predicted the cavitation damage in a high-speed smooth spillway using numerical simulation. VOF and the standard k-ϵ turbulence model were used to simulate the high-speed flow and the potential cavitation region in the high-speed smooth spillway. The numerical results and the experimental measurement showed a good agreement.
The main aim of this research was to study the effect of different parameters, i.e., the discharge, step height, and step geometry, on the inception point location by numerical simulations. Different numerical experiments were conducted on different step spillway models using multiphase VOF combined with the realizable k-ε turbulence model. The different step spillway models differ in the various step heights and step geometry configurations, including flat, pooled and round. The data shows how the inception point location varies with the discharge, step height, and step geometry. The results improve the understanding of stepped spillways with respect to air entrainment, and provide a reference for optimal design of proper air entrainment for the stepped spillway. The results also identify the step geometry that provides more aeration and earlier air entrainment into the water to reduce cavitation damage in stepped spillways.

2. Materials and Methods

Numerical modelling is a widely applied technique performed with the aid of a computer to solve the Navier–Stokes equation, which is based upon the conservation of mass, energy, and momentum. CFD software is used to simulate the stepped spillway models. Fluent software uses the finite volume method (FVM) to discretize the Navier–Stokes equation. The FVM method is the most commonly used method to discretize the dynamic equations in CFD. The control volume technique converts the governing equation into algebraic equations rather than solving the equations numerically. Integration equations for the control volume are solved in an implicit form.
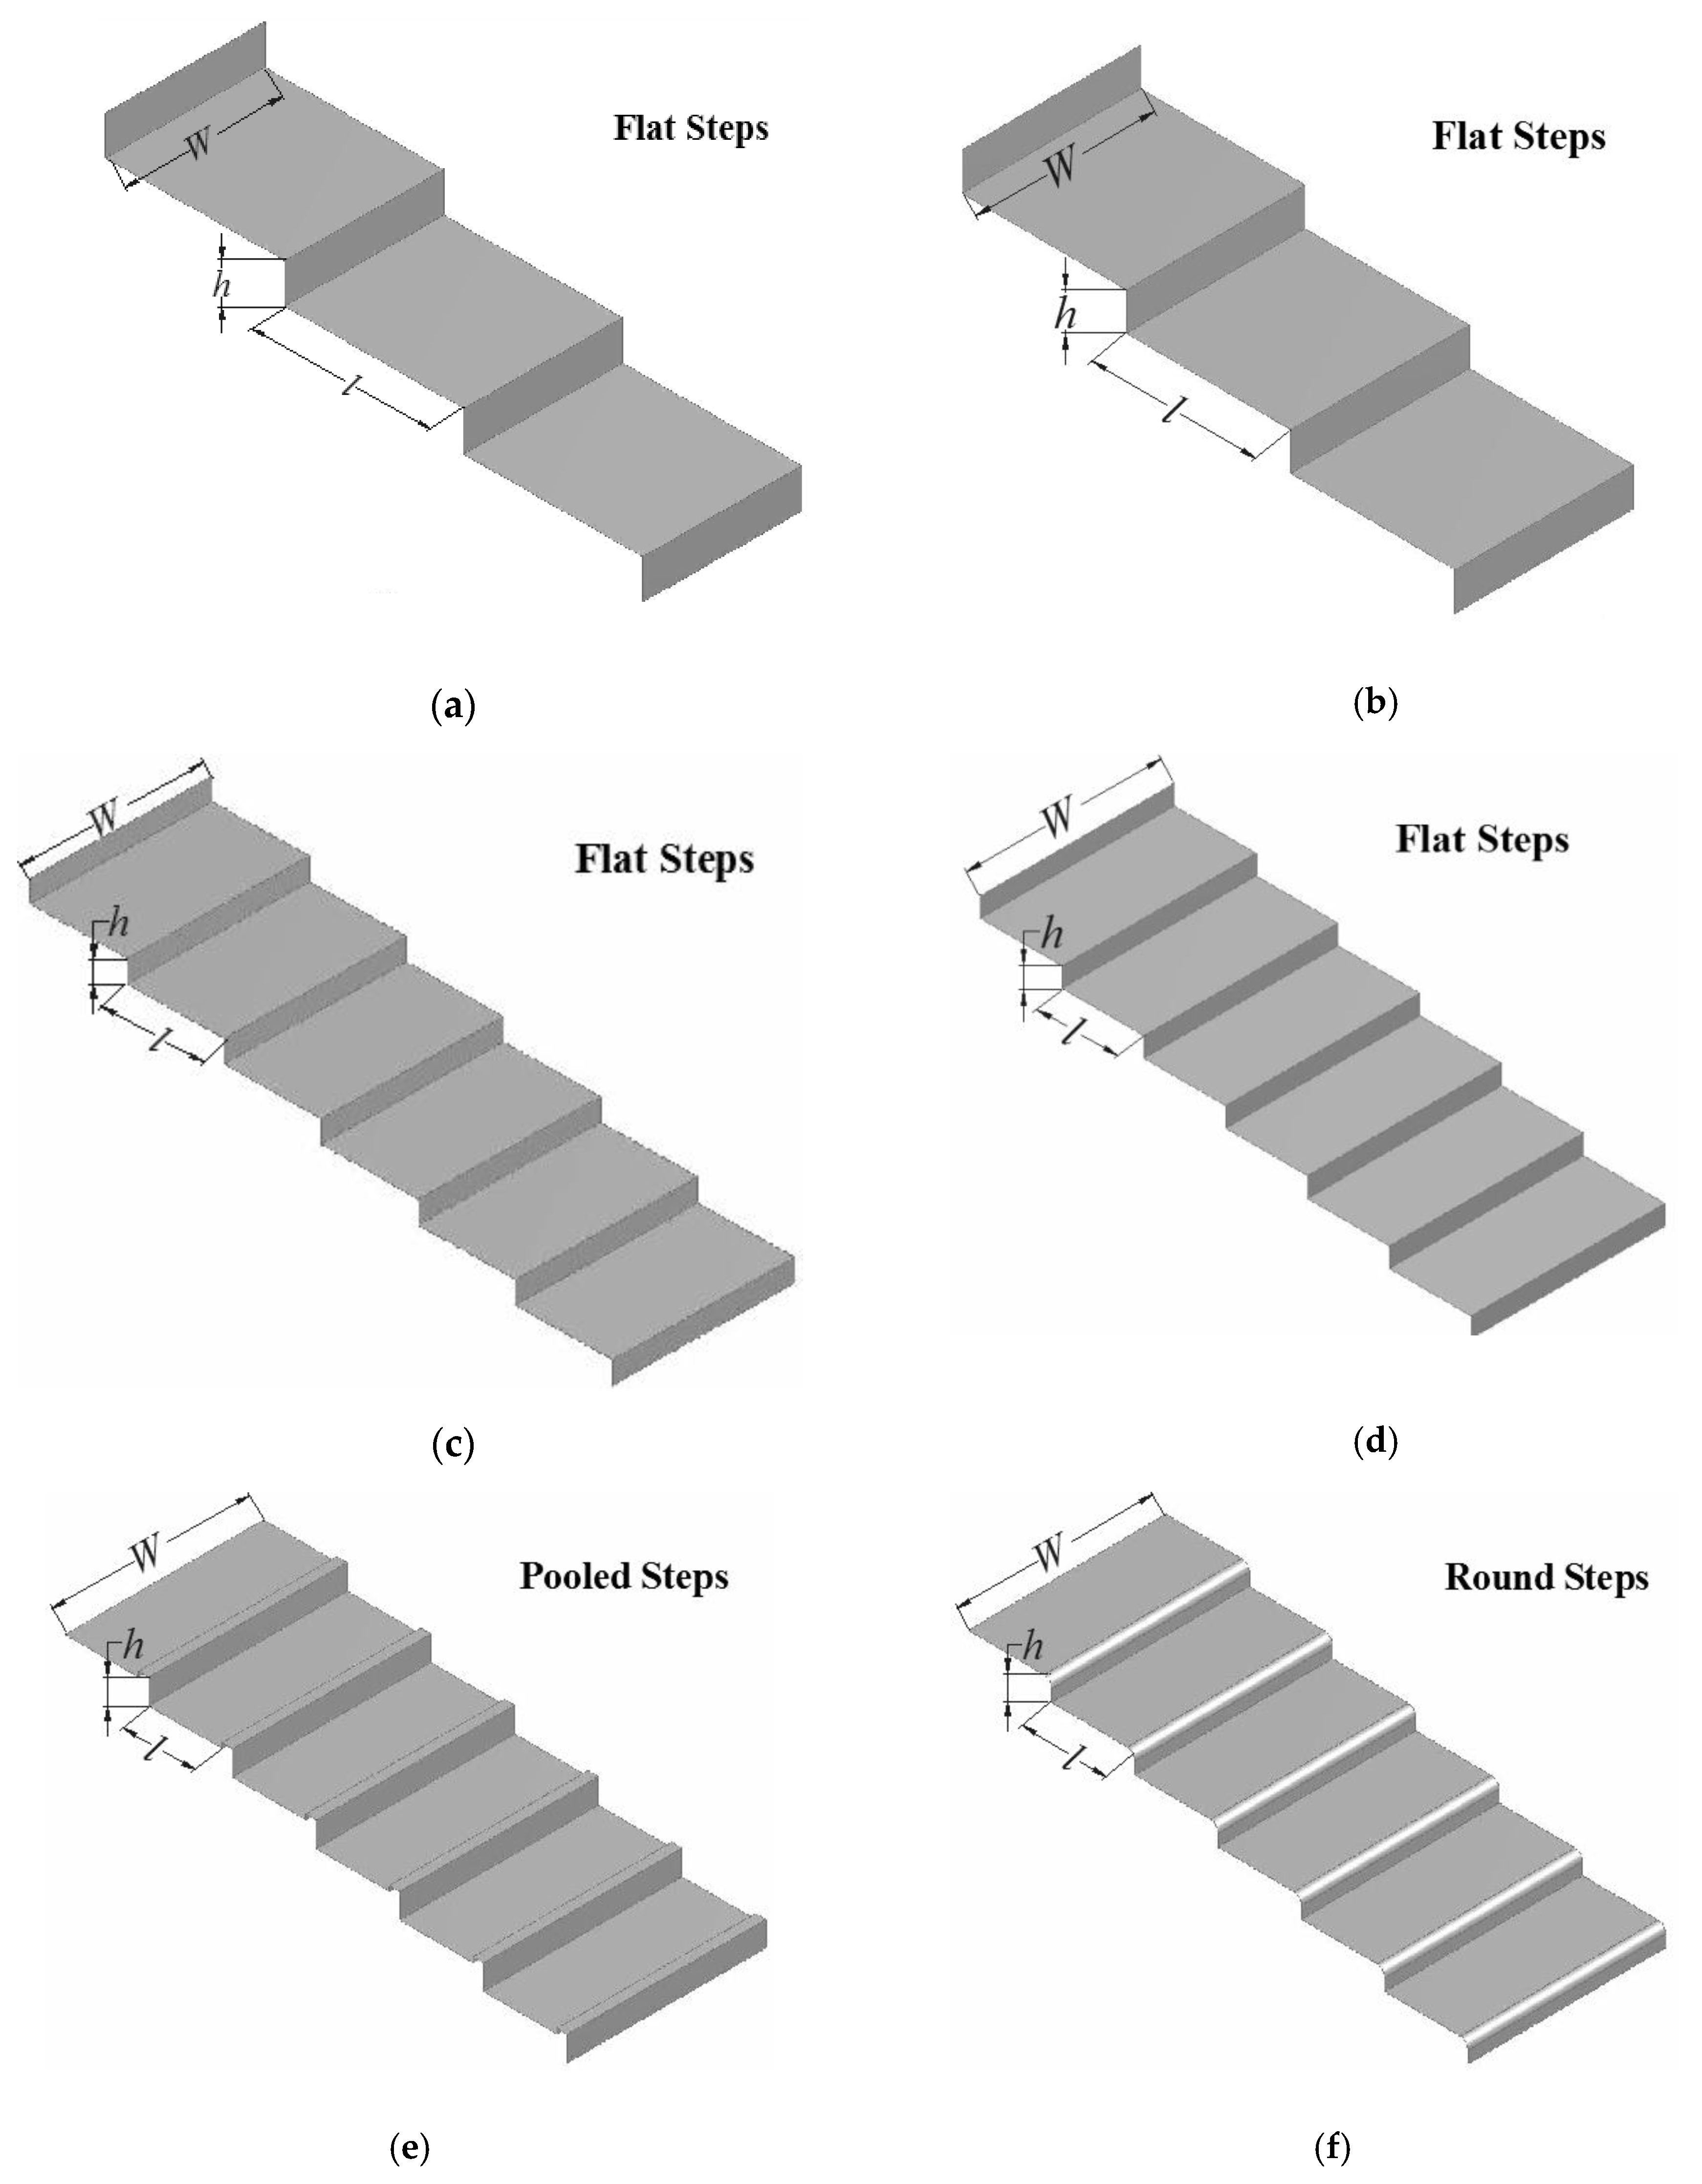
Six kinds of stepped spillway models with different step sizes and configurations used for numerical simulation are listed in Table 1. The models varying according to step height with flat, pooled, and round steps, are shown in Figure 2. All the six models were simulated respectively, using VOF as the multiphase model and the realizable k-ε model as the turbulence model. The slope of all the models is held constant.
The inlet boundary condition of the stepped spillway model is represented by the discharge. In the initial state, there is no water in the spillway and the spillway surface is directly connected to the atmosphere. The outlet boundary condition of the spillway is set by pressure. All the walls are stationary with no slip velocity. The three-dimensional grid models and boundary conditions used for computation are shown in Figure 3. The results of the three-dimensional model are better than those of the two-dimensional model because the three-dimensional model consider the air phase more accurately than the two-dimensional model.
The calculation domain is discretized into an unstructured grid with 194,447 mesh elements and the number of nodes used for computation is 215,760. The inflation layer is applied to the steps to yield better results. The area around the steps is particularly considered to achieve better results. Therefore, 10 layers of inflation are applied on the steps to better study the flow of the spillway.

2.1. VOF (Volume of Fluid)

VOF is the multiphase model developed by Hirt and Nichols [43]. It is usually used when two or more phases are involved. In this model, it is assumed that the different phases will not intermingle with each other. In free surface flow, as dealt with in the present study, the purpose is to track the interface between air and water. Therefore, it is appropriate to use VOF especially when the position of the interface between the different phases is the point of interest. The VOF method tracks the interface as a mixture cell, while other multiphase models only focus on bubbles tracking. Previous literature indicates [44] that the results from other multiphase models are unsatisfactory when the interface is considered. Thus, in the present study, the VOF model is used to accurately predict the interface between water and air. When the VOF model involves two phases, water and air, then the volume fraction of fluid can be regarded as 0 if the cell does not contain any water, while 1 represents it is fully filled with water. If the value is between 0 and 1, it indicates that it is a mixture cell, seen as an interface between water and air, and a free surface between water and air. Here, the factor α is introduced, which indicates the value of the phases in each cell. The factor α a is the volume fraction of air and α w is the volume fraction of water.
Equation (1) indicates that if the value of α is between 0 and 1, then there is an interface between water and air, and it is a free surface that can be tracked by the VOF method.
α a + α w = 1
The properties of any cell are either representative of one phase or the mixture. All the properties of a cell such as velocity, pressure, and temperature are shared due to the concept of volume fraction. The total volume fraction of all the phases in a cell is equal to unity. The density ρ of the cell is calculated from Equation (2). The meaning of symbols in the equations is shown at the end of the text.
ρ = α w ρ w + α a ρ a = α w ρ w + ( 1 α w ) ρ a
The VOF method solves the continuity and momentum equations and measures the volume fraction of each phase by tracking Equations (3)–(5).
ρ t + ρ μ i x i = 0
ρ μ i t + ρ μ i μ j x j = P x i + x j ( μ + μ t ) ( u i x j + u j x i )
α w t + μ i α w x i = 0

2.2. Realizable k-ε Model

The steps in a spillway have a significant effect on increasing the roughness. Owing to the effect of roughness, the flow over a stepped spillway is highly turbulent. Two-phase flow over a stepped spillway can generate an even higher turbulence rate. Thus, a turbulent model is used to predict the turbulent behavior. The realizable k-ε model was introduced by Shih et al. [45] for high Reynolds number turbulent flow, which is based upon the realizable constraints. The realizable k-ε model gives better results than other turbulence models because a new equation for the dissipation rate (ε) is proposed, which is based upon the large turbulent Reynolds number. The performance of the realizable k-ε model is improved and provides good results for the recirculating flow. Other Reynolds-averaged Navier–Stokes (RANS) models such as the standard k-ε model, RNG k-ε, standard k-ω, and shear stress transport k-ω models perform well when used for simulating other types of flows like pipe or laminar flows. Because of the unsatisfactory results from other RANS models for recirculating flow, considering that the flow in the stepped spillway is recirculating, realizable k-ε is used in the present study. The transport equations for turbulent kinetic energy (k) and turbulent dissipation rate (ε) are expressed as Equations (6) and (7), respectively. The meaning of all the symbols in Equations (6) and (7) is shown at the end of the text.
t ( ρ k ) + x i ( ρ k u j ) = x i [ ( μ + μ t σ k ) k x j ] + G k + G b ρ ε Y M + S k
t ( ρ ε ) + x j ( ρ ε μ j ) = x j [ ( μ + μ t σ ε ) ε x j ] + ρ C 1 S ε ρ C 2 ε 2 k + υ ε + C 1 ε ε k C 3 ε G b + S ε

3. Results and Discussions

Various stepped spillway models with different step heights and configuration were simulated to predict the location of the inception point in the stepped spillways. All the stepped spillway models were simulated at different discharge rates (0.8, 1, 1.2, and 1.4).

3.1. Effect of Step Height on Inception Length Using Flat Stepped Spillways

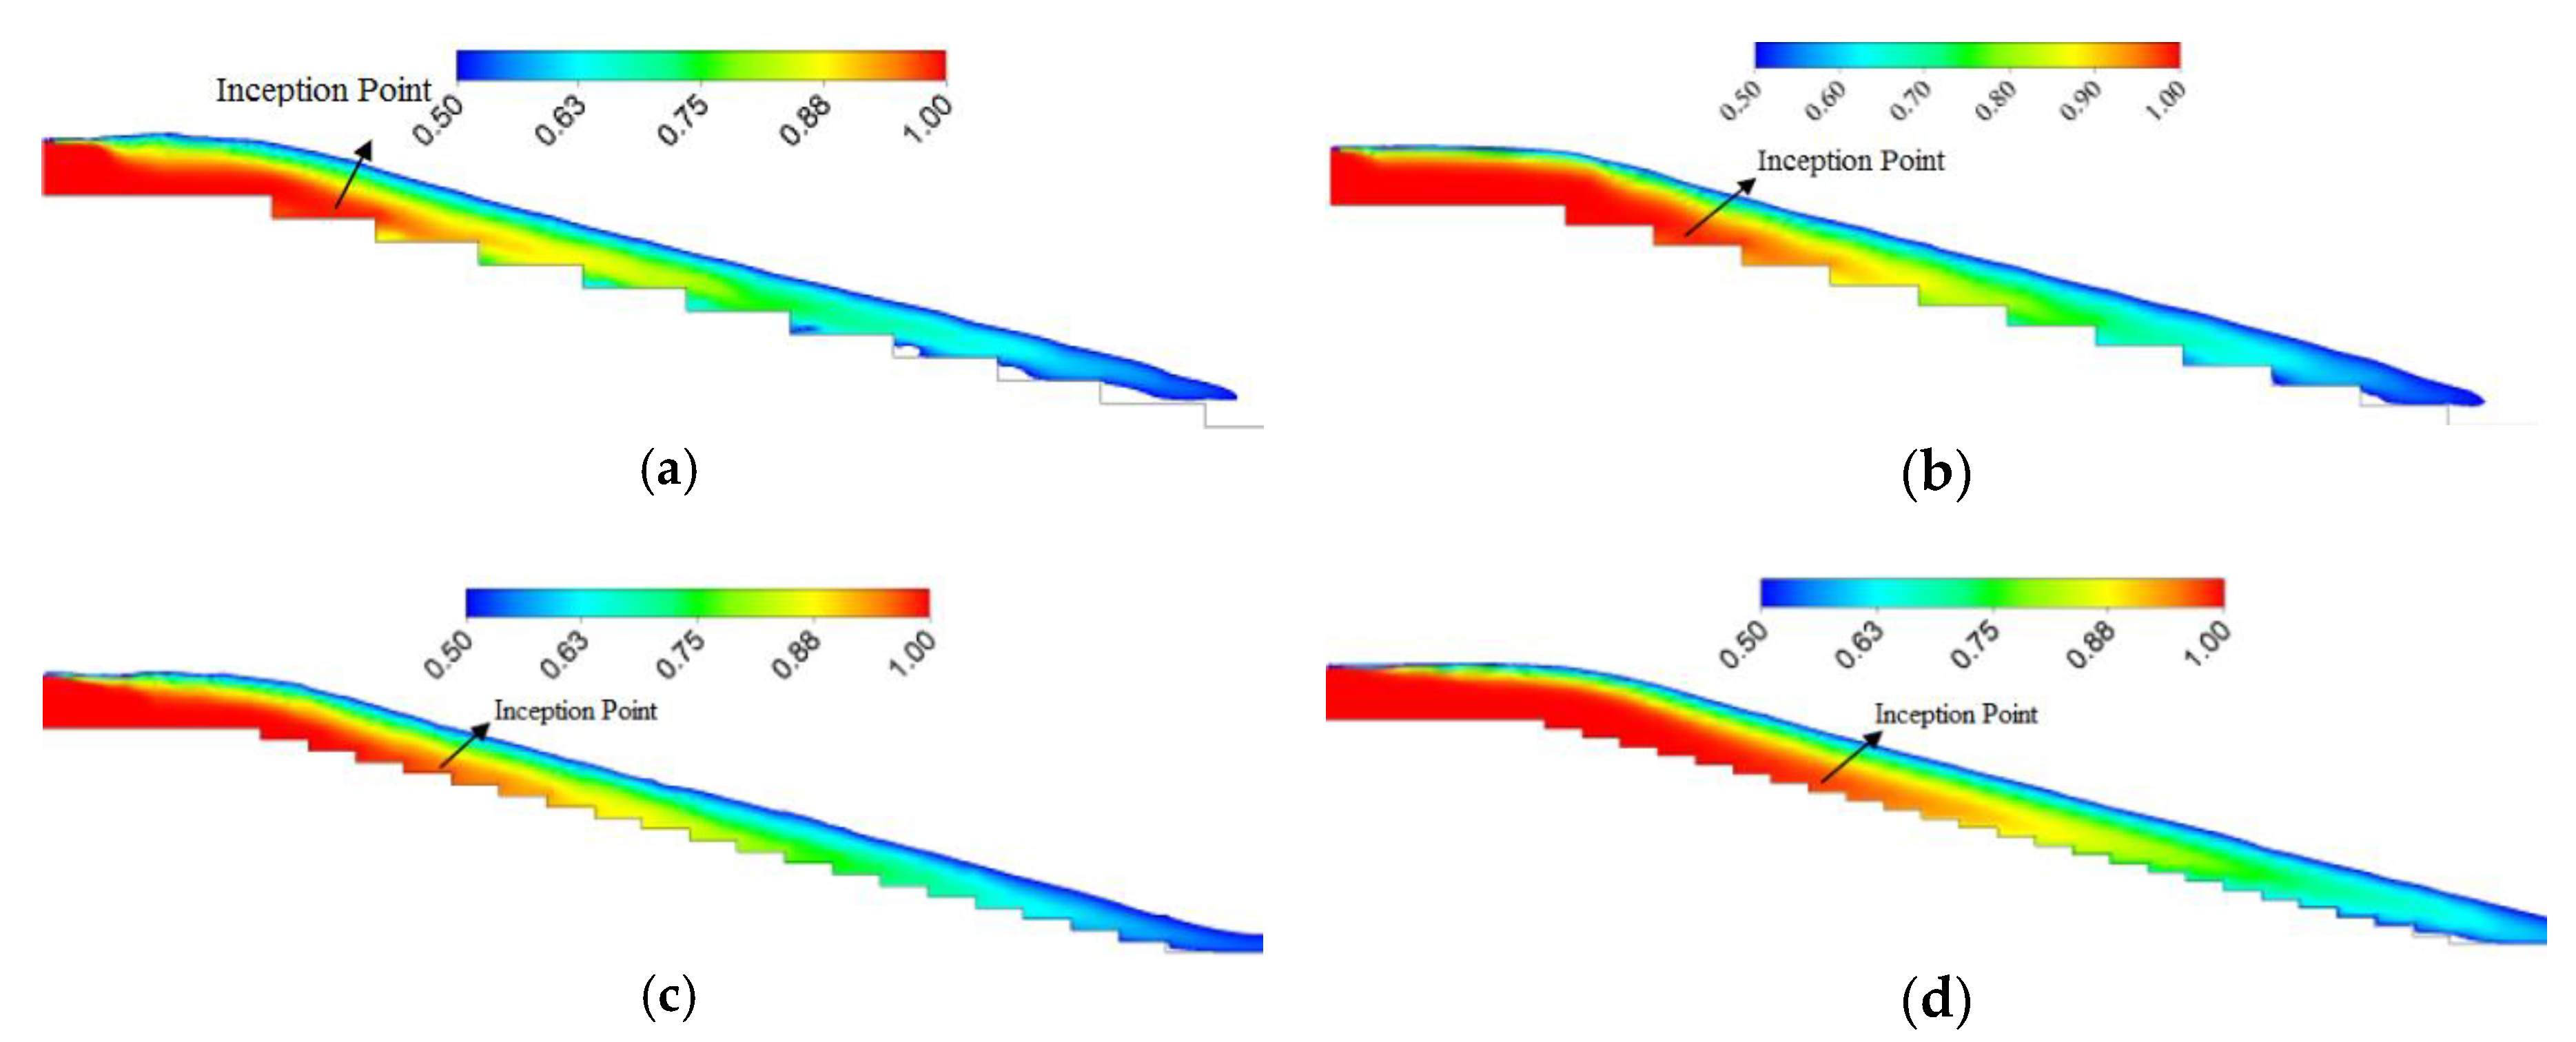
Four stepped spillway models with different step heights (0.10, 0.09, 0.05, and 0.04 m) were simulated to predict the changes in inception length with the decrease in step height. The inception point is closer to the spillway crest with a larger step height under the same discharge. The results also reveal that the inception point length increases with the discharge in all stepped spillway models. The comparison between the VOF results of the inception point lengths with different step heights when the discharge is 0.8 m2 /s is shown in Figure 4. It is seen clearly that with the decrease in step height, the inception point moves downward under the same discharge.
The inception lengths (Li) with respect to discharge, step height, and Froude surface roughness (F) are listed in Table 2. With increase of discharge, the inception length increases under the conditions of the same number of steps. With the increase in the number of steps, the inception length also increases under the same discharge. The Froude surface roughness, defined with respect to surface roughness (ks = hcosθ), which depends on unit discharge (q) and step height, is illustrated as Equation (8). The symbols in the equation are listed at the end of the text.
F = q g sin θ κ s 3
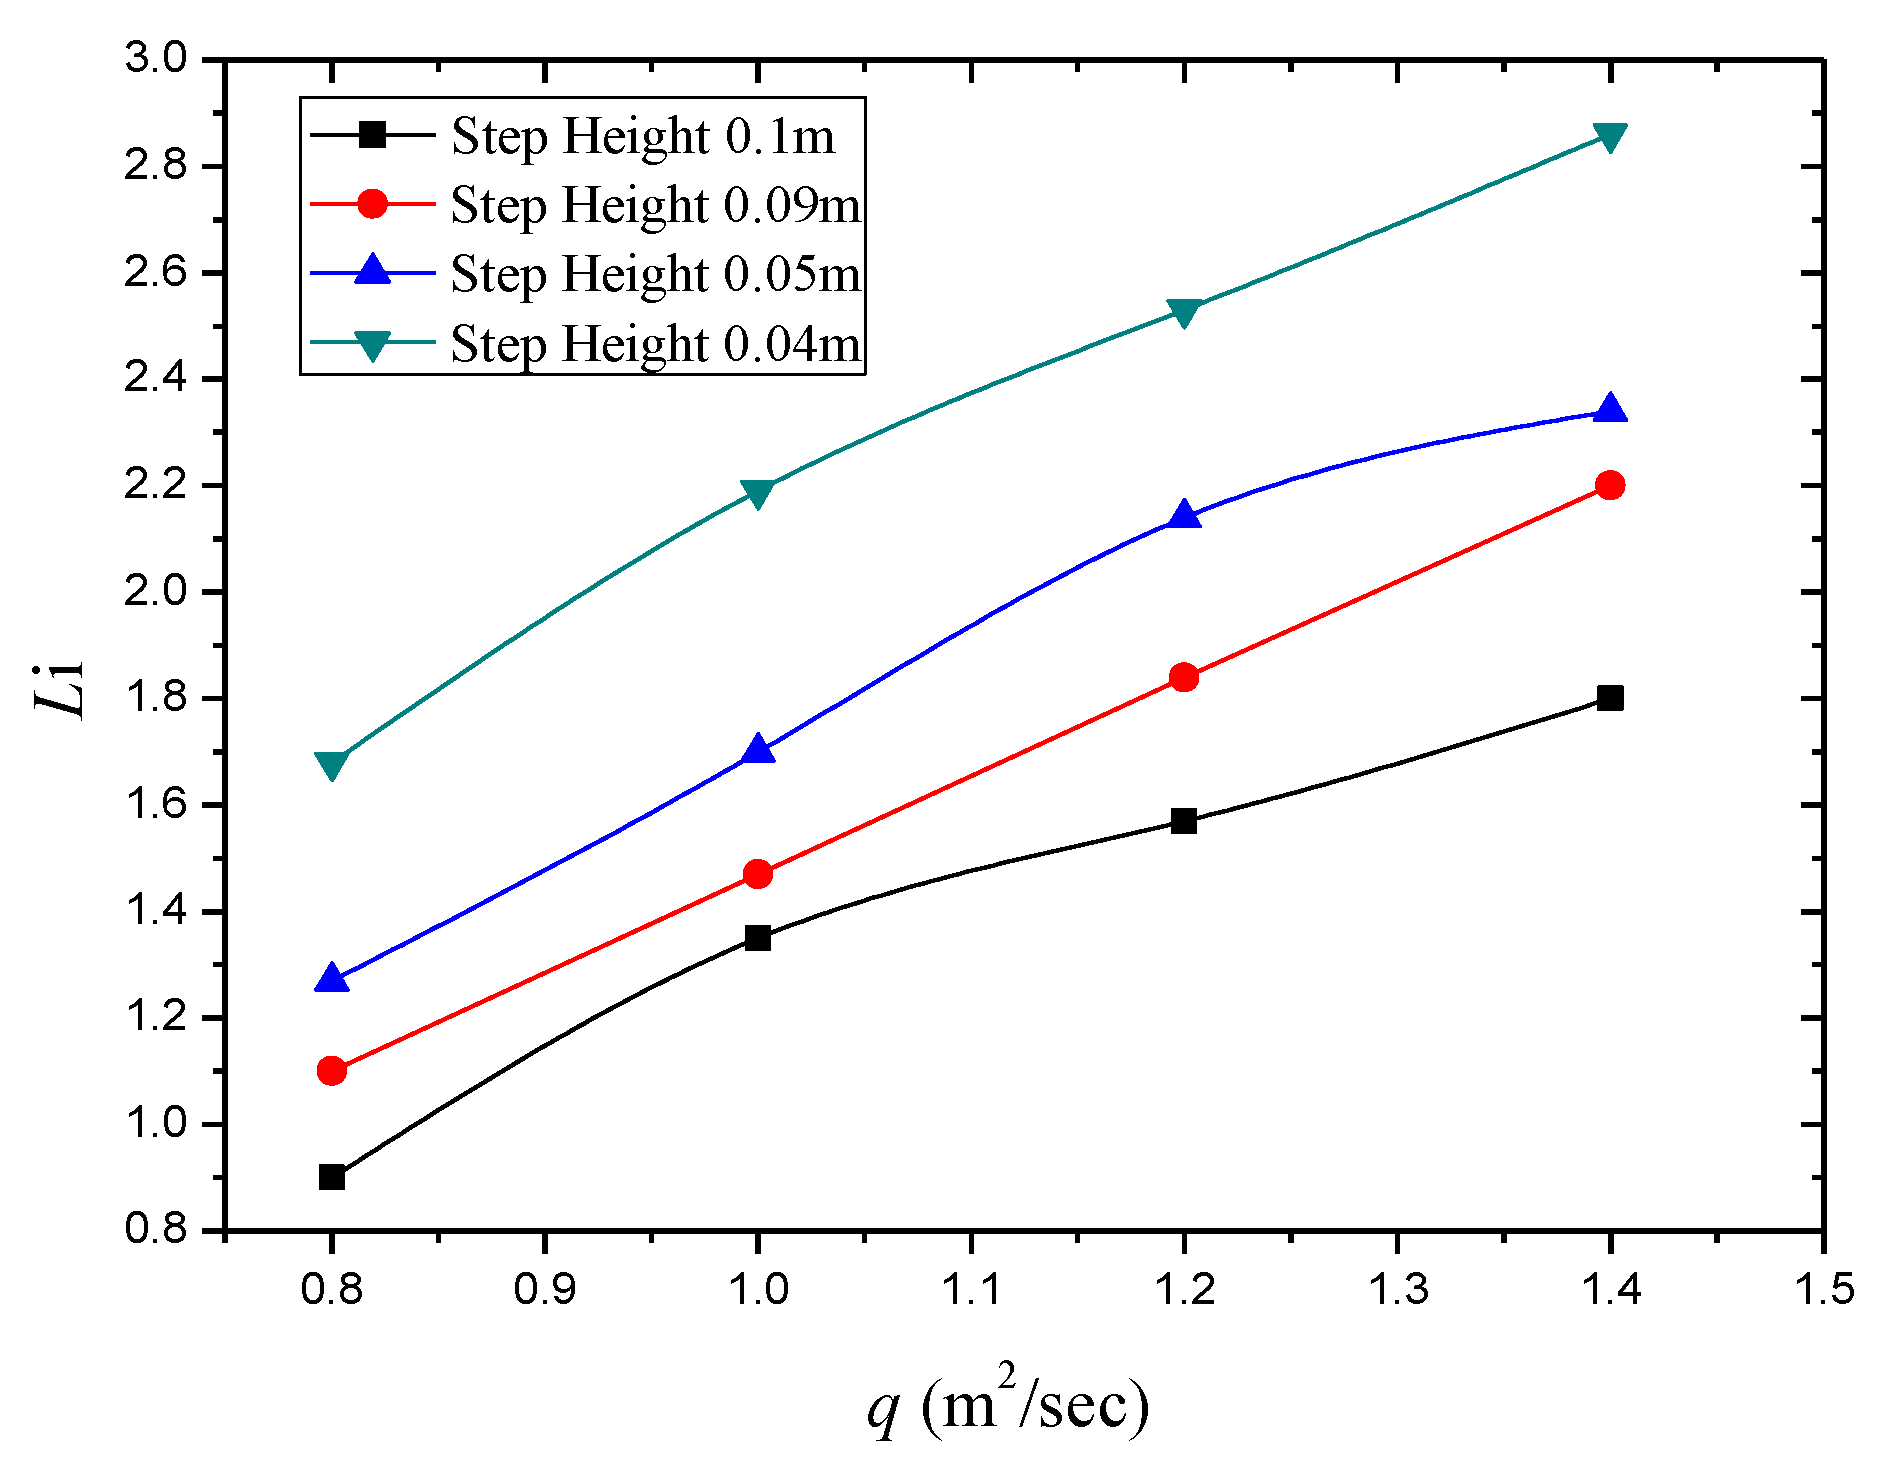
The variation of the inception length (Li) with respect to the discharge at different step heights is shown in Figure 5. The trend of the figure shows that at the highest discharge, the inception length is the maximum under all the conditions of different step heights. With the decrease in step height, the inception length increases under the same discharge.
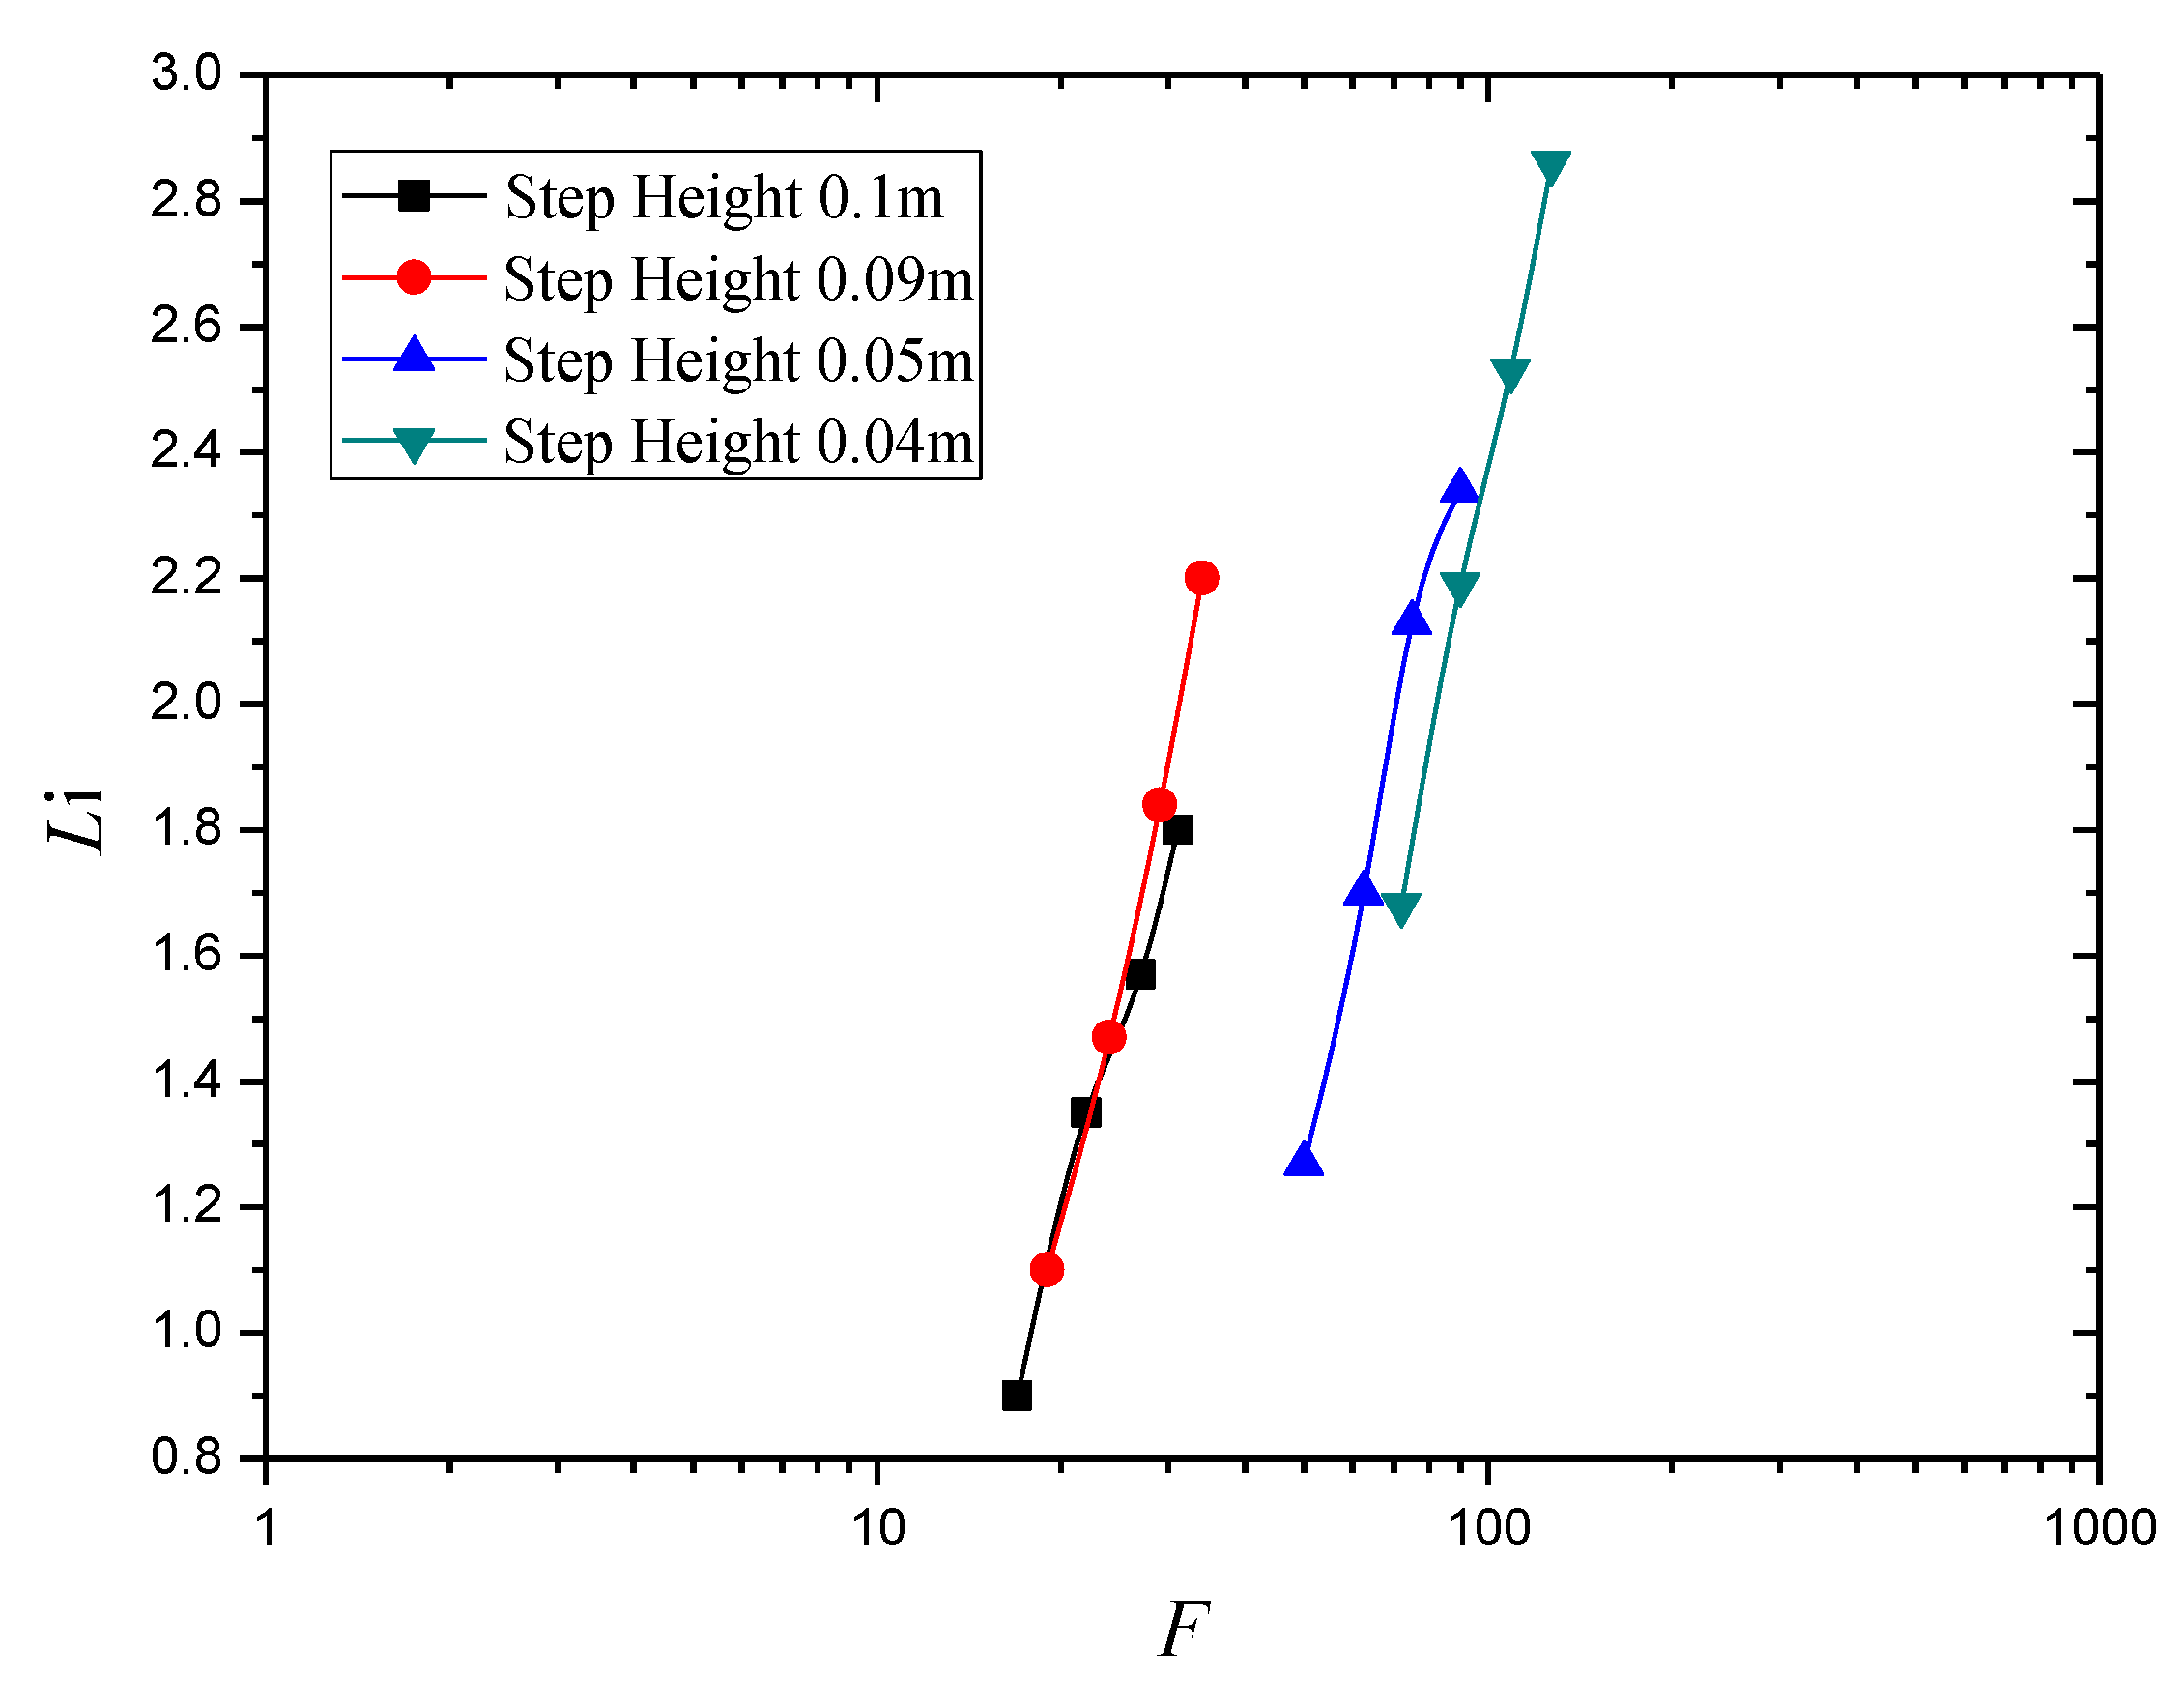
The relationship between inception length (Li) and Froude surface roughness (F) at different step heights is shown in Figure 6. With the increase in Froude surface roughness, the inception length increases. According to Equation (8), Froude surface roughness (F) increases with the decrease in step height and the increase in discharge. It is also apparent from Figure 6 that the Froude surface roughness (F) values increase with the decrease of the step height.
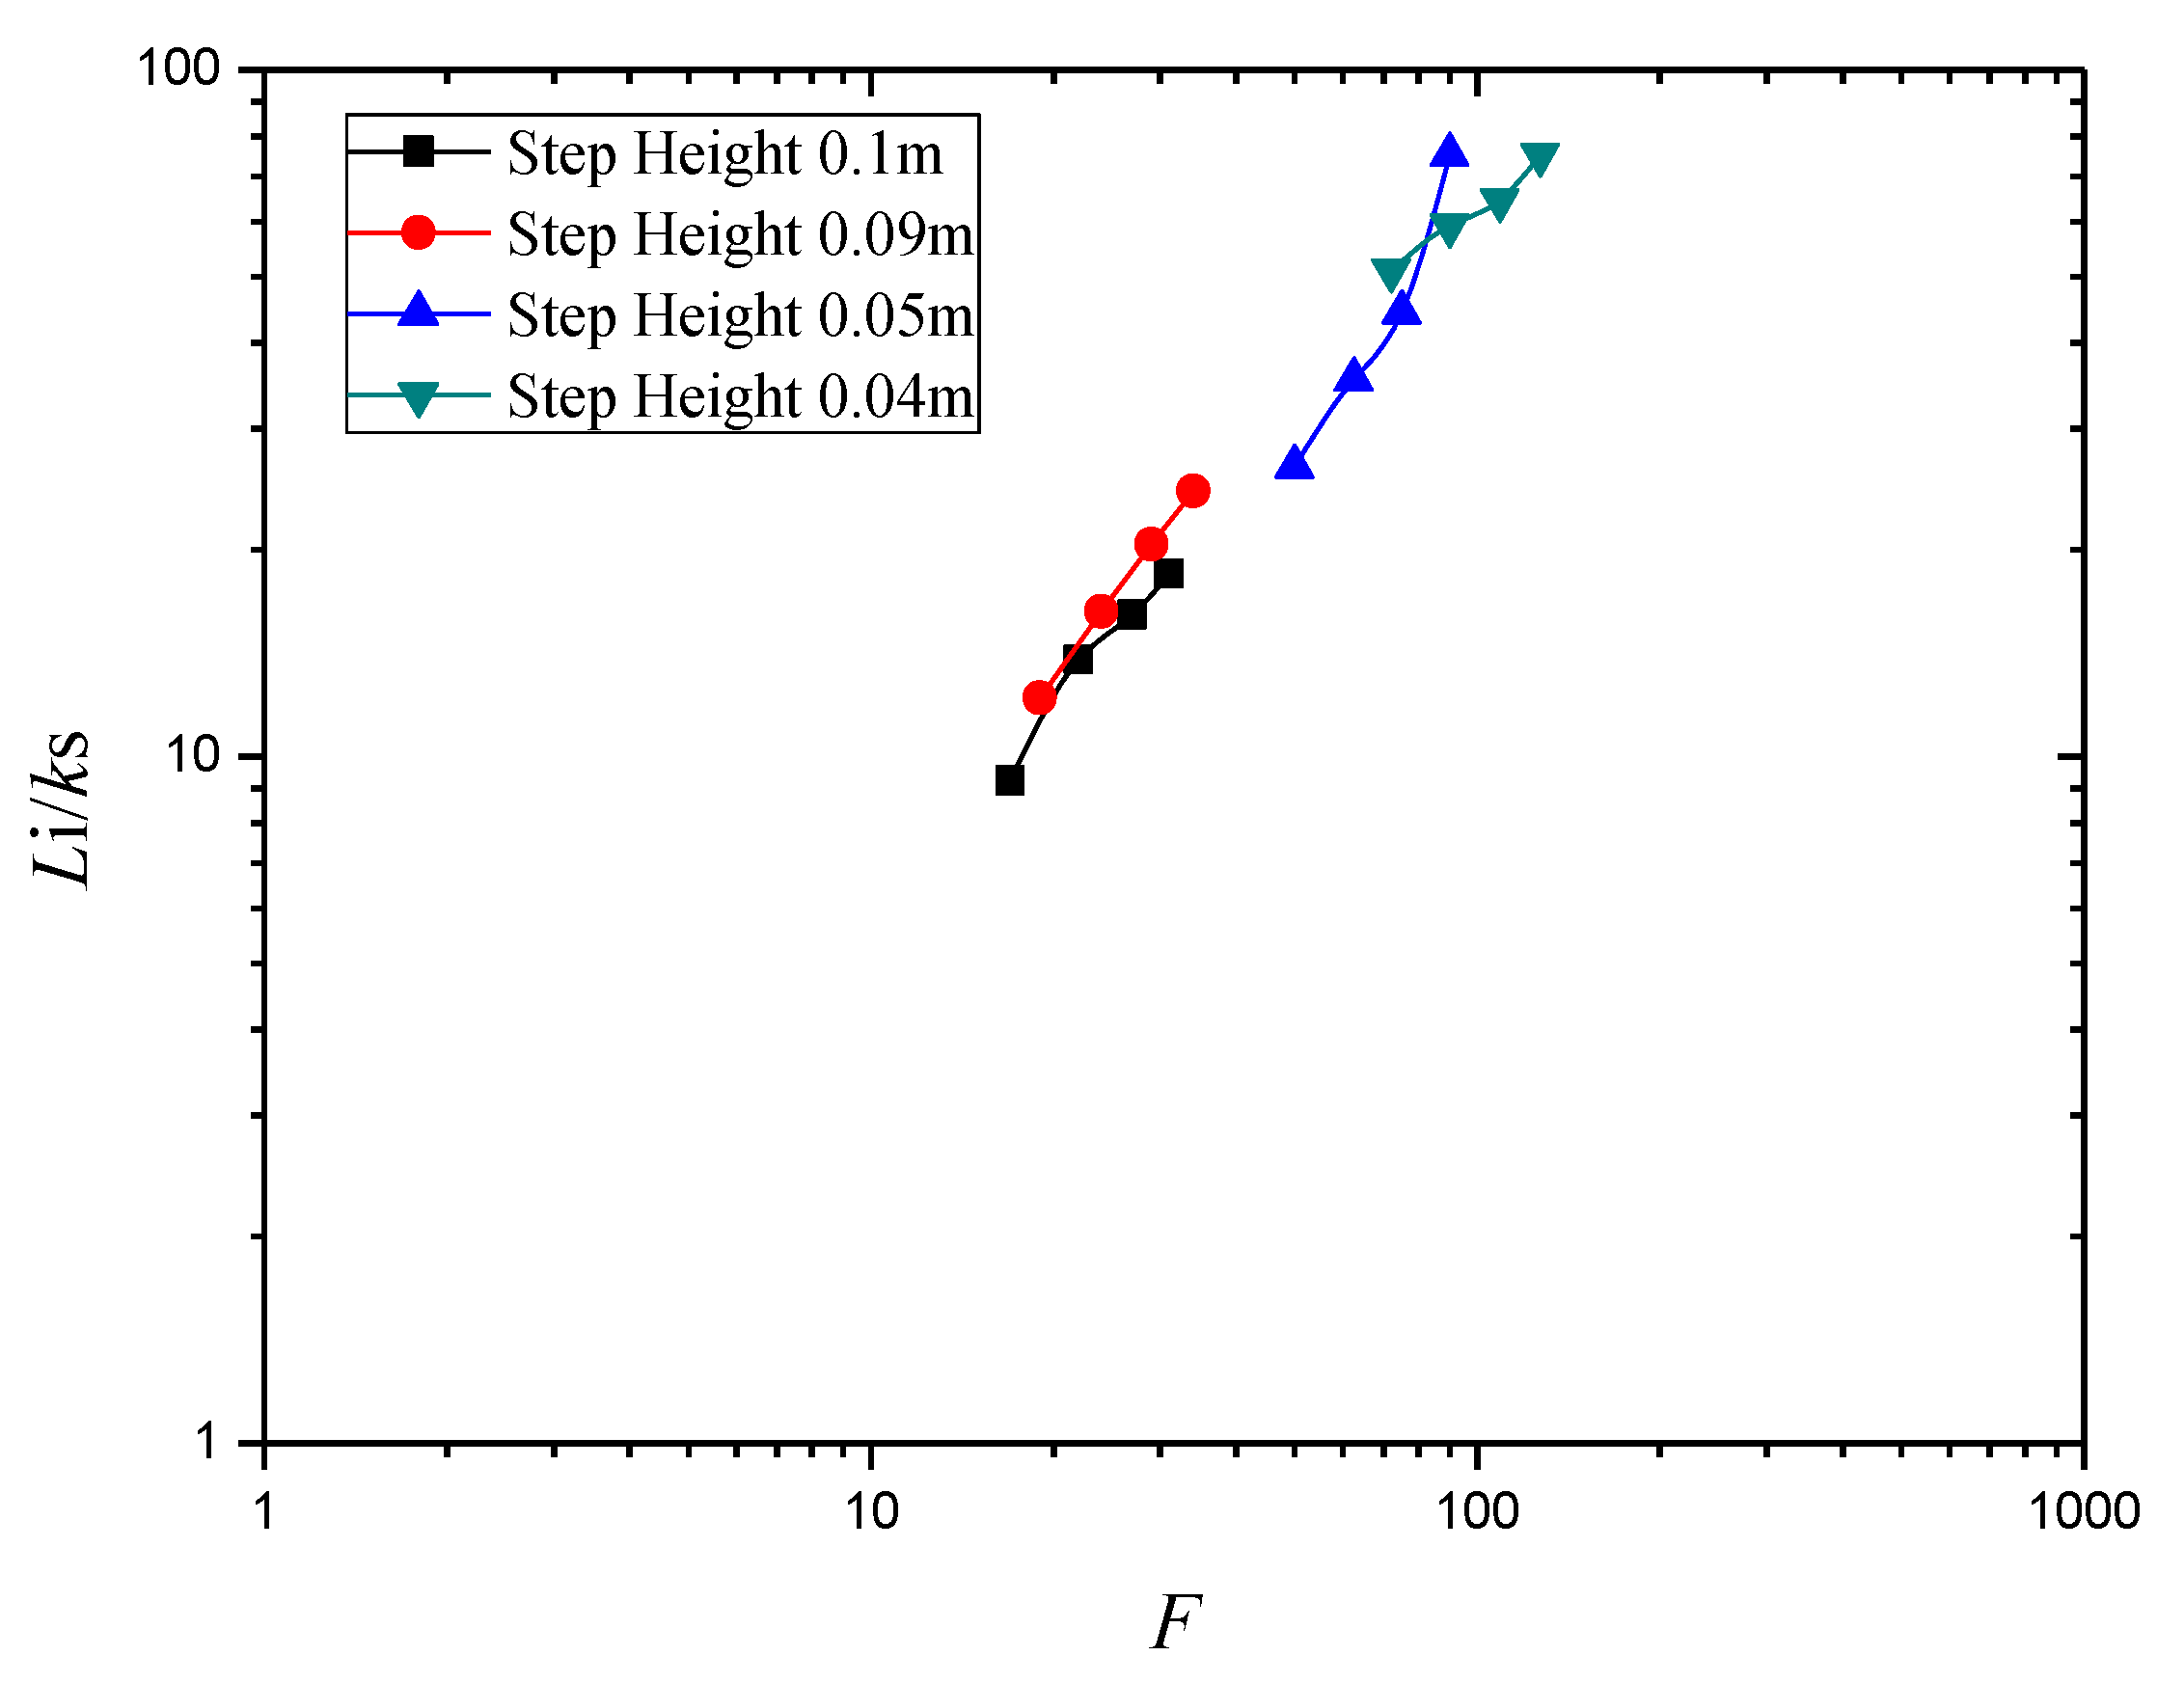
The relationship between normalized Li and Froude surface roughness is shown in Figure 7. Normalized Li is the ratio of the inception length (Li) and Froude surface roughness (ks). Figure 7 shows that the normalized Li increases with the Froude surface roughness.

3.2. Effect of Step Geometry on Inception Length Using Different Step Shapes

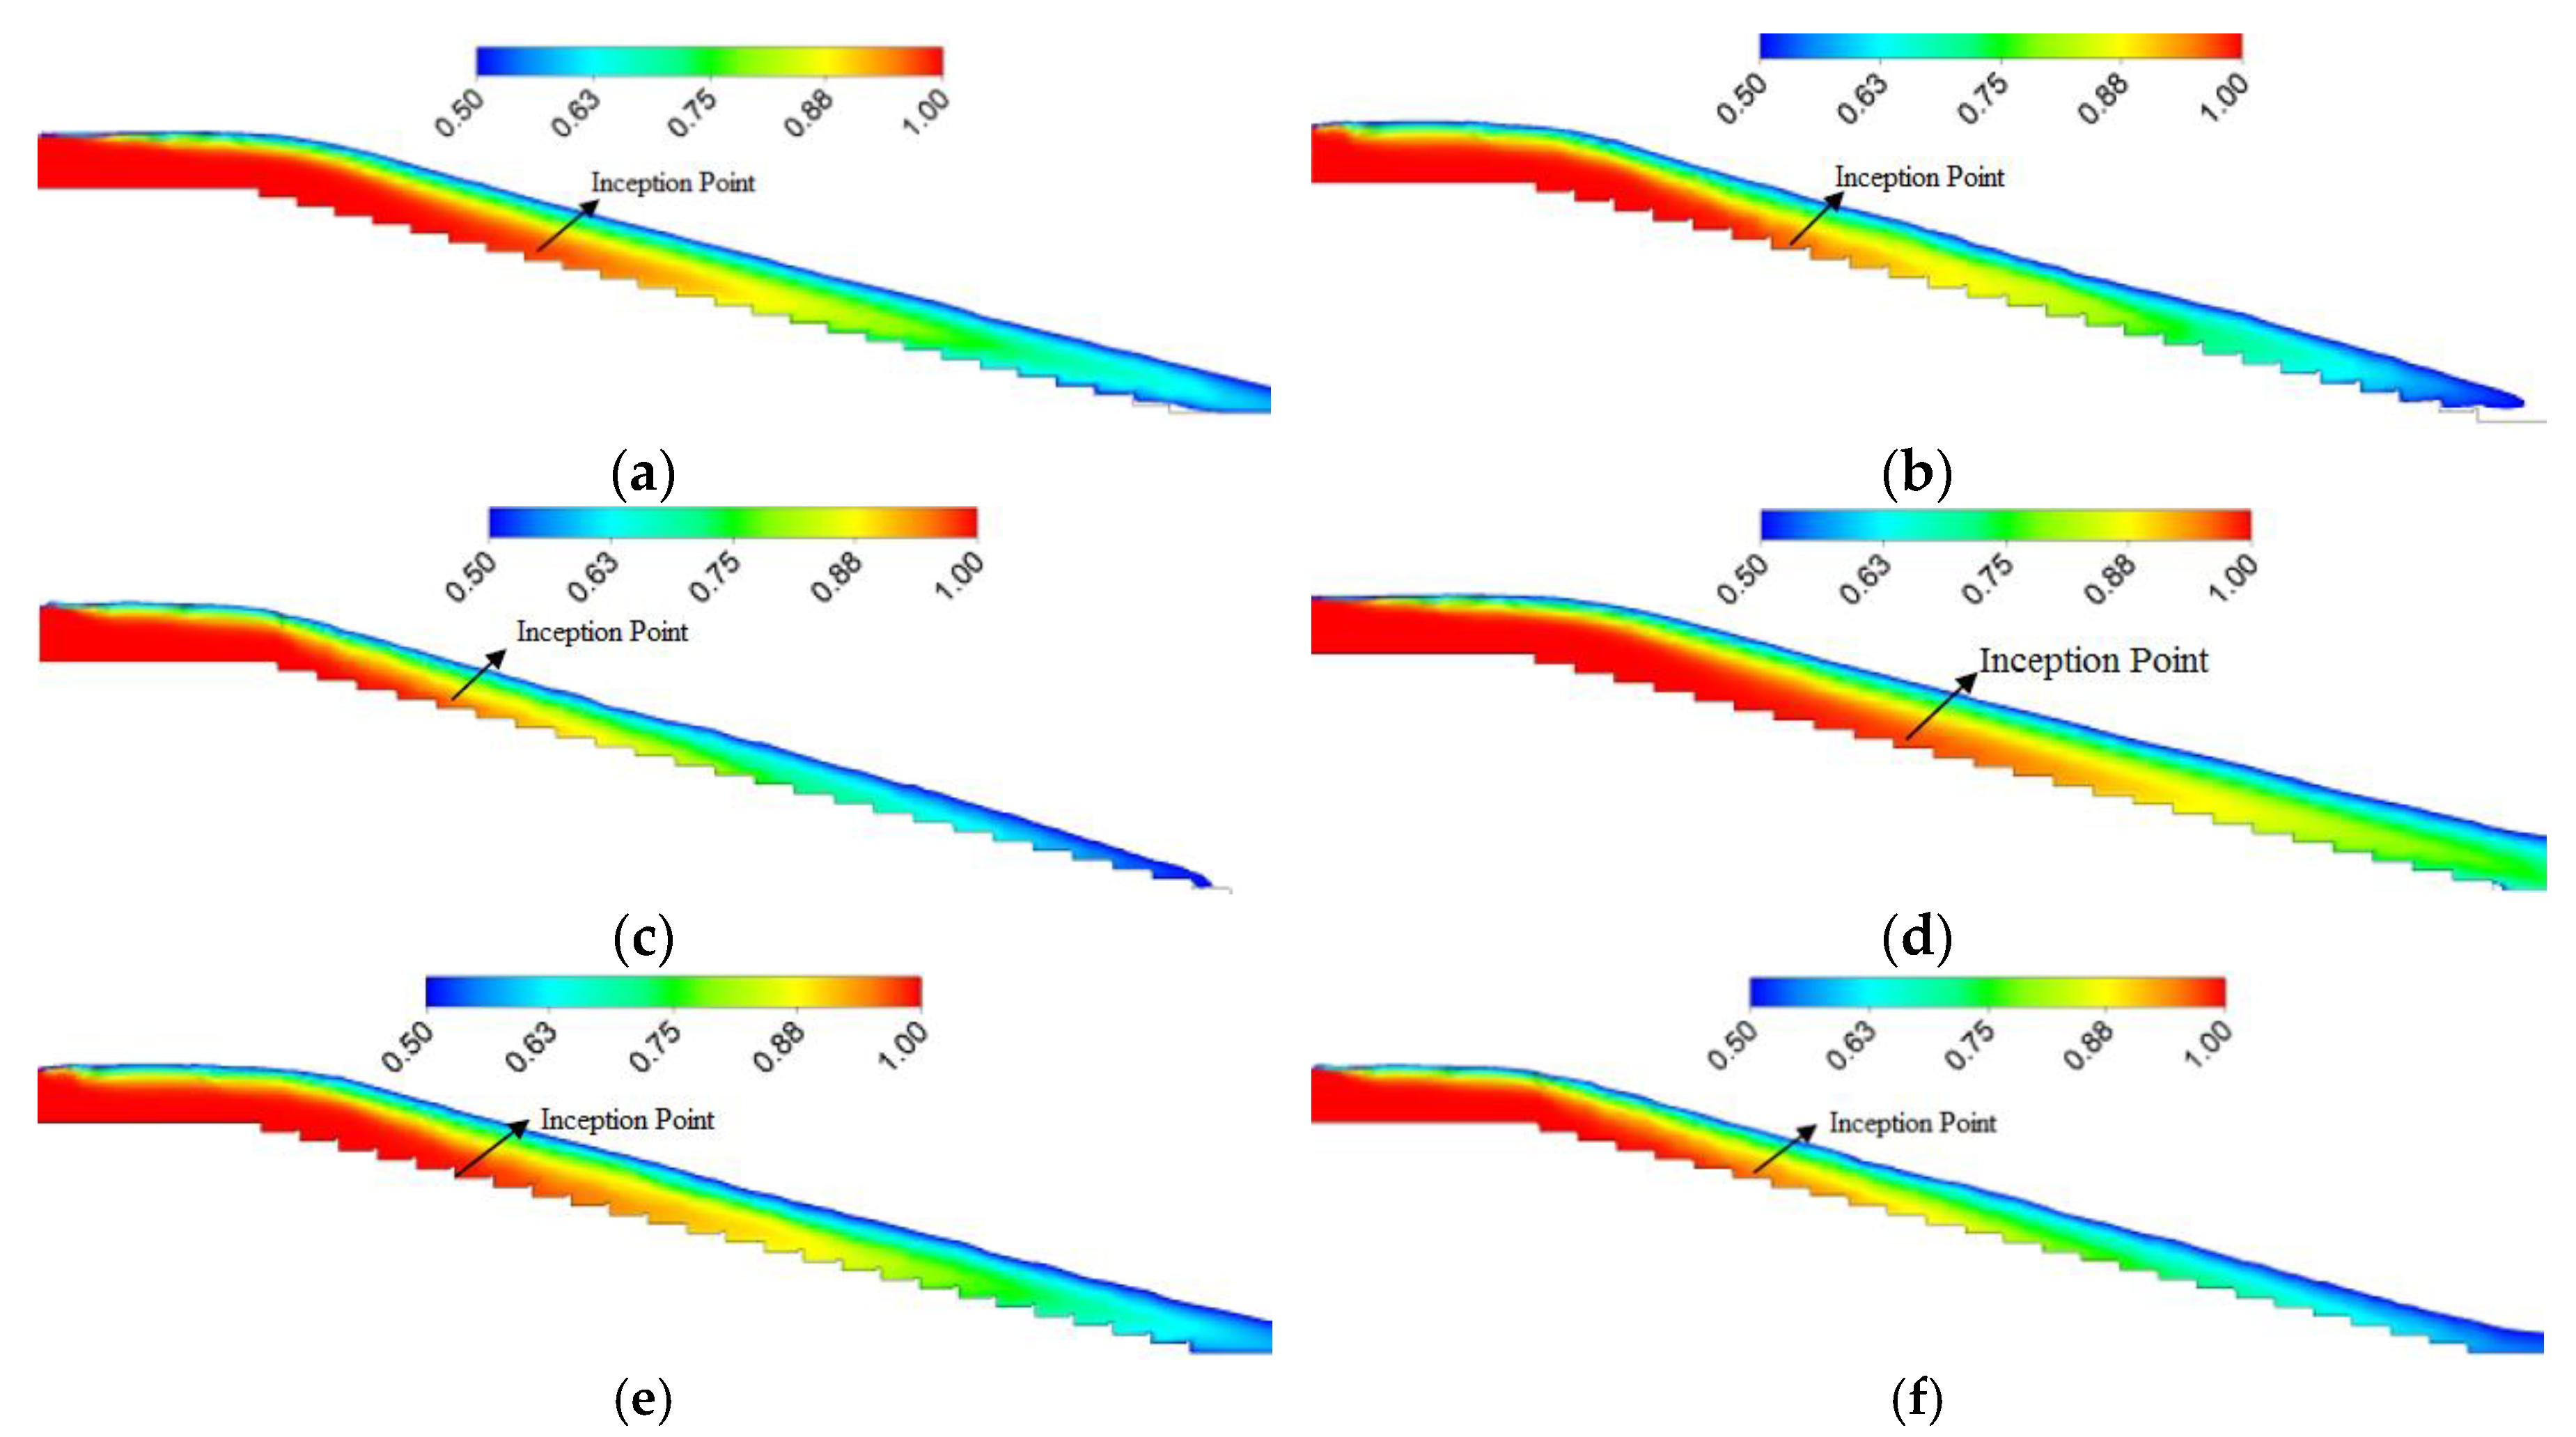
In order to analyze the effect of step geometry on inception length, three different step geometry models (flat, pooled, and round) with the same number of steps were simulated to obtain the inception length in these three different stepped spillways. Conditions of the water volume fraction contours of the flat, pooled, and round stepped spillway models with the same number of steps and unit discharge rate of 0.8 m2/s and 1.0 m2/s were simulated. The inception point locations are shown in Figure 8. The location of the inception point in the round stepped spillway model is near the spillway crest. In the pooled stepped spillway model, the location of the inception point is further away from the spillway crest compared with the round stepped, but nearer than in the flat stepped spillway model. The location of the inception point in the flat stepped spillway model is far away from the spillway crest compared with the round or the pooled stepped spillway models under the same discharge. Thus, the location of the inception point moves toward the spillway crest with changes in step geometry from the flat to the pooled, to the round stepped spillway. The distances of the inception point from the crest Li of the stepped spillway models with different step geometry under the same number of steps and discharge are listed in Table 3.
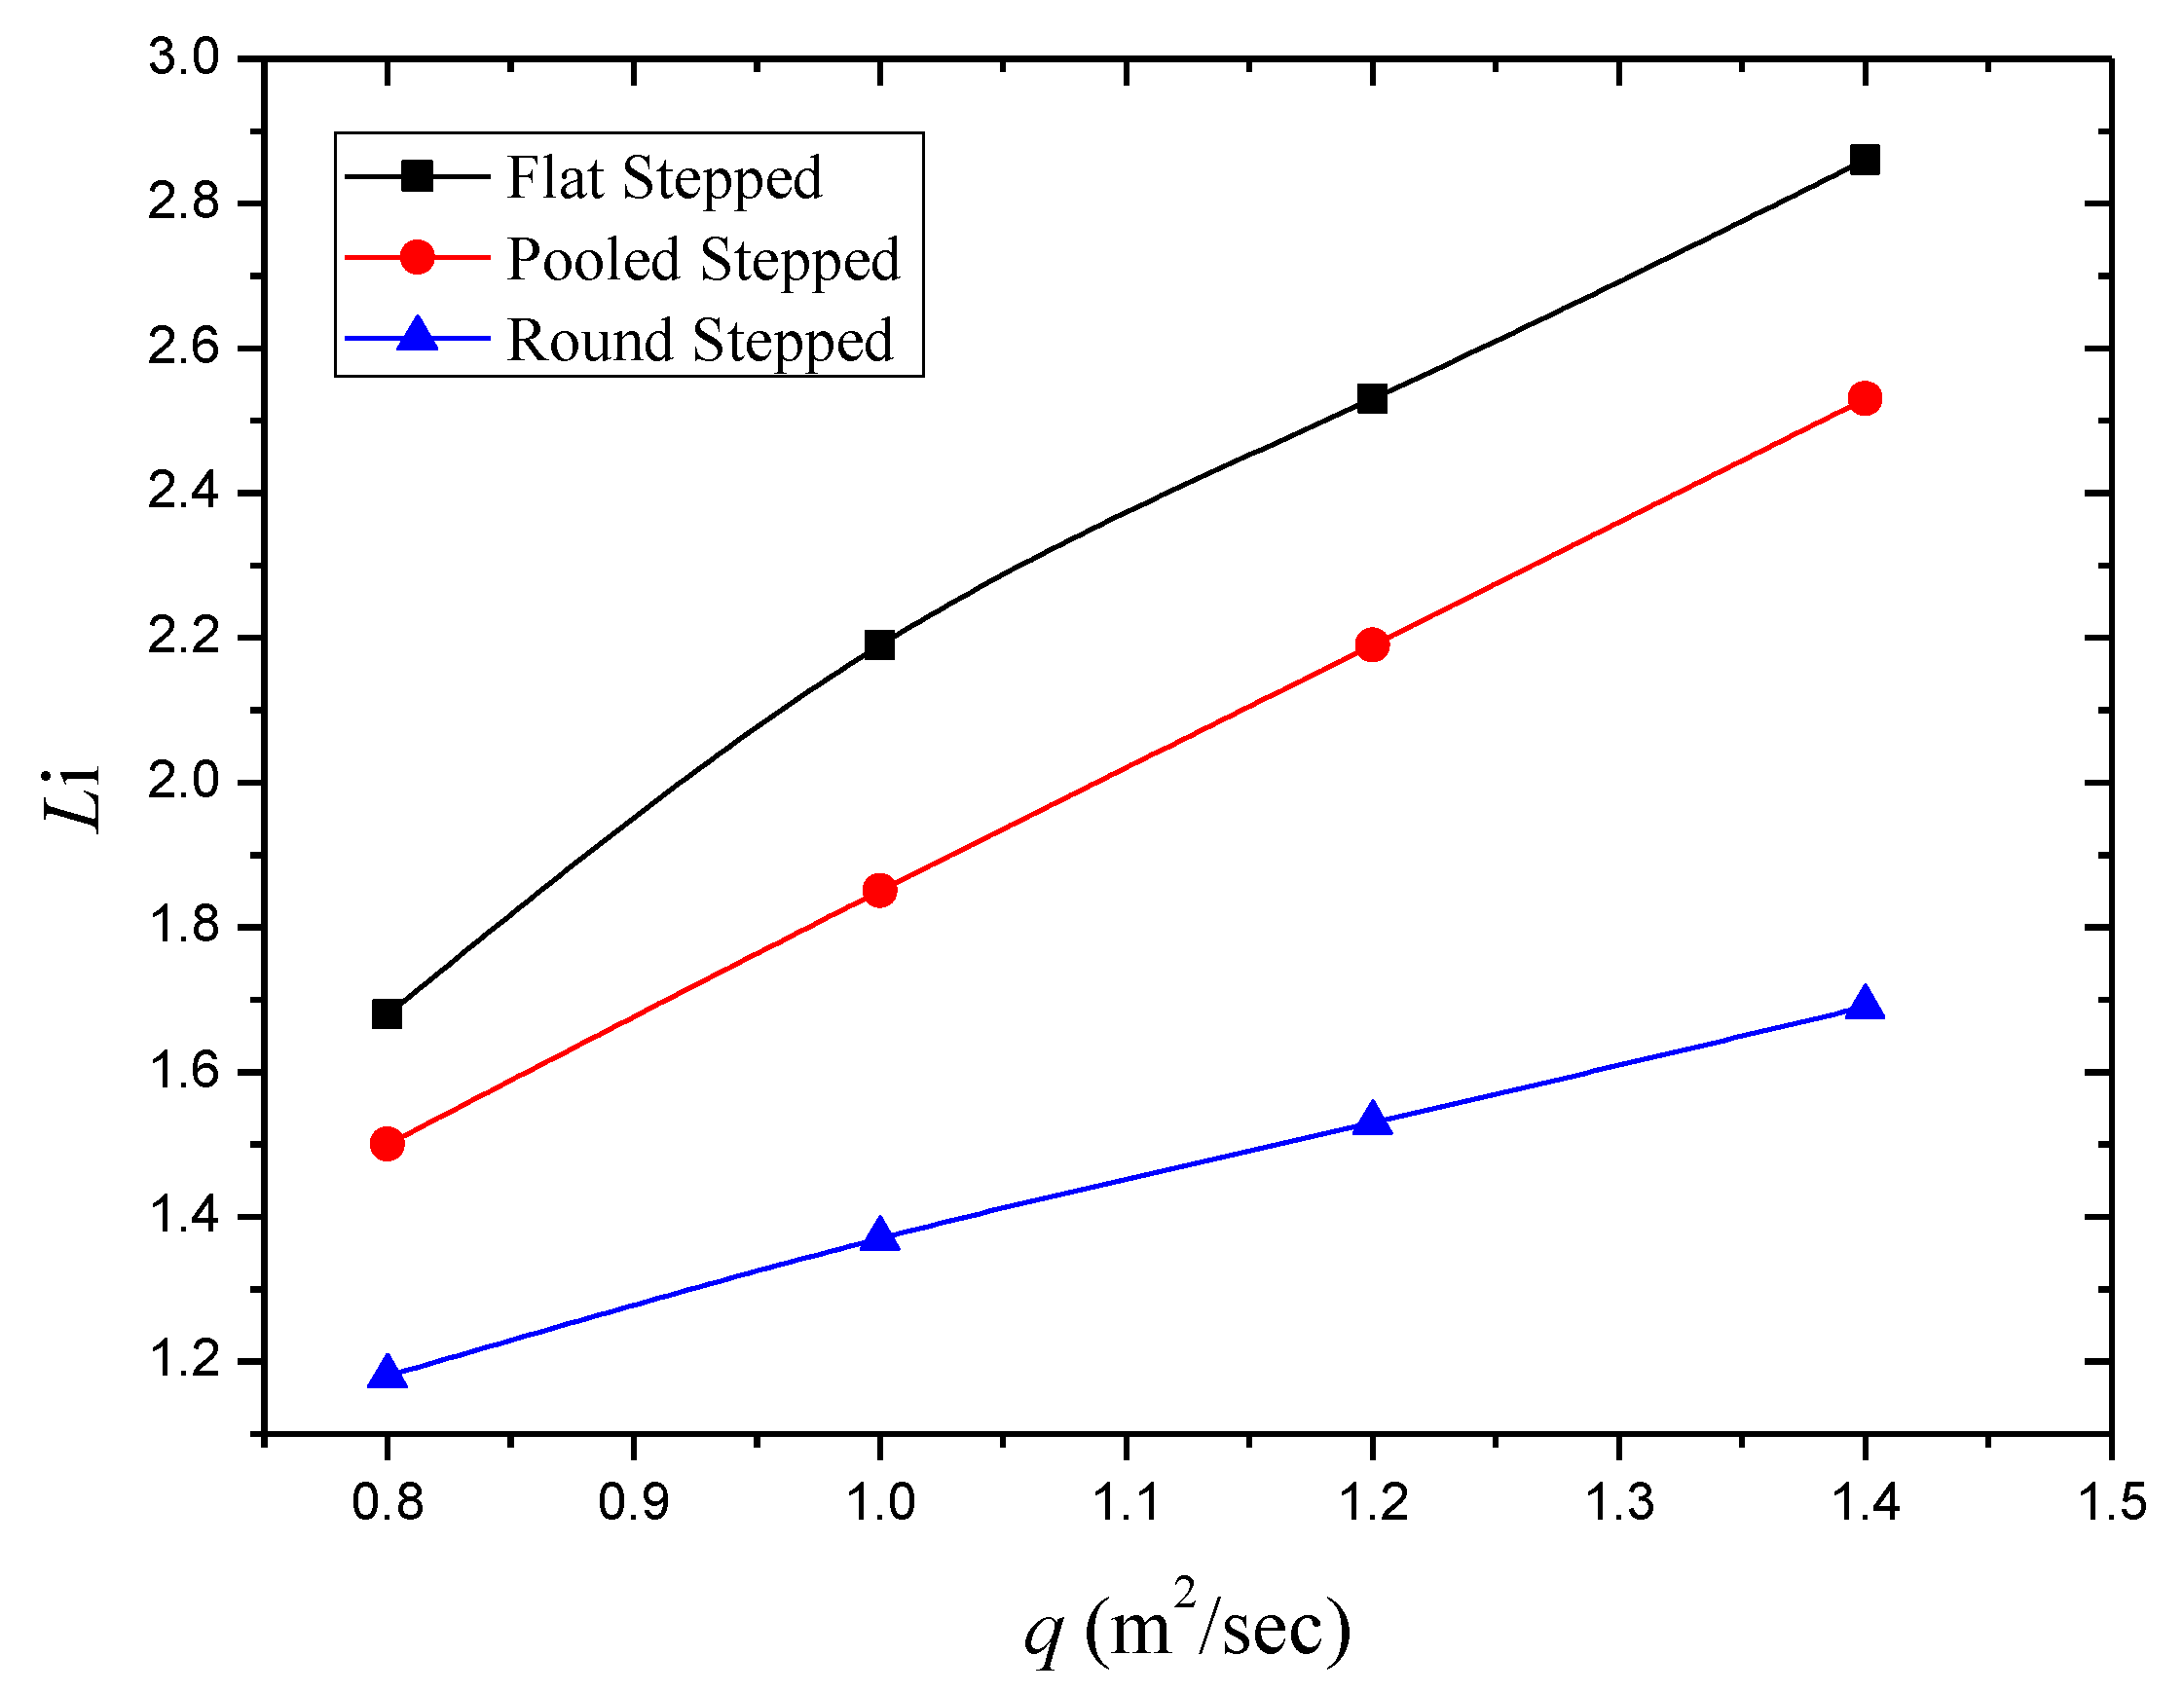
Li increases when the stepped geometry changes from round to pooled, and further increases when the geometry changes from pooled to flat, as shown in Figure 9. The round stepped spillway has the lowest Li compared with both the pooled stepped and the flat stepped spillways. The Li of the flat stepped spillway is greater than that of the pooled stepped spillway under the same unit discharge. For all the stepped spillway geometries, Li increases with unit discharge.

4. Conclusions

The inception point location of the stepped spillways depends on the discharge, step height, and step geometry. The distance of the inception point from the crest (Li) has a positive correlation with the discharge. Under the same discharge, the step height has a negative correlation with Li, while the number of steps shows a positive correlation with it. The inception point location is closer to the spillway crest in the stepped spillways with higher step height. The value of Li changes with the Froude surface roughness (F). Li increases with F, while F increases with the unit discharge but decreases with the step height.
Various simulations and comparison among the three kinds of spillway forms (round, pooled, and flat) were conducted and analyzed. It was shown that under conditions of the same discharge and number of steps, the location of the inception point in a round stepped spillway is closest to the spillway crest, while it is farthest in a flat stepped spillway. As for the non-aerated flow zone, it decreases with the stepped height, as does the probability of cavitation. Under the same boundary conditions, the round stepped spillway shows the least non-aerated flow zone, while the flat form shows the most. Therefore, the minimum probability of cavitation damage may occur in the round stepped spillway, and thus it is better to use the round stepped spillway to prevent cavitation.

Author Contributions

Conceptualization, W.W.; methodology, A.R.; validation, A.R., and X.C.; formal analysis, A.R.; investigation, A.R.; resources, W.W.; writing—original draft preparation, A.R.; writing—review and editing, W.W., and X.C.; visualization, A.R., and X.C.; supervision, W.W.; funding acquisition, W.W.

Funding

This work was supported by the National Key R&D Program of China (2018YFC0407203), the National Natural Science Foundation of China (Nos. 51779216, 51279175) and the Zhejiang Provincial Natural Science Foundation of China (Grant No. LZ16E090001).

Conflicts of Interest

The authors declare no conflict of interest.

Nomenclature

C 1 model constant (max [0.43, η / ( η + 5 ) ])
C 2 1.9 (model constant)
C 1 ε 1.44 (model constant)
C 3 ε 1.0 (model constant)
FFroude surface roughness
G b generation of k due to buoyancy (kg/(ms3))
G k generation of k due to fluid Shear G k = μ t S 2 (kg/ms3)
ggravitational acceleration (m/s2)
hstep height (m)
hpheight of Pool (m)
kturbulent kinetic energy (m2/s2)
ksroughness height, ks = hcosθ (m)
lstep length (m)
Lidistance of inception point location from spillway crest (m)
L i / k s normalized distance from spillway crest to Inception Point
M1-M6number of stepped spillway models
Nnumber of steps
Smodulus of mean rate of tensor S = 2 S i j S i j
S k source term of kinetic energy (kg/ms3)
S ε source term of dissipation rate (kg/ms4)
S i j mean rate of deformation
Ppressure in (N/m2)
qunit discharge (m2/sec)
Wwidth of the step (m)
Y m effect of compressibility on turbulence (kg/ms3)
σ k turbulent Prandtl number
σ ε turbulent Prandtl number
u i velocity in x i direction (m/s)
u j velocity in x j direction (m/s)
α a volume fraction of air (%)
α w volume fraction of water (%)
ε turbulent dissipation rate (m2/s3)
θspillway slope ( ° )
μ molecular dynamic viscosity (kg/ms)
μ t turbulent dynamic viscosity (kg/ms)
ρ cell density (kg/m3)
ρ a density of air (kg/m3)
ρ w density of water (kg/m3)
ttime (s)
υ kinematic viscosity (m2/s)
ω angular velocity

References

  1. Chanson, H. Stepped Spillway Flows and Air Entrainment. Can. J. Civ. Eng. 1993, 20, 422–435. [Google Scholar] [CrossRef]
  2. Chanson, H.; Yasuda, Y.; Ohtsu, I. Flow Resistance in Skimming Flow: A Critical Review. In Proceedings of the International Workshop on Hydraulics of Stepped Spillways, Zurich, Switzerland, 22–24 March 2000. [Google Scholar]
  3. Wood, I.R.; Ackers, P.; Loveless, J. General Method for Critical Point on Spillways. J. Hydraul. Eng. 1983, 109, 308–312. [Google Scholar] [CrossRef]
  4. Chanson, H. Hydraulics of skimming flows over stepped channels and spillways. J. Hydraul. Res. 1994, 32, 445–460. [Google Scholar] [CrossRef] [Green Version]
  5. Felder, S.; Chanson, H. Energy dissipation, flow resistance and gas-liquid interfacial area in skimming flows on moderate-slope stepped spillways. Environ. Fluid Mech. 2009, 9, 427–441. [Google Scholar] [CrossRef]
  6. Boes, R.M.; Hager, W.H. Two-Phase Flow Characteristics of Stepped Spillways. J. Hydraul. Eng. 2003, 129, 661–670. [Google Scholar] [CrossRef]
  7. Amador, A.; Juny, M.S.; Dolz, J. Characterization of the Nonaerated Flow Region in a Stepped Spillway by PIV. J. Fluid Eng. 2006, 128, 1266–1273. [Google Scholar] [CrossRef] [Green Version]
  8. Chanson, H. Characteristics of skimming flow over stepped spillways: Discussion. J. Hydraul. Eng. 2000, 125, 862–865. [Google Scholar] [CrossRef]
  9. Chamani, M.R.; Rajaratnam, N. Characteristics of Skimming Flow over Stepped Spillways. J. Hydraul. Eng. 1999, 125, 361–368. [Google Scholar] [CrossRef]
  10. Chanson, H. Prediction of the transition nappe/skimming flow on a stepped channel. J. Hydraul. Res. 1996, 34, 421–442. [Google Scholar] [CrossRef]
  11. Juny, M.S.; Dolz, J. Experimental study of transition and skimming flows on stepped spillways in RCC dams: Qualitative analysis and pressure measurements. J. Hydraul. Res. 2010, 43, 540–548. [Google Scholar] [CrossRef]
  12. Meireles, I.; Matos, J. Skimming Flow in the Nonaerated Region of Stepped Spillways over Embankment Dams. J. Hydraul. Eng. 2009, 135, 685–689. [Google Scholar] [CrossRef]
  13. Meireles, I.; Renna, F.; Matos, J.; Bombardelli, F. Skimming, Nonaerated Flow on Stepped Spillways over Roller Compacted Concrete Dams. J. Hydraul. Eng. 2012, 138, 870–877. [Google Scholar] [CrossRef] [Green Version]
  14. Matos, J.; Frizell, K.H. Air Concentration and Velocity Measurements on Self-Aerated Flow Down Stepped Chutes. In Proceedings of the 2000 Joint Conference on Water Resource Engineering and Water Resources Planning & Management, Minneapolis, MN, USA, 30 July–2 August 2000. [Google Scholar]
  15. Ohtsu, I.; Yasuda, Y.; Takahasi, M. Flow Characteristics of Skimming Flows in Stepped Channels. J. Hydraul. Eng. 2004, 130, 860–869. [Google Scholar] [CrossRef] [Green Version]
  16. Jumaily, D.K.K.E.; Lami, M.K.A. Study of Conveniency of Using Stepped Spillway in Roller Compacted Concrete Dams (RCCD). Eng. Technol. J. 2009, 27, 2964–2977. [Google Scholar]
  17. Hunt, S.L.; Kadavy, K.C. Energy Dissipation on Flat-Sloped Stepped Spillways: Part 2. Downstream of the Inception Point. ASABE 2010, 53, 111–118. [Google Scholar] [CrossRef]
  18. Chanson, H. Air Bubble Entrainment in Free-Surface Turbulent Shear Flows; Academic Press: London, UK, 1997; p. 401. [Google Scholar]
  19. Zhang, G.F.; Chanson, H. Hydraulics of the Developing Flow Region of Stepped Spillways. I: Physical Modeling and Boundary Layer Development. J. Hydraul. Eng. 2016, 142, 04016015. [Google Scholar] [CrossRef] [Green Version]
  20. Chanson, H. The Hydraulics of Stepped Chutes and Spillways; CRC Press/Balkema: Lisse, The Netherlands, 2002; p. 384. [Google Scholar]
  21. Alghazali, M.O.S.; Jasmin, S.M. Location of Air Inception Point for Different Configuration of Stepped Spillway. Int. J. Civ. Eng. Technol. 2014, 5, 82–90. [Google Scholar]
  22. Wu, J.-H.; Zhang, B.; Ma, F. Inception point of air entrainment over stepped spillways. J. Hydrodyn. 2013, 25, 91–96. [Google Scholar] [CrossRef]
  23. Zare, H.K.; Doering, J.C. Effect of rounding edges of stepped spillways on the flow characteristics. Can. J. Civ. Eng. 2012, 39, 140–153. [Google Scholar] [CrossRef]
  24. Felder, S.; Chanson, H. Air Entrainment and Energy Dissipation on Porous Pooled Stepped Spillways. In Proceedings of the International Workshop on Hydraulic Design of Low-Head Structures (IWLHS), Aachen, Germany, 20–22 February 2013. [Google Scholar]
  25. Munta, S.; Otun, J.A. Study of Inception Point Length over Stepped Spillway Models. NIJOTECH Niger. J. Technol. 2014, 33, 176–183. [Google Scholar] [CrossRef]
  26. Chen, Q.; Dai, G.; Liu, H. Volume of Fluid Model for Turbulence Numerical Simulation of Stepped Spillway over Flow. J. Hydraul. Eng. 2002, 128, 683–688. [Google Scholar] [CrossRef]
  27. Rad, I.N.; Teimouri, M. An Investigation of Flow Energy Dissipation in Simple Stepped Spillways by NumerJical Model. Eur. J. Sci. Res. 2010, 47, 544–553. [Google Scholar]
  28. Eghbalzadeh, A.; Javan, M. Comparison of Mixture and VOF Models for Numerical Simulation of Air–entrainment in Skimming Flow over Stepped Spillways. J. Procedia Eng. 2012, 28, 657–660. [Google Scholar] [CrossRef]
  29. Parsaie, A.; Moradinejad, A.; Haghiabi, A.H. Numerical Modelling of Flow Pattern in Spillway Approach Channel. Jordan J. Civ. Eng. 2018, 12, 1–9. [Google Scholar]
  30. Qian, Z.D.; Hu, X.Q.; Huai, W.X.; Amador, A. Numerical simulation and analysis of water flow over stepped spillways. Sci. China Ser. E Technol. Sci. 2009, 52, 1958–1965. [Google Scholar] [CrossRef]
  31. Benmamar, S.; Kettab, A.; Thirriot, C. Numerical simulation of turbulent flow upstream of the inception point in a Stepped Channel. In Proceedings of the 30th IAHR Congress, Thessaloniki, Greece, 24–29 August 2003. [Google Scholar]
  32. Cheng, X.J.; Luo, L.; Zhao, W.Q.; Li, R. Two-phase flow simulation of aeration on stepped spillway. Prog. Nat. Sci. 2004, 14, 626–630. [Google Scholar] [CrossRef]
  33. Dong, Z.Y.; Lee, J.H.W. Numerical Simulation of Skimming Flow over Mild Stepped Channel. J. Hydrodyn. 2006, 18, 367–371. [Google Scholar] [CrossRef]
  34. Bombardelli, F.A.; Meireles, I.; Matos, J. Laboratory measurements and multi-block numerical simulations of the mean flow and turbulence in the non-aerated skimming flow region of steep stepped spillways. Environ. Fluid Mech. 2010, 11, 263–288. [Google Scholar] [CrossRef] [Green Version]
  35. Tabbara, M.; Chatila, J.; Awwad, R. Computational simulation of flow over stepped spillways. J. Comput. Struct. 2005, 83, 2215–2224. [Google Scholar] [CrossRef]
  36. Cheng, X.; Chen, Y.; Luo, L. Numerical simulation of air-water two-phase flow over stepped spillways. Sci. China Ser. E Technol. Sci. 2006, 49, 674–684. [Google Scholar] [CrossRef]
  37. Sarfaraz, M.; Attari, J.; Pfister, M. Numerical Computation of Inception Point Location for Steeply Sloping Stepped Spillways. In Proceedings of the 9th International Congress on Civil Engineering, Isfahan, Iran, 8–10 May 2012. [Google Scholar]
  38. Bai, Z.L.; Zhang, J.M. Comparison of Different Turbulence Models for Numerical Simulation of Pressure Distribution in V-Shaped Stepped Spillway. Math. Probl. Eng. 2017, 2017, 3537026. [Google Scholar] [CrossRef]
  39. Li, S.C.; Zhang, J.M. Numerical Investigation on the Hydraulic Properties of the Skimming Flow over Pooled Stepped Spillway. Water 2018, 14, 1478. [Google Scholar] [CrossRef]
  40. Cheng, X.J.; Gulliver, J.S.; Zhu, D.T. Application of Displacement Height and Surface Roughness Length to Determination Boundary Layer Development Length over Stepped Spillway. Water 2014, 6, 3888–3912. [Google Scholar] [CrossRef] [Green Version]
  41. Ljubicic, R.; Zindovic, B.; Vojt, P.; Pavlovic, D.; Kapor, R.; Savic, L. Hydraulic Jumps in Adverse-Slope Stilling Basins for Stepped Spillways. Water 2018, 10, 460. [Google Scholar] [CrossRef]
  42. Wan, W.; Liu, B.; Raza, A. Numerical Prediction and Risk Analysis of Hydraluic Cavitation Damage in a High-Speed-Flow Spillway. Shock Vib. 2018, 2018, 1817307. [Google Scholar]
  43. Hirt, C.W.; Nichols, B.D. Volume of Fluid (VOF) Method for the Dynamics of Free Boundaries. J. Comput. Phys. 1981, 39, 201–225. [Google Scholar] [CrossRef]
  44. Kositgittiwong, D.; Chinnarasri, C.; Julien, P.Y. Numerical simulation of flow velocity profiles along a stepped spillway. J. Process Mech. Eng. 2013, 227, 327–335. [Google Scholar] [CrossRef]
  45. Shih, T.H.; Liou, W.W.; Shabbir, A.; Yang, Z.; Zhu, J. A New k-ε Eddy Viscosity Model for High Reynolds-Number Turbulent Flows-Model Development and Validation. Comput. Fluids 1994, 24, 227–238. [Google Scholar] [CrossRef]
Figure 1. Schematic of inception point location in a stepped spillway during the skimming flow regime.
Applsci 09 02091 g001
Figure 2. Sketch of stepped spillway configuration: (a) M1 with Flat Steps (h = 0.1 m, l = 0.45 m); (b) M2 with flat steps (h = 0.09 m, l = 0.37 m); (c) M3 with flat Steps (h = 0.05 m, l = 0.21 m); (d) M4 with flat steps (h = 0.04 m, l = 0.17 m); (e) M5 with pooled steps; (f) M6 with round steps.
Applsci 09 02091 g002
Figure 3. Numerical stepped spillway model and boundary conditions: (a) three-dimensional numerical stepped spillway model, (b) boundary conditions applied to the model.
Applsci 09 02091 g003
Figure 4. Water volume fraction contours of different step heights for stepped spillway models in the central plane at discharge 0.8 m2/s: (a) flat stepped spillway with step height 0.10 m; (b) flat stepped spillway with step height 0.09 m; (c) flat stepped spillway with step height 0.05 m; and (d) flat stepped spillway with step height 0.04 m.
Applsci 09 02091 g004
Figure 5. Variation of inception length (Li) with discharge rate at different step heights of flat stepped spillway models.
Applsci 09 02091 g005
Figure 6. Variation of inception length (Li) with Froude surface roughness (F) at different stepped heights of flat stepped spillway models.
Applsci 09 02091 g006
Figure 7. Normalized Li with respect to Froude surface roughness.
Applsci 09 02091 g007
Figure 8. Water volume fraction contours of round, pooled, and flat stepped spillway models in the central plane with same number of steps N = 24 at unit discharge 0.8 m2/s and 1.0 m2/s (a) flat stepped spillway (N = 24) at unit discharge 0.8 m2/s; (b) pooled stepped spillway (N = 24) at unit discharge 0.8 m2/s; (c) round stepped spillway (N = 24) at unit discharge 0.8 m2/s; (d) flat stepped spillway (N = 24) at discharge 1.0 m2/s; (e) pooled stepped spillway (N = 24) at unit discharge 1 m2/s; and (f) round stepped spillway (N = 24) at unit discharge 1 m2/s.
Applsci 09 02091 g008
Figure 9. Comparison of relationship of inception length and unit discharge for the flat, pooled, and round stepped spillway models.
Applsci 09 02091 g009
Table 1. Design parameters of different stepped spillways for numerical simulation.
ModelStep GeometryStep Height(m)Step Length(m)Slope°
M1Flat0.100.4512.52°
M2Flat0.090.3713.67°
M3Flat0.050.2113.39°
M4Flat0.040.1713.24°
M5Pooled (hp = 0.01 m)0.040.1514.93°
M6Round0.040.1614.03°
Table 2. Summary of unit discharge (q), step height, Froude surface roughness (F), inception point length (Li), surface roughness (ks) and normalized (Li).
Unit Discharge q (m2/s)Step Height
(m)
Number of Steps NFroude Surface Roughness FInception Point Length Li (m)Surface Roughness
ks (m)
Li/ks
0.80 0.10917.0 0.90 0.097 9.23
1.00 0.10922.0 1.35 0.097 13.84
1.20 0.10927.0 1.57 0.097 16.10
1.40 0.10931.0 1.80 0.097 18.46
0.80 0.091119.0 1.10 0.090 12.17
1.00 0.091124.0 1.47 0.090 16.26
1.20 0.091129.0 1.84 0.090 20.35
1.40 0.091134.0 2.20 0.090 24.34
0.80 0.051950.0 1.27 0.048 26.45
1.00 0.051962.5 1.70 0.048 35.41
1.20 0.051975.0 2.14 0.048 44.38
1.40 0.051990.0 2.34 0.048 75.26
0.80 0.042472.0 1.68 0.038 51.08
1.00 0.042490.0 2.19 0.038 59.30
1.20 0.0424109.0 2.53 0.038 64.55
1.40 0.0424127.0 2.86 0.038 75.26
Table 3. Summary of unit discharge (q), step geometry, and inception point (Li).
Discharge q (m2/s)Step GeometryNumber of Steps NLi (m)
0.8Flat241.68
1.0Flat242.19
1.2Flat242.53
1.4Flat242.86
0.8Pooled241.50
1.0Pooled 241.85
1.2Pooled242.19
1.4Pooled242.53
0.8Round241.18
1.0Round241.37
1.2Round241.53
1.4Round241.69