Featured Application
Authors are encouraged to provide a concise description of the specific application or a potential application of the work. This section is not mandatory.
Abstract
In electricity markets, energy storage systems (ESSs) have been widely used to regulate frequency in power system operations. Frequency regulation (F/R) relates to the short-term reserve power used to balance the real-time mismatch of supply and demand. Every alternating current power system has its own unique standard frequency level, and frequency variation occurs whenever there is a mismatch of supply and demand. To cope with frequency variation, generating units—particularly base-loader generators—reduce their power outputs to a certain level, and the reduced generation outputs are used as a generation reserve whenever frequency variation occurs in the power systems. ESSs have recently been implemented as an innovative means of providing the F/R reserve previously provided by base-loader generators, because they are much faster in responding to frequency variation than conventional generators. We assess the economic benefits of ESSs for F/R, based on a new forecast of long-term electricity market price and real power system operation characteristics. For this purpose, we present case studies with respect to the South Korean electricity market as well as simulation results featuring key variables, along with their implications vis-à-vis electricity market operations.
1. Introduction
Global electricity markets have started to use energy storage systems (ESSs) to enhance the operational performance efficiency of power systems. Compared to other existing resources such as coal and gas-fueled generators, ESSs respond to changes in demand much more quickly. This feature offers great operational flexibility in the electricity market and in system operations, particularly in the smart operation of frequency regulation (F/R). F/R is an activity through which system operations cope with excessive fluctuations in power system frequency—fluctuations that are caused by real-time mismatches in power supply and demand. Conventional coal and/or gas-type generators have been traditionally used to resolve the F/R problem, by leaving some portion of their generation capacity unused—that is, by procuring generation reserves, and by providing reserved resources in the event of excessive frequency fluctuation.
Given the technical advantage of ESSs in terms of their prompt responsiveness to frequency fluctuation, electricity markets in the United States—such as Pennsylvania-New Jersey-Maryland(PJM) Interconnection, Midcontinent Independent System Operator(MISO), and New York Independent System Operator(NYISO)—have already designed ESS practices in F/R markets, and they have attracted the entry of ESSs through multiple incentive mechanisms [1]. For example, some F/R markets have introduced an incentive mechanism divided into a capacity market and an energy market, to offer more benefits to those resources that respond accurately and rapidly [2,3,4]. Moreover, because power system frequency signals can be more frequently transmitted to ESS than conventional generators, PJM and NYISO operate single transmission systems that are separated into fast and slow-response resources [5,6]. In addition, ESSs are being more broadly applied to electricity systems: ESSs, for example, are typically associated with connecting variable renewable energy sources to enhance the power of battery charging, as well as to effectively operate and utilize electric vehicles; both are typical recent examples of ESS applications in power system operations [7,8,9,10,11]. In some electricity markets, including that of South Korea, electricity utility companies have undertaken large-scale ESS deployment plans for F/R.
To date, various studies have been conducted on F/R ESSs, covering topics such as optimal ESS capacity estimation and economic benefit assessments. Some studies [12,13,14] discuss the optimal capacity estimation of ESS for frequency control and evaluate the benefits thereof. Other studies [15,16] suggest the economic dispatch methodology and the optimal sizing of ESSs from a utility operation perspective. In determining benefits, an economic assessment should precede ESS installation. Hur et al. [17] propose economic analysis when an ESS is introduced as an F/R resource in an electricity market. Some studies discuss, from a utility perspective, economic benefit analyses in accordance with price arbitrage as a result of ESS application [18,19,20]. In economic analyses of electricity markets, the long-term system marginal price (SMP) estimation is the most important factor; however, most studies conduct short- and medium-term SMP estimation. Conejo et al. [21] conducted short-term SMP estimations using 24-h electricity price predictions for the day-ahead energy market, by applying various methodologies (i.e., neural network, time series, and wavelet models). Paraschiv et al. [22] propose a regime-switching model for short- and medium-term electricity price forecasting and show the superiority of the proposed model compared to an autoregressive integrated moving average and generalized autoregressive conditional heteroscedasticity models. Nowotarski et al. [23] discuss a long-term seasonal component that considers annual seasonality and estimates a future (one-year) electricity spot price by applying a wavelet-based model.
The current study proposes an analytical method by which to assess the benefit of ESS implementation for F/R in electricity markets. First, to capture the basic benefit of ESS for F/R, we developed a method of predicting the SMP, which is the weighted mean of the fuel cost of a marginal plant. Second, we proposed a new scenario-based method to forecast utility economic benefits; this method considers both the electricity market structure and power system operations. The case study results show the diverse profile of the economic aspects of ESS implementation; one can readily infer from the results economic insights pertaining to large-scale ESS implementation. This study contributes to the literature on economics analysis and long-term SMP estimation. this study contributes to the literature on two perspectives. First of all, a benefits analysis of ESS for F/R is conducted in accordance with electricity market in South Korea. And the proposed methodology, Long-term SMP estimation doesn’t require large time series data, therefore there shouldn’t be too much difficulty with respect to data collection.
The remainder of this paper is organized as follows. In Section 2, we develop a novel methodology for assessing the economic benefits of ESS implementation in the F/R electricity market, based on South Korea’s national plan for long-term electricity supply and demand [24]. Section 3 addresses the simulation results by using the methods proposed in this study, while our conclusions are presented in Section 4.
2. Benefits Assessment of ESS Introduction in the F/R Market
2.1. ESS Introduction: Benefits Overview
The economic benefits of ESSs for F/R derive primarily from the difference in generation cost (i.e., fuel cost in $/kWh) between base and peak-loader generators. To balance the mismatch in supply and demand in the real-time operation of a power system, a certain amount of a base-loader generator’s capacity (typically 5%) is reserved for power system F/R. Instead, to meet load demands, expensive peak-loader generators produce the required electric power not otherwise supplied by base load generators. In this way, use of this F/R reserve causes an increase in the power system operational fuel cost.
However, the reserved generation amount offered by base-loader generators can be replaced by introducing an ESS for F/R. In other words, the reserved amount from base-loader generators—which are cheaper than peak-loaders—can be supplied to power systems to meet load demand. From the standpoint of power system operation, the use of ESSs for F/R facilitates the replacement of expensive peak-loader generators with cheap base-loaders.
Figure 1 depicts the basic economic benefit of an ESS for F/R in the electricity market. One of the key factors in assessing the economic benefit of ESSs for F/R in power system operation is the estimation of future prospects for the SMP in electricity markets. The SMP is the spot market price used in electric power transactions, and it is determined by considering the most expensive generation cost of the marginal generating unit that meets the marginal demand of electricity markets. When it comes to a base load generator’s reserved generation associated with F/R, the revenue lost by not selling the reserved generation can be compensated for by offering the opportunity cost (COFF), which is defined as the difference between the SMP and the base-loader generator’s fuel cost. Because the SMP, or the generation cost of a marginal generator, is typically decided by the peak load generator’s fuel cost, the COFF offered to base load generators for F/R can be redefined as the difference between the generation costs of peak and base-loaders. In this regard, the economic benefit of ESSs for F/R can be captured by the replacement benefit—that is, the benefit that derives from fuel cost savings on account of replacing expensive peak-loader generators with cheaper base loaders in F/R. The benefit can, therefore, be assessed primarily by forecasting future SMP (i.e., the generation cost of peak load) and base load fuel costs.
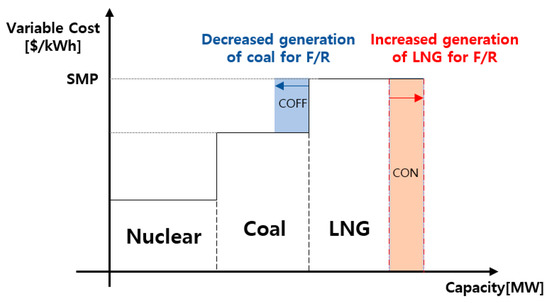
Figure 1.
Economic benefits of ESSs for F/R in the electricity market [25,26].
2.2. Probabilistic Long-Term SMP Forecast
To assess effectively the economic benefit of ESS for F/R over a given horizon (typically 10–15 years), we propose the novel probabilistic weighted average to predict future annual SMP profiles for the horizon. Because the SMP is the most expensive fuel cost of the generator that is last committed to meet the forecasted demand at a given hour, the estimation for an hourly marginal plant profile across the operating horizon is the key element in predicting annual SMPs. To this end, the current study proposes a probabilistic method by which to forecast a long-term marginal plant profile associated with hourly SMP, to assess the economic benefit of ESS for F/R.
To obtain the annual SMP profiles—that is, annual marginal plant probability profiles in electricity markets—we used a 15-year national long-term supply and demand projection plan published by a South Korean energy agency [24]. Detailed descriptions of the development of a probabilistic annual SMP forecast, based on the estimation of a long-term marginal plant profile, are given below.
First, the annual generation capacity of each fuel type for the next 10 years can be obtained from the national plan for long-term electricity supply and demand. However, this capacity cannot be identified as real generation capacity, because it does not take into account the operational unavailability of generators owing to events such as forced and maintenance outages. The forced outage rate (FOR) and maintenance outage rate (MOR) speak to the unavailability of generating units associated with unplanned and planned outages, respectively. When assessing the annual generation capacity for each fuel type, the unavailable generation capacity should therefore be extracted from the nominal generation capacity. In addition, given the fluctuating output of renewable energy, we use estimations of actual generation capacity from the national plan, rather than installed capacity data.
Second, we obtain from the hourly demand average the past demand profiles that are assumed to be identical to estimated peak demand. However, these profiles can also be divided into two different demand profiles—weekdays and weekends. Annual peak demand for the next 10 years is used to determine the annual hourly demand. The methodology is as follows. Equations (1) and (2) represent the idea that the sum of the hourly average demand is the product of hourly peak demand and (rate of hourly demand on the basis of peak demand), which transform to Equation (3). Applying this notion, annual peak demand satisfying average demand is calculated by Equation (4). Peak demand is calculated as:
where and () are the demand at each time, peak demand, and rate of past demand for each time on the basis of peak demand, respectively.
Third, the annual demand clustering pattern can be obtained from the peak demand for each year, as drawn from past data. This means that estimated demand is equal to the movement of the past demand pattern, in line with peak demand. Therefore, the annual demand pattern is estimated by multiplying annual peak demand by each value of the percentage of demand for every hour, based on peak demand from the past demand clustering pattern. We compare the annual generation mix from generation capacity and the demand clustering for every hour to identify the marginal plant resources used on weekdays, weeknights, and weekends. Marginal plant profiles for daytime, nighttime, and weekends are realized by designating daytime as 16 h, nighttime as 8 h (i.e., 12 AM–8 AM), and weekends as 24 h. This can be used to count numbers determined as SMP for the specific resource.
Fourth, this study assigns weighting for generation costs, such that they are allocated a heavier weight when they are closer to the present; it is assumed that future generation costs will be similar to past generation costs. The SMP for weekdays, weeknights, and weekends is estimated by using the weighted average of the marginal plant profile. Future SMP is calculated as follows.
where the subscripts and denote nuclear power, coal, liquefied natural gas (LNG), and oil generation costs, respectively; subscripts , , , and denote nuclear power, coal, LNG, and oil variables, respectively; and denotes the marginal plant profile of .
Using this function, the SMP for daytime, nighttime, and weekends can be determined. The annual SMP contains the rates for daytime (approximately 16 h per day for five days per week), nighttime (approximately 8 h per day for five days per week), and weekend (24 h per day for two days per week). In accordance with supposition, the outcomes of rate calculation are 0.476, 0.238, and 0.286, respectively, on the basis of one year (8760 h); we assign these rates as a calculus in Equation (6). The annual SMP associated with these rates is defined as
, , , and are annual, daytime, nighttime, and weekend SMPs, respectively. The formula consists of , , and , with their weights calculated by using the duration rate in the year. The long-term SMP estimation framework is illustrated as Figure 2.
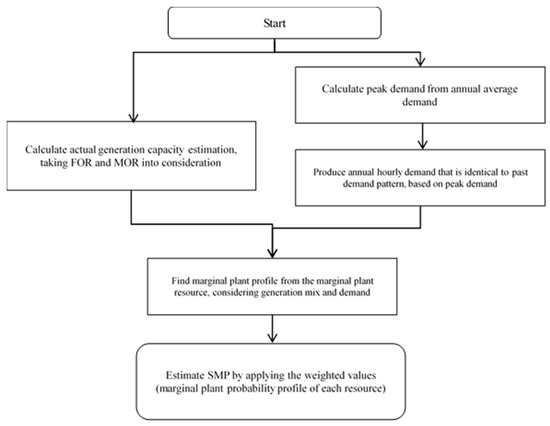
Figure 2.
Schematic diagram of the SMP forecast methodology.
2.3. Assessment of Economic Benefits from ESS for F/R in the Electricity Market
ESS is introduced in a power system for F/R. If implemented in the South Korean electricity market, it will change the overall demand placed on coal and LNG supply capacity generators and modify electricity costs.
Currently, coal generators need to secure a reserve for F/R through a 5% reduced operation in the electricity market. Although this generation constraint is not included in the price-setting schedule, it is used in the operation schedule that is produced following the creation of the price-setting schedule. Therefore, reduced coal capacities receive an opportunity cost payment known as a constrained-off energy payment (i.e., the aforementioned COFF), which is calculated based on the minimum SMP and coal fuel cost. To meet the shortfall, LNG generators increase generation and then receive compensation, known as a constrained-on energy payment (CON); CON is calculated based on the maximum SMP and LNG fuel cost. However, the settlement would differ when operating ESS for F/R: because F/R ESSs can alleviate the constraint, coal capacities can generate more, and be compensated for this increased generation in the form of a scheduled energy payment (SEP). This SEP is calculated based on the SMP in the price-setting schedule, rather than the COFF. Furthermore, the LNG generators need not generate more to compensate for the shortfall, and so they do not receive the CON payment. As a result, each participant (i.e., Coal Gen., LNG Gen., and Utility) would then be compensated as in Table 1.

Table 1.
Payment changes deriving from frequency regulation energy storage systems introduction to the South Korean energy market.
We propose a method by which to estimate the utility benefits (UBs) of introducing into electricity markets ESSs for F/R. We consider the benefits in the energy and ancillary service (A/S) markets, based on generation constraints and when considering F/R in the South Korean electricity market.
Given that ESSs can be used as reserves, the implementation of an ESS alleviates the base load generation constraint and can produce benefits similar to ESS capacity; this is because the utility need not pay additional costs with respect to the coal and LNG generators. In addition, an A/S payment would be provided to the utility because the F/R ESS, which the utility needs to plan to own, replaces the conventional generation role. Therefore, the UBs increase in terms of the energy and A/S aspects. Equations for calculating the energy market price (EP) and the A/S price (ASP) benefits are as follows.
where and are the coefficient of utilization for ESS and the generation operation rate, respectively, and
where , , , and are the practical ESS capacity, weighted values of ESS, droop, and dead band, respectively. Furthermore, is the unit cost for F/R, and is the ESS operation rate. ESS compensation should be differentiated from conventional resource compensation, because it provides outstanding F/R performance; therefore, resource weighting was added through —which has a value exceeding 1 in the ESS settlement of the A/S market—to provide a larger payment than conventional resources. Both the droop and dead band demonstrate the performance of resources in F/R, and thus, these factors should also be considered in the A/S settlement by using and . These have values in the range of 0.8–1.05 and 0.85–1.05, respectively, and resources with lower values in them are set so as to have heavy weighting. The sum of energy (EP) and A/S benefits (ASP) equals the UB, given by Equation (9).
Although we actually assume that UBs reflecting the current electricity market need to come about during the daytime of a weekday, we also consider two other cases to make a total of three. In the first case, UBs occur during the daytime of a weekday, because coal generators generate more electricity during the day than at other times. In the second, UBs are derived during the nighttime of a weekday, because the upward generation of coal generators deepens during that time. In the third, UBs come about all day, on account of a stable trend of reserves and little upward generation among coal generators. For each of these cases, we present below equations by which to calculate EP and ASP benefits.
- Case A: benefits occur during the daytime
- Case B: benefits occur during the nighttime
- Case C: benefits occur all day
3. Case Study: ESS Participation Benefits Assessment in the F/R Market, Based on the Long-Term SMP Forecasting Methodology
3.1. Comparison of Real and Estimated SMPs
We measure real SMP against estimated SMP and use past data from the Korean Power Exchange (KPX) to assess the results of our proposed methodology. To compare the SMP based on real data to the estimated SMP, we use real SMP for each month, forecasted SMP using marginal plant probability, and generation cost, using data from the 2001–2015 period. Figure 3 presents the results.
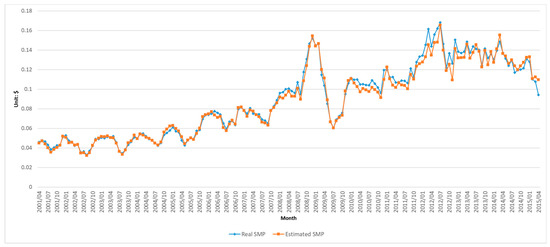
Figure 3.
Comparison of real and estimated SMP, 2001–2015.
The results show that the estimations are similar to the real SMP values, with an average error of approximately 3.5%. Therefore, we determined that it is possible to predict the SMP by using the methodology presented herein.
3.2. Long-Term SMP Forecasting of the South Korean Electricity Market
We conducted a case study to investigate UBs and examine how ESS for F/R affects efficiency in South Korea. To undertake this investigation, we must first estimate the SMP according to the method proposed in Section 2.1. First, we considered the auxiliary power consumption ratio, the FOR, and the MOR to determine the actual supply capacity; this was obtained by deducting these rates for each of the generation resources. We assumed that the auxiliary power consumption ratio was 5%; additionally, for FOR and MOR, we used the average from the 2014–2015 period (Table 2).
Table 2.
Average forced outage rate (FOR) and maintenance outage rate (MOR) values of South Korean nuclear and coal power plants.
By substituting these figures and applying the renewable energy availability in resource capacity [24], we can determine the actual supply capacity and generation mix. The generation mix of the base load is based on the constructed actual supply capacity (Table 3). As part of the renewable energy penetration policy, the capacities of nuclear and coal resources will be reduced, while those of renewable energy resources will be increased. According to the national plan [24], renewable resources consist of photovoltaic power, wind power, tidal power, and by-product gas.
Table 3.
Actual supply capacity of renewable, nuclear, and coal resources, 2019–2028 (Unit: MW).
Once we estimate the actual supply capacity, we can then estimate the annual demand on weekdays and weekends and compare these values to the actual supply capacity. Demand is estimated based on [24], and we use weekday and weekend patterns from 2016 to estimate the annual demand pattern ratio for 24 h; future demands are projected using the annual electricity consumption projection of [24], based on the load-pattern ratio. The hourly load profiles of weekdays and weekends, which are estimated as the average of the 2016 electricity load, are illustrated in Figure 4.
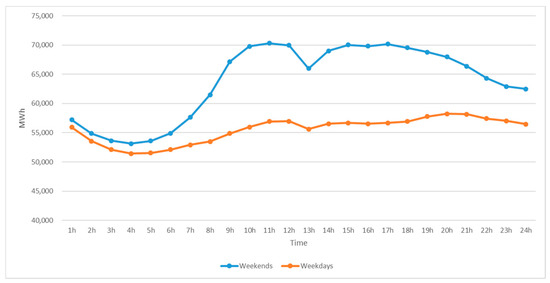
Figure 4.
Hourly load profiles of weekday and weekend power usage.
We assume that the 2019–2028 load patterns are similar to the 2016 load patterns. To estimate the 2019–2028 load profile, the load-pattern ratio was obtained by dividing the load profile by the load profile peak demand. Annual peak load was calculated from the electricity consumption and the sum of the load-pattern ratio for 24 h (Table 4). We were then able to estimate the annual load profile of weekdays and weekends for the 2019–2028 period.
Table 4.
Annual total consumption and peak load for 2019–2028, based on 2016 data.
Following our 2019–2028 load profile estimation, we verified which resource would be selected in each hour by comparing the load profile and generation mix. Figure 5 shows the weekday and weekend load profiles, as well as generation, in 2024. Renewable resources do not comprise a single resource; rather, they are derived from multiple sources. Nonetheless, the national plan does not provide planned capacity for each type of renewable resource. This means that we encountered difficulties in generating actual hourly generation projections for renewable resources. Therefore, despite the inherent flexibility, we assumed that the single renewable resource is constant over time.
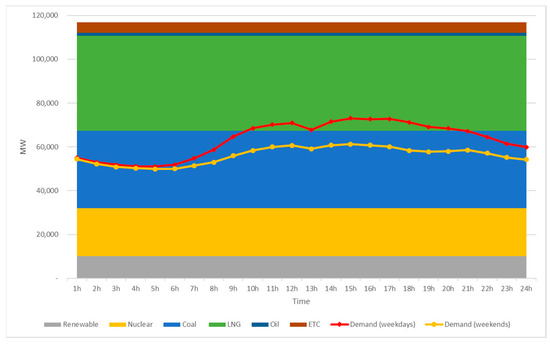
Figure 5.
Hourly load profile of weekdays and weekends, and generation mix, in 2014.
From these demand- and supply-side processes, we can obtain the marginal plant probability for each generation resource. Comparing the generation mix and demand allows us to see how frequently specific resources are selected as the marginal plant. Table 5 shows the marginal plant probability profile of coal generation.
Table 5.
Marginal plant probability profile of coal generators, 2019–2028.
We applied the average value of the annual generation cost from the 2016–2017 period. The SMP is estimated by using the marginal plant probability profile and generation cost and is shown in Table 6.
Table 6.
System marginal price of coal generators, 2019–2028 (Unit: $).
The SMP estimation results show a gradual decrease until 2023, and then a steady increase. The major driver of the SMP projection trend is recent energy policy that works to reduce South Korea’s reliance on nuclear and coal power plants and expand its reliance on renewable resources.
3.3. Economic Assessment of ESS in F/R the Market, with Respect to UBs
Following the SMP estimation, we determined UBs as a function of introducing F/R ESS. The UBs consist of benefits in the energy and A/S markets. Simulations were conducted for each of case A, B, and C, using two ESS capacity scenarios that consider existing installed capacity (i.e., 52 MW) and planned future capacity (i.e., 500 MW). To calculate UBs in each scenario, the value of UBs is derived by using the following settings: , , , and . Furthermore, the daytime, nighttime, and annual average SMPs are applied to each equation in a regular sequence. Results pertaining to UBs during the 2019–2028 period are presented in Table 7.
Table 7.
Projected Energy Market Price (EP) Benefits, Ancillary Service Price (ASP) Benefits, and Utility Benefits (UBs), 2019–2028 (Unit: Thousands of $).
In case A, over the 10-year period, for a 52-MW ESS (500-MW ESS), we could anticipate ASP benefits of about $3 million ($31 million), EP benefits of about $33 million ($318 million), and UBs of about $36 million ($348 million). When considering other cases based on case A, we can see that case B (case C) is 26% (155%) the scale of case A. In cases A, B, and C, the difference between the two capacity scenarios was approximately $31, $8, and $48 million, respectively—demonstrating an 862% increase for an ESS capacity increase from 52 MW to 500 MW. This finding demonstrates that UBs are directly proportional to the size of the ESS. The benefit scale for these cases differs very much from the simulation results; this divergence derives from the fact that SMP change depending on the time involved and the times in which ESS benefits are generated. Consequently, changes made to the electricity industry—such as changes to energy policy, fuel costs, and demand among others—will decide the benefit level.
4. Conclusions
Recently, ESSs for electricity systems have been utilized in numerous ways. (For example, they are connected to renewable resources and used to discharge large quantities of electricity at peak usage times.) A plan to implement ESSs for F/R has recently been introduced in South Korea; other countries have already implemented them, because they allow for the stabilization of electricity systems in a way that compensates for its higher costs and encourages more efficient fuel use. We carried out a benefit estimation in anticipation of the introduction in South Korea of an F/R ESS.
We present a novel methodology for assessing the anticipated UBs. First, we extrapolated the future SMP by using a weighted average of marginal plant probability and fuel cost for each resource. We then calculated the UB as the sum of the energy and A/S market benefits, as determined by the electricity market and industrial structure. In the case study, we found the scale of benefits to range from $91 million to $540 million for 500 MW, and noted that among the three cases, case C—in which ESS for F/R is operated all day—offers the largest benefit. Although the results of the simulation models present different benefit levels, all cases show large and positive benefits; none show a negative result. Thus, we conclude that the introduction of ESSs for F/R in South Korea would enhance power system stability and bring about substantial UBs.
Author Contributions
Both authors contributed to this work. E.L. undertook related research, performed the analysis, and wrote the paper. J.K. designed the study and led and supervised the research.
Funding
This work was funded by the Korea Institute of Energy Technology Evaluation and Planning (KETEP) and the Ministry of Trade, Industry & Energy (MOTIE) of the Republic of Korea (grant number 20171210200810).
Conflicts of Interest
The authors declare no conflict of interest.
References
- Wellinghoff, J. FERC Order No.755. Available online: https://www.ferc.gov/whats-new/comm-meet/2011/102011/E-28.pdf?csrt=2959623525451900142 (accessed on 22 October 2018).
- Federal Energy Regulatory Commission (FERC). Order on Compliance Filing. Available online: http://energystorage.org/system/files/resources/ferc_orderapprovingmisos755compliancefiling_9_20_12.pdf (accessed on 21 April 2019).
- Miller, R.; Venkatesh, B.; Cheng, D. Overview of FERC Order No.755 and Proposed MISO Implementation. In Proceedings of the 2013 IEEE Power & Energy Society General Meeting, Vancouver, BC, Canada, 21–25 July 2013. [Google Scholar]
- Chen, Y.; Keyser, M.; Tackett, M.H.; Ma, X. Incorporating short-term stored energy resource into Midwest ISO energy and ancillary service market. IEEE Trans. Power Syst. 2011, 26, 829–838. [Google Scholar] [CrossRef]
- KEMA. KERMIT Study Report. Available online: https://www.pjm.com/-/media/committees-groups/task-forces/rmistf/postings/pjm-kema-final-study-report.ashx?la=en (accessed on 22 April 2019).
- PJM. RTO/ISO Regulation Market Comparison. Available online: https://www.pjm.com/-/media/committees-groups/task-forces/rmistf/20160413/20160413-item-03-rto-iso-benchmarking.ashx (accessed on 22 October 2018).
- Dang, J.; Seuss, J.; Suneja, L.; Harley, R.G. SoC feedback control for wind and ESS hybrid power system frequency regulation. IEEE J. Emerg. Sel. Top. Power Electron. 2014, 2, 79–86. [Google Scholar] [CrossRef]
- Datta, M.; Senjyu, T. Fuzzy control of distributed PV inverters/energy storage systems/electric vehicles for frequency regulation in a large power system. IEEE Trans. Smart Grid 2013, 4, 479–488. [Google Scholar] [CrossRef]
- Zhou, H.; Bhattacharya, T.; Tran, D.; Siew, T.S.T.; Khambadkone, A.M. Composite energy storage system involving battery and ultracapacitor with dynamic energy management in microgrid applications. IEEE Trans. Power Electr. 2011, 26, 923–930. [Google Scholar] [CrossRef]
- Wen, S.; Lan, H.; Fu, Q.; Yu, D.C.; Zhang, L. Economic allocation for energy storage system considering wind power distribution. IEEE Trans. Power Syst. 2015, 30, 644–652. [Google Scholar] [CrossRef]
- Tran, D.; Khambadkone, A.M. Energy management for lifetime extension of energy storage system in micro-grid applications. IEEE Trans. Smart Grid 2013, 4, 1289–1296. [Google Scholar] [CrossRef]
- Oudalov, A.; Chartouni, D.; Ohler, C. Optimizing a battery energy storage system for primary frequency control. IEEE Trans. Power Syst. 2007, 22, 1259–1266. [Google Scholar] [CrossRef]
- Mercier, P.; Cherkaoui, R.; Oudalov, A. Optimizing a battery energy storage system for frequency control application in an isolated power system. IEEE Trans. Power Syst. 2009, 24, 1469–1477. [Google Scholar] [CrossRef]
- Kottick, D.; Blau, M.; Edelstein, D. Battery energy storage for frequency regulation in an island power system. IEEE Trans. Energy Convers. 1993, 8, 455–459. [Google Scholar] [CrossRef]
- Jung, K.-H.; Kim, H.; Rho, D. Determination of the installation site and optimal capacity of the battery energy storage system for load leveling. IEEE Trans. Energy Convers. 1996, 11, 162–167. [Google Scholar] [CrossRef]
- Lo, C.H.; Anderson, M.D. Economic dispatch and optimal sizing of battery energy storage systems in utility load-leveling operations. IEEE Trans. Energy Convers. 1999, 14, 824–829. [Google Scholar] [CrossRef]
- Hur, W.; Moon, Y.; Shin, K.; Kim, W.; Nam, S.; Park, K. Economic value of Li-ion energy storage system in frequency regulation application from utility firm’s perspective in Korea. Energies 2015, 8, 5000–5017. [Google Scholar] [CrossRef]
- Bradbury, K.; Pratson, L.; Patiño-Echeverri, D. Economic viability of energy storage systems based on price arbitrage potential in real-time U.S. electricity markets. Appl. Energy 2014, 114, 512–519. [Google Scholar] [CrossRef]
- Walawalkar, R.; Apt, J.; Mancini, R. Economics of electric energy storage for energy arbitrage and regulation in New York. Energy Policy 2007, 35, 2558–2568. [Google Scholar] [CrossRef]
- Alt, J.T.; Anderson, M.D.; Jungst, R.G. Assessment of utility side cost savings from battery energy storage. IEEE Trans. Power Syst. 1997, 12, 1112–1120. [Google Scholar] [CrossRef]
- Conejo, A.J.; Contreras, J.; Espinola, R.; Plazas, M.A. Forecasting electricity prices for a day-ahead pool-based electric energy market. Int. J. Forecast. 2005, 21, 435–462. [Google Scholar] [CrossRef]
- Paraschiv, F.; Fleten, S.E.; Schürle, M. A spot-forward model for electricity prices with regime shifts. Energy Econ. 2015, 47, 142–153. [Google Scholar] [CrossRef]
- Nowotarski, J.; Tomczyk, J.; Weron, R. Robust estimation and forecasting of the long-term seasonal component of electricity spot prices. Energy Econ. 2013, 39, 13–27. [Google Scholar] [CrossRef]
- The Eighth Basic Plan of Long-term Electricity Supply and Demand. Available online: https://www.kpx.or.kr/www/downloadBbsFile.do?atchmnflNo=28714 (accessed on 22 October 2018).
- Electricity Market Operation Rule in South Korea. Available online: https://www.kpx.or.kr/www/selectBbsNttView.do?key=29&bbsNo=114&nttNo=18847&searchCtgry=&searchCnd=all&searchKrwd=&pageIndex=1&integrDeptCode= (accessed on 12 May 2019).
- Korea Power Exchange. Technical Report on ESS Operation System and Market Development for Frequency Regulation; US Department of Energy: Washington, DC, USA, 2016; pp. 49–55.


© 2019 by the authors. Licensee MDPI, Basel, Switzerland. This article is an open access article distributed under the terms and conditions of the Creative Commons Attribution (CC BY) license (http://creativecommons.org/licenses/by/4.0/).