Spreading Dynamics of Droplet Impact on a Wedge-Patterned Biphilic Surface

Abstract
:Featured Application
Abstract
1. Introduction
2. Experimental Specifications
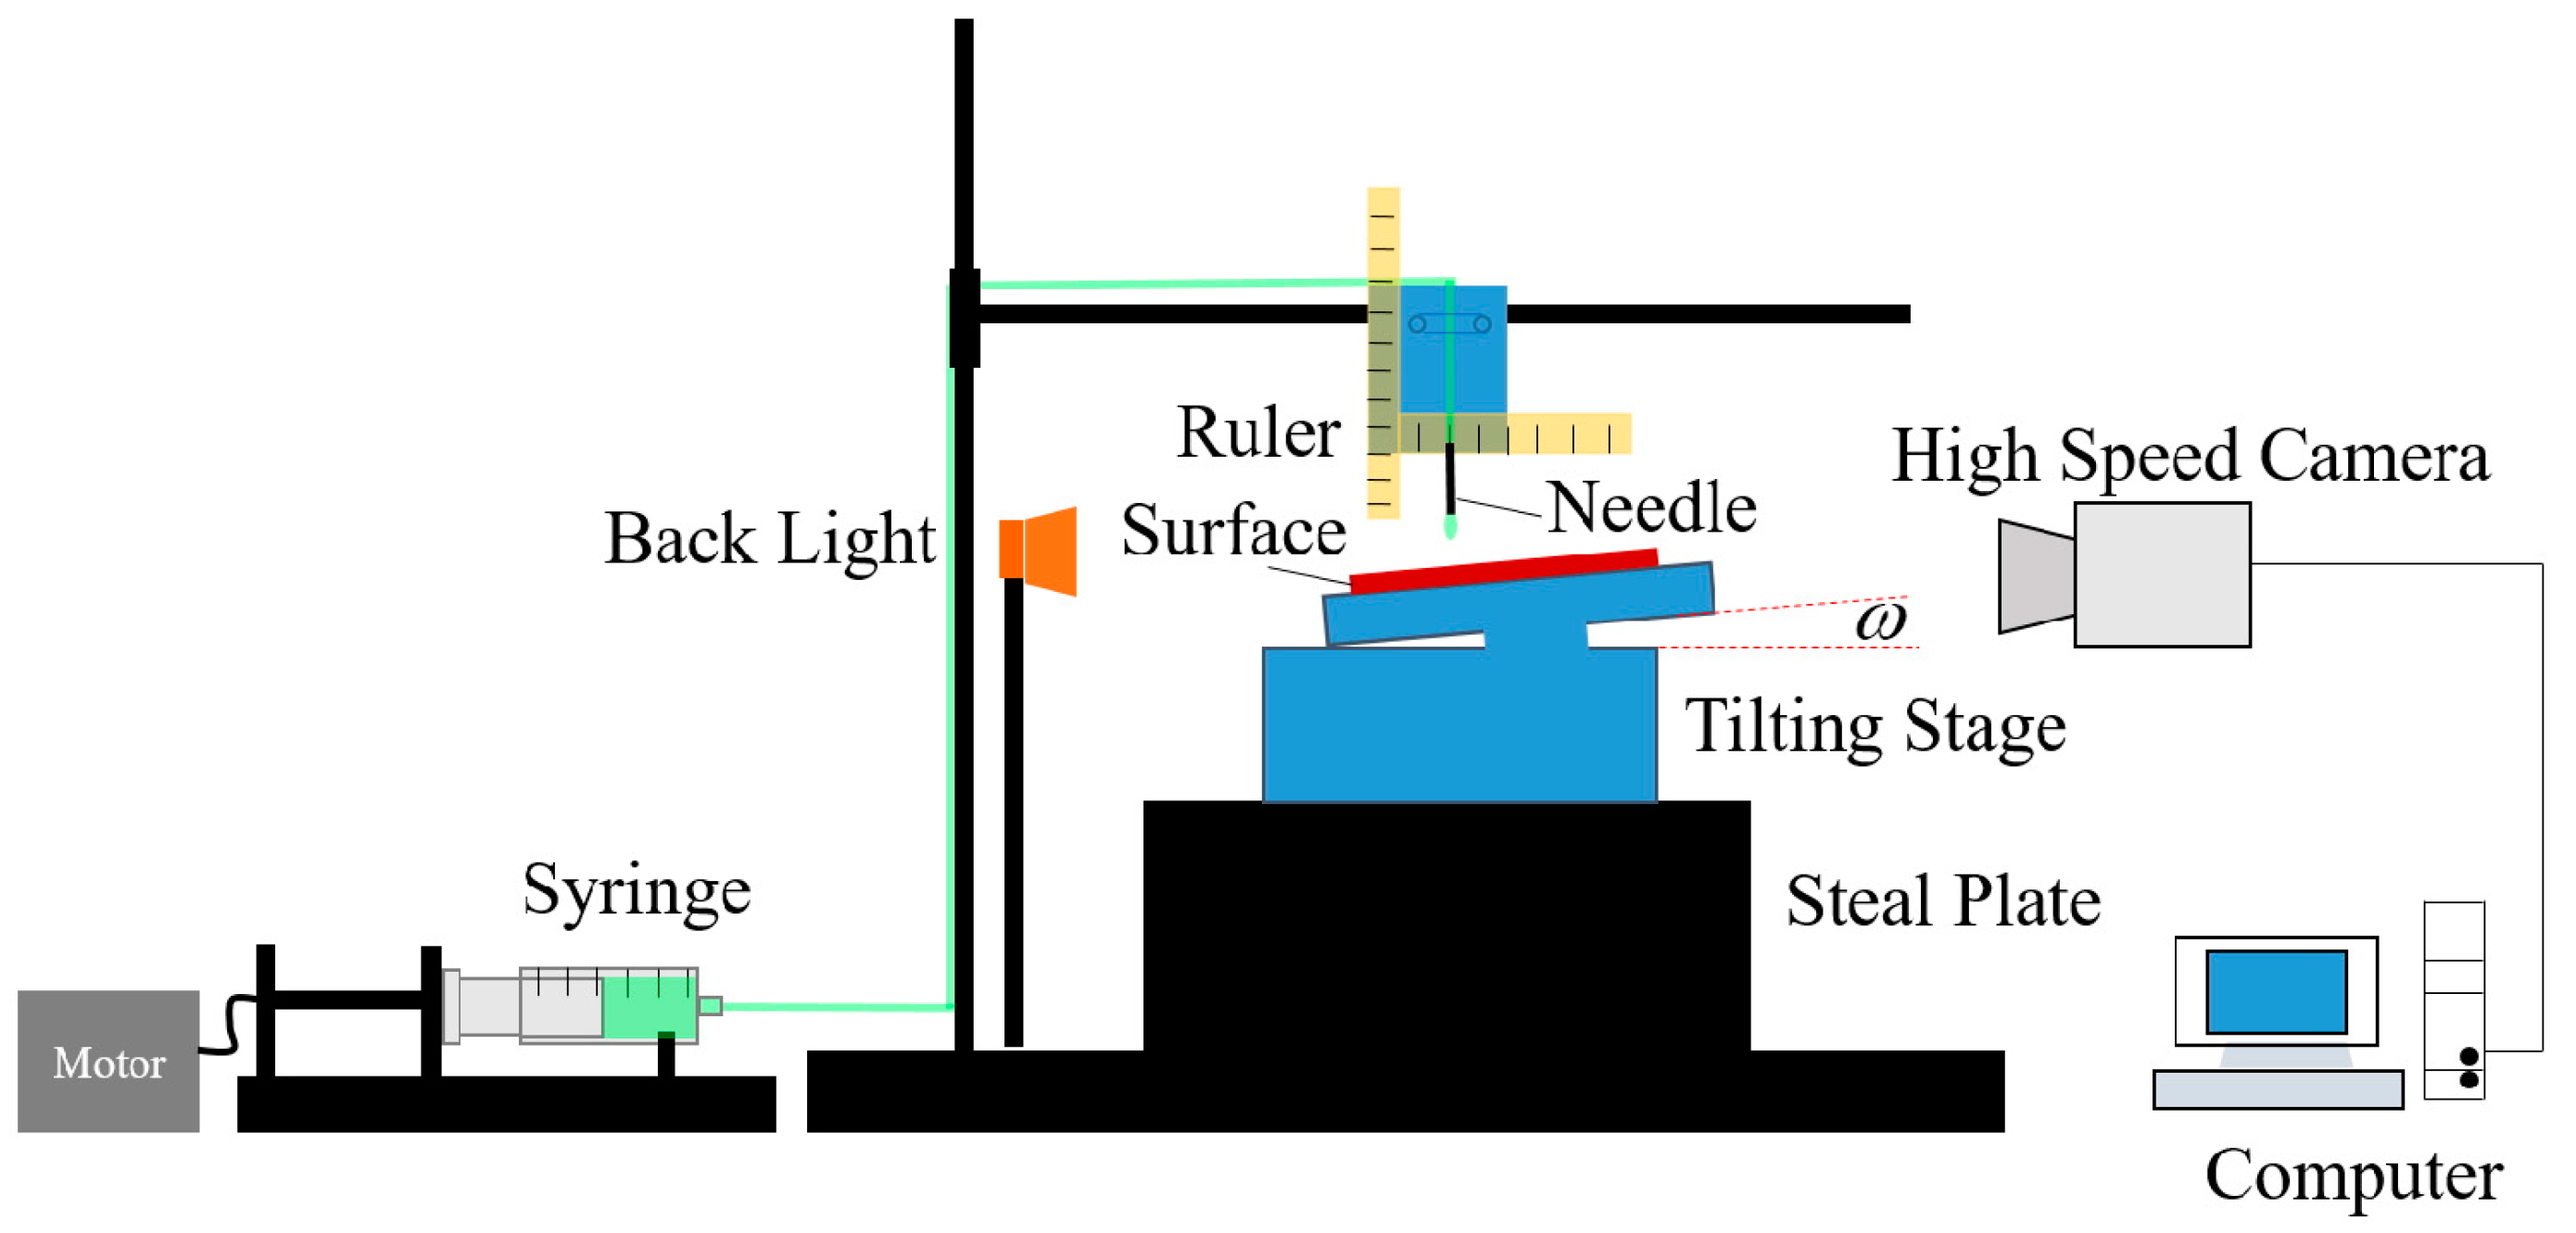
2.1. System Specifications
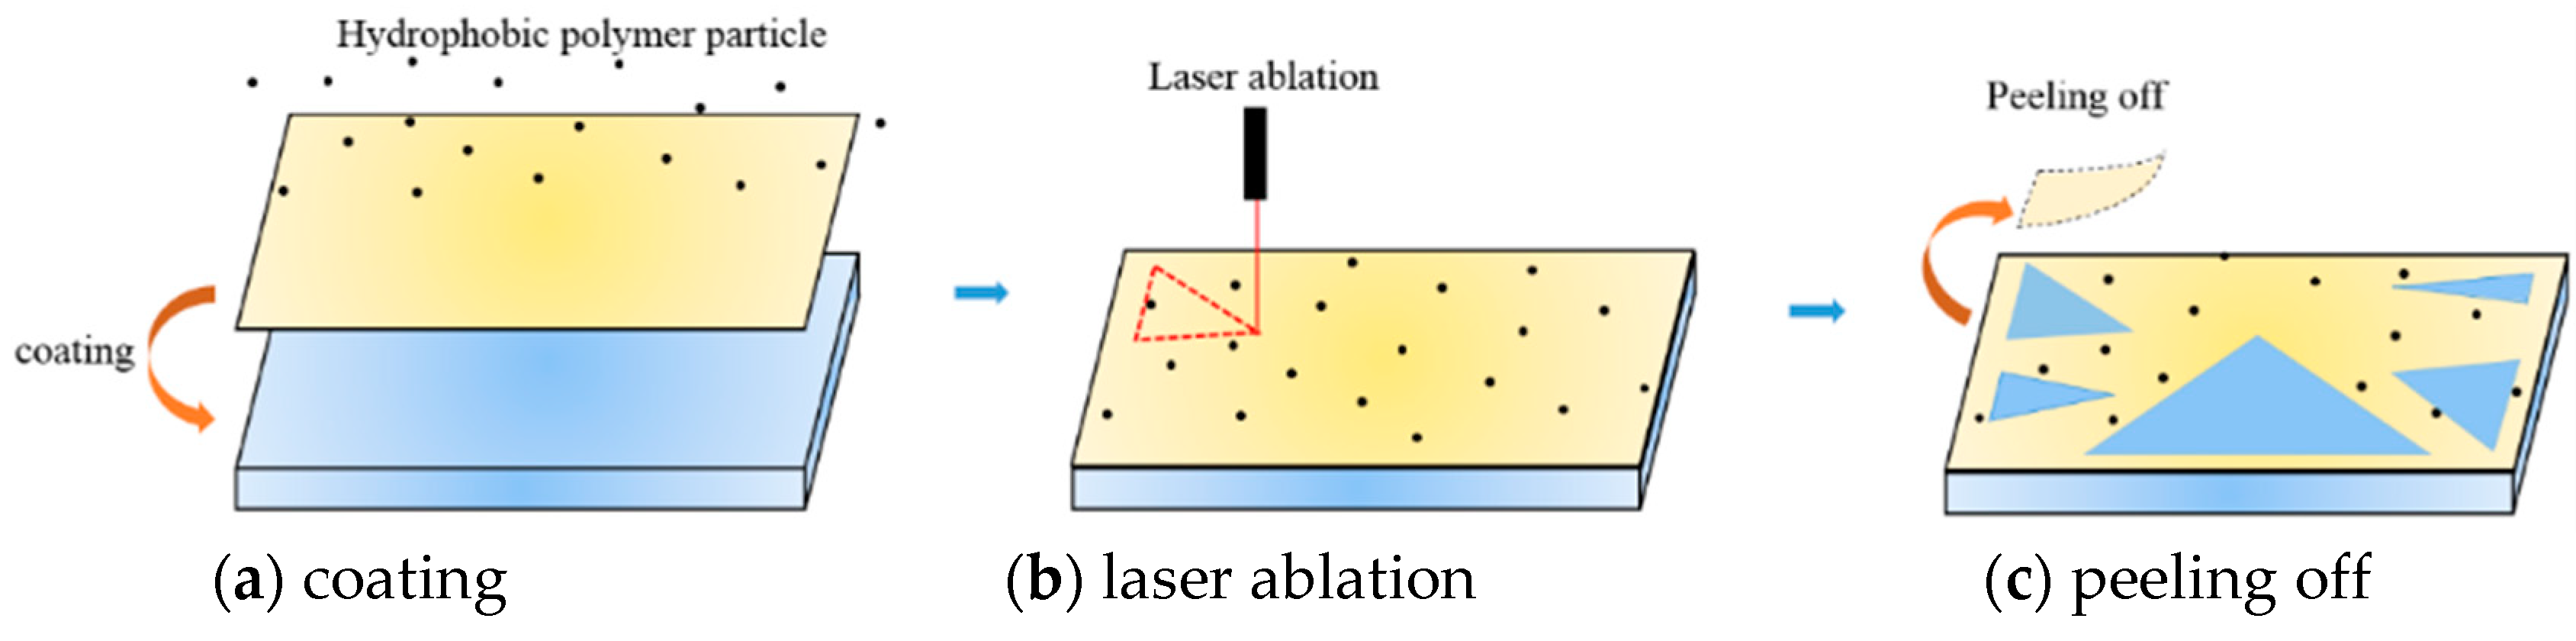
2.2. Characterization of the Solid Surface and Droplets
3. Results and Discussion
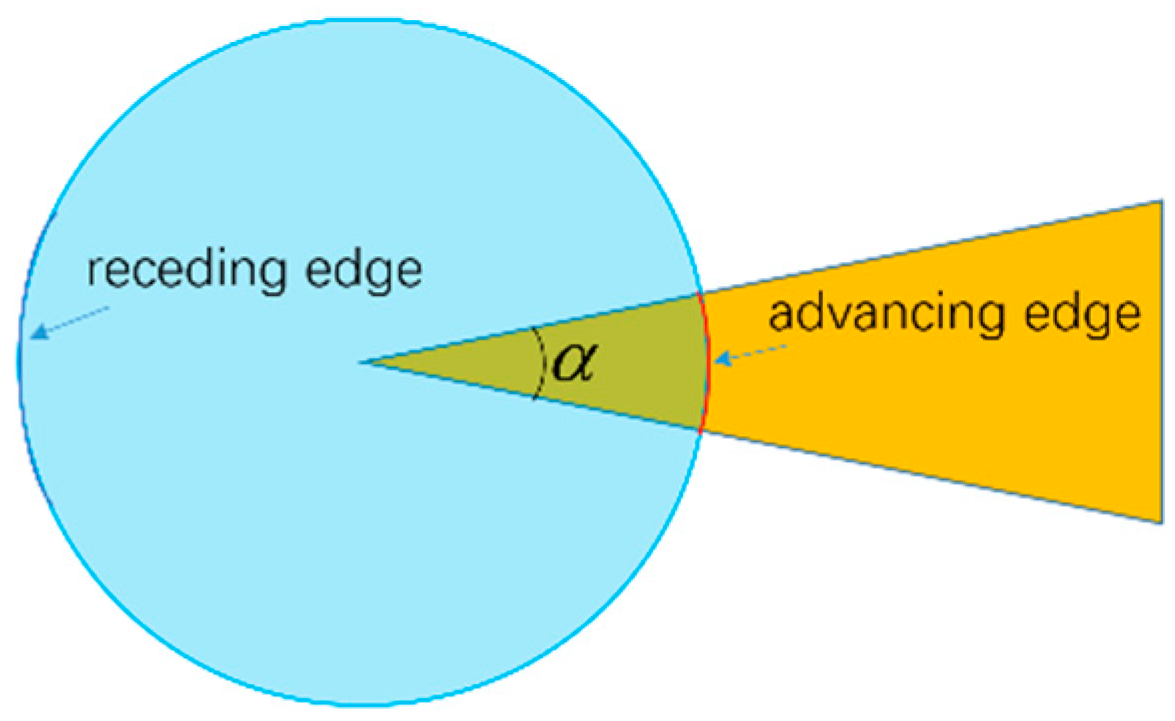
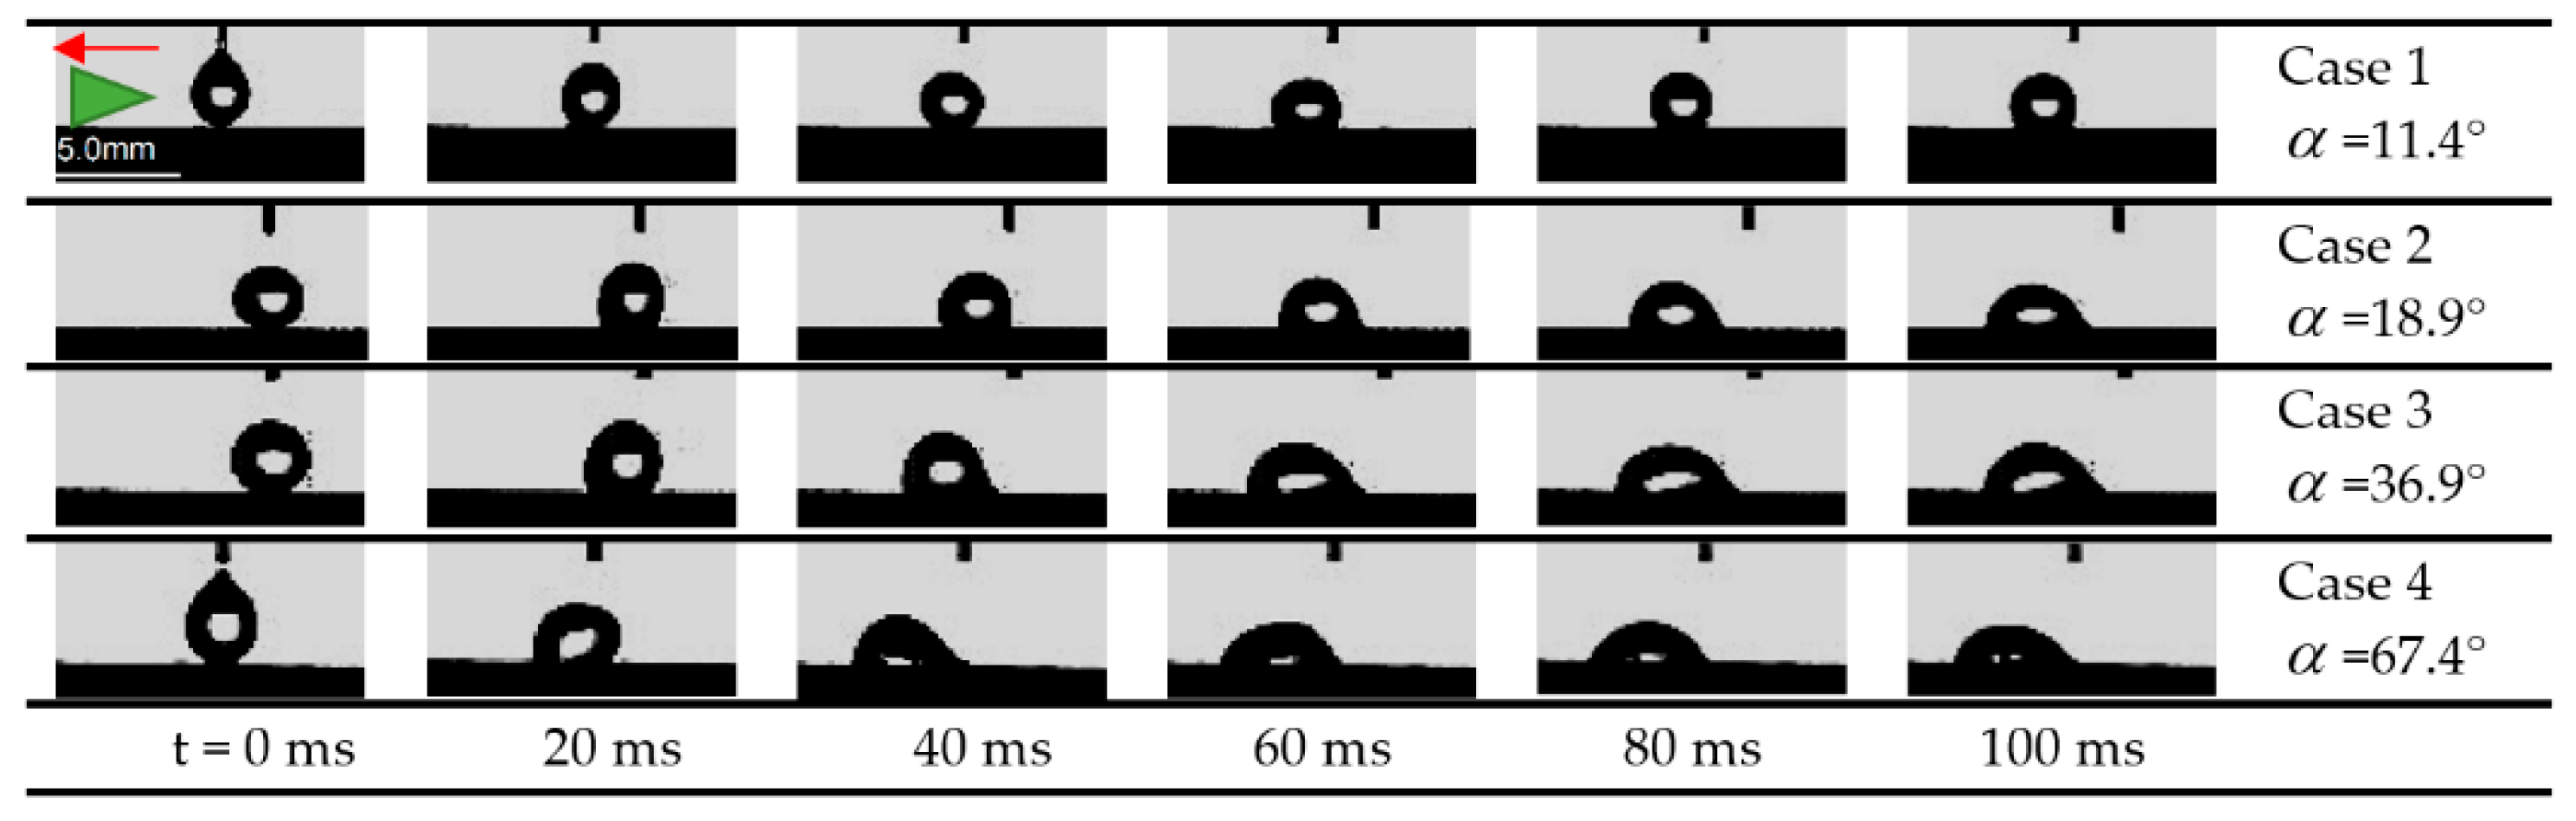
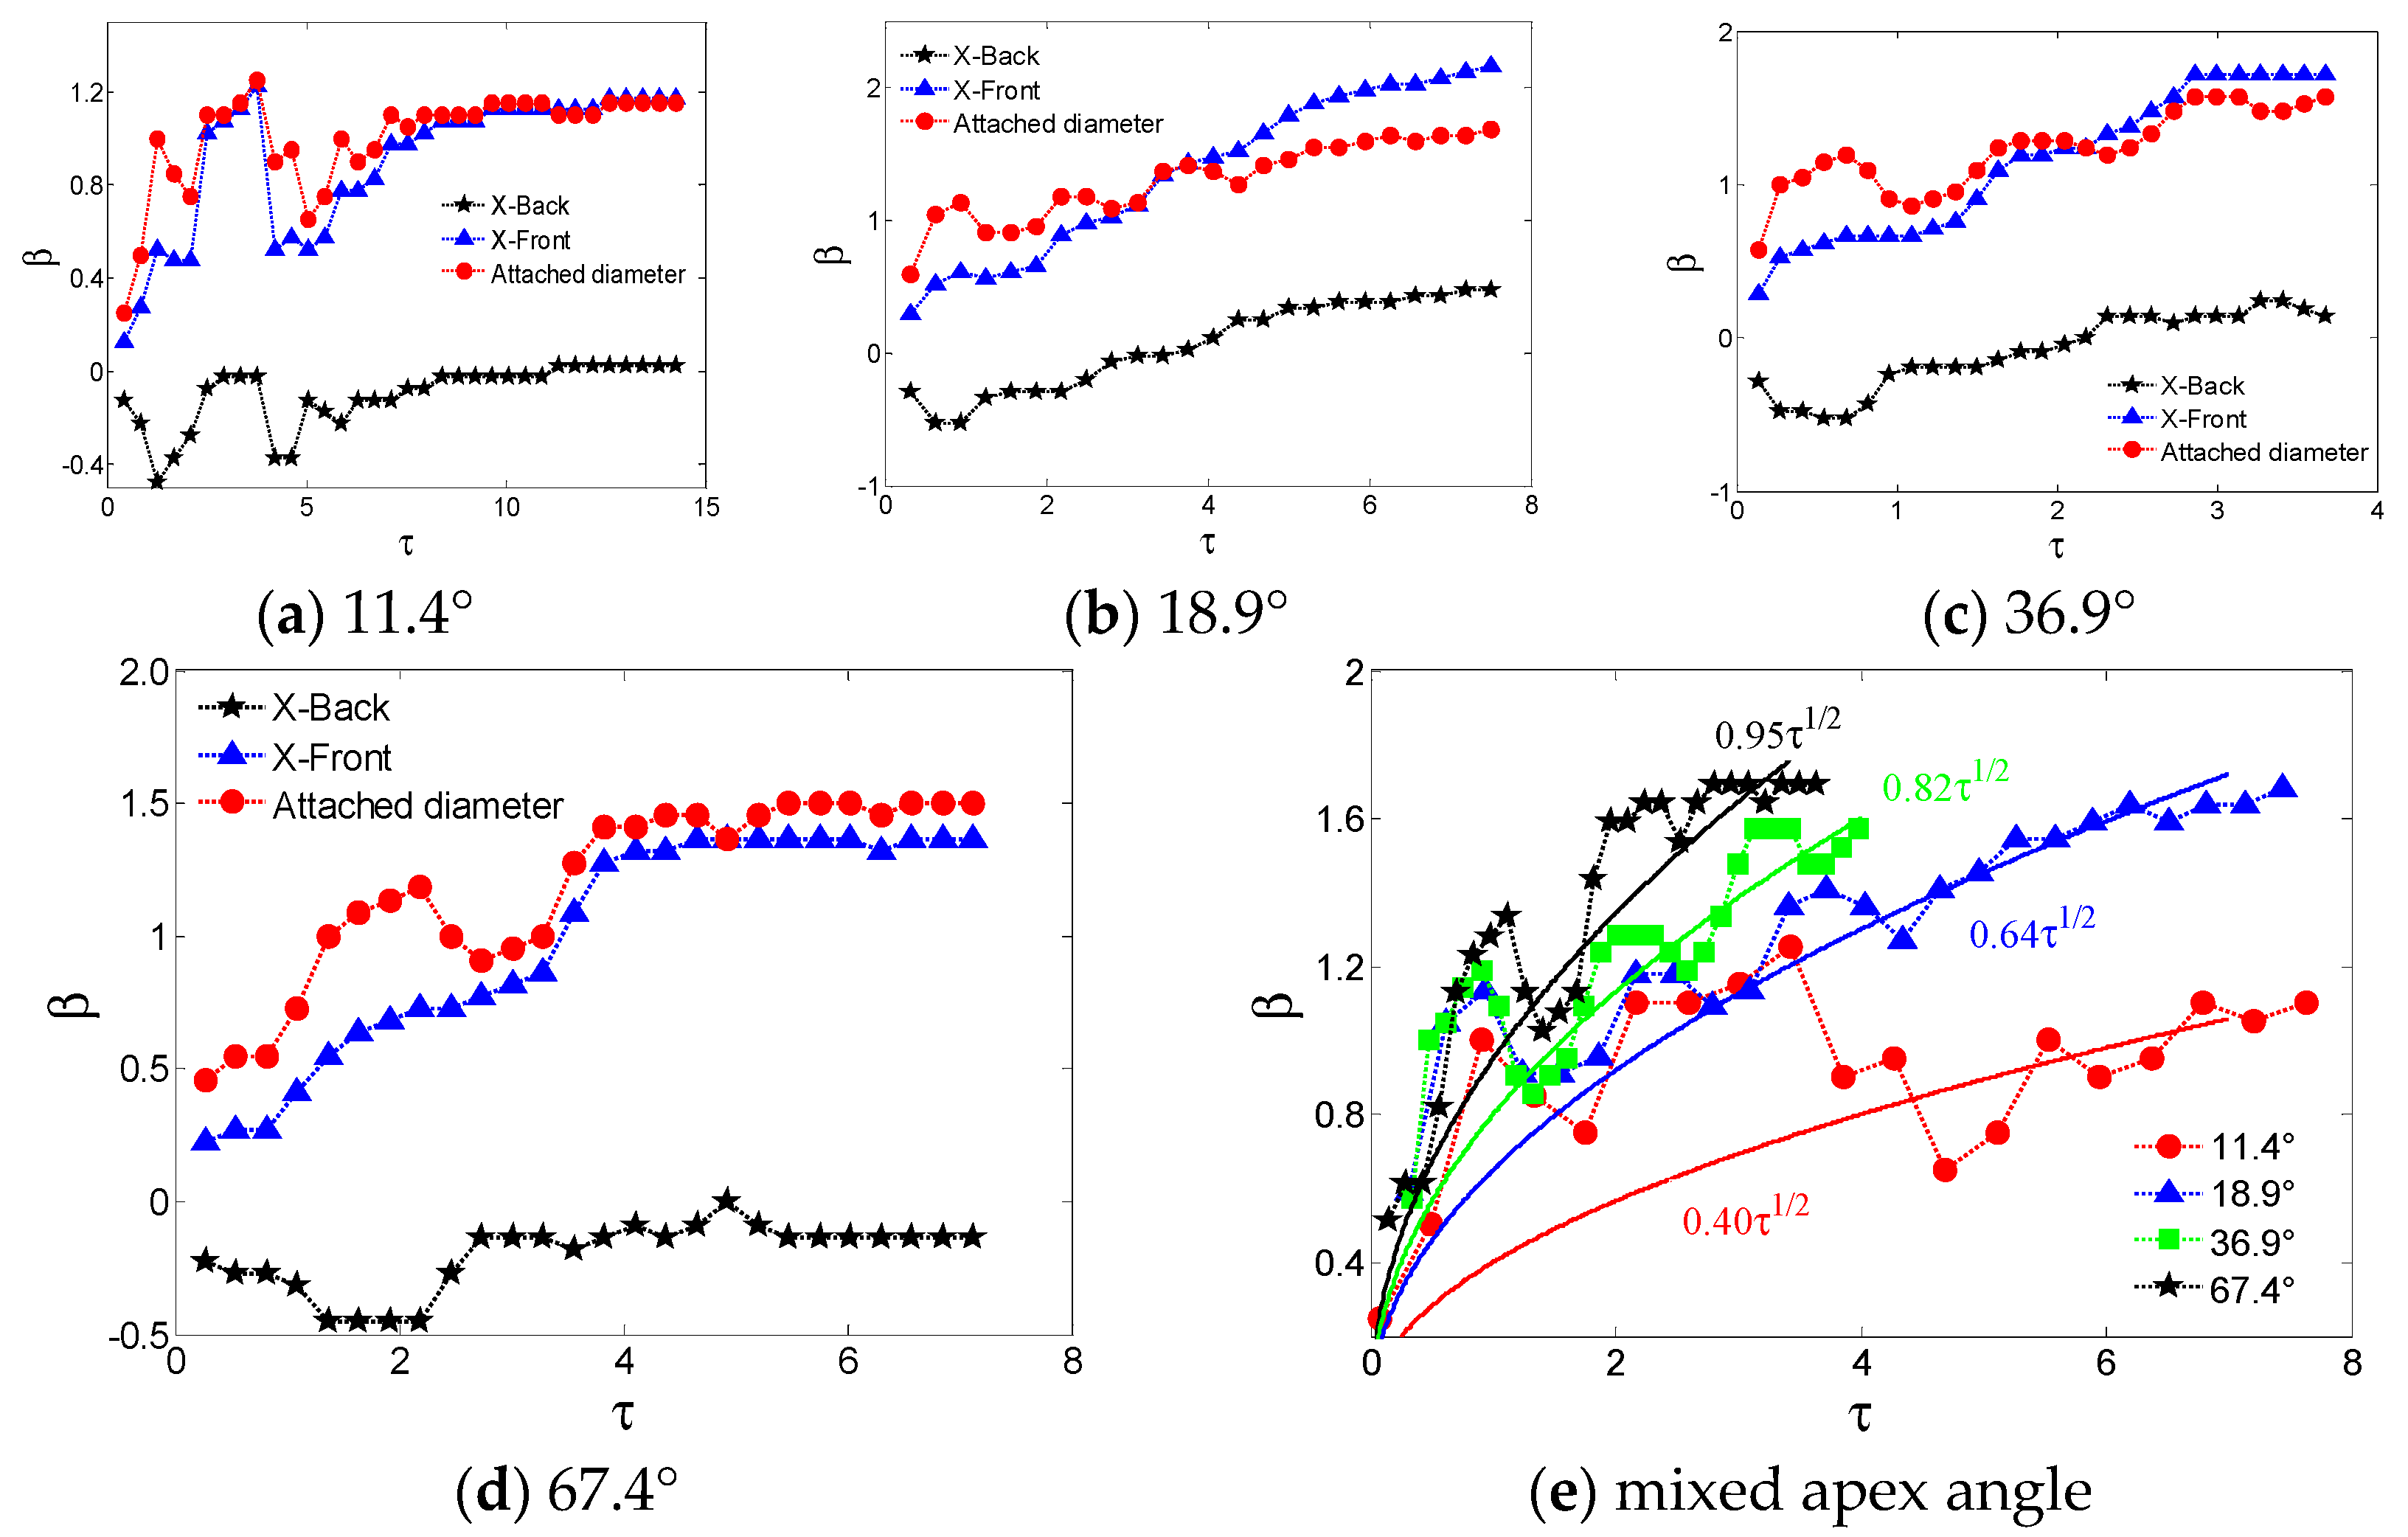
3.1. Effect of Apex Angle
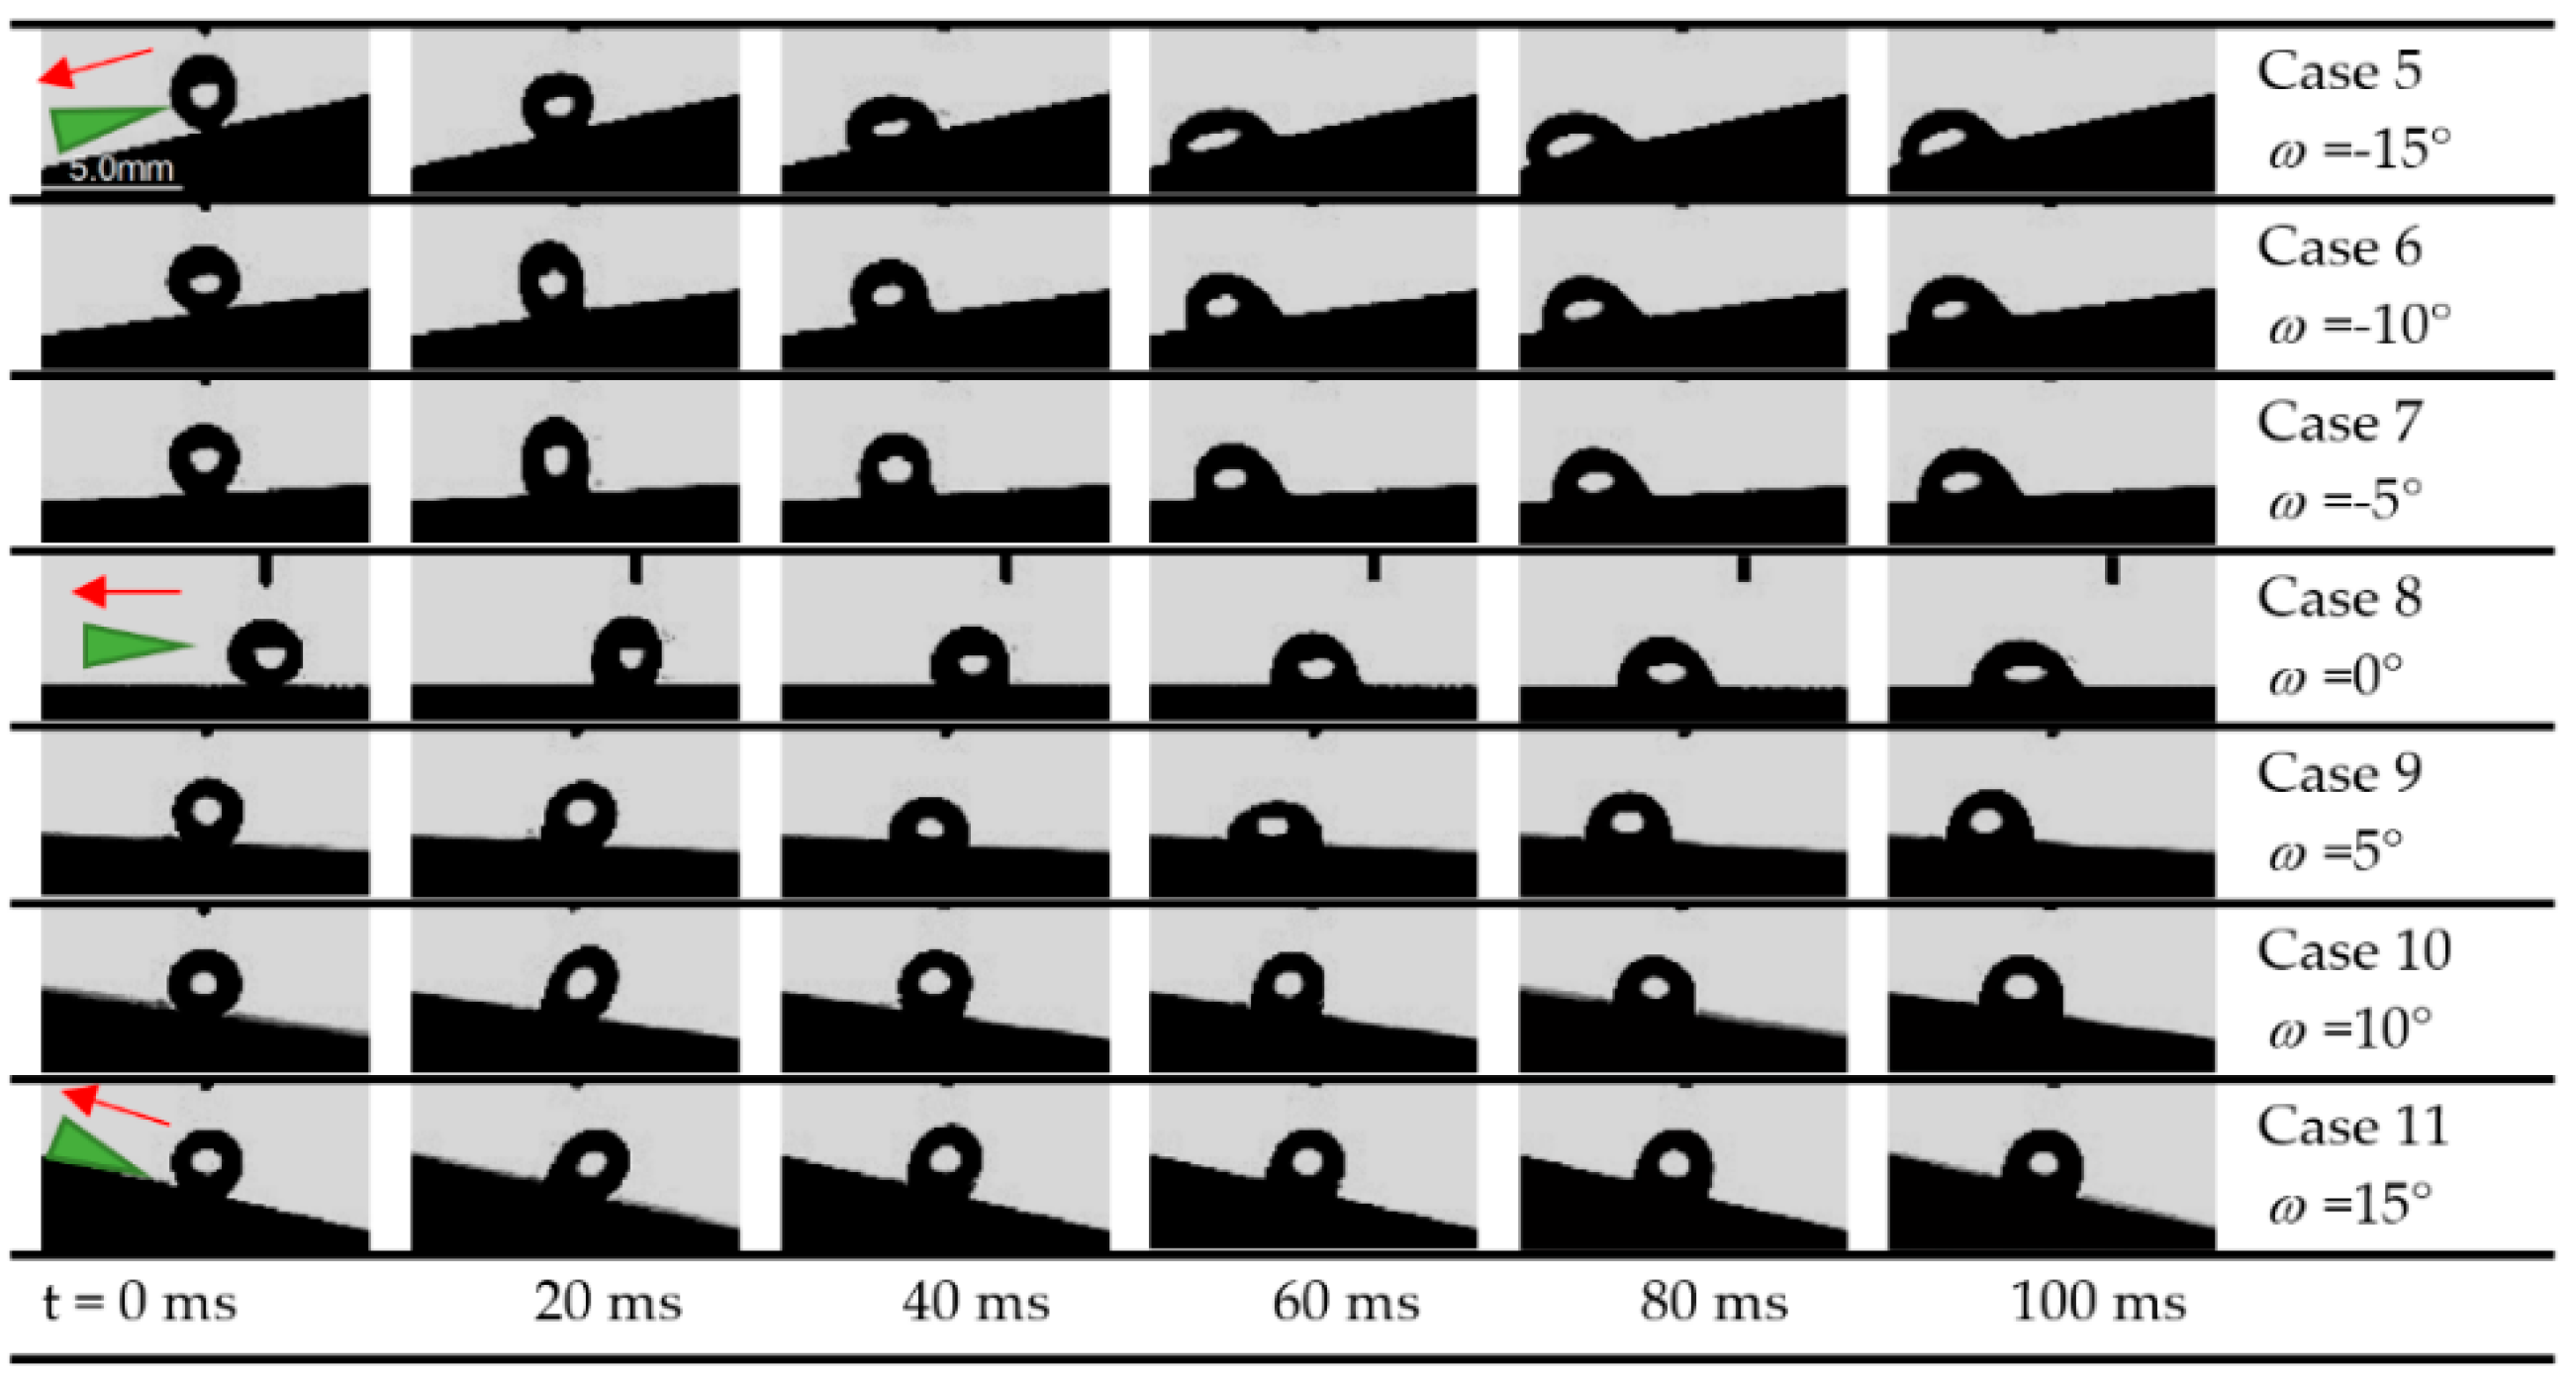
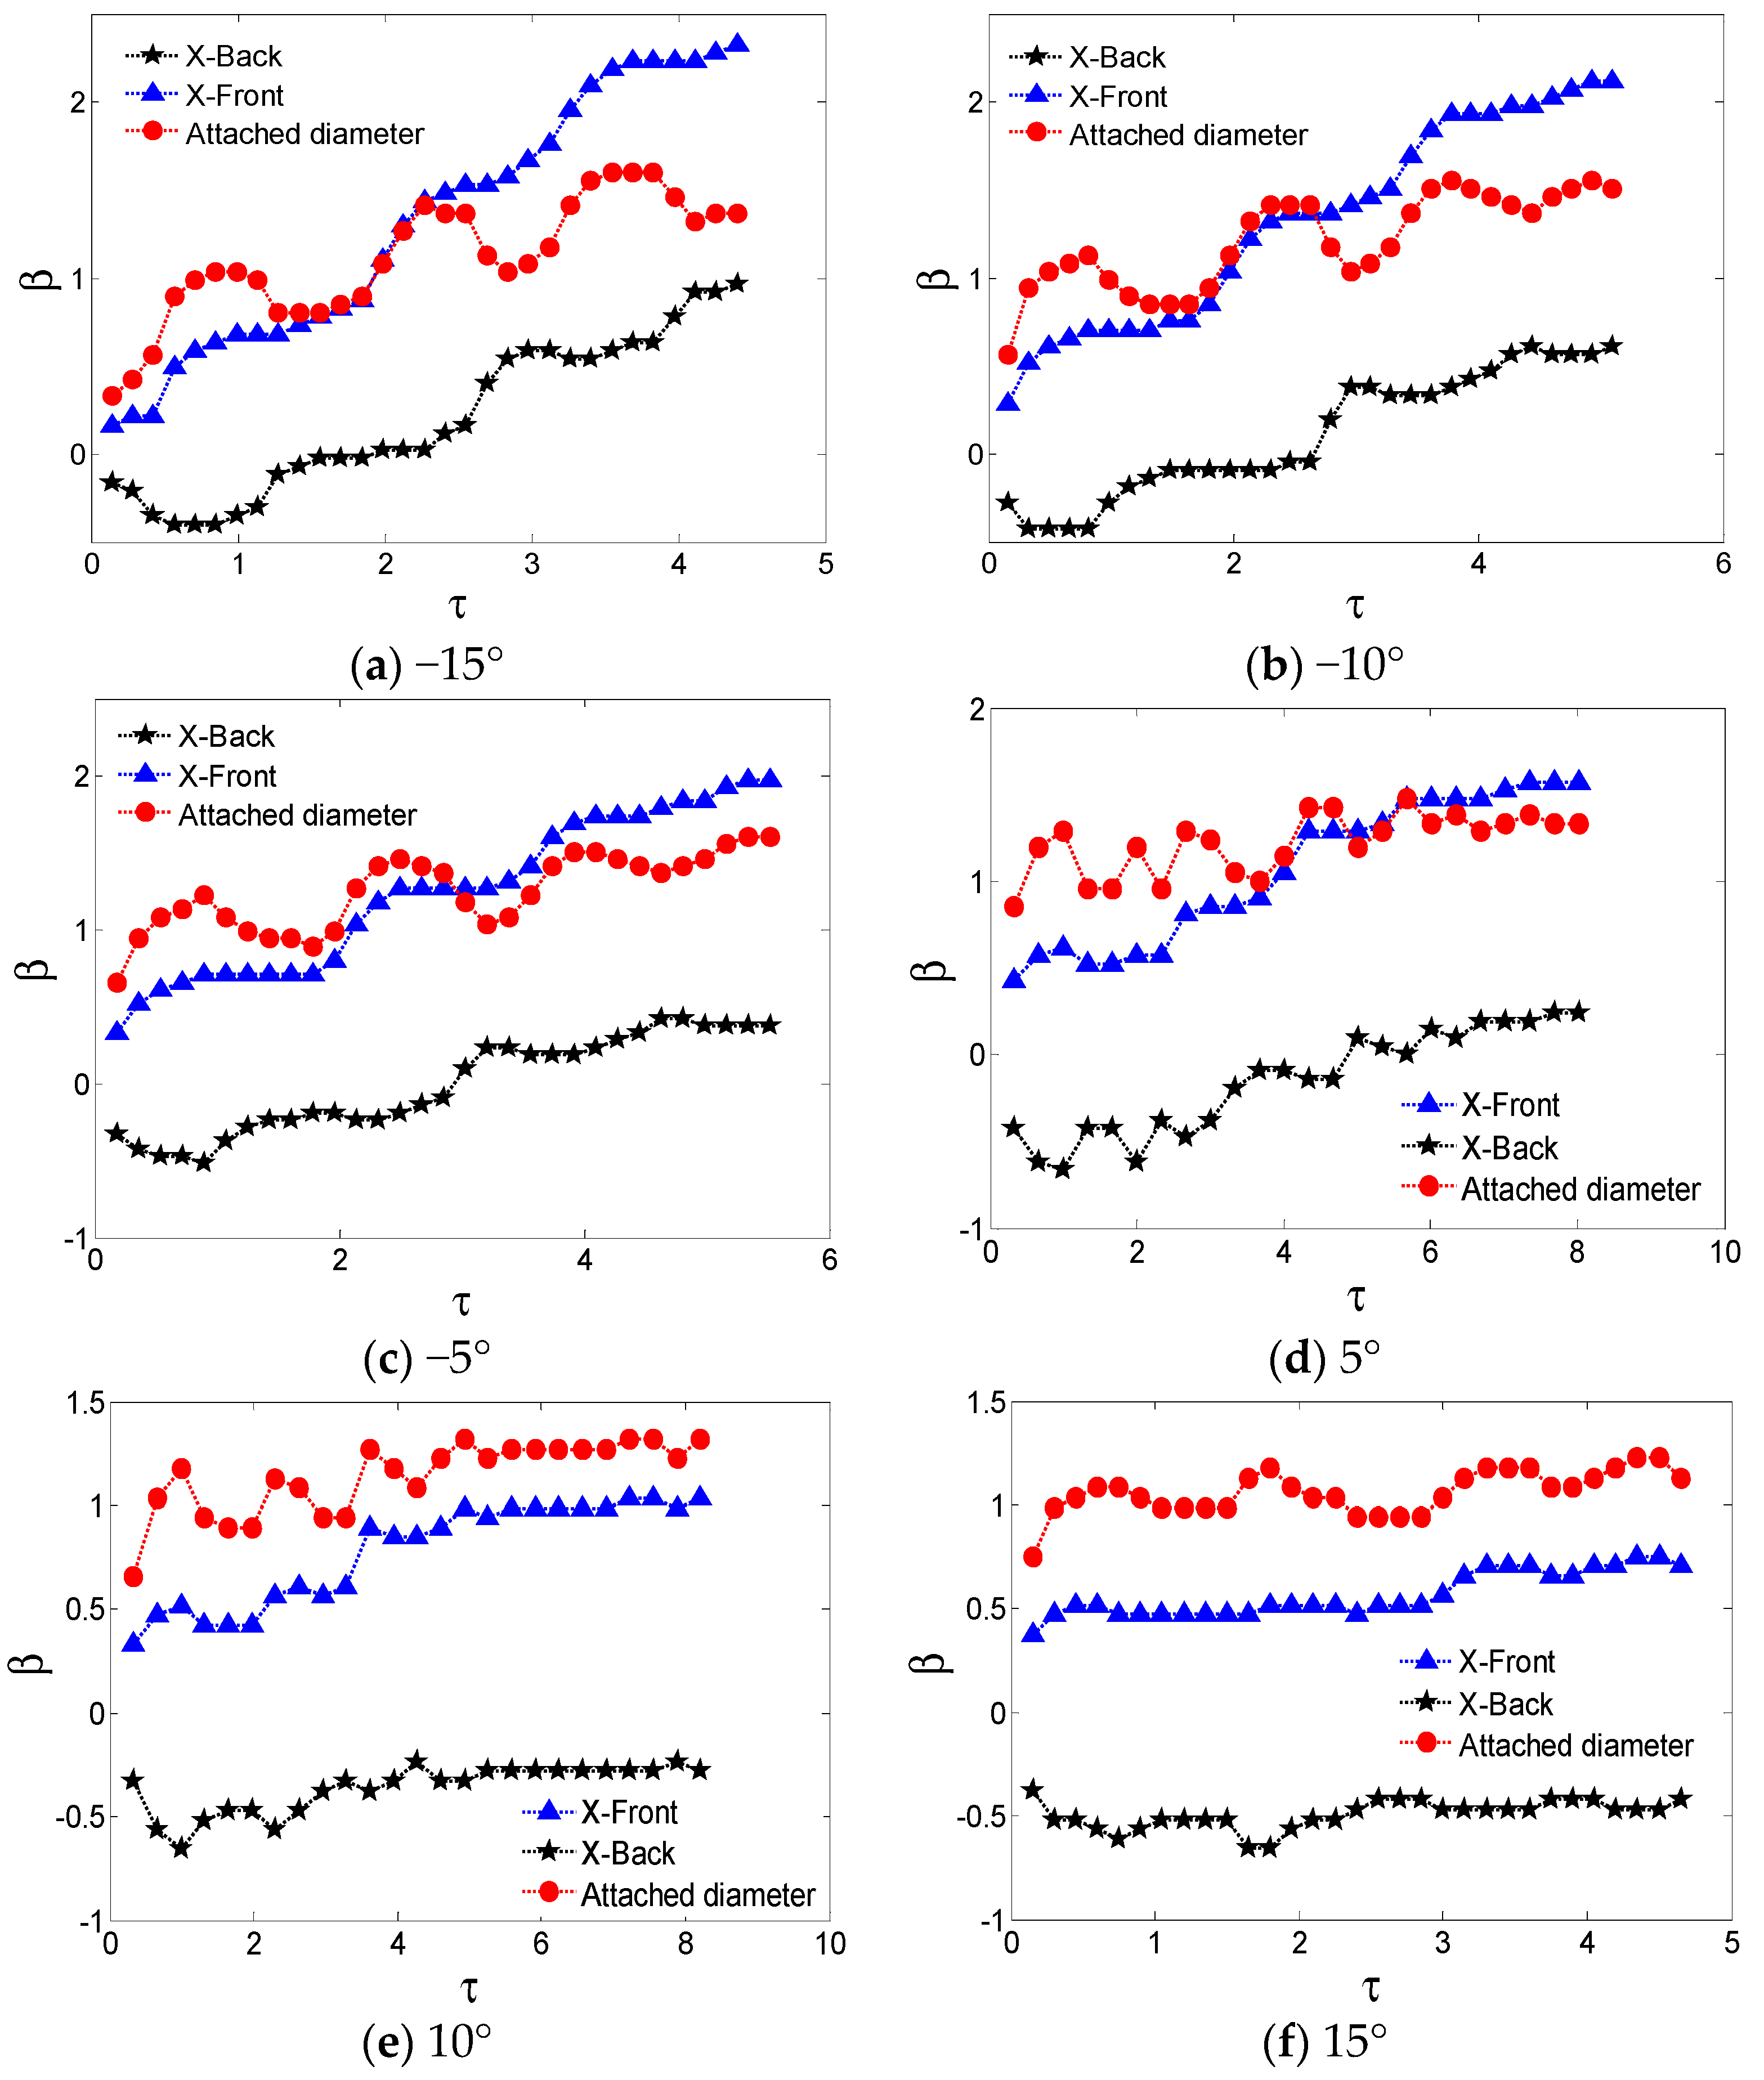
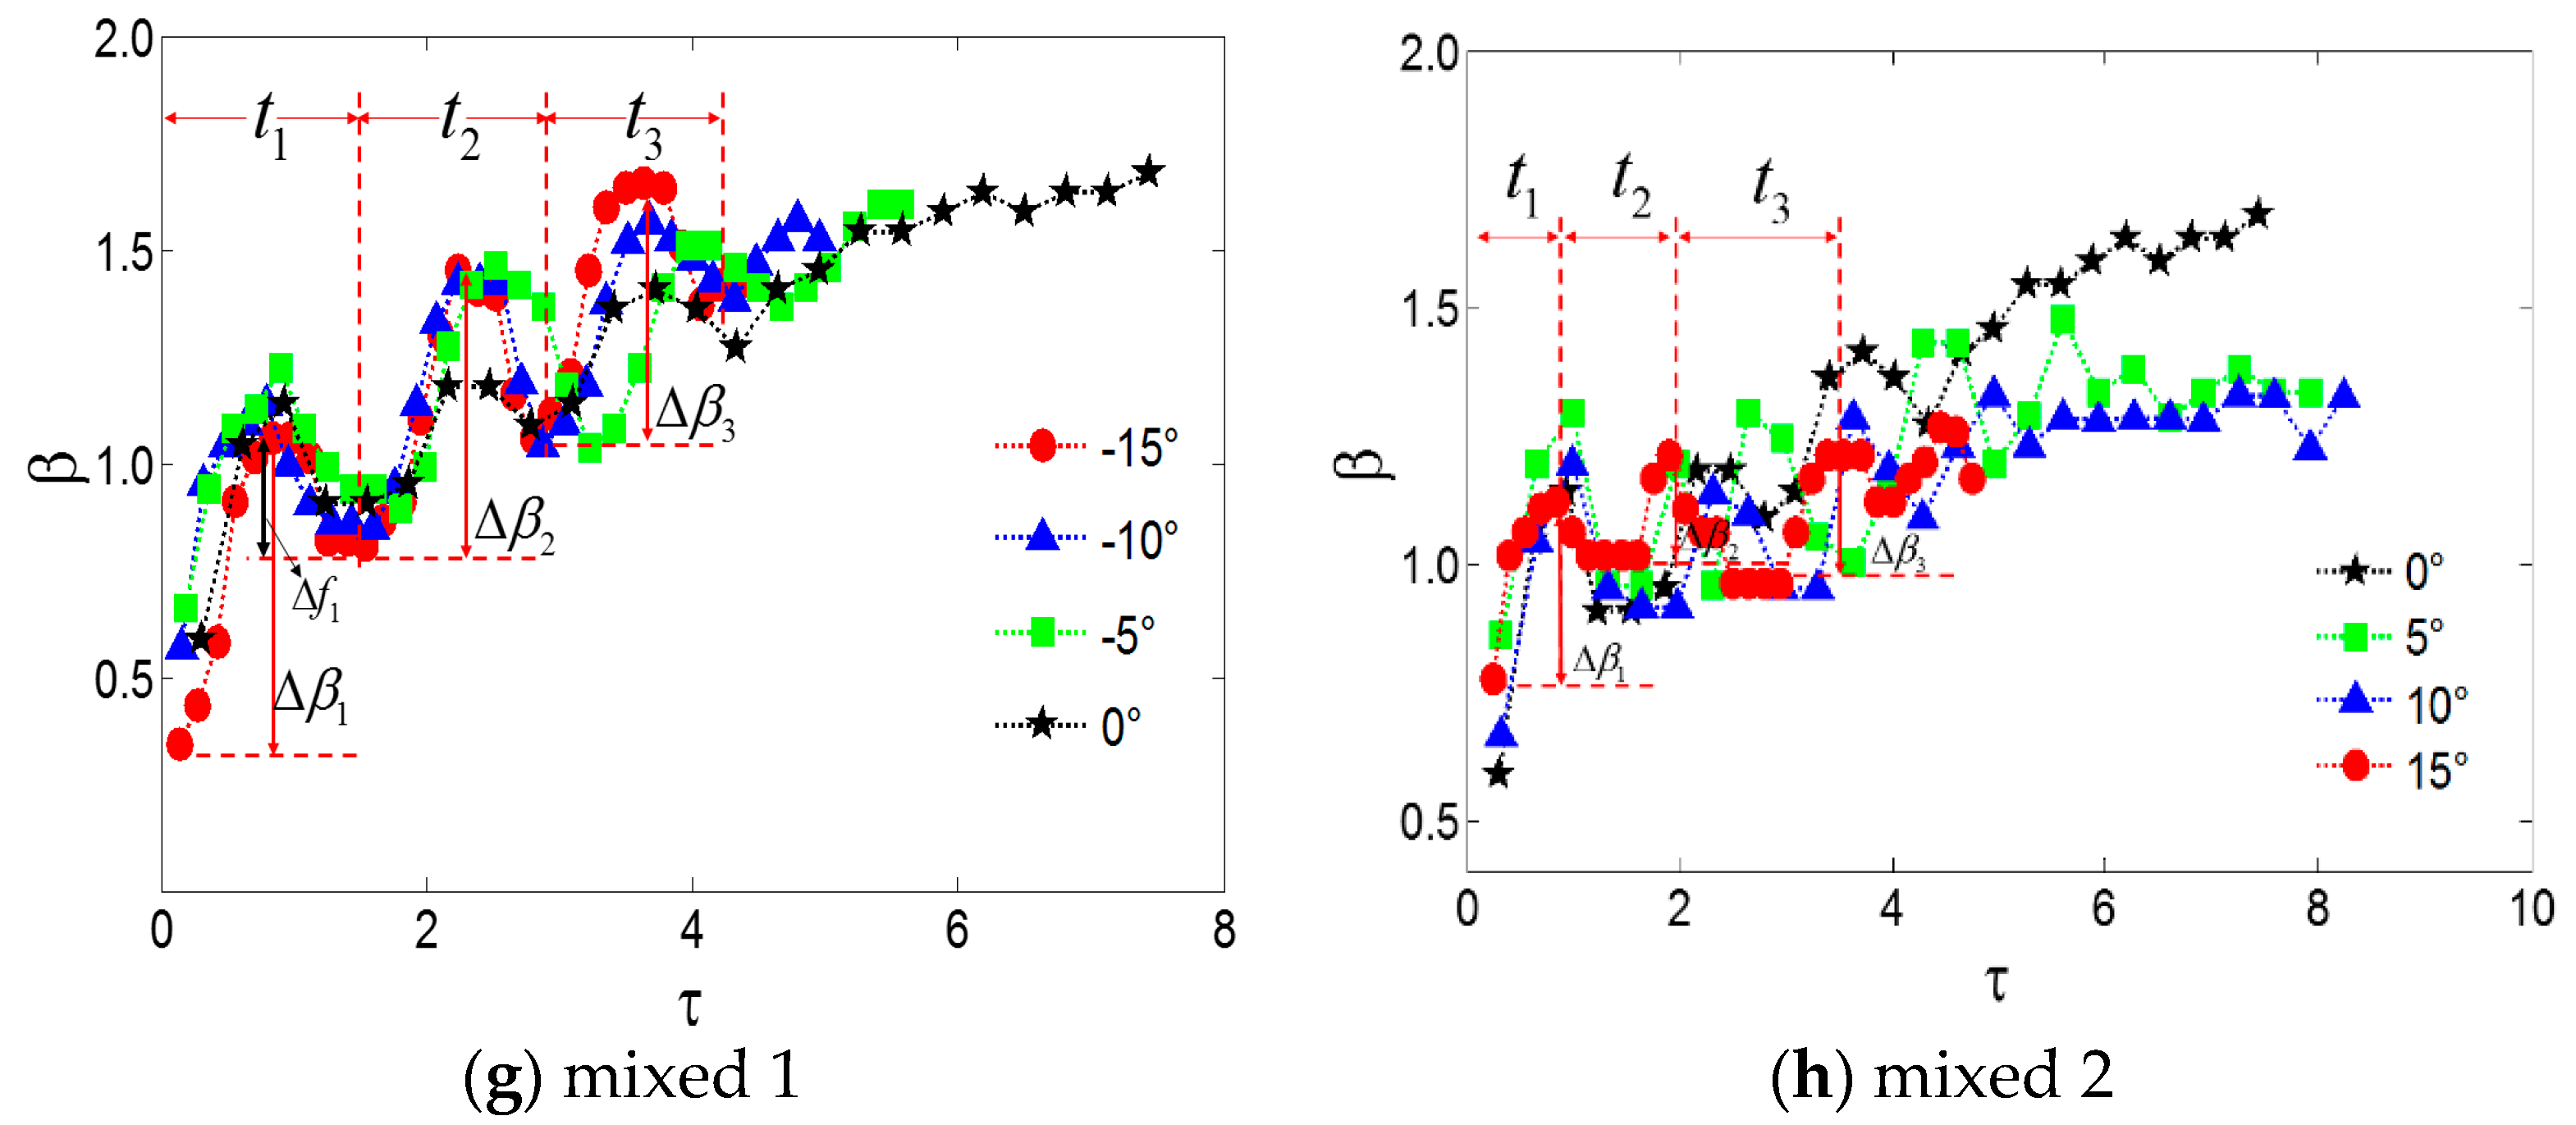
3.2. Effect of the Tilting Angle
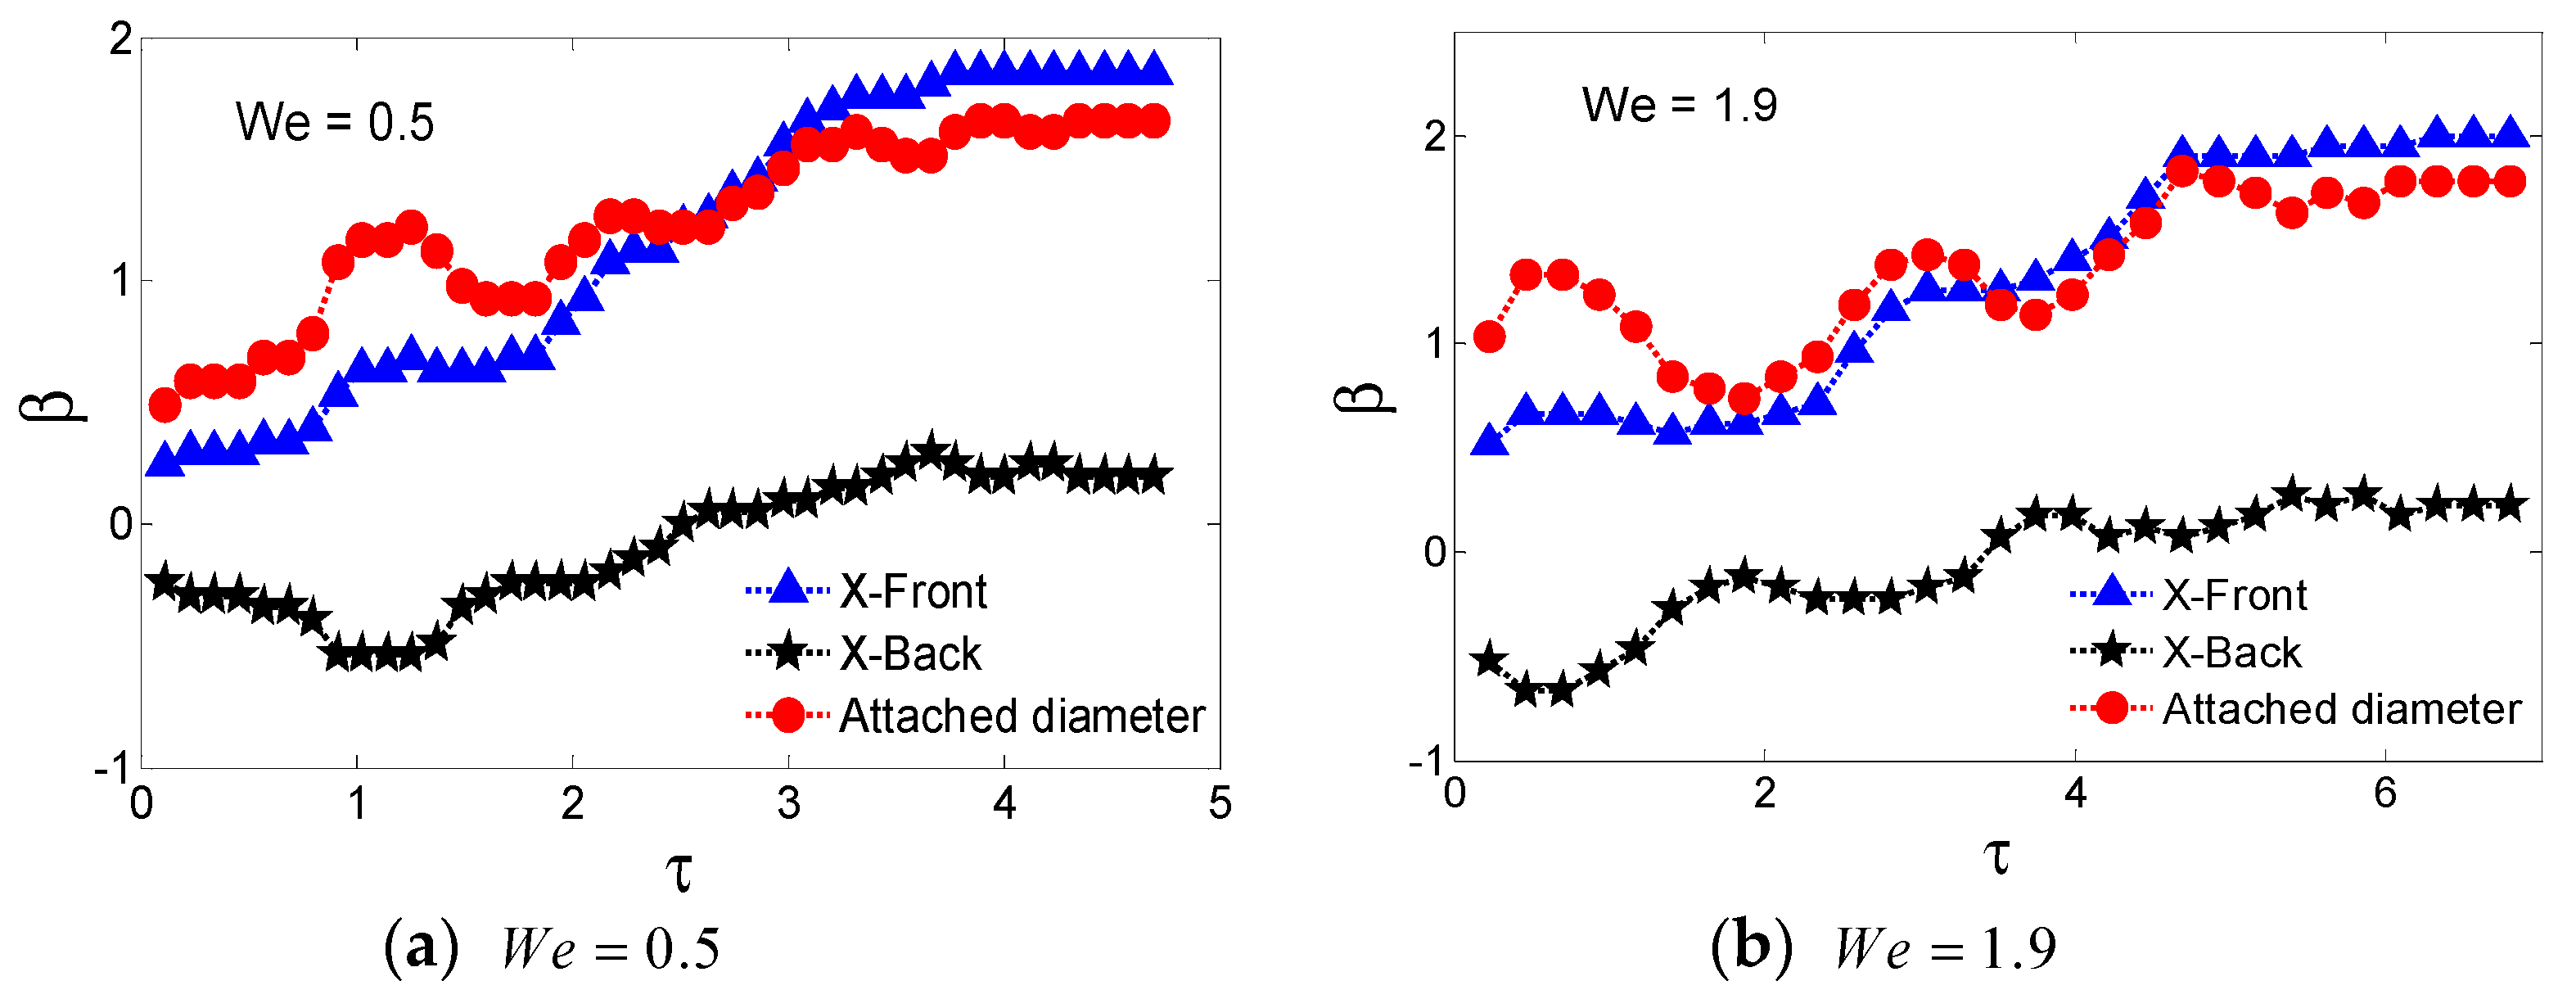
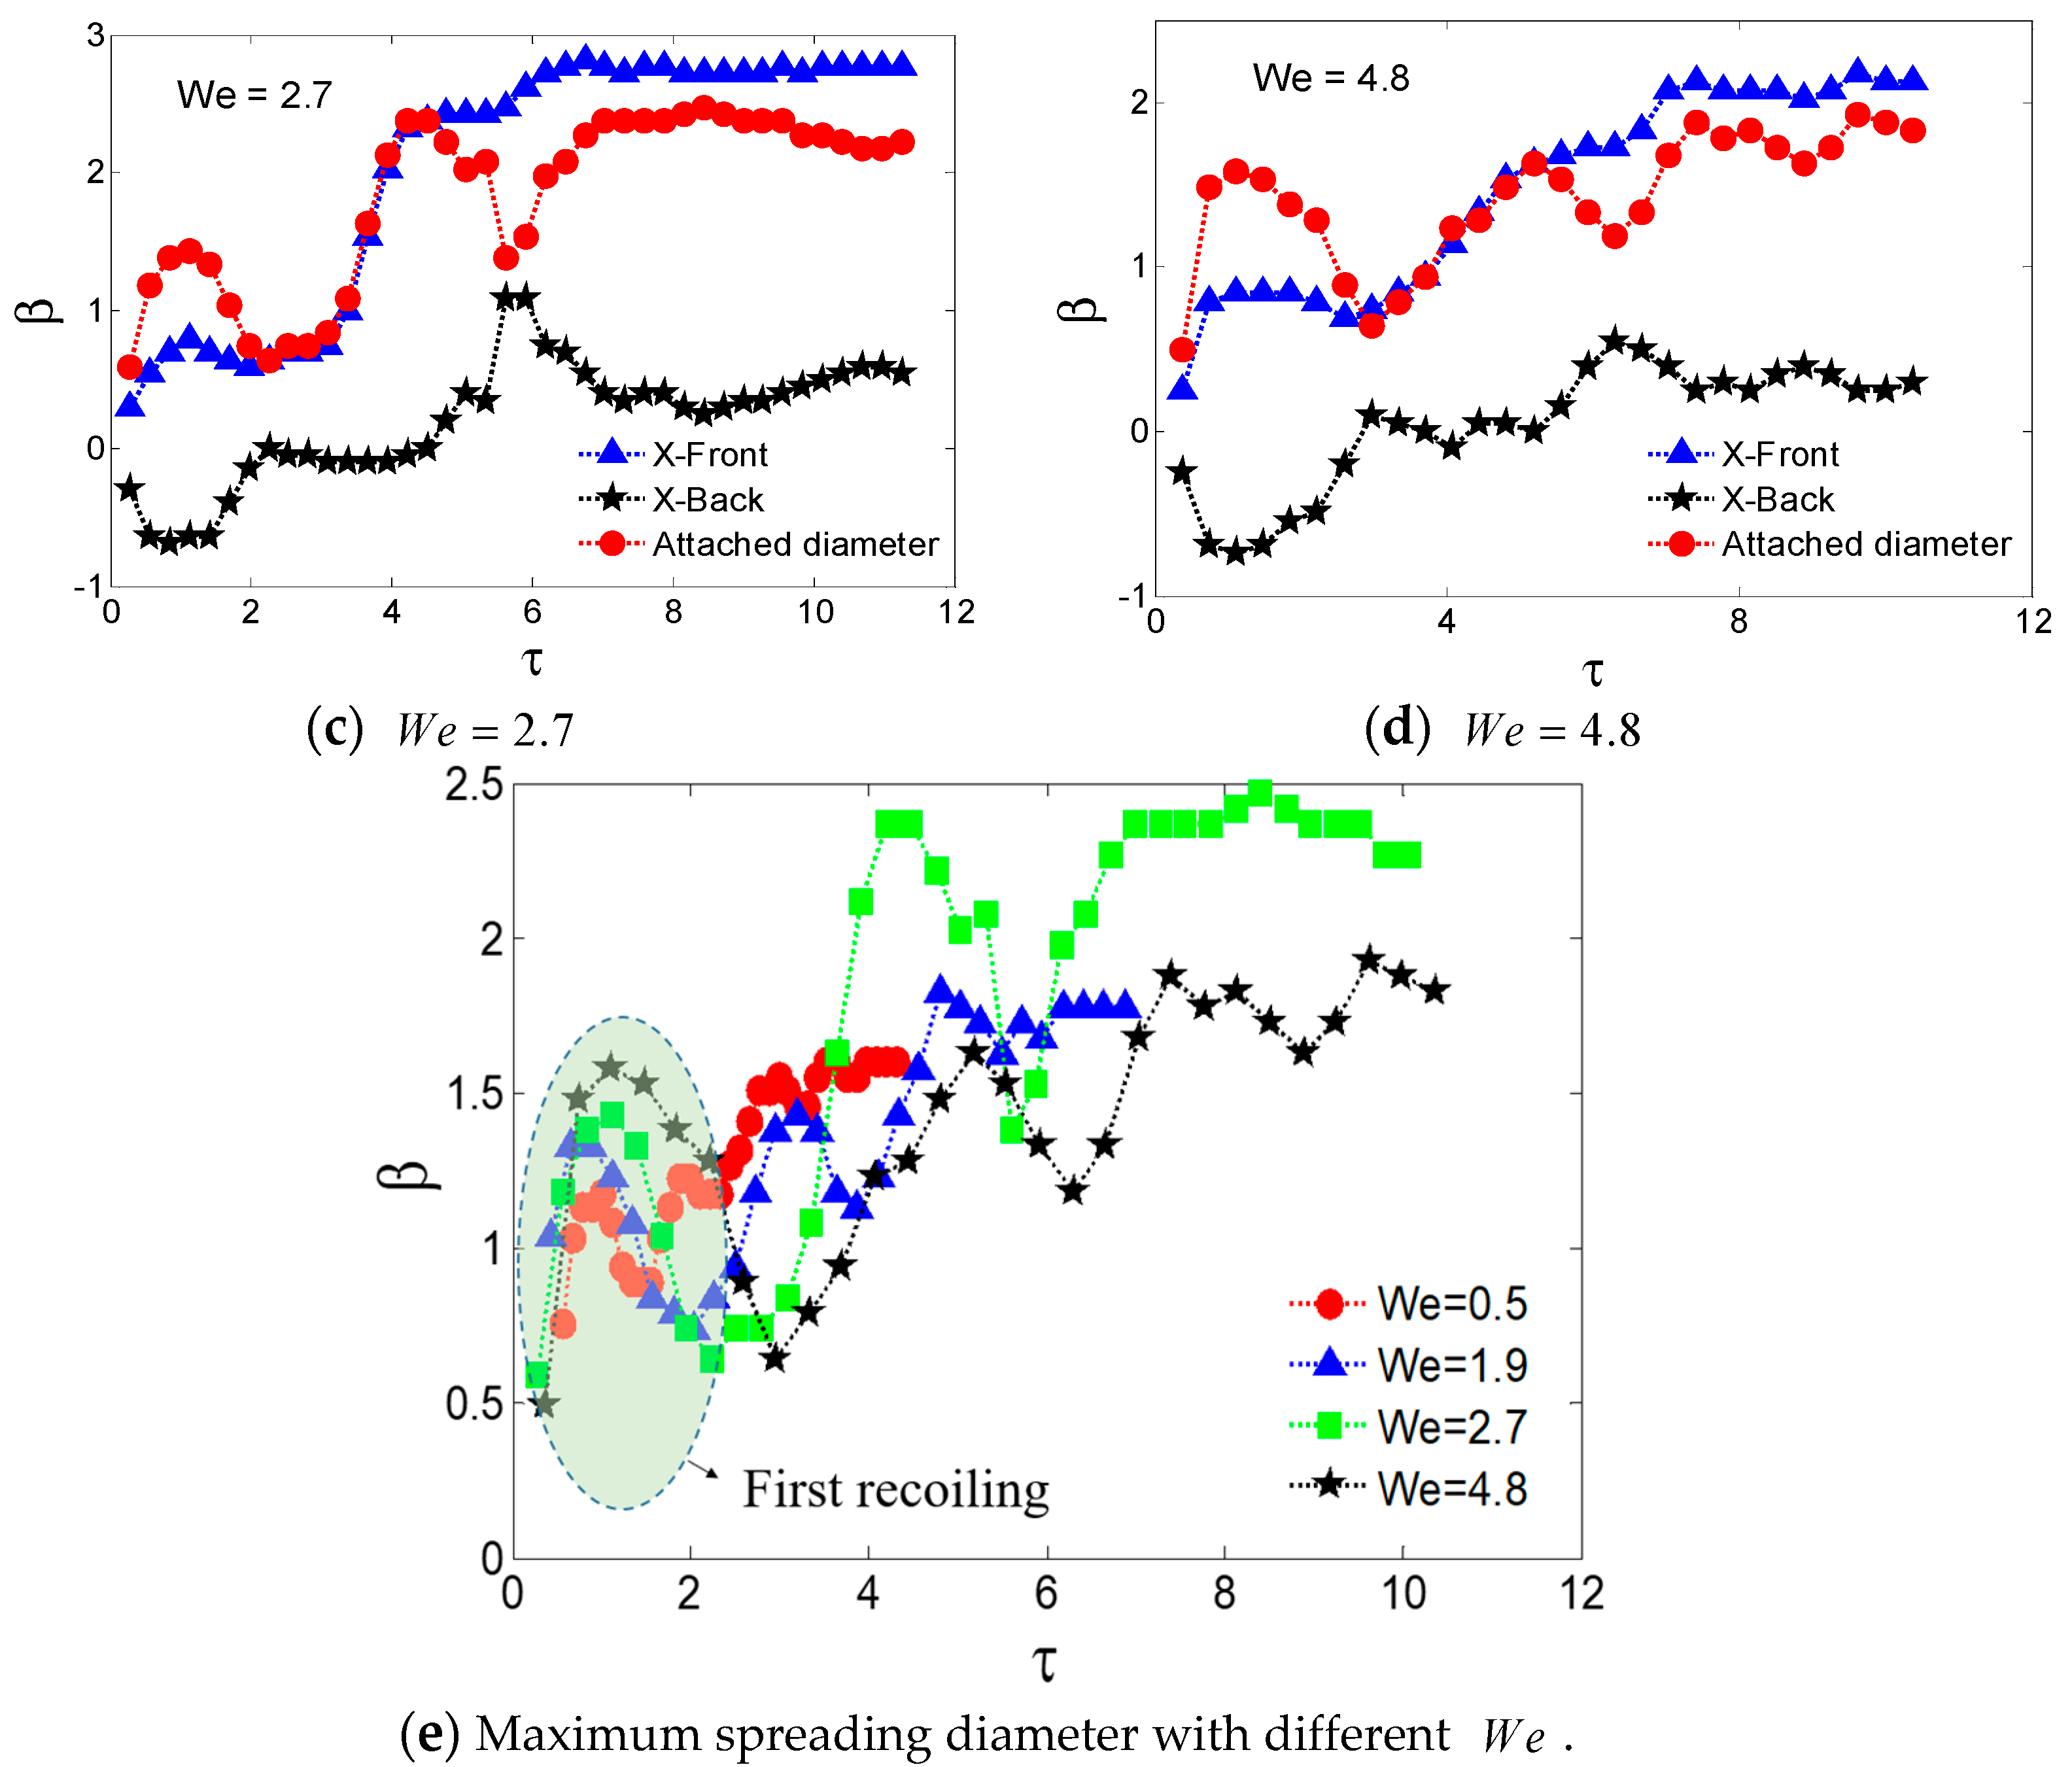
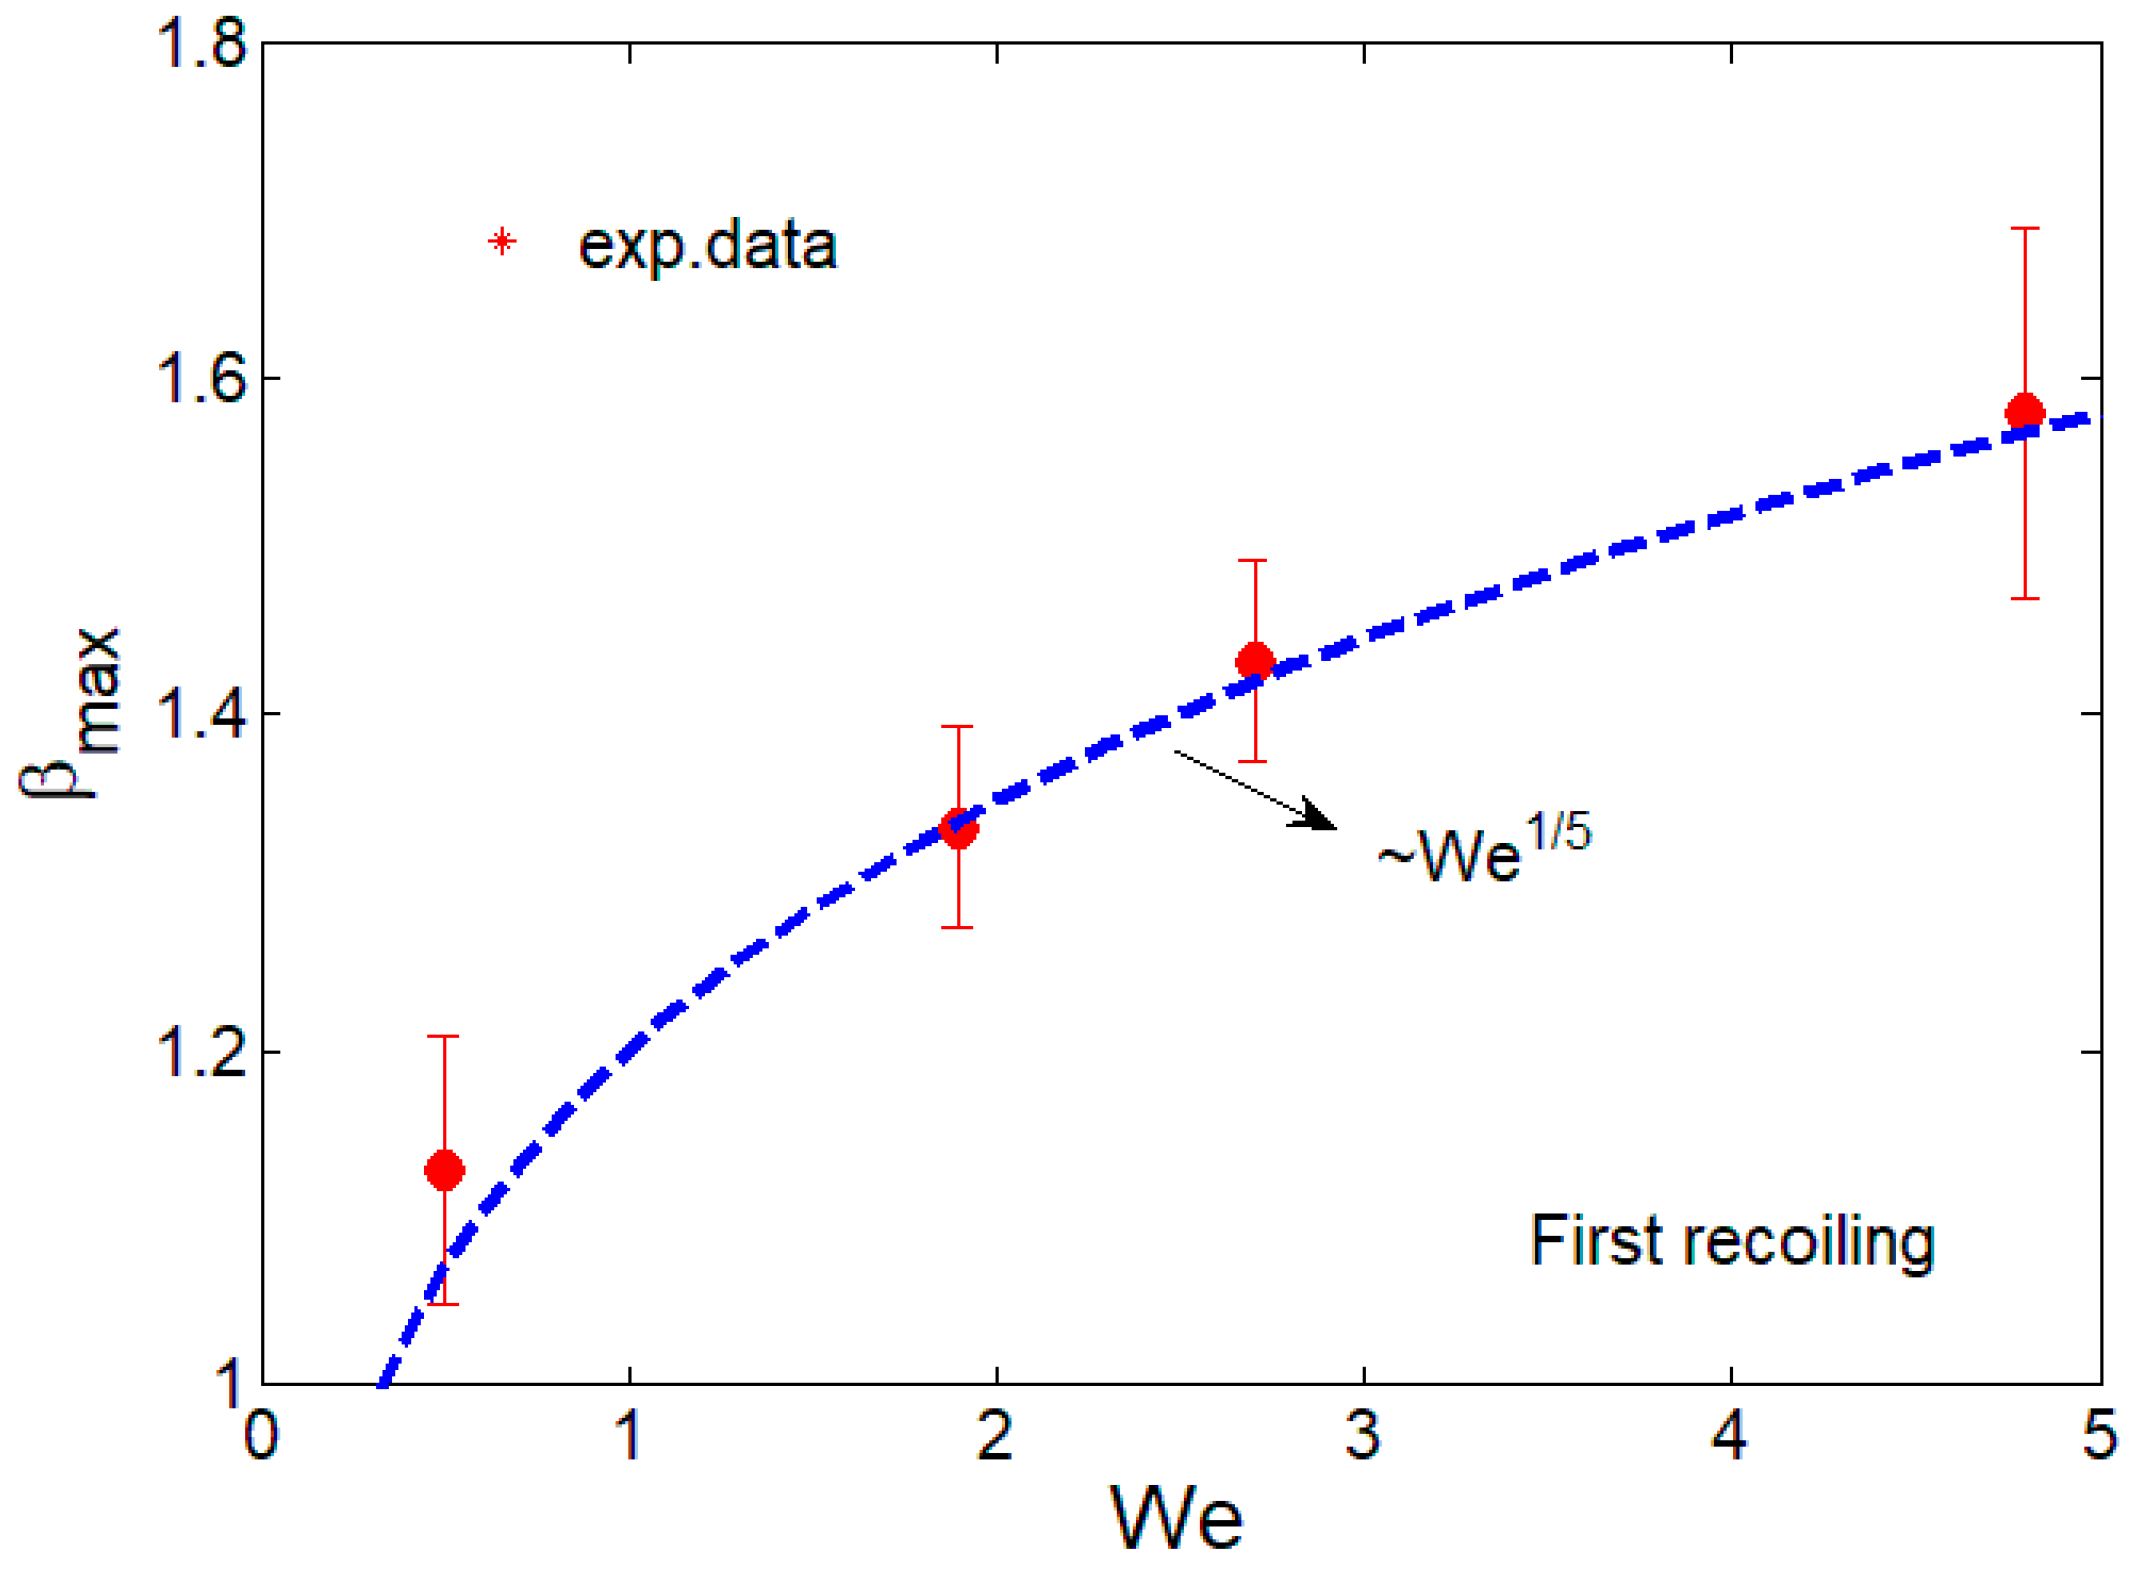
3.3. Effects of Impact Velocity
4. Conclusions
Author Contributions
Funding
Acknowledgments
Conflicts of Interest
References
- Vakarelski, I.U.; Patankar, N.A.; Marston, J.O.; Chan, D.Y.C. Stabilization of Leidenfrost vapour layer by textured superhydrophobic surfaces. Nature 2012, 489, 274–277. [Google Scholar] [CrossRef] [PubMed]
- Liu, Y.; Ma, L.; Wang, W.; Kota, A.K.; Hu, H. An experimental study on soft PDMS materials for aircraft icing mitigation. Appl. Surf. Sci. 2018, 447, 599–609. [Google Scholar] [CrossRef]
- Liu, Y.; Li, L.; Li, H.; Hu, H. An experimental study of surface wettability effects on dynamic ice accretion process over an UAS propeller model. Aerosp. Sci. Technol. 2018, 73, 164–172. [Google Scholar] [CrossRef]
- Liu, Y.; Kolbakir, C.; Hu, H. A comparison study on the thermal effects in DBD plasma actuation and electrical heating for aircraft icing mitigation. Int. J. Heat Mass Transf. 2018, 124, 319–330. [Google Scholar] [CrossRef]
- Attinger, D.; Frankiewicz, C.; Betz, A.; Schutzius, T.; Ganguly, R.; Das, A.; Kim, C.-J.; Megaridis, C. Surface engineering for phase change heat transfer: A review. MRS Energy Sustain. 2014, 1. [Google Scholar] [CrossRef] [Green Version]
- Yarin, A.L. Drop impact dynamics: Splashing, spreading, receding, bouncing…. Annu. Rev. Fluid Mech. 2006, 38, 159–192. [Google Scholar] [CrossRef]
- Fernandez-Blazquez, J.P.; Fell, D.; Bonaccurso, E.; del Campo, A. Superhydrophilic and superhydrophobic nanostructured surfaces via plasma treatment. J. Colloid Interface Sci. 2011, 357, 234–238. [Google Scholar] [CrossRef]
- Bartolo, D.; Josserand, C.; Bonn, D. Retraction dynamics of aqueous drops upon impact on non-wetting surfaces. J. Fluid Mech. 2005, 545, 329–338. [Google Scholar] [CrossRef] [Green Version]
- Park, J.; Kim, D.; Changwoo, L. Contact angle control of sessile drops on a tensioned web. Appl. Surf. Sci. 2018, 437, 329–335. [Google Scholar] [CrossRef]
- Moon, J.H.; Cho, M.; Lee, S.H. Dynamic contact angle and liquid displacement of a droplet impinging on heated textured surfaces. Exp. Therm. Fluid Sci. 2019, 101, 128–135. [Google Scholar] [CrossRef]
- Deng, S.; Shang, W.; Feng, S.; Zhu, S.; Xing, Y.; Li, D.; Hou, Y.; Zheng, Y. Controlled droplet transport to target on a high adhesion surface with multi-gradients. Sci. Rep. 2017, 7, 45687. [Google Scholar] [CrossRef] [PubMed] [Green Version]
- Wenzel, R.N. Resistance of solid surfaces to wetting by water. Ind. Eng. Chem. 1936, 28, 988–994. [Google Scholar] [CrossRef]
- Cassie, A.B.D.; Baxter, S. Wettability of porous surfaces. Trans. Faraday Soc. 1944, 40, 546–551. [Google Scholar] [CrossRef]
- Chaudhury, M.K.; Whitesides, G.M. How to make water run uphill. Science 1992, 256, 1539–1541. [Google Scholar] [CrossRef] [PubMed]
- Ruiz-Gutiérrez, É.; Semprebon, C.; McHale, G.; Ledesma-Aguilar, R. Statics and dynamics of liquid barrels in wedge geometries. J. Fluid Mech. 2018, 842, 26–57. [Google Scholar] [CrossRef] [Green Version]
- Reyssat, E. Drops and bubbles in wedges. J. Fluid Mech. 2014, 748, 641–662. [Google Scholar] [CrossRef] [Green Version]
- Son, Y.; Kim, C.; Yang, D.H.; Ahn, D.J. Spreading of an inkjet droplet on a solid surface with a controlled contact angle at low Weber and Reynolds numbers. Langmuir 2008, 24, 2900–2907. [Google Scholar] [CrossRef]
- Lin, S.; Zhao, S.; Zou, S.; Guo, J.; Wei, Z.; Chen, L. Impact of viscous droplets on different wettable surfaces: Impact phenomena, the maximum spreading factor, spreading time and post-impact oscillation. J. Colloid Interface Sci. 2018, 516, 86–97. [Google Scholar] [CrossRef]
- Wang, Y.; Chen, S. Droplets impact on textured surfaces: Mesoscopic simulation of spreading dynamics. Appl. Surf. Sci. 2015, 327, 159–167. [Google Scholar] [CrossRef]
- Pasandideh-Fard, M.; Qiao, Y.M.; Chandra, S.; Mostaghimi, J. Capillary effects during droplet impact on a solid surface. Phys. Fluids 1996, 8, 650–659. [Google Scholar] [CrossRef]
- Zhao, B.; Wang, X.; Zhang, K.; Chen, L.; Deng, X. Impact of viscous droplets on superamphiphobic surfaces. Langmuir 2017, 33, 144–151. [Google Scholar] [CrossRef] [PubMed]
- Feng, S.; Wang, S.; Tao, Y.; Shang, W.; Deng, S.; Zheng, Y.; Hou, Y. Radial wettable gradient of hot surface to control droplets movement in directions. Sci. Rep. 2015, 5, 10067. [Google Scholar] [CrossRef] [PubMed]
- De Gennes, P.-G.; Brochard-Wyart, F.; Quere, D. Capillarity and Wetting Phenomena; Springer: New York, NY, USA, 2002. [Google Scholar]
- Brochard-Wyart, F.; de Gennes, P.G. Dynamics of partial wetting. Adv. Colloid Int. Sci. 1992, 39, 1–11. [Google Scholar] [CrossRef]
- Chandra, S.; Avedidian, C.T. On the collision of a droplet with a solid surface. Proc. R. Soc. A 1991, 432, 13–41. [Google Scholar] [CrossRef]
- White, F.M. Viscous Fluid Flow; McGraw-Hill: New York, NY, USA, 1991. [Google Scholar]
- Eggers, J.; Fontelos, M.A.; Josserand, C.; Zaleski, S. Drop dynamics after impact on a solid wall: Theory and simulations. Phys. Fluids 2010, 22, 062101. [Google Scholar] [CrossRef] [Green Version]


| Case 1~4 | Case 5~11 | Case 12 | Case 13 | Case 14 | Case 15 | |
|---|---|---|---|---|---|---|
| (mm) | 3.54 | 3.82 | 3.17 | 5.31 | 6.48 | 9.51 |
| (m/s) | 0.14 | 0.16 | 0.11 | 0.23 | 0.28 | 0.37 |
| (-) | 0.70 | 0.89 | 0.45 | 1.90 | 2.70 | 4.75 |
| (-) | 398 | 448 | 319 | 654 | 778 | 1032 |
| (-) | 1.8 × 10⁻³ | 2.0 × 10⁻³ | 1.4 × 10⁻³ | 2.9 × 10⁻³ | 3.5 × 10⁻³ | 4.6 × 10⁻³ |
| (ms) | 17.5 | 21.4 | 21.8 | 10.7 | 9.0 | 6.8 |
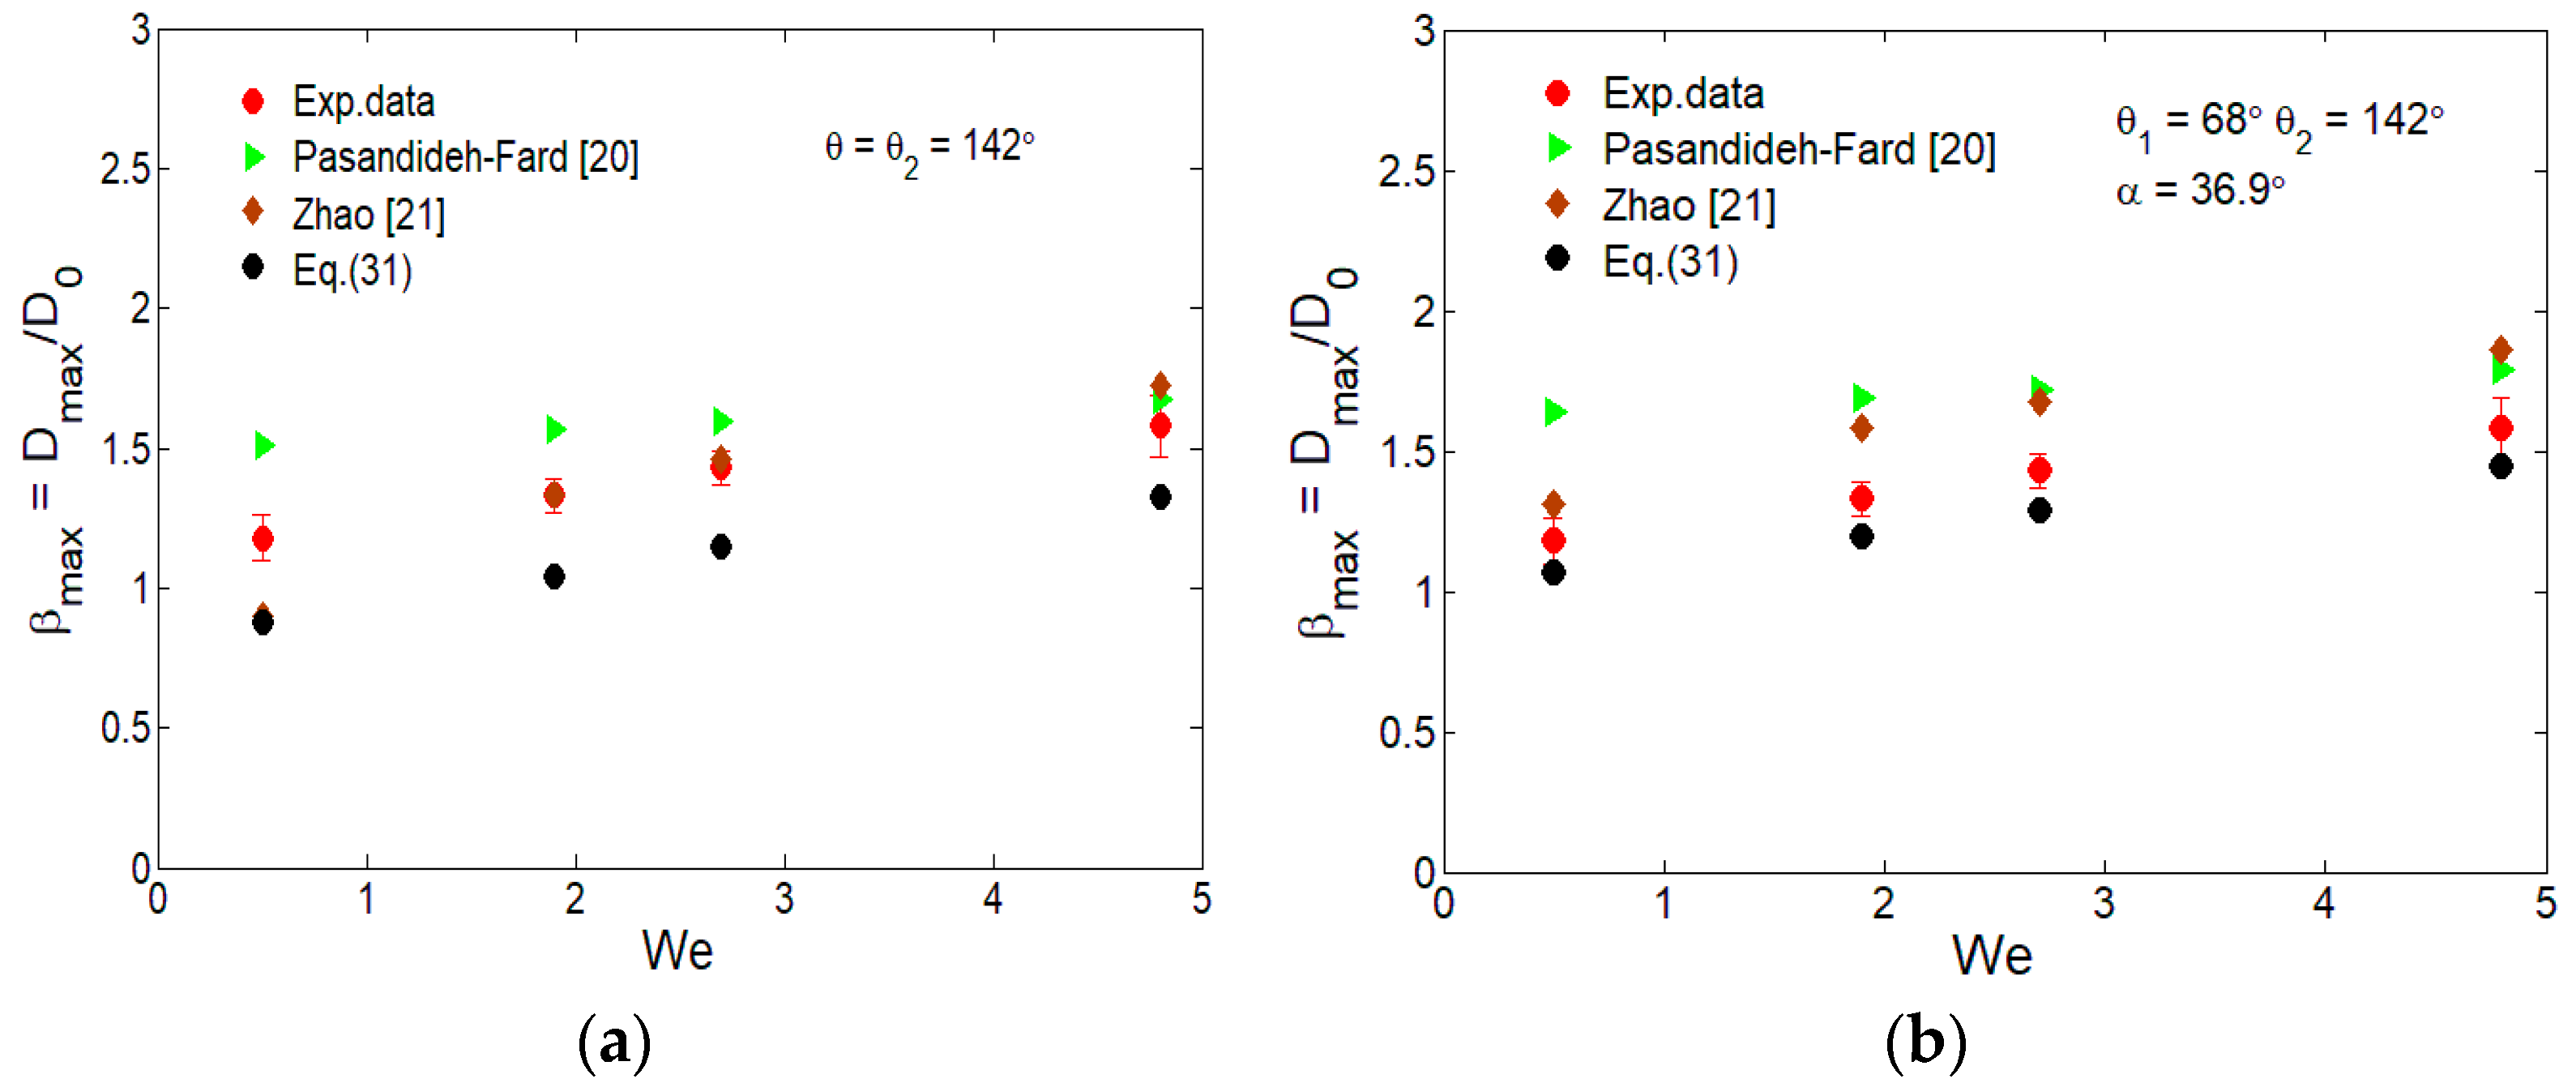
| Contact Angle | 0.5 | 1.9 | 2.7 | 4.8 | |
|---|---|---|---|---|---|
| Exp. Data | 1.18 | 1.33 | 1.43 | 1.58 | |
| = 68° | Pasandideh-Fard [20] | 2.51 | 2.52 | 2.54 | 2.59 |
| Zhao [21] | 2.20 | 2.48 | 2.62 | 2.92 | |
| Equation (31) | 2.07 | 2.12 | 2.15 | 2.24 | |
| = 142° | Pasandideh-Fard [20] | 1.51 | 1.57 | 1.60 | 1.67 |
| Zhao [21] | 0.90 | 1.33 | 1.46 | 1.73 | |
| Equation (31) | 0.88 | 1.04 | 1.15 | 1.33 |
© 2019 by the authors. Licensee MDPI, Basel, Switzerland. This article is an open access article distributed under the terms and conditions of the Creative Commons Attribution (CC BY) license (http://creativecommons.org/licenses/by/4.0/).
Share and Cite
Yang, Y.; Chen, X.; Huang, Y. Spreading Dynamics of Droplet Impact on a Wedge-Patterned Biphilic Surface. Appl. Sci. 2019, 9, 2214. https://doi.org/10.3390/app9112214
Yang Y, Chen X, Huang Y. Spreading Dynamics of Droplet Impact on a Wedge-Patterned Biphilic Surface. Applied Sciences. 2019; 9(11):2214. https://doi.org/10.3390/app9112214
Chicago/Turabian StyleYang, Yanjie, Xiaoqian Chen, and Yiyong Huang. 2019. "Spreading Dynamics of Droplet Impact on a Wedge-Patterned Biphilic Surface" Applied Sciences 9, no. 11: 2214. https://doi.org/10.3390/app9112214