Article

Longitudinal Displacement Behavior and Girder End Reliability of a Jointless Steel-Truss Arch Railway Bridge during Operation

1
Key Laboratory of C&PC Structures of the Ministry of Education, Southeast University, Nanjing 210096, China
2
Department of Civil, Environmental Engineering and Mechanical Engineering, Rice University, Houston, TX 77005, USA
3
Beijing Advanced Innovation Center for Future Urban Design, Beijing University of Civil Engineering and Architecture, Beijing 100044, China
*
Author to whom correspondence should be addressed.
Appl. Sci. 2019, 9(11), 2222; https://doi.org/10.3390/app9112222
Submission received: 4 May 2019 / Revised: 24 May 2019 / Accepted: 28 May 2019 / Published: 30 May 2019

Abstract

:
The long length and complex service load form conflicts with the low limits of longitudinal and transverse displacements of jointless bridge design. The longitudinal displacements of the Nanjing Dashengguan Yangtze River Bridge, a jointless steel-truss arch railway bridge, and its girder end reliability are investigated in this article. The time–frequency characteristics of the longitudinal displacements of bearings and expansion joints are analyzed using the empirical wavelet transform. The long-term characteristics of the longitudinal displacements of bearings and expansion joints in the operation period are explored. Furthermore, the relative transverse displacements of the bridge girder end are calculated using longitudinal displacement monitoring data. The mechanical behaviors of the expansion device under relative transverse displacements are studied. The reliability of expansion devices and crossing trains under the effects of relative transverse displacements is studied using kernel density estimation. The main results demonstrate that: (1) The longitudinal displacements of bearings and expansion joints are mainly influenced by environmental temperature. (2) The maximum relative transverse displacement of the expansion joint is close to 1 mm in long-term bridge operation, with the transverse rail deflection at the expansion device approaching 1 mm, which reduces the stability of cross high-speed trains.

1. Introduction

High-speed railways have provided remarkable mobility in densely populated areas, with bridges playing a vital role in their design. Long-span bridges help high-speed railway lines cross large rivers, deep valleys, bays, and other natural barriers [1]. To avoid the adverse impacts of expansion joints on crossing trains, high-speed bridges can only have expansion joints at the girder ends of the main bridge structures. The long length and complex temperature field of the jointless bridge are in conflict with the low limits required for temperature-induced displacements. Hence, the temperature effects on bridge displacements—especially at the girder end—must be investigated, which is the focus of this article.
The study of the temperature effects on long-span bridges is an important focus of civil engineers, who wish to master the behavior of bridge structures under both day–night and seasonal temperature changes. Some researchers have investigated the temperature behavior of the bridge structure using finite element (FE) simulations [2,3]. Considering the complicated nature of the actual temperature field in a bridge during operation, additional studies have attempted to analyze the thermal effects on bridge structures based on measured data and long-term monitoring data [4,5,6,7,8,9]. Furthermore, scholars have explored the behavior and performance of bridge structures under diurnal temperature loads via the validation of FE results using monitoring data [10,11,12]. Analysis of the temperature-induced behavior of bridge structures has solved a variety of engineering problems for many major infrastructure systems by employing such continuous studies.
However, such studies have typically focused on the mechanical behavior of the girder end under service loads, especially under temperature loads, which are typically minimal [13,14]. With the advancement of displacement-measurement technology [15,16] and time–frequency analytical techniques [17,18,19,20], the time–frequency and long-term characteristics of bridges can now be analyzed based on structural health monitoring (SHM) data. Due to the redundancy and complexity of train-bridge systems [21,22,23], girder expansion on the longitudinal direction must be unimpeded, and the transverse dislocation between two girder ends (the main bridge and ramp bridge) is not allowed.
Based on long-term SHM data, this article investigates the longitudinal behaviors and girder end reliability of a jointless steel-truss arch railway bridge in operation. The time–frequency and long-term characteristics of the longitudinal displacements of the bearings and expansion joints are analyzed. The influence of the bridge’s longitudinal displacements due to the environmental temperature is demonstrated based on the monitoring data. The wear lifetimes of the bearings caused by cumulative longitudinal sliding displacements are predicted. The relative transverse displacements of the bridge girder end are calculated using the monitoring data from the longitudinal displacements. The mechanical behaviors of the expansion device under the relative transverse displacements are simulated via FE modeling. The fatigue reliability of the expansion devices and the reliability of crossing trains under the in-service relative transverse displacements are studied, which can help bridge engineers to maintain this high-speed railway bridge during diurnal operation.

2. Bridge Description and Longitudinal Displacement Monitoring

The Nanjing Dashengguan Yangtze River Bridge is the longest six-track high-speed railway bridge in the world. As shown in Figure 1, the bridge consists of two continuous steel-truss arches and four approach spans, without expansion joints over the total length of 1272 m. The heights of the truss ribs in the main spans vary from 12 m at the crown to 96 m at the spring line. The bridge has six tracks, including two tracks on the downstream side for the Beijing–Shanghai (B–S) high-speed railway, two tracks on the upstream side for the Shanghai–Wuhan–Chengdu (S–W–C) railway and two tracks on the outer sides of the bridge deck for the Nanjing Metro. The design load of the six tracks is greater than 600 kN/m along the longitudinal direction of the bridge. As of 2018, the train speed on the two tracks of the B–S high-speed railway have been as great as 350 km/h, with all six tracks now in operation. The bridge structure features three main trusses spaced 15 m apart in the transverse direction. Three specially designed ball-steel bearings are used on each pier. At Pier 4, the center truss rests on a fixed bearing, and the bearings for the two side trusses allow for transverse motion; on the other piers, the bearings for the center truss allow for longitudinal motion, while the bearings for the side trusses allow for both longitudinal and transverse motion. A total of eight specially designed expansion devices are installed at the expansion joint of the girder ends at Piers 1 and 7 (Figure 2), where each railway track (B–S and S–W–C) is installed and with one device at the Beijing/Shanghai girder end. The stock rail and the fixed side of the expansion device are located at the main bridge, while the switch rail and the free side of the expansion device are located at the ramp bridge, with the stock rail spanning the expansion joint. On the free side of the expansion device, the expansion box and sliding support, the sleeper and rail, the sleeper and guide-rail can slide relative to each other in the longitudinal direction of the bridge. The ramp bridge on the Beijing side uses a 30-meter-wide steel-truss bridge (and a 30-meter-wide steel girder), while the ramp bridge on the Shanghai side uses two independent 15-meter-wide concrete girders.
Because of the unusual characteristics of the Nanjing Dashengguan Yangtze River Bridge, including the long length of the girder without any expansion joints, and the fact that this bridge is used by high-speed trains, a long-term SHM system was installed in 2012. Considering the significant need for safety in high-speed train systems, contact sensors cannot be used on the rails and rail-related devices. To monitor the service state of the bridge, magnetostrictive displacement sensors are employed to measure the longitudinal displacements of the bearings and expansion joints. The locations of longitudinal displacement measurement are shown in Figure 3. The downstream and upstream bearings on Piers 1–3 and 5–7 are measured relative to the longitudinal displacements between the upper and lower plates of the bearing. The expansion joints on Piers 1 and 7 are measured relative to the longitudinal displacements between the main bridge and the ramp bridge. The sampling rate of the magnetostrictive displacement sensors is 1 Hz. The magnetostrictive displacement sensors were installed on the expansion joints in 2017. As shown in Figure 3, all of the sensors are 1 m from the center line of Truss 1, 2, or 3. Moreover, an atmospheric thermo-hygrometer is employed at the arch foot between the southern middle span and the southern side span to measure the atmospheric temperature and humidity, with the sampling rate of the atmospheric thermo-hygrometer being 1 Hz.

3. Behavior Analysis of the Bridge Longitudinal Displacements

Long-span jointless railway bridges are affected by temperature, trains, and any other service loads. The analysis of a bridge’s longitudinal displacements under service loads can help scholars and engineers master the normal load-response behaviors of the bridge for diurnal monitoring, which is the premise for ensuring unimpeded longitudinal expansion of the bridge.

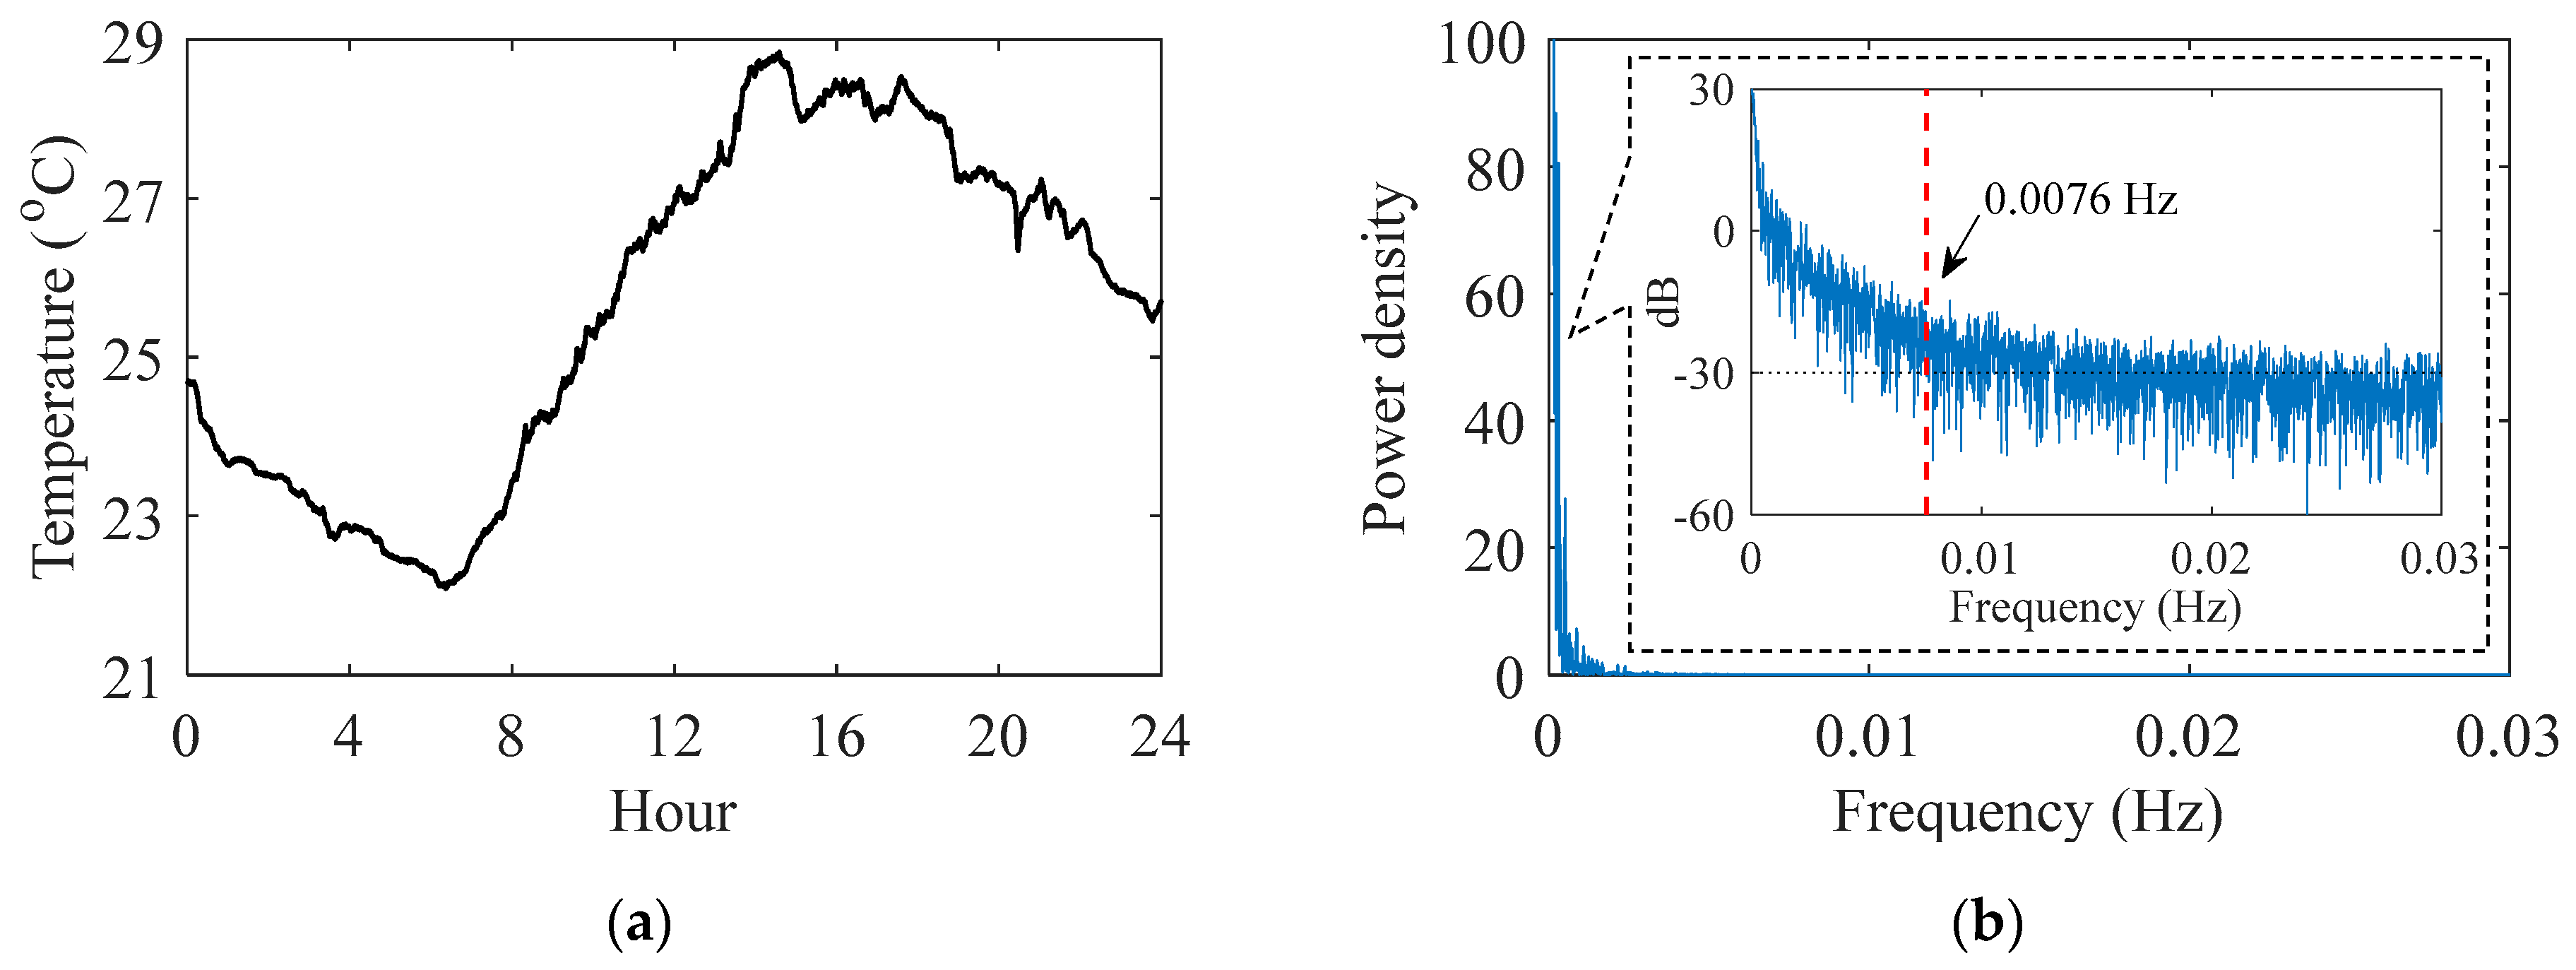
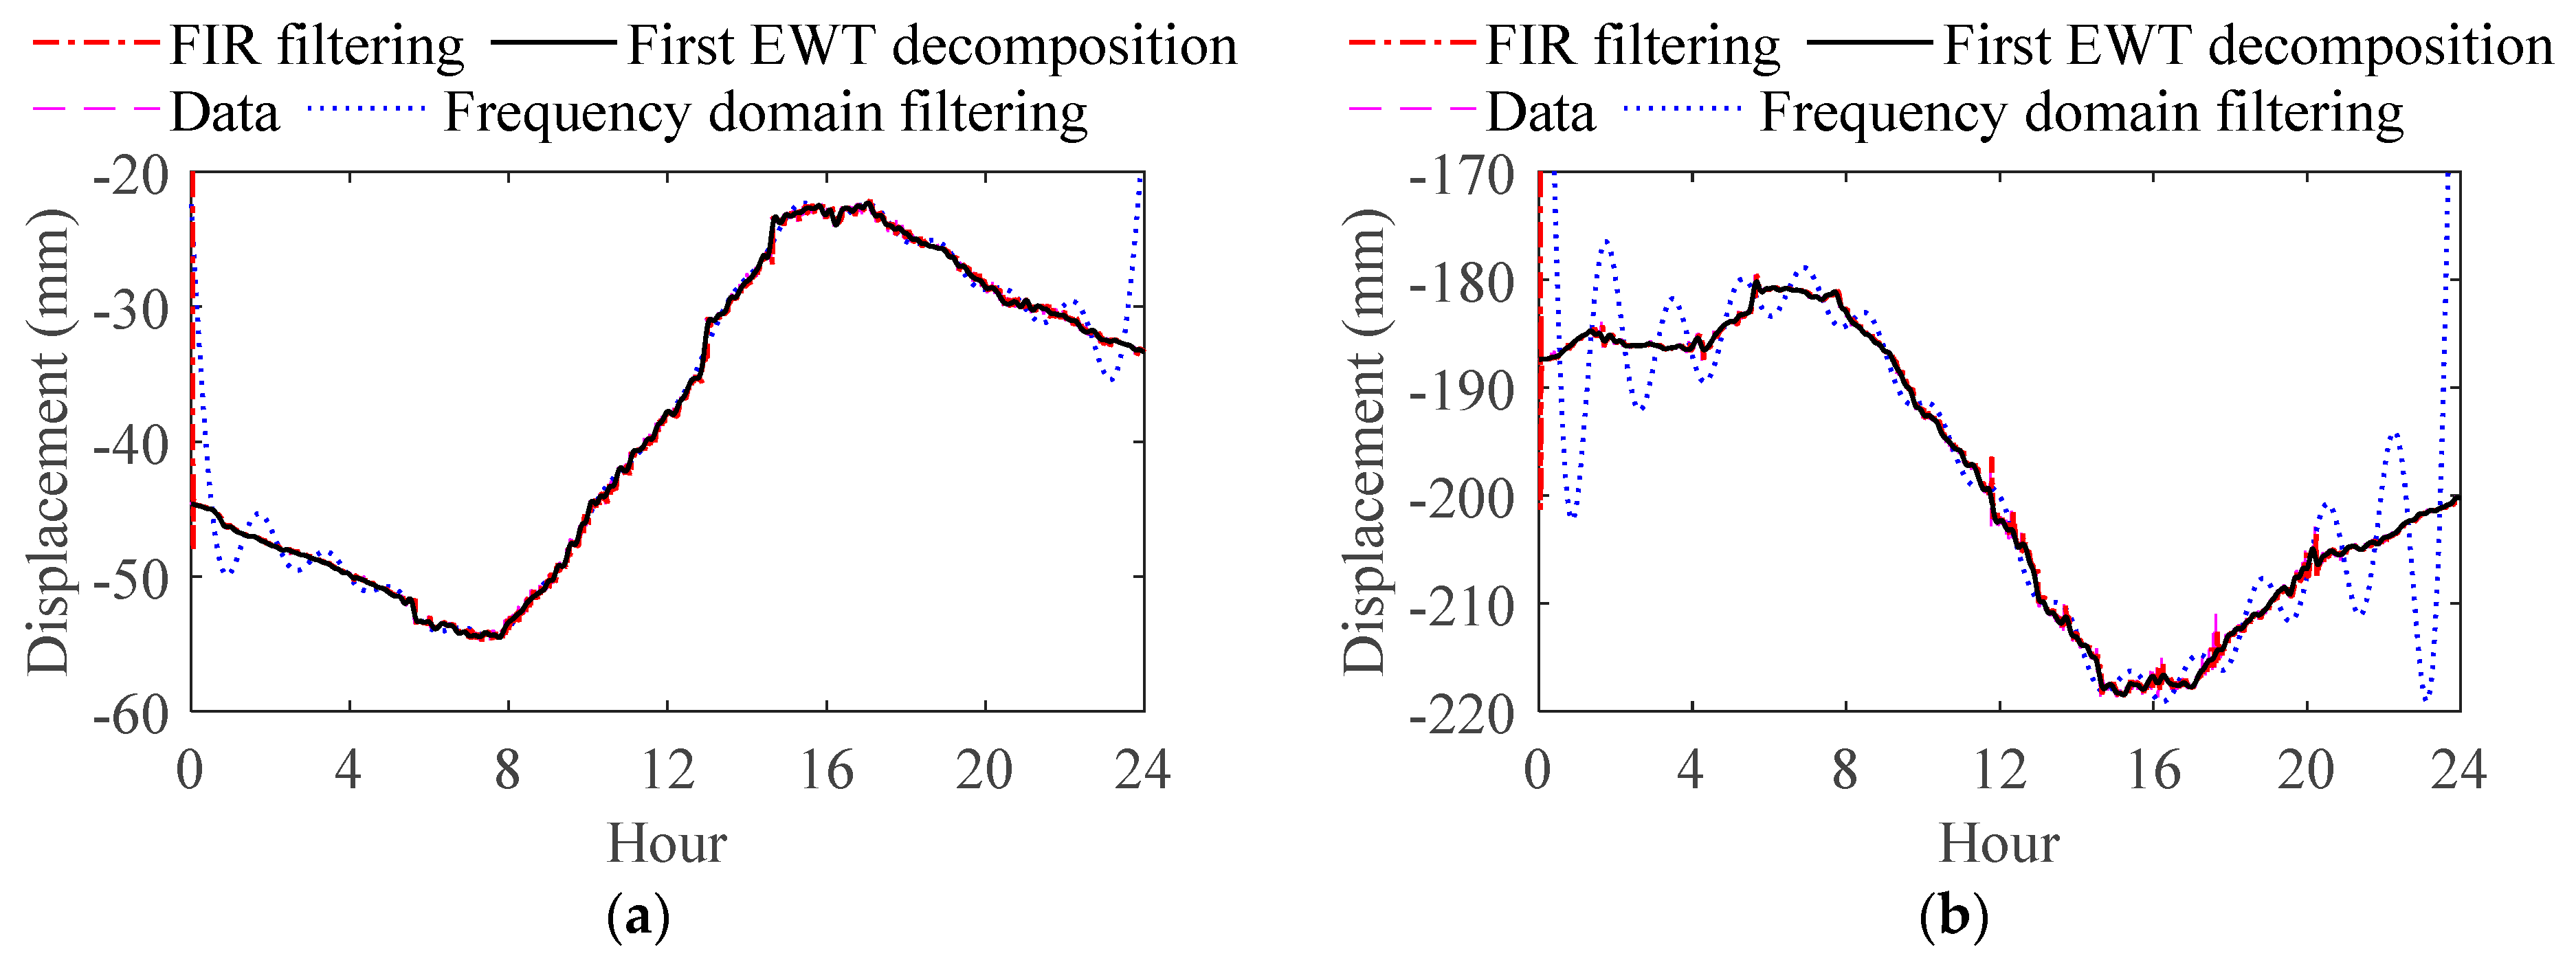
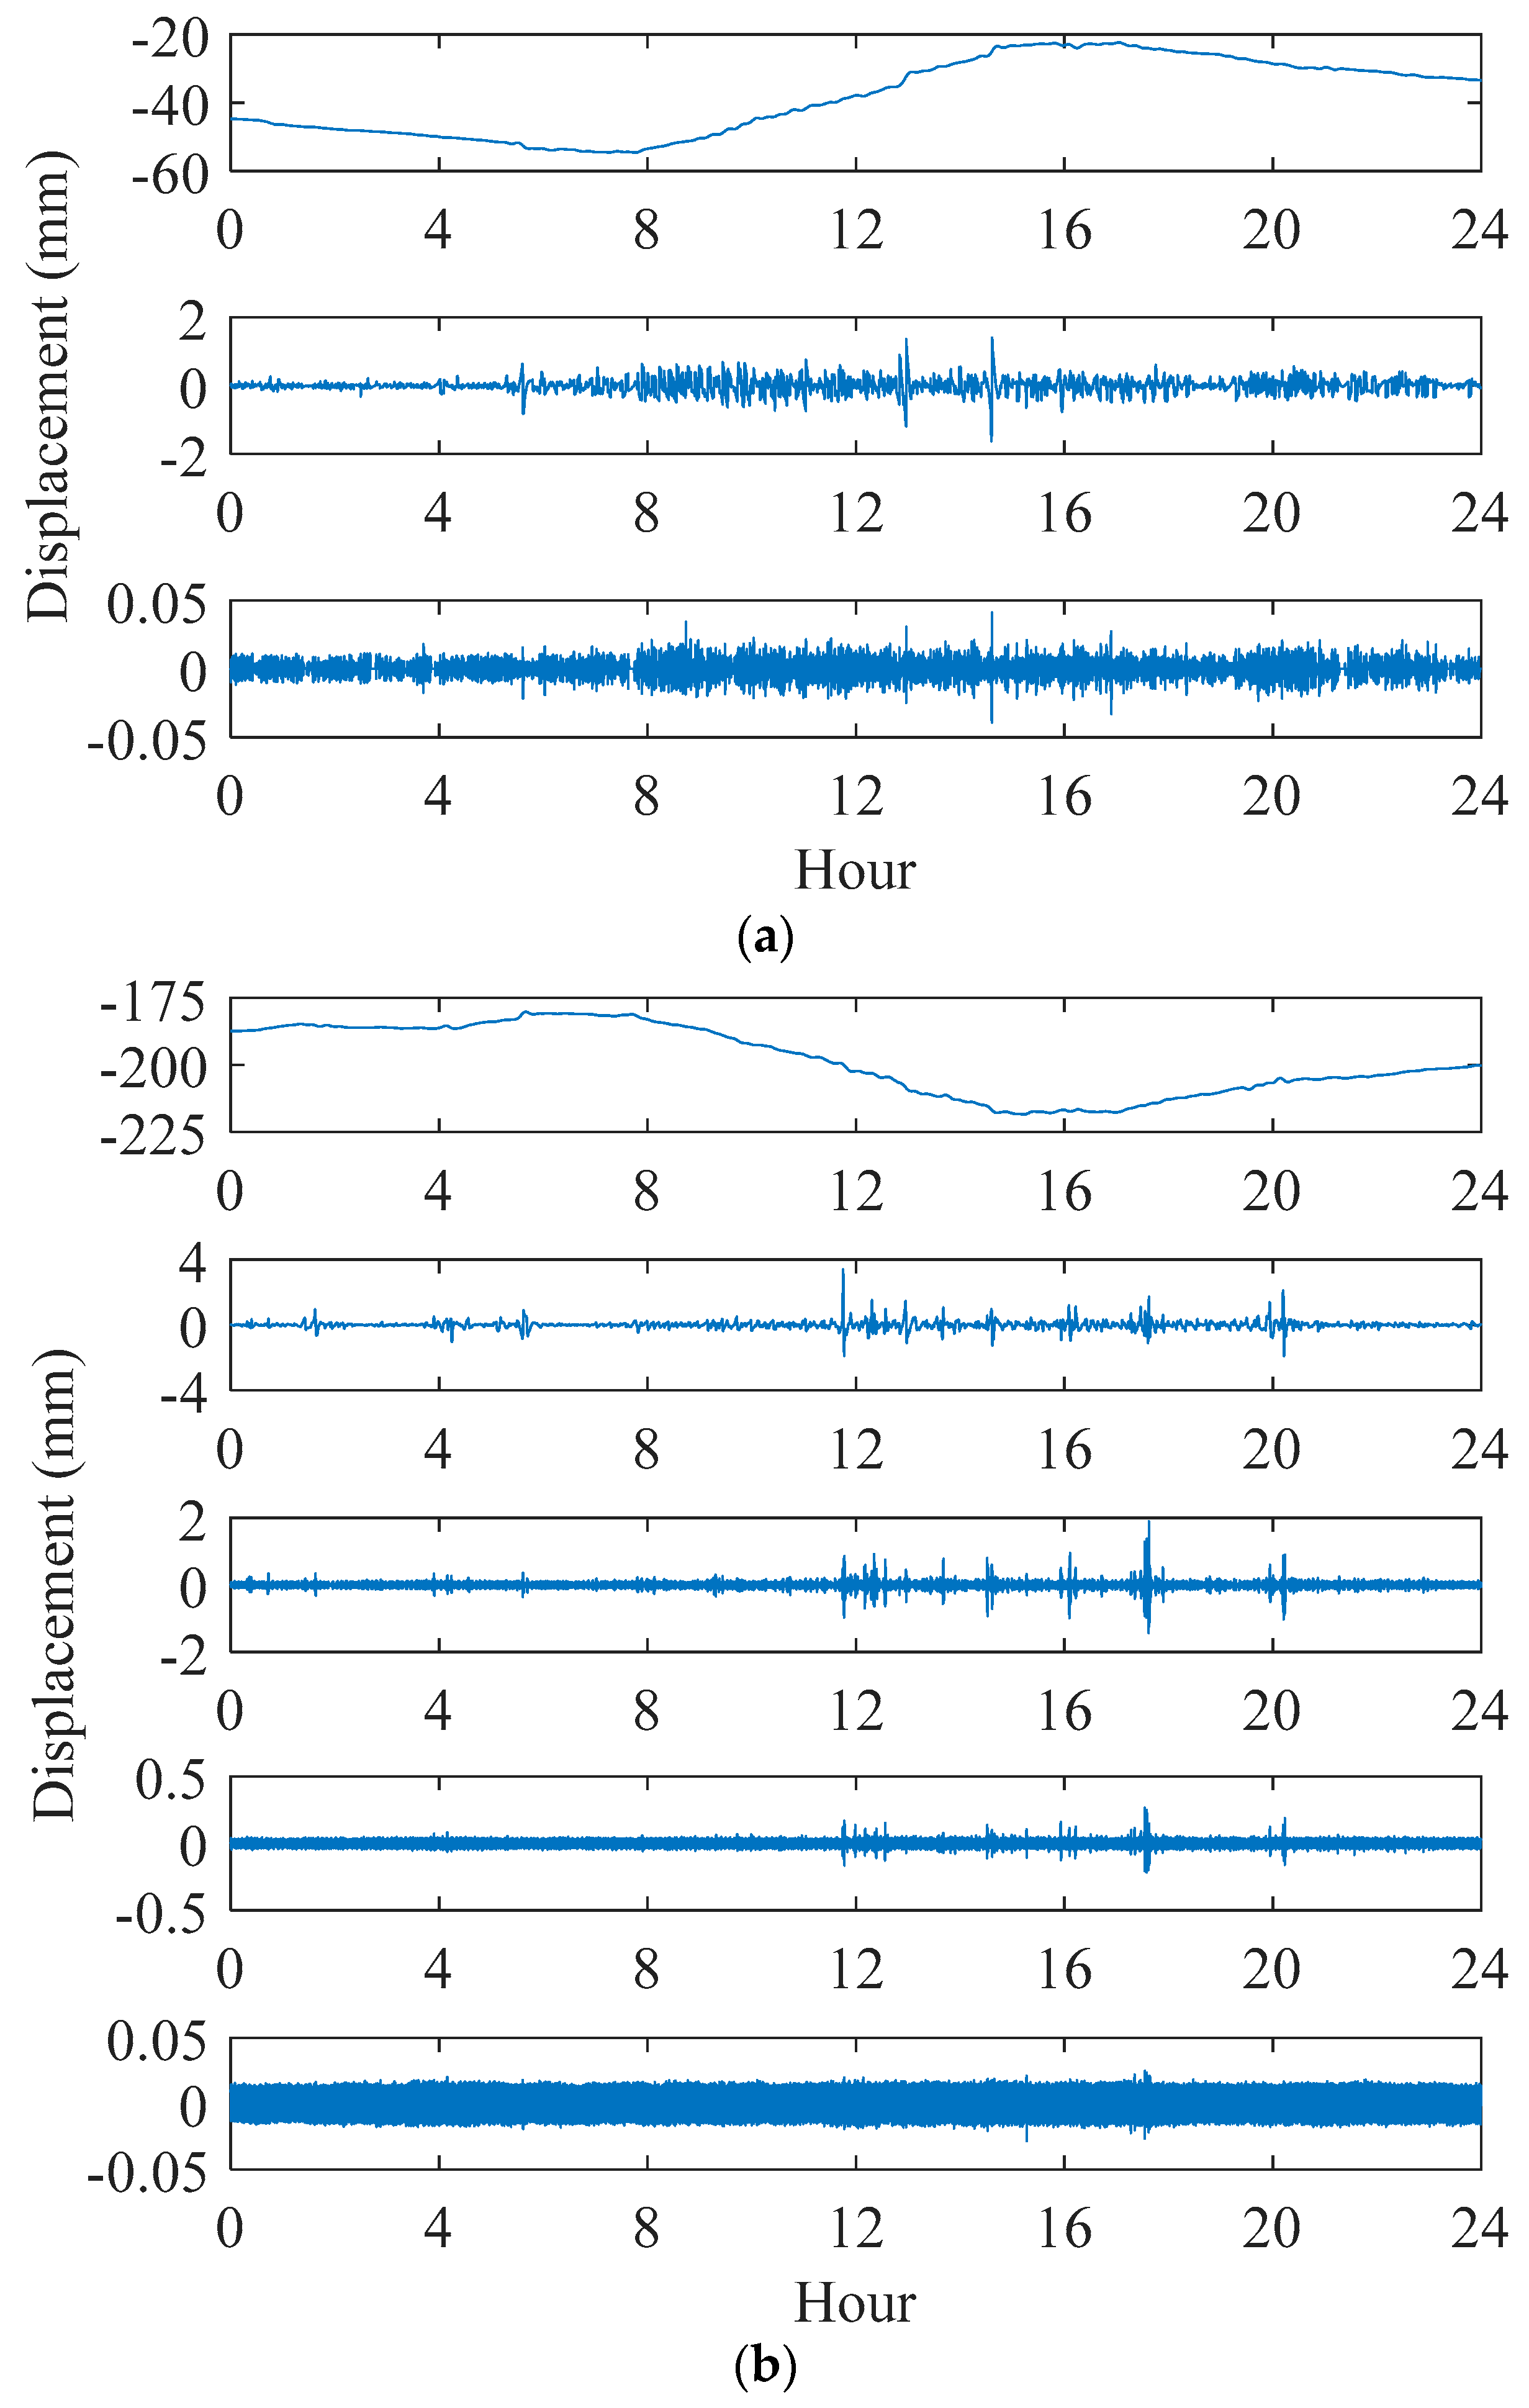
3.1. Time–Frequency Characteristics of the Longitudinal Displacements of the Bridge

A bridge structure is subject to multiple loads during diurnal operation. The time–frequency analysis of bridge responses can help engineers capture the input–output mechanism of the bridge and then determine the main factors of influence in terms of the bridge responses.
Empirical wavelet transform (EWT) is a new self-adaptive time–frequency decomposition method that was first proposed by Gilles [24]. In contrast to the empirical mode decomposition (EMD) which lacks strict mathematical derivations and requires a relatively long calculation time [25], the EWT inherits the adaptivity of the EMD and the mathematical theory of wavelet transformation. The EWT adaptively segments the Fourier spectrum by extracting the maximum point in the frequency domain to separate the signal into the different modes and then constructs adaptive bandpass filters in the frequency domain to establish orthogonal wavelet functions and extract amplitude modulation–frequency modulation (AM–FM) components that have a compact support Fourier spectrum. The principle of EWT for a signal is as follows:
Assume that the signal consists of N AM–FM components as
f ( t ) = i = 0 N 1 f i ( t )
Standardizing the Fourier spectral range of the signal to [0, π], N + 1 boundaries are needed to divide the Fourier spectral range [0, π] into N intervals for all of the components. Excluding the spectral boundaries 0 and π, N − 1 boundaries must be determined. (ωn − 1, ωn) is the boundary of the nth interval (ω0 = 0, ωN = π), 1 ≤ nN − 1. The first nth maxima are in the corresponding nth interval. Define a transition with a width Tn = 2τn centring on each ωn, with the order τn = γωn, γ = min((ωn + 1ωn)/ (ωn + 1 + ωn)) n. After determining the interval (ωn − 1, ωn), the empirical wavelet is defined as the bandpass filter on each interval. Based on the Meyer wavelet, the empirical wavelet function ψ ^ n ( ω ) and the empirical scale function ϕ ^ n ( ω ) are defined as
ψ ^ n ( ω ) = { 1 , ( 1 + γ ) ω n | ω | ( 1 γ ) ω n + 1 cos [ π 2 β ( 1 2 γ ω n + 1 ( | ω | ( 1 γ ) ω n + 1 ) ) ] ,    ( 1 γ ) ω n + 1 | ω | ( 1 + γ ) ω n + 1 sin [ π 2 β ( 1 2 γ ω n ( | ω | ( 1 γ ) ω n ) ) ] ,    ( 1 γ ) ω n | ω | ( 1 + γ ) ω n 0 ,    other
ϕ ^ n ( ω ) = { 1 ,    | ω | ( 1 γ ) ω n cos [ π 2 β ( 1 2 γ ω n ( | ω | ( 1 γ ) ω n ) ) ] ,    ( 1 γ ) ω n | ω | ( 1 + γ ) ω n 0 ,    other
where ^ denotes a Fourier transform, and β(x) can be an arbitrary function such that
β ( x ) = { 0 , if    x 0 and    β ( x ) + β ( 1 x ) = 1 ,    x [ 0 , 1 ] 1 , if    x 1
In accordance with the work of Gilles (2013), this article uses β(x) = x4 (35 − 84x + 70x2 − 20x3).
Referring to the construction method of the classic wavelet transform, the detail coefficients f(n,t) and the approximation coefficients f(0,t) of the empirical wavelet transform can be calculated from the inner product as
W f ε ( n , t ) = f , ψ n = f ( τ ) ψ n ( τ t ) ¯ d τ = ( f ( ω ) ψ ^ n ( ω ) ¯ )
W f ε ( 0 , t ) = f , ϕ 1 = f ( τ ) ϕ 1 ( τ t ) ¯ d τ = ( f ( ω ) ϕ ^ 1 ( ω ) ¯ )
where ¯ denotes the complex conjugate; denotes the inverse Fourier transform; and , denotes the inner product.
Then, the reconstruction of signal f(t) can be expressed as
f ( t ) = W f ε ( 0 , t ) * ϕ 1 ( t ) + n = 1 N W f ε ( n , t ) * ψ n ( t ) = ( W f ε ^ ( 0 , ω ) ϕ 1 ( ω ) + n = 1 N W f ε ( n , ω ) ψ n ( ω ) )
where * denotes a convolution.
As a result, the AM–FM components fi(t) (in Equation (1)) decomposition by EWT can be expressed as
f 0 ( t ) = W f ε ( 0 , t ) * ϕ 1 ( t )
f k ( t ) = W f ε ( k , t ) * ψ k ( t ) ,    k = 1 , 2 , 3 , , N 1
Using EWT (Equation (1) to Equation (9)), a monitoring sequence can be smart decomposed to several sequences in different frequency bands. Then, the bridge response can be self-adaptively decomposed to different sequences which correspond to different load effects. For example, the temperature-induced response is in the low frequency band and the train-induced response is in the high frequency band.
Figure 4 shows the atmospheric temperature trend of the bridge and its power density over the course of one day in 2017, where the main frequency of atmospheric temperature data in that day is less than 0.0076 Hz according to power density analysis. Figure 5 shows the longitudinal displacement data and the low-frequency portion of the data for the bearings and expansion joints at the south girder end (Pier 7) for the bridge in the same day. The low-frequency portion is obtained using the frequency domain filter, the low pass Finite Impulse Response (FIR) filter and the EWT, respectively. The low-frequency domain of the frequency domain filter and the low-pass FIR filter is set to 0~0.0076 Hz.
From Figure 5, the EWT can obtain the low-frequency portion of the signal more efficiently than either the frequency domain filter or the low pass FIR filter. Specifically, the frequency domain filter distorts the beginning and end of the signal, and the low-pass FIR filter distorts the beginning of the signal if the signal does not begin at zero. According to the atmospheric temperature trend in Figure 4 and the EWT results in Figure 5, the longitudinal displacements of both the bearings and the expansion joints are correlated with environmental temperature, although the correlation is not absolutely consistent.
Figure 6 shows the results of the EWT decomposition of the longitudinal displacements of the bearings and expansion joints at the south girder end (Pier 7) of the bridge for the same day. The adaptive frequency boundaries of the EWT decomposition in Figure 6a are (0, 0.0076), (0.0076, 1.0844), (1.0844, 0.5); the adaptive frequency boundaries of the EWT decomposition in Figure 6b are (0, 0.0077), (0.0077, 0.0795), (0.0795, 0.1722), (0.1722, 0.4680), (0.4680, 0.5). The EWT is a self-adaptive signal decomposition method that depends on the power density results of a given data set. The different frequency boundaries of the bearing and the expansion joint means the two signals have different frequency spectrum characteristics. The frequency spectrum of the bearing signal has three main crests, while the frequency spectrum of the expansion joint signal has five main crests.
As shown in Figure 6a, the initial decomposition part of the longitudinal displacements of the bearings is due to the environmental temperature, whereas the second portion exhibits a nonstationary signal, predominantly between 06:00–24:00 h during that same day, which is consistent with the times during which trains cross the bridge. The third decomposition part is mainly the free responses of the structure due to environmental excitation. As shown in Figure 6b, the first decomposition part of the longitudinal displacements of the expansion joints is mainly associated with the effects of temperature on the main bridge structure; the second, third, and fourth decomposition parts exhibit unstable fluctuations at the times when the temperature changes, which may be due to the superposition of the temperature-induced responses of the main bridge and the ramp bridge, where differences in the temperature variations and temperature-induced behaviors of the main bridge and the ramp bridge lead to higher frequency behavior when the environmental temperature changes significantly because the longitudinal displacements of the expansion joints are more sensitive to temperature variation than the bearings. The fifth decomposition part mainly represents the free responses of the structure under environmental excitation; train crossings have no significant influence on the longitudinal displacements of the expansion joints because there is no nonstationary fluctuation throughout the duration of the train crossing time (06:00–24:00 h) in Parts 1~5.

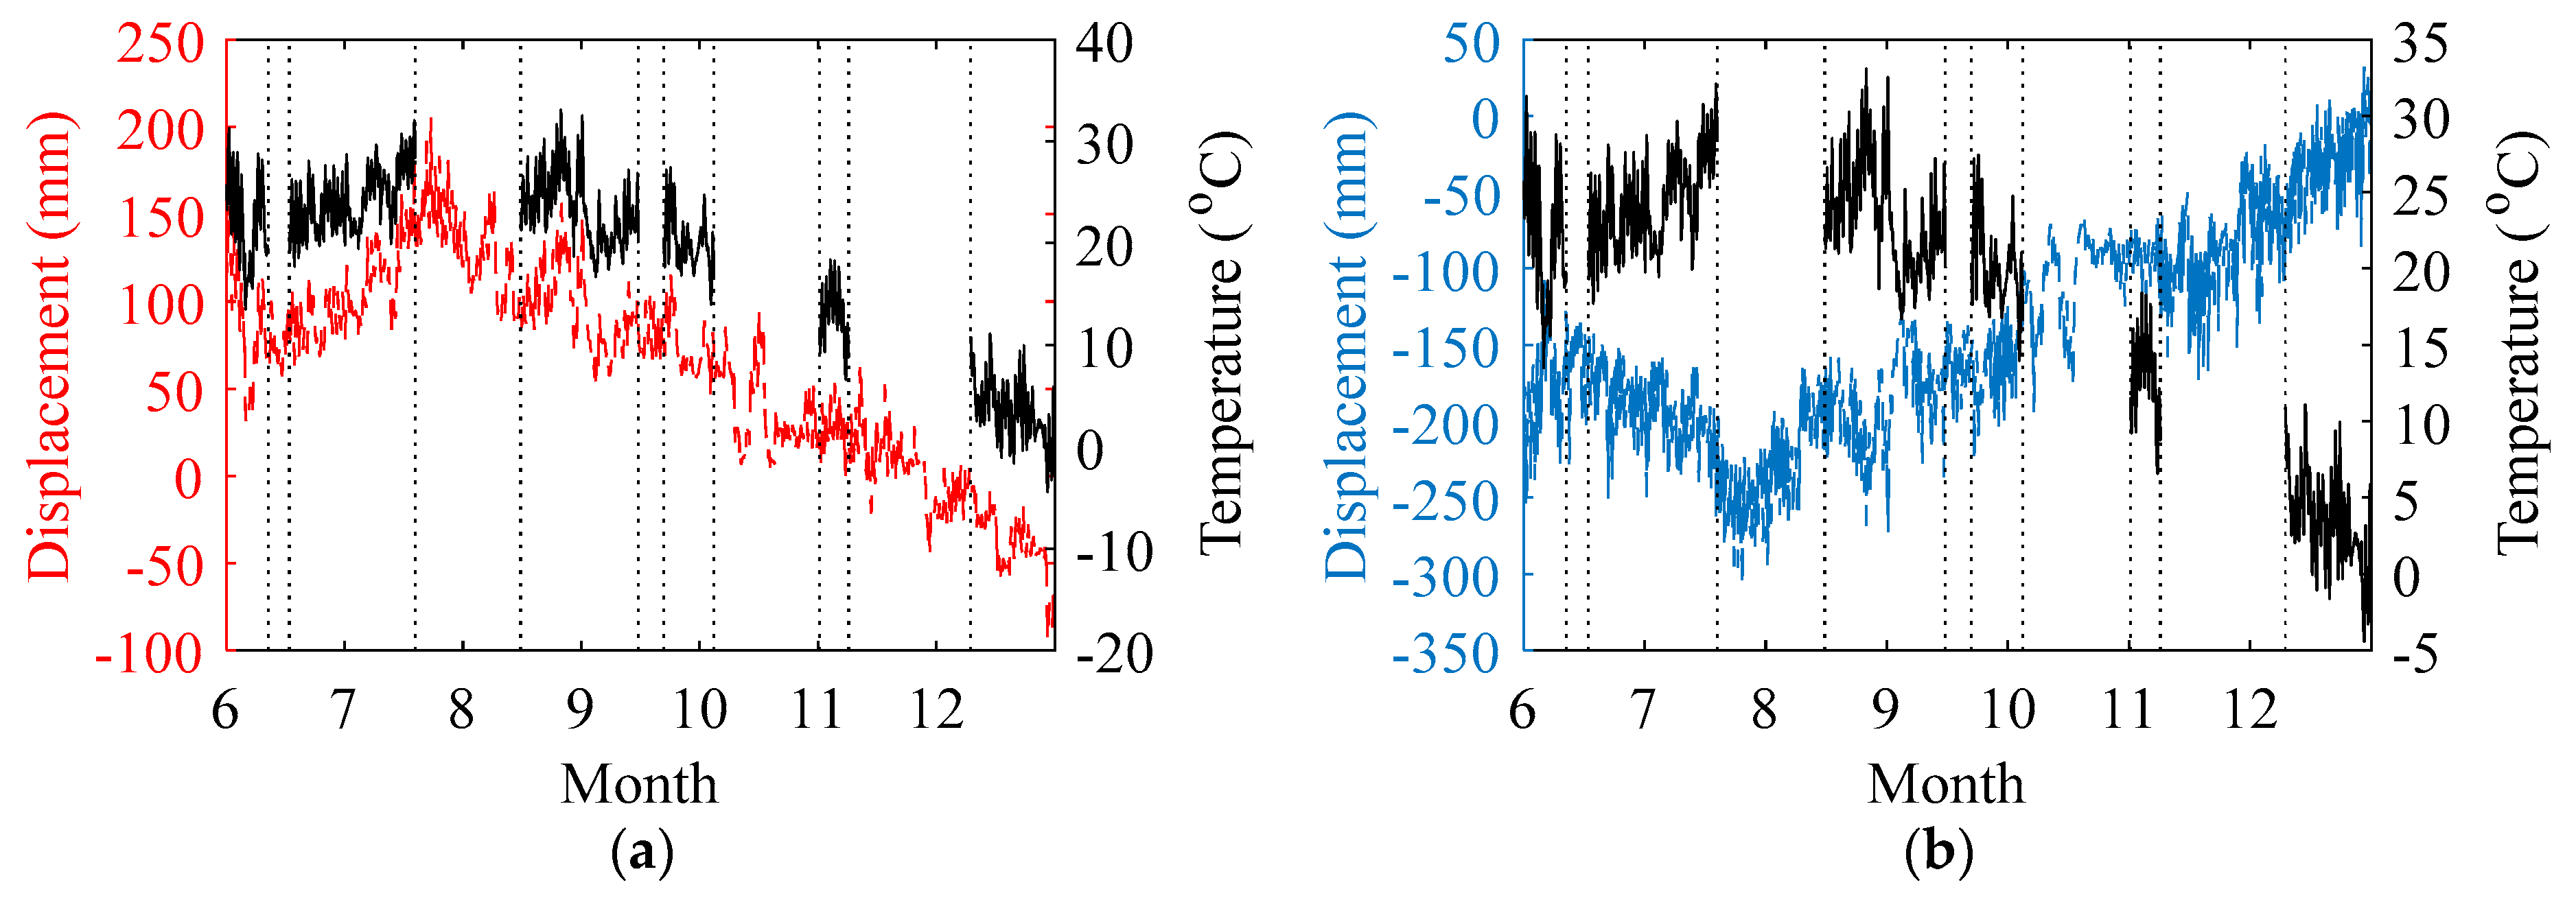
3.2. Long-Term Characteristics of the Longitudinal Displacements of the Bridge

The long-term analysis of monitoring data can indicate the importance of understanding bridge responses and show the spatio-temporal characteristics of the structural behaviors of in-service bridges.
Figure 7 shows the trend in the longitudinal displacements at the south girder end (Pier 7) of the bridge from June to December in 2017 and includes the trend of atmospheric temperature for comparison. The dashed line (in color) denotes the longitudinal displacement data, and the solid line (in black) represents the temperature data. The temperature data exhibits missing time windows, with only six periods of temperature data measured from June to December. The time series cross-correlation of the displacement and temperature data in these six documented periods is analyzed, and the time delay ratios between the displacement and temperature sequences in the six periods are (0, 0, 0, 0, less than 0.5%, less than 0.5%). The time lag effect between the longitudinal displacement and environmental temperature is small. This phenomenon may be because bearings and expansion devices can directly release temperature-induced longitudinal displacements (the secondary effect and nonlinear behavior are not obvious).
Figure 8 shows the long-term correlation between longitudinal displacement of the bearings and expansion joints at the south girder end and the atmospheric temperature over the seven-month study period. The R in Figure 8 indicates the correlation coefficient of the data points. The first decomposition part of the EWT results slightly increases the temperature correlation when compared with original longitudinal displacement data, because the original data include some nonlinear effects of the operation loads. However, the correlation between the original longitudinal displacement data and the atmospheric temperature is already quite high. As shown in Figure 7 and Figure 8, the longitudinal displacements of the bearing and the expansion joint both have a high correlation with environmental temperature. This result is due to the use of modified ultra-high molecular weight polyethylene (Modified UHMWPE) in the sliding plate structure of the bearings and expansion devices, which effectively releases the longitudinal displacements of the bridge during operation.
Figure 9 shows the longitudinal displacement of the bearings on Piers 1–3 and 5–7 versus the distance of each pier from Pier 4. In this figure, each value for a pier is the mean of the two side bearings on the same pier. Figure 9a is the average value for 2015, and Figure 9b is the linear fitting line for all of the data at 1600 s sampling intervals in 2015. As shown in Figure 9a, the longitudinal displacement is linearly related to the distance from Pier 4. As shown in Figure 9b, the longitudinal displacements have high values (absolute) for 8–10 months of the one year, and the bearings at the girder ends (Piers 1 and 7) have the highest values (greater than 150 mm) compared with the bearings on the other piers. It is worth noting that the bearings at the girder ends have the lowest capacity (20 MN) and the highest longitudinal displacement. The sliding limit of a bearing is positively correlated with the capacity of the bearing: the higher the capacity of the bearing, the larger the size of the bearing, and the higher its sliding limit. Hence, the low-capacity bearing at the girder end must be checked in the bridge design and maintenance. The general limit of the longitudinal sliding displacement of bearings with 20 MN capacity is ±200 mm, and in this case, the longitudinal displacement of the bearings in the girder ends is close to this limit. The limit of the longitudinal sliding displacement of the expansion device with two hanging steel sleepers is ±600 mm, which means that the longitudinal displacement of the expansion joints is at the low level (Figure 7b).
The Ministry of Railways of the People’s Republic of China has specified that the Modified UHMWPE used in bearings and expansion devices must be restricted to a low level of wear in the cumulative displacement of 50 km for major projects [26]. With regards to the longitudinal displacement data recorded in 2015, the cumulative longitudinal displacement of each bridge bearing in this one year are shown in Table 1. The lifetime for each bearing to achieve 50 km of displacement is determined from this one year of data, where the value for each pier is the average of its two side bearings (upstream and downstream). As seen in Table 1, for a major bridge such as the Nanjing Dashengguan Yangtze River Bridge with a design life of 100 years, all bearings will surpass their ideal situation (more than 50 km of displacement within the bridge’s lifetime), especially the bearings on Piers 2, 3, and 5, which will surpass the constraint within 50 years. The Modified UHMWPE will wear approximately 5 microns of thickness for every km of cumulative sliding displacement, such that the wear thickness of the bearings of Pier 3 is approximately 550.9 microns in 100 years. For every km of displacement, it is recommended to check the volume of the silicone grease (used as the lubricant for the sliding plate) on the bearings and expansion devices, and at every 50 km, it is recommended to inspect the wear state of the sliding plate on the bearings and expansion devices. It is worth noting that the bridge bearings at Piers 3 and 5 (the arch foot bearings) have the shortest lifetime (45.38 years), while the bridge bearings at Piers 1 and 7 (the girder end bearings) have the longest lifetime (81.24 years). The arch foot bearings experience a greater cumulative longitudinal displacement in the same amount of time due to the short-distance reciprocating motion of the bridge.

4. Girder End Reliability under the Relative Transverse Displacements

The sliding motion of the bearings and expansion joints in the longitudinal direction releases deformation due to temperature change and ensures the normal operation of the long-span jointless bridge. However, the unequal longitudinal displacement of the upstream part relative to the downstream part of the bridge results in the cross-sectional rotation of the girder, as well as the relative transverse displacement between the main bridge and ramp bridge at the expansion joint. Furthermore, these unequal displacements generate the secondary stresses of expansion devices and rail transverse deflections. Because the maximum longitudinal displacement of the bridge always occurs at the girder end, the transverse behavior (caused by unequal longitudinal displacement) of the girder end should be considered with greater scrutiny.

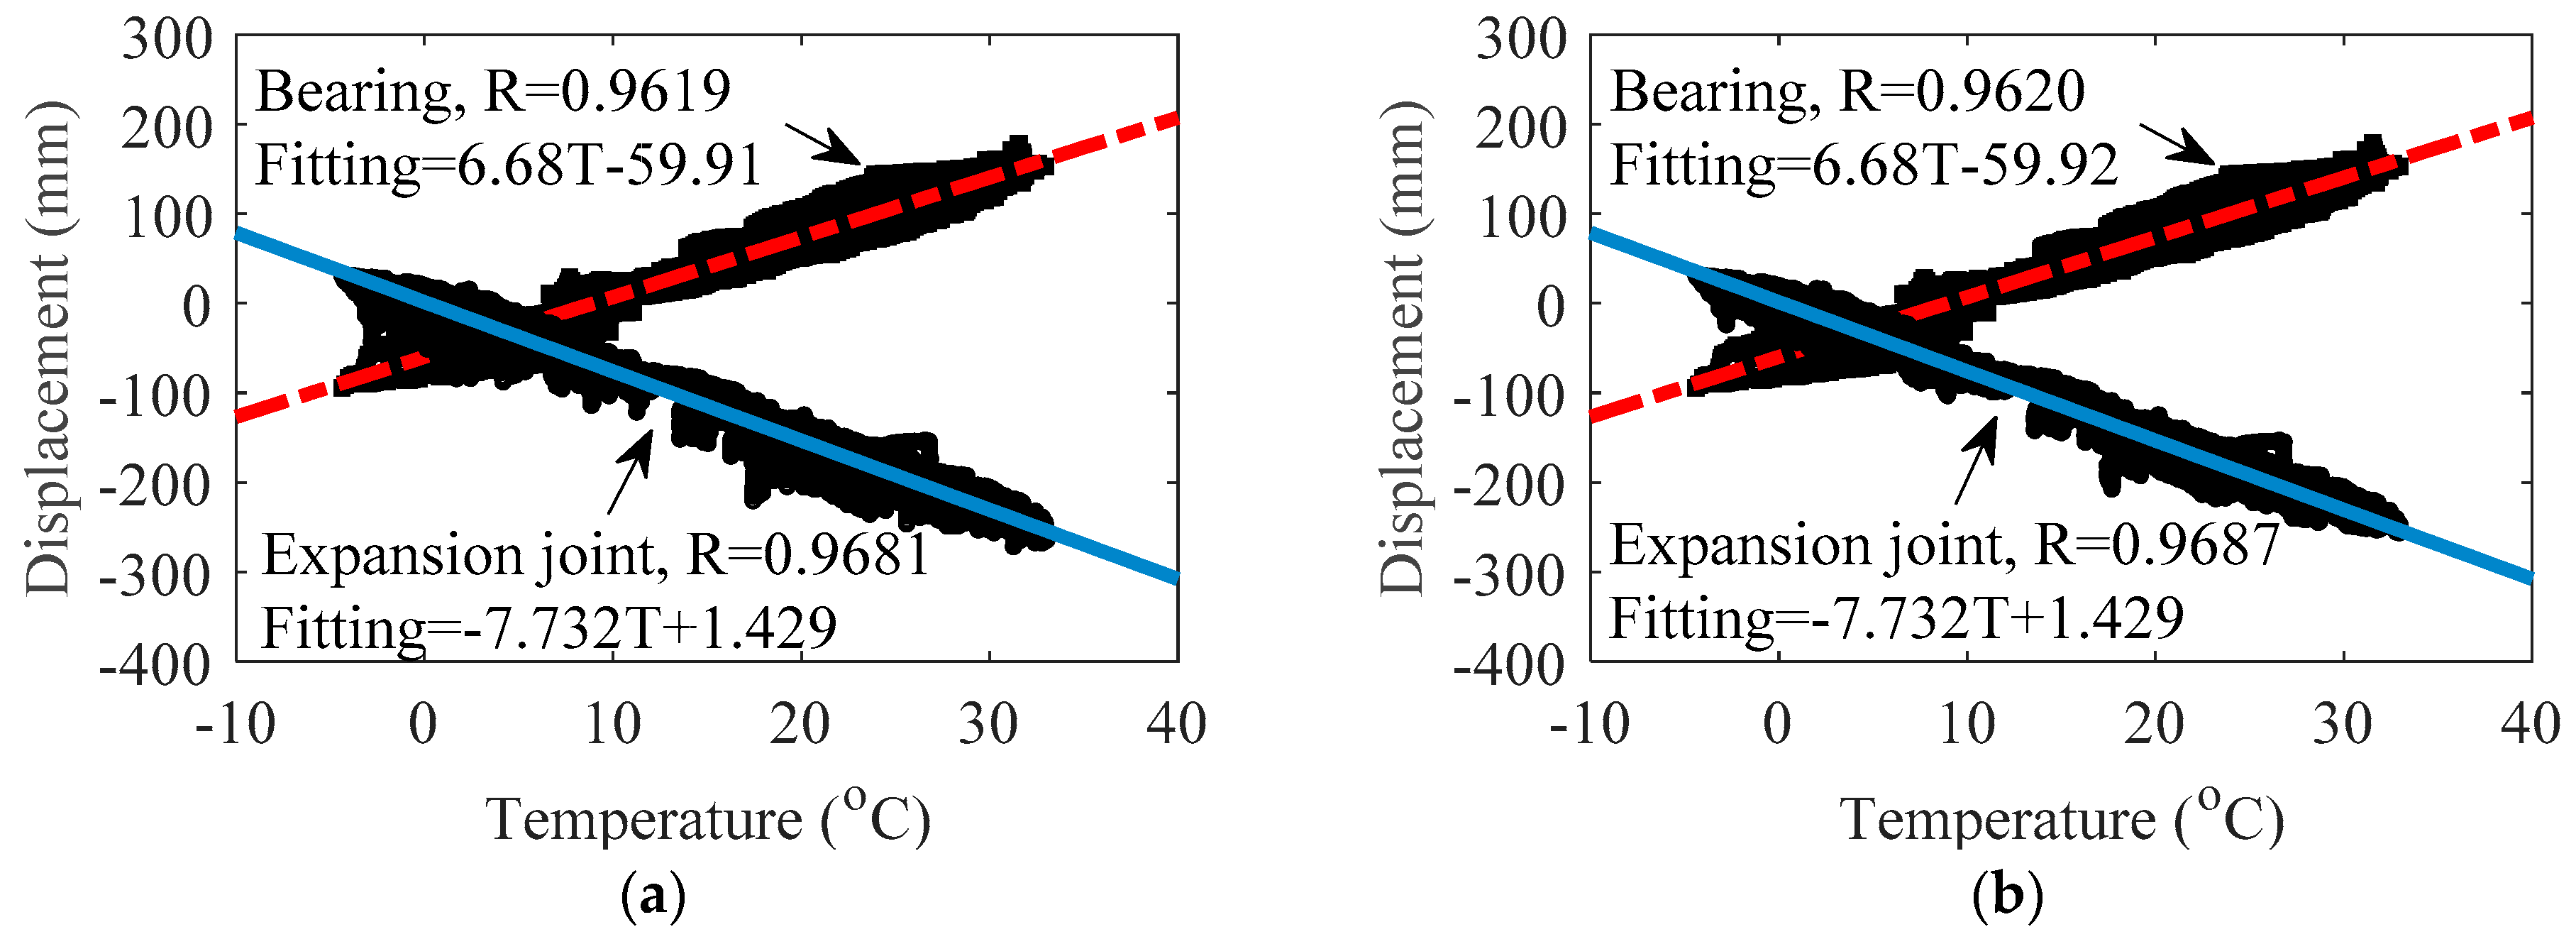
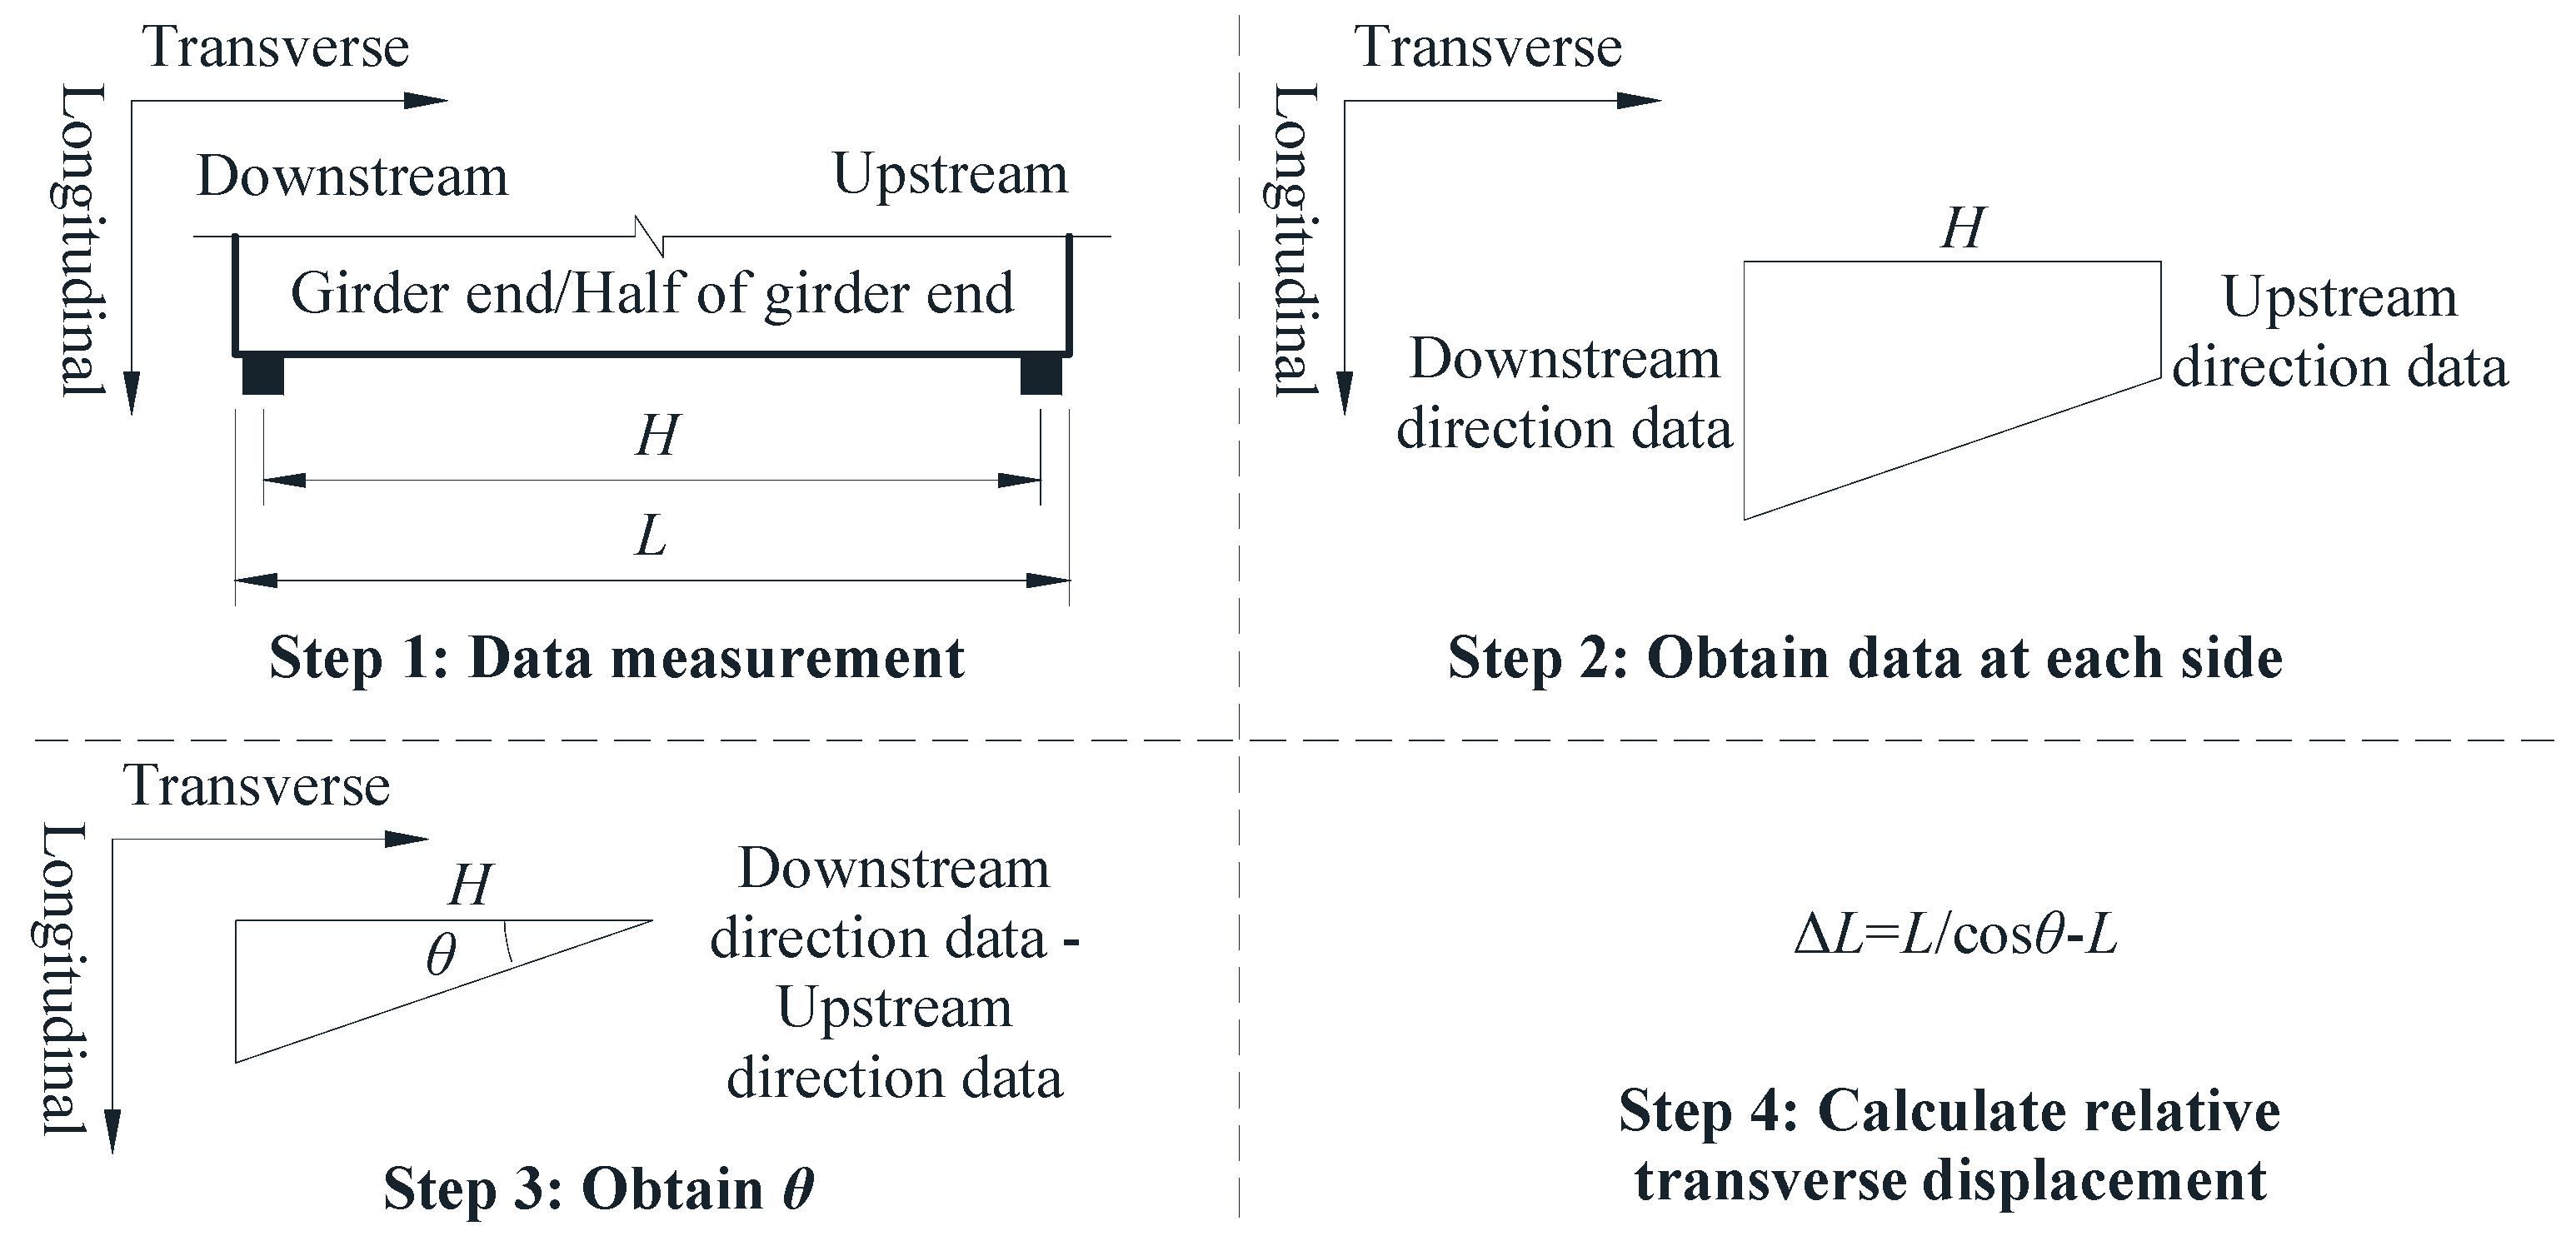
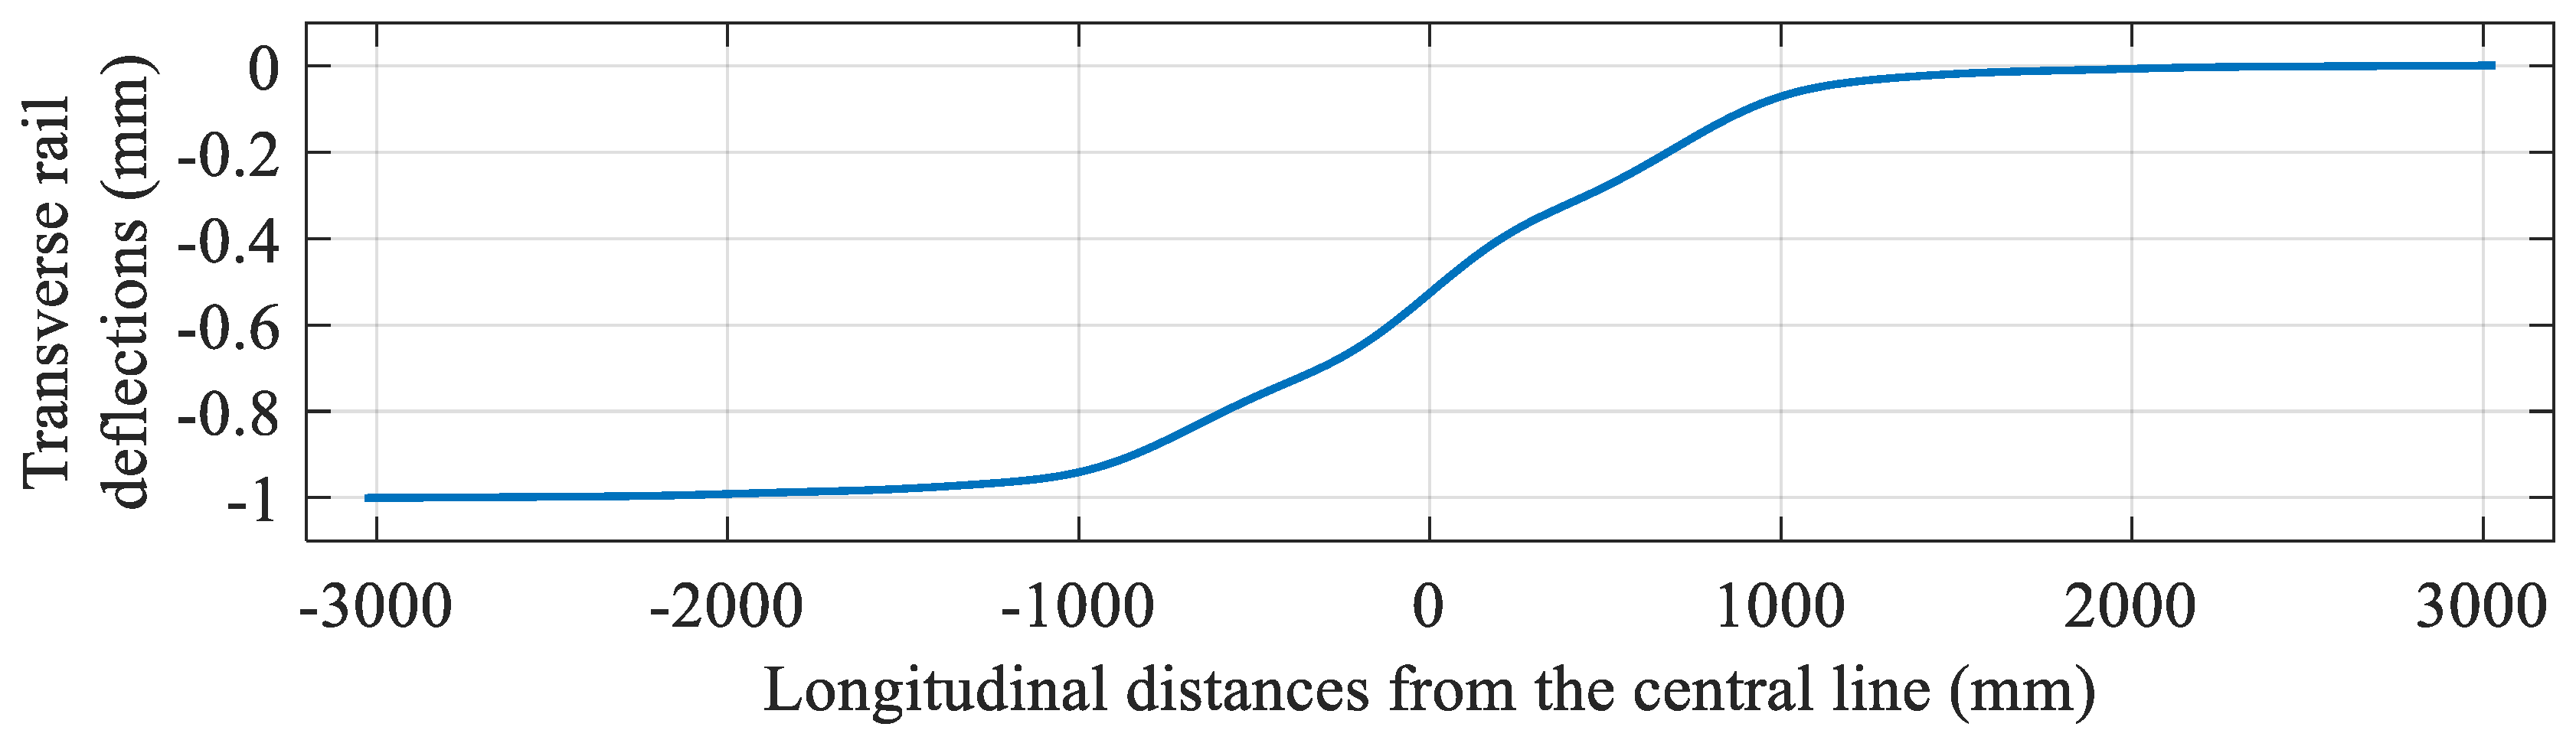
4.1. Transverse Behavior of the Girder End Calculated by the Longitudinal Displacement Data

Based on the longitudinal displacement data of the bearings and expansion joints on the bridge girder end, the cross-section rotation of the girder and the relative transverse displacement of the expansion joint can be calculated using the same principle (as shown in Figure 10). L can be the transverse length of a girder or an expansion joint, and H can be the distance between two sensors. The L/cosθ in Step 4 is the length of the triangular hypotenuse in Step 3. It should be noted that because the calculated θ is small (less than 6.5 × 10⁻⁵ rad), L/cosθL (the relative transverse displacement between two measured points, i.e., the transverse deformation of the girder cross-section) must be chosen, and not θ (cross-section rotation), to characterize the transverse behavior of the girder.
According to the calculation presented in Figure 10, Figure 11 shows the transverse deformation of the girders and the relative transverse displacement of the expansion joints at the bridge girder ends in 2017. Figure 11a is the transverse deformation of the girder (30 m apart, calculated from B-7-11 and B-7-12) at Pier 7 from June to December; Figure 11b is the relative transverse displacement of the downstream expansion joint (15 m apart, calculated from EJ-7-1 and EJ-7-2) at Pier 7 from June to December; Figure 11c is the relative transverse displacement of the expansion joint (30 m apart, calculated from EJ-7-1 and EJ-7-4) at Pier 7 from June to December; and Figure 11d is the relative transverse displacement of the expansion joint (30 m apart, calculated from EJ-1-1 and EJ-1-3) at Pier 1 from June to July.
As shown in Figure 11, the relative transverse displacement of the downstream expansion joint (15 m, including two expansion devices) is not significantly smaller than that of the whole expansion joint (30 m, including four expansion devices) due to the relative transverse displacement of the expansion joint, which depends not only on the main bridge deformation but also the ramp bridge deformation. Specifically, the 30-m-wide ramp bridge on Pier 7 includes two independent 15-m-wide girders. The maximum transverse deformation of the girder is nearly 2 mm, and the maximum relative transverse displacement of the expansion joint is nearly 1 mm.
The transverse deformation (2 mm) is a low level of deformation for a steel girder with a transverse length of 30 m. However, for the expansion joint (and the expansion devices in the expansion joint), which does not have any transverse stiffness, the effect of 1 mm of relative transverse displacement between the main bridge and the ramp bridge must be investigated further. Furthermore, according to the study of Li et al. [27] and the design documents [28,29,30], the stability of crossing high-speed trains declines significantly when 1 mm of relative transverse displacement is present at the expansion joint (including the expansion devices within the joint). The maximum value of the relative transverse displacement of the expansion joint in Figure 11d is consistent with the daily inspection results of the bridge, which aids in the rapid resetting of the transverse rail deflection at the expansion joint. However, the mechanical behavior of the expansion device (including rail deflection) under the relative transverse displacements must be evaluated more precisely.

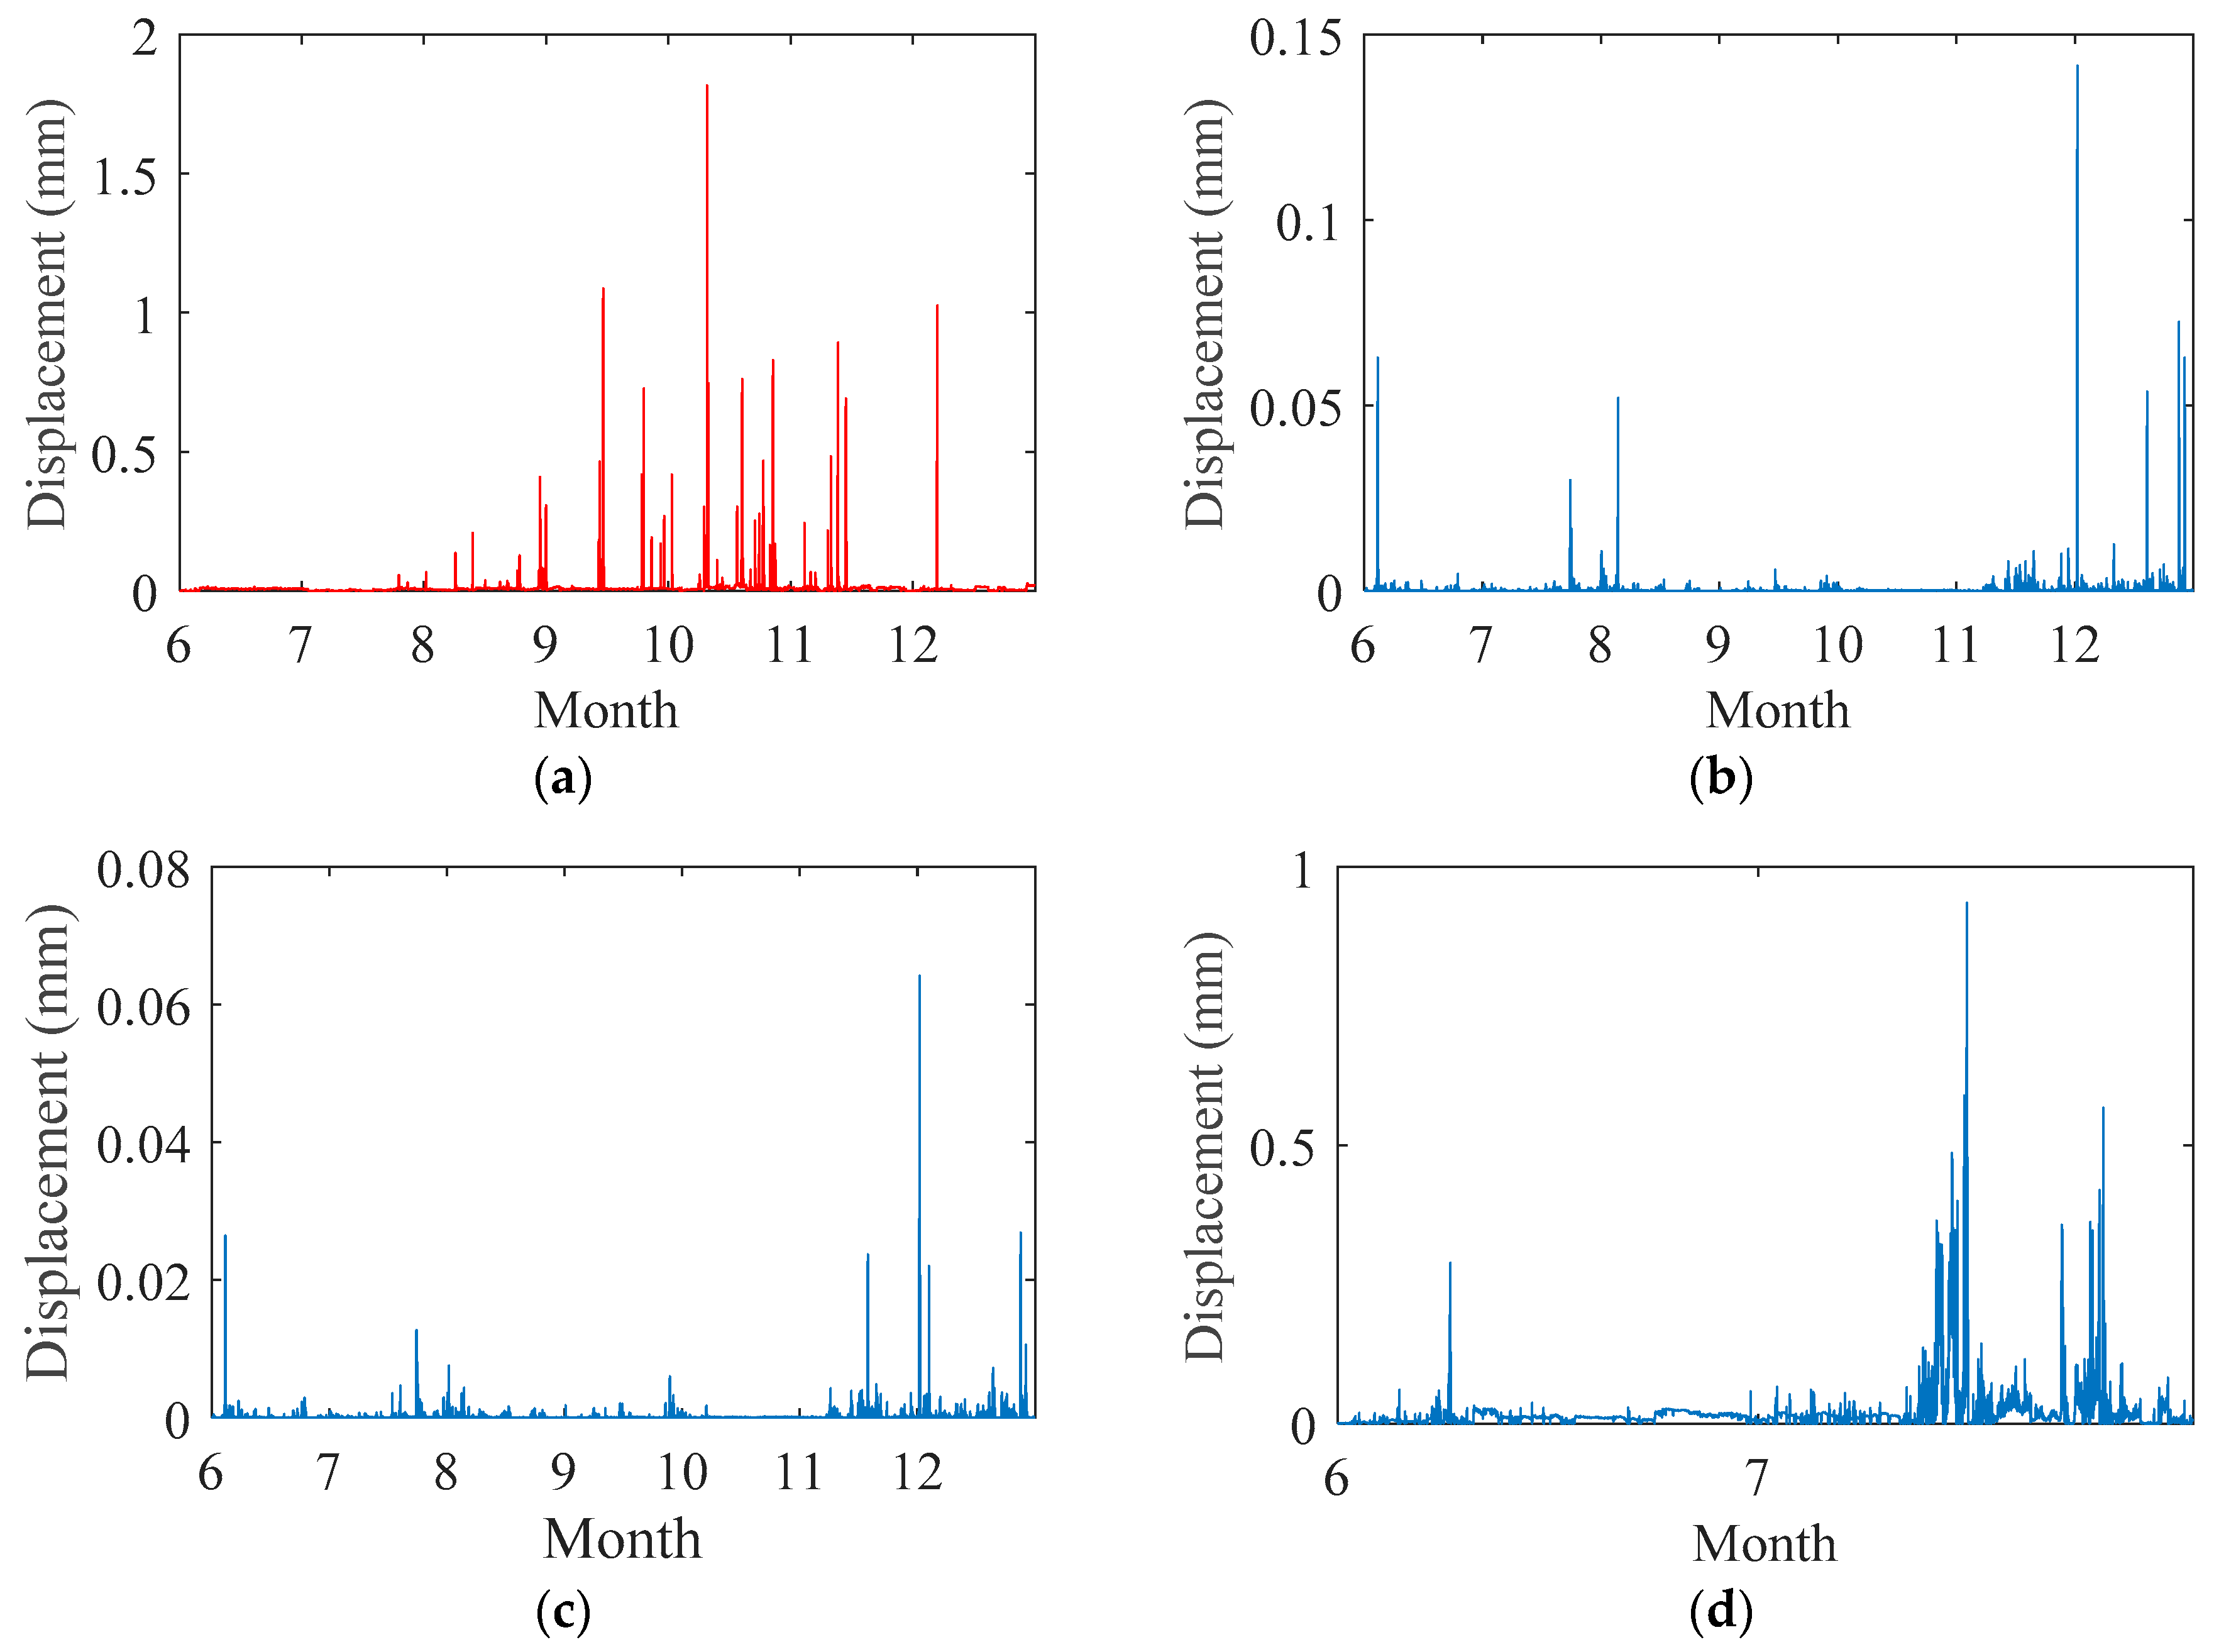
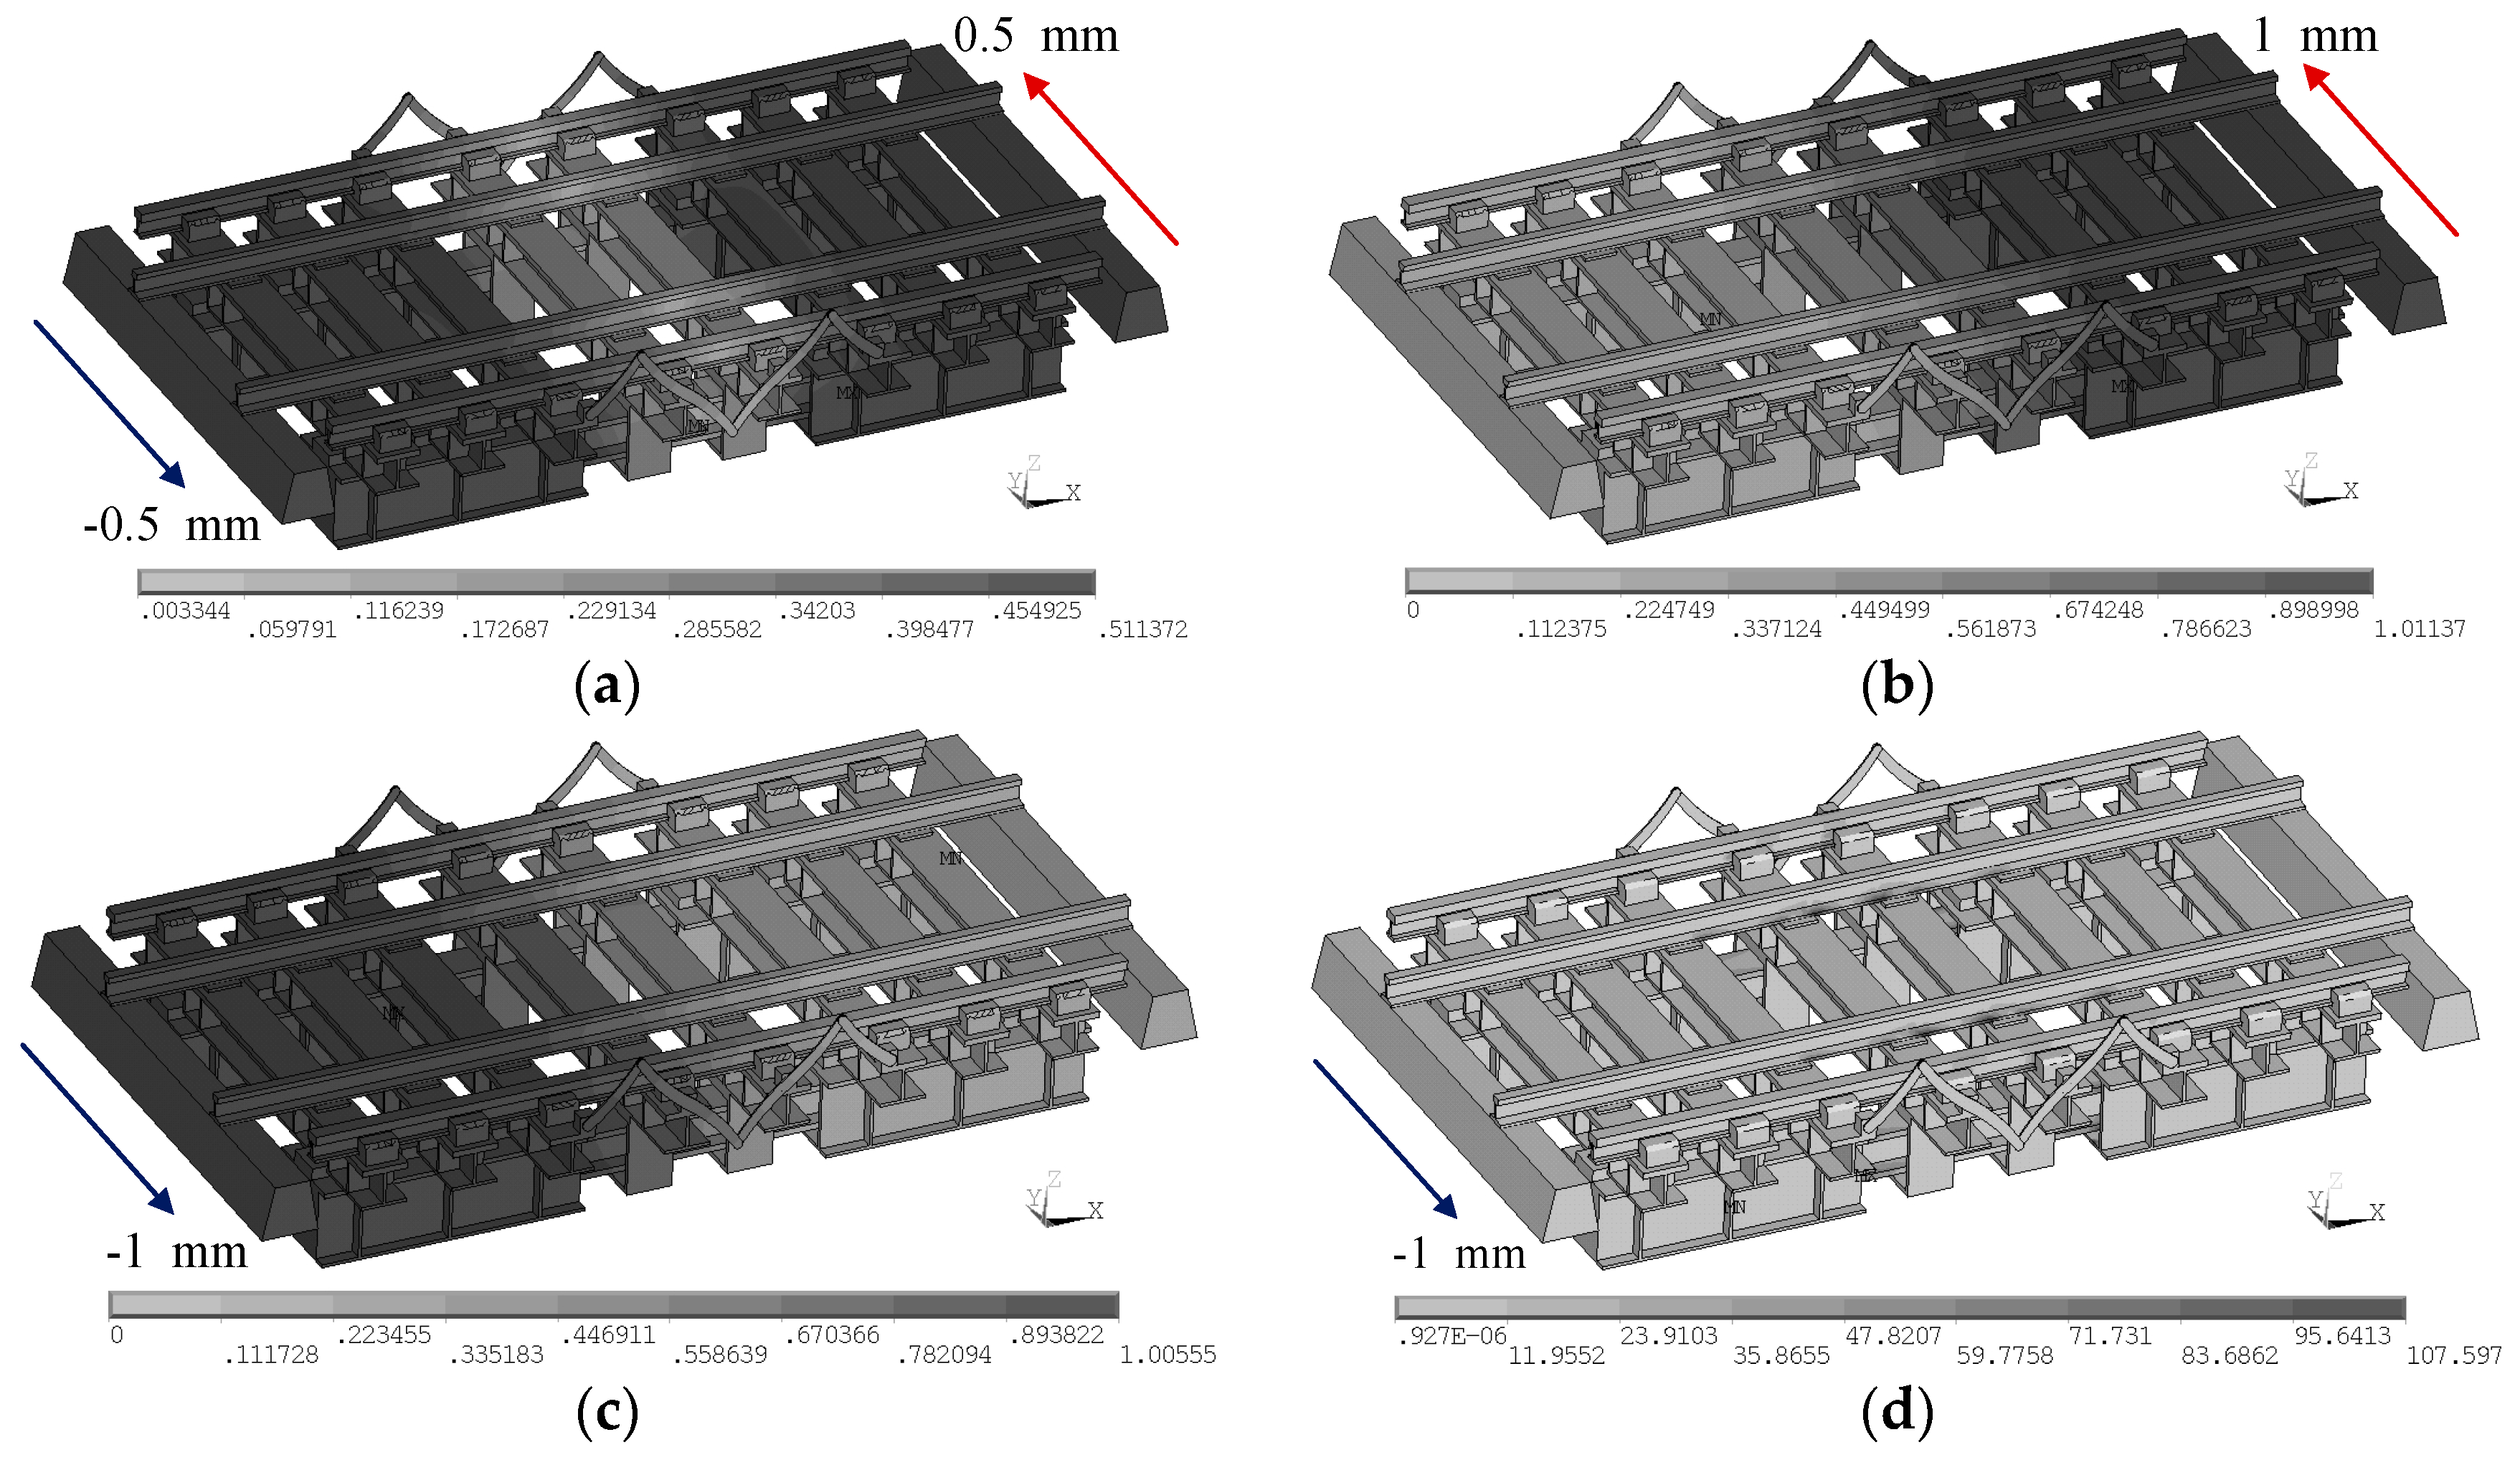
4.2. Mechanical Characteristics of the Expansion Device under Relative Transverse Displacements

A three-dimensional FE model of the expansion device is established using ANSYS to analyze the mechanical behavior of the expansion device under relative transverse displacements. The rails, the steel sleepers, the expansion boxes and the sliding support in the expansion boxes, the guide-rails, and the scissor-like connecting rod are established using the SOLID187 element with the corresponding parameters for steel, while the concrete sleepers are established using the SOLID187 element with the parameters for concrete. According to the design documents and the engineering experience, the tensile yield strength and tensile strength of the steel used on the expansion device are 370 and 510 MPa (Chinese Q370qE steel), and the tensile yield strength and tensile strength of the steel rail are 460 and 880 MPa (Chinese U71Mn steel); the elastic modulus of all steel materials is set to 2.06 × 10⁵ N/mm2 before yielding, and is set to 0 N/mm2 after yielding; the elastic modulus of concrete sleeper is set to 3.6 × 10⁴ N/mm2; the damping ratio of the steel material is set to 0.02, while the damping ratio of the concrete material is set to 0.05. The dynamic effects of the operating loads are small for the expansion device, such that the stiffness and damping of all of the fasteners and the sliding plates are neglected. All of the fasteners are modeled by coupling the degrees of freedom (DOF) in the corresponding directions, while all of the sliding plates are modeled by releasing the DOF in the corresponding directions. The expansion box and sliding support, the sleeper and rail, and the sleeper and guide-rail at the fixed side are coupled in the longitudinal (X), transverse (Y), and vertical (Z) directions. The expansion box and sliding support, the sleeper and rail, and the sleeper and guide-rail at the free side are coupled in the Y and Z directions. The scissor-like connecting rods are coupled with the steel sleepers in the X, Y, and Z directions at the connected nodes, allowing the connecting rods to rotate around the Y axis.
Figure 12 shows the scalar displacement contours and the von Mises stress contours of the expansion device under 1 mm relative transverse displacement using three types of loading methods. Figure 12a presents the results under −0.5 mm of displacement on the fixed side and +0.5 mm of displacement on the free side; Figure 12b displays the results under 1 mm of displacement on the free side; and Figure 12c,d show the results under −1 mm of displacement on the fixed side. In the FE model of the expansion device (Figure 12), the left side is fixed (main bridge side), and the right side is free (ramp bridge side). The displacement loads are applied at the nodes of the expansion box bottom and the concrete sleeper bottom. The FE model of the expansion device is symmetric along the upstream and downstream directions (the transverse direction is the Y direction), and all three loading methods can represent the typical situation of the expansion device under relative transverse displacements. The three loading methods used to generate the 1-mm relative transverse displacement generate different displacement contours but nearly the same stress contours.
As shown in Figure 12, the displacement maximum under 1 mm of displacement on the free side is 0.58% larger than that under −1 mm of displacement on the fixed side; when subjected to 1 mm of relative transverse displacement, the rails, guide-rails, and scissor-like connecting rods, which are connected to the steel sleepers, exhibit relatively higher displacements, and the contact areas of the hanging steel sleepers with the rails, guide rails, sliding supports, and scissor-like connecting rods will have relatively higher stresses. However, the stress of the entire structure remains at a low level comparing with the yield strength of steel materials. It is worth noting that, according to the time–frequency analysis results of the monitoring data, the displacement load of the expansion device is mainly due to the main bridge (fixed side), where Figure 12c,d represent the most common situation encountered by the expansion device in bridge operation.
For the expansion device at the girder end, two types of important factors can be used to indicate the reliability of the bridge structure and train crossings: first, the transverse deflection of the rail indicates the stability of train crossing; second, the stress that develops within the expansion device members indicates the degree of fatigue sustained by the expansion device. Table 2 shows the maximum mechanical responses of important factors and their location under −1 mm of transverse displacement on the fixed side (as in Figure 12c,d). The two other types of loading methods give rise to almost the same maximum values and locations in displacement.
Based on the monitoring data, the change in the relative transverse displacements is a gradual process. Hence, the dynamic effects of the expansion device under relative transverse displacement is neglected. What should be explained here is that if the dynamic effects are considered, then the top point of the scissor-like connecting rods will reach 1.88 mm under the transient loading of −1 mm of displacement on the fixed side (the static result is 0.825 mm), which is the dynamic displacement maximum point of the whole device. However, the maximum von Mises stress of the scissor-like connecting rod is still at a low level (less than 48 MPa), which occurs at the top of the rotating shaft of the scissor-like connecting rods due to the limited amount of stress that can be generated by the transverse rigid swing of the scissor-like connecting rods.

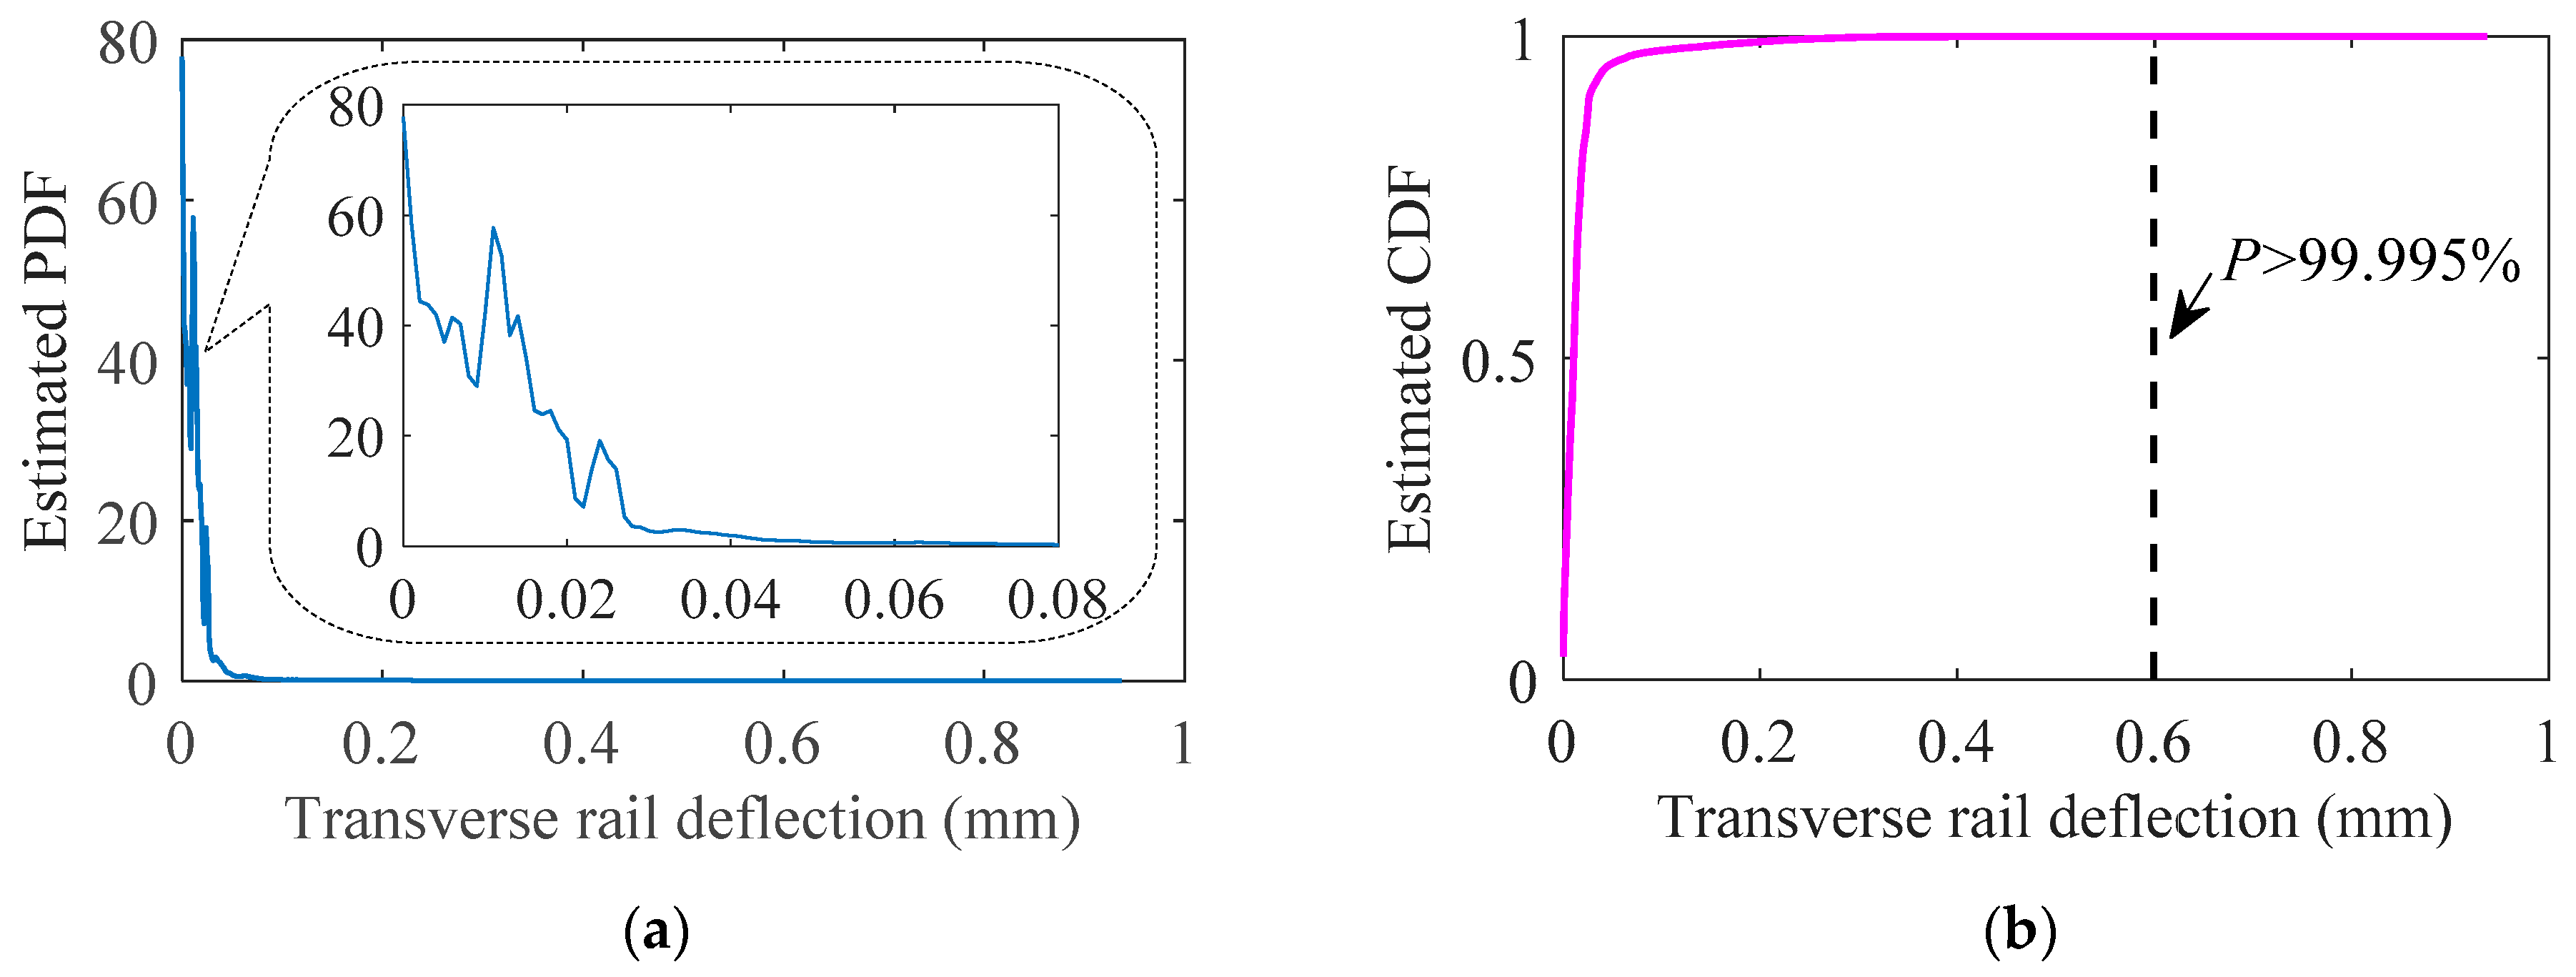
4.3. Reliability and Early Warning of the Girder End of the Train-Bridge System

Adding the calculated relative transverse displacements to the fixed side (the main bridge side) of the expansion device FE model, the mechanical behaviors of the expansion device during the operating period can be calculated. Then, the reliability analysis of the girder end train-bridge system can be conducted based on the monitoring data. Considering the missing data of sensor EJ-1-3 (valid only in June and July, 2017), and the maximum relative transverse displacements that occur at EJ-1-1 to EJ-1-3 in July 2017, the relative transverse displacements used for reliability analysis come from the data of EJ-1-1 to EJ-1-3 for June through July 2017.
Most of the long-term responses will not obey a single common distribution (e.g., normal distribution). The relative transverse displacement data-driven calculated responses of expansion device FE model do not obey a simple probability distribution too. Hence, a non-parametric estimation should be used in the description of their statistical features [31,32,33]. The kernel density estimation is used to calculate the statistical features of the mechanical behaviors of the expansion device. A kernel distribution is defined by a smoothing function and a bandwidth value, which control the smoothness of the resulting density curve. The kernel density estimator is the estimated probability density function (PDF) of a random variable. For any discrete variables of x, the kernel density estimator’s formula is given by
f h ( x ) = 1 n h i = 1 n K ( x x i h )
where x1, x2, …, xn are samples from an unknown distribution; n is the sample size; K(·) is the kernel smoothing function, which uses a normal distribution function in this article; and h is the bandwidth.
The kernel estimator for the cumulative distribution function (CDF), for any real values of x, is given by
F h ( x ) = x f h ( t ) d t = 1 n i = 1 n G ( x x i h )
where G ( x ) = x K ( t ) d t . In this article, the smoothing function uses normal, h equals (data maximum − data minimum)/1000.
For the fatigue reliability of the girder end (expansion device), the kernel PDF of the data-driven calculated von Mises stresses and their rainflow equivalent amplitudes belonging to the calculated maximum points of the sliding supports, guide rails, rails, and scissor-like connecting rods are shown in Figure 13. Under the diurnal relative transverse displacements, the von Mises stress amplitudes are mainly in the range of 0–3 MPa. The maximum von Mises stress of the sliding support is 100.71 MPa, but only 214 amplitudes exceed 10 MPa in the 2-month study period. According to the fatigue design codes of Europe and United States [34,35], the expansion device will not reach the cut-off limit of fatigue (the lowest stress amplitude that will lead to fatigue in the steel; the lowest cut-off limit of Europe code [34] is 15 MPa, and the lowest cut-off limit of US code [35] is 10 MPa) in most cases. The fatigue reliability of the expansion device under the diurnal relative transverse displacements is sufficient. The fatigue of the girder end may depend more on the vertical train loads during bridge operation.
For the train crossings, the transverse deflection of the rail is used to analyze the girder end reliability. Figure 14 gives the transverse rail deflections under the load necessary to achieve −1 mm of relative transverse displacement on the fixed side. The rail deflects at approximately 1 mm in the longitudinal distance of 2000 mm. For a China Railway High-speed 3 (CRH3) type electric multiple unit (EMU) train with cars that are 25 m in length, the rail transverse deflection will give an impulse to each crossing train wheel. The transverse stability of the crossing high-speed trains will be significantly weakened. Considering the cumulative effect of some other factors (e.g., the transverse track irregularity), the transverse instability of the train running will be further weakened. The transverse deflections of the rail should be monitored carefully during diurnal bridge operation.
Next, assuming that Z is the discrete data of rail transverse deflections, the probability (CDF value) that the element of Z is less than αr can be expressed as
P = P ( z α r ) = α r f Z ( z ) d z
where fZ(z) is the PDF of Z; r is the resistance of the transverse rail deflections at the expansion device, which is determined by the code limit or engineering experience; and α is the statistical redundancy of the early warning.
Figure 15 shows the kernel PDF and kernel CDF of transverse rail deflections based on the data of EJ-1-1 to EJ-1-3 from June through July 2017. As shown in Figure 15b, the value of αr is approximately 0.6 mm at the probability of 99.995%. The train running stability limit of transverse rail deflections for the expansion device (r) is 1 mm, and the statistical redundancy of the early warning (α) can be set as 0.6. If the calculated transverse rail deflections based on the real-time monitoring data exceed 0.6 mm, a deceleration instruction should be sent to the crossing high-speed trains until the rails at the girder end can be inspected and repaired. The determination of the reliable probability in the diurnal early warning depends on the maintenance experience of the bridge engineers.
The original intention of bridge health monitoring is to detect bridge damage as early as possible, to facilitate the rapid repair of a bridge subject to diurnal operation. With the accumulation of monitoring data, the reliable probability and the statistical redundancy of the early warning system can be updated for more informed long-term bridge operation. This approach promotes smart maintenance of the girder end of the long-span high-speed railway bridge.

5. Conclusions

With regards to the Nanjing Dashengguan Yangtze River Bridge, the analysis in this study mainly consists of two parts. The first part is an explanation of the behavior of the bridge based on its measured longitudinal displacement data, while the second part is an estimation of the girder end reliability based on the calculated relative transverse displacements and expansion device in an FE model. Four main conclusions are drawn, with the first and second conclusions corresponding to the first part of the study, and the third and fourth conclusions corresponding to the second part.
(1) The empirical wavelet transform can adaptively decompose the data of bridge longitudinal displacements, and the time–frequency characteristics can be captured to investigate the input–output mechanism of the bridge structure. The bridge longitudinal displacements are mainly influenced by temperature change. The longitudinal displacements of the expansion joints are more sensitive to the temperature variations than those of the bearings, because the longitudinal displacements of the expansion joints develop not only from the main bridge but also due to the ramp bridge.
(2) The time lag effect between the longitudinal displacement and environmental temperature is small for the bearings and expansion joints. The longitudinal displacements of the bearings and the expansion joints both exhibiting a high degree of correlation with environmental temperature. The bridge bearings at the girder ends generally have the largest longitudinal displacements and may possess insufficient reserve redundancy at the sliding limit. The wear lifetimes of the bridge bearings are predicted based on the cumulative longitudinal sliding displacement (50 km) of the design. Ideally, the bridge bearings will exhibit lifetimes in the range of 45–82 years, which are less than the bridge design lifetime (100 year).
(3) Based on the longitudinal displacement data of the bearings and expansion joints at the bridge ends, the transverse deformation of the main-bridge girder ends, and the relative transverse displacement of the expansion joints between the main-bridge girder-ends and the ramp-bridge girder-ends are calculated. The maximum transverse deformation of each girder end is close to 2 mm, while the maximum relative transverse displacement of the expansion joint is close to 1 mm during long-term bridge operation. Under 1 mm of relative transverse displacement at the main-bridge side of the expansion device, the transverse deflection of the rails is 1.00069 mm, while the stress of the entire structure of expansion device remains at a low level.
(4) The long-term von Mises stress of the expansion device is at a low level, which should not result in fatigue under the anticipated transverse displacements (due to temperature effects) during bridge operation. However, the transverse rail deflections have approached 1 mm, which will reduce the stability of crossing high-speed trains at the location of the expansion device. Close attention should be paid to the stability of the train crossings. Using kernel density estimation, a non-parametric estimation of long-term transverse rail deflections is conducted. The probability of the transverse rail deflections being under 0.6 mm is estimated to be 99.995%. The reliability threshold of the transverse rail deflection can be used to indicate the deceleration instructions given to high-speed trains and the rapid inspection of expansion devices.

Author Contributions

Conceptualization, Y.D.; Methodology & Analysis, Writing—original draft, H.Z.; Writing—review and editing, S.N. and A.L.

Funding

This research was funded by the National Key R&D Program of China (grant no. 2017YFC0840200), the National Natural Science Foundation of China (grant nos. 51438002 and 51578138).

Conflicts of Interest

The authors declare no conflict of interest.

References

  1. Zhao, H.W.; Ding, Y.L.; Geng, F.F.; Li, A.Q. RAMS evaluation for a steel-truss arch high-speed railway bridge based on SHM system. Struct. Monit. Maintenance 2018, 5, 79–92. [Google Scholar]
  2. Treyssède, F. Finite element modeling of temperature load effects on the vibration of local modes in multi-cable structures. J. Sound Vib. 2018, 413, 191–204. [Google Scholar] [CrossRef]
  3. Liu, Y.; Qian, Z.; Hu, J.; Jin, L. Temperature Behavior and Stability Analysis of Orthotropic Steel Bridge Deck during Gussasphalt Pavement Paving. J. Bridge Eng. 2018, 23, 04017117. [Google Scholar] [CrossRef]
  4. Cao, Y.; Yim, J.; Zhao, Y.; Wang, M. Temperature effects on cable stayed bridge using health monitoring system: A case study. Struct. Health Monit. 2010, 10, 523–537. [Google Scholar]
  5. Van Le, H.; Nishio, M. Time-series analysis of GPS monitoring data from a long-span bridge considering the global deformation due to air temperature changes. J. Civ. Struct. Health Monit. 2015, 5, 415–425. [Google Scholar] [CrossRef]
  6. Sun, Z.; Zou, Z.; Zhang, Y. Utilization of structural health monitoring in long-span bridges: Case studies. Struct. Control Health Monit. 2017, 24, e1979. [Google Scholar] [CrossRef]
  7. Xia, Q.; Zhang, J.; Tian, Y.; Zhang, Y. Experimental Study of Thermal Effects on a Long-Span Suspension Bridge. J. Bridge Eng. 2017, 22, 04017034. [Google Scholar] [CrossRef]
  8. Maguire, M.; Roberts-Wollmann, C.; Cousins, T. Live-Load Testing and Long-Term Monitoring of the Varina-Enon Bridge: Investigating Thermal Distress. J. Bridge Eng. 2018, 23, 04018003. [Google Scholar] [CrossRef]
  9. Erazo, K.; Sen, D.; Nagarajaiah, S.; Sun, L. Vibration-based structural health monitoring under changing environmental conditions using Kalman filtering. Mech. Syst. Sig. Process. 2019, 117, 1–15. [Google Scholar] [CrossRef]
  10. Liu, Y.; Zhang, H.; Liu, Y.; Deng, Y.; Jiang, N.; Lu, N. Fatigue reliability assessment for orthotropic steel deck details under traffic flow and temperature loading. Eng. Fail. Anal. 2017, 71, 179–194. [Google Scholar] [CrossRef]
  11. Liu, Y.; Zhang, S. Probabilistic Baseline of Finite Element Model of Bridges under Environmental Temperature Changes. Comput.-Aided Civ. Infrastruct. Eng. 2017, 32, 581–598. [Google Scholar] [CrossRef]
  12. Zhao, H.W.; Ding, Y.L.; Nagarajaiah, S.; Li, A.Q. Behavior Analysis and Early Warning of Girder Deflections of a Steel-Truss Arch Railway Bridge under the Effects of Temperature and Trains: Case Study. J. Bridge Eng. 2019, 24, 05018013. [Google Scholar] [CrossRef]
  13. Guo, T.; Liu, J.; Huang, L. Investigation and control of large cumulative girder movements of long-span steel suspension bridges. Eng. Struct. 2016, 125, 217–226. [Google Scholar] [CrossRef]
  14. Liu, Z.; Phares, B.M.; Greimann, L.F. Use of Longitudinal Expansion Joints in Wide-Bridge Applications to Reduce Deck Cracking. J. Bridge Eng. 2016, 21, 04016068. [Google Scholar] [CrossRef]
  15. Sekiya, H.; Maruyama, O.; Miki, C. Visualization system for bridge deformations under live load based on multipoint simultaneous measurements of displacement and rotational response using MEMS sensors. Eng. Struct. 2017, 146, 43–53. [Google Scholar] [CrossRef]
  16. Luo, L.; Feng, M.Q.; Wu, Z.Y. Robust vision sensor for multi-point displacement monitoring of bridges in the field. Eng. Struct. 2018, 163, 255–266. [Google Scholar] [CrossRef]
  17. Nagarajaiah, S. Adaptive passive, semiactive, smart tuned mass dampers: identification and control using empirical mode decomposition, hilbert transform, and short-term fourier transform. Struct. Control Health Monit. 2009, 16, 800–841. [Google Scholar] [CrossRef]
  18. Liu, W.; Cao, S.; Chen, Y. Seismic Time–frequency Analysis via Empirical Wavelet Transform. IEEE Geosci. Remote Sens. Lett. 2016, 13, 28–32. [Google Scholar] [CrossRef]
  19. Nagarajaiah, S.; Erazo, K. Structural monitoring and identification of civil infrastructure in the United States. Struct. Monit. Maintenance 2016, 3, 51–69. [Google Scholar] [CrossRef]
  20. Wang, D.; Zhao, Y.; Yi, C.; Tsui, K.L.; Lin, J. Sparsity guided empirical wavelet transform for fault diagnosis of rolling element bearings. Mech. Syst. Sig. Process. 2018, 101, 292–308. [Google Scholar] [CrossRef]
  21. Wang, G.X.; Ding, Y.L.; Song, Y.S.; Wu, L.Y.; Yue, Q.; Mao, G.H. Detection and Location of the Degraded Bearings Based on Monitoring the Longitudinal Expansion Performance of the Main Girder of the Dashengguan Yangtze Bridge. J. Perform. Constr. Facil. 2016, 30, 04015074. [Google Scholar] [CrossRef]
  22. Zhao, H.W.; Ding, Y.L.; An, Y.H.; Li, A.Q. Transverse Dynamic Mechanical Behavior of Hangers in the Rigid Tied-Arch Bridge under Train Loads. J. Perform. Constr. Facil. 2017, 31, 04016072. [Google Scholar] [CrossRef]
  23. Ding, Y.L.; Zhao, H.W.; Deng, L.; Li, A.Q.; Wang, M.Y. Early Warning of Abnormal Train-Induced Vibrations for a Steel-Truss Arch Railway Bridge: Case Study. J. Bridge Eng. 2017, 22, 05017011. [Google Scholar] [CrossRef] [Green Version]
  24. Gilles, J. Empirical wavelet transform. IEEE Trans. Signal Process. 2013, 61, 3999–4010. [Google Scholar] [CrossRef]
  25. Huang, N.E.; Shen, Z.; Long, S.R.; Wu, M.C.; Shih, H.H.; Zheng, Q.; Yen, N.-C.; Tung, C.C.; Liu, H.H. The empirical mode decomposition and the Hilbert spectrum for nonlinear and non-stationary time series analysis. In Proceedings of the Royal Society of London. Series A: Mathematical, Physical and Engineering Sciences, London, UK, 8 March 1998; Royal Society: London, UK; pp. 903–995. [Google Scholar]
  26. Ministry of Railways of the People’s Republic of China. TB/T 2331-2013: Pot Bearing for Railway Bridge; China Railway Publishing House: Beijing, China, 2014. (In Chinese) [Google Scholar]
  27. Li, Y.L.; Xiang, H.Y.; Wan, T.B.; Ren, H.Q. Performance of Train Running over Expansion Joints at Beam Ends of Long-span Railway Bridge. J. Chin. Railway Soc. 2012, 34, 94–99. (In Chinese) [Google Scholar]
  28. Railway Engineering Research Institute of CARS. Temporary Technical Regulations for the Expansion Devices in the Girder End of the Dashengguan Yangtze River Bridge and Jinan Yellow River Bridge on the Beijing–Shanghai High-Speed Railway; Chinese Academy of Railway Sciences: Beijing, China, 2010. (In Chinese) [Google Scholar]
  29. National Railway Administration of the People’s Republic of China. TB 10621-2014: Code for Design of High Speed Railway; China Railway Publishing House: Beijing, China, 2016. (In Chinese)
  30. National Railway Administration of the People’s Republic of China. TB 10082-2017: Code for Design of Railway Track; China Railway Publishing House: Beijing, China, 2018. (In Chinese)
  31. Botev, Z.I.; Grotowski, J.F.; Kroese, D.P. Kernel Density Estimation via Diffusion. Ann. Stat. 2010, 38, 2916–2957. [Google Scholar] [CrossRef]
  32. Balomenos, G.P.; Padgett, J.E. Fragility Analysis of Pile-Supported Wharves and Piers Exposed to Storm Surge and Waves. J. Waterw. Port Coastal Ocean Eng. 2018, 144, 04017046. [Google Scholar] [CrossRef]
  33. Memmolo, V.; Pasquino, N.; Ricci, F. Experimental characterization of a damage detection and localization system for composite structures. Measurement 2018, 129, 381–388. [Google Scholar] [CrossRef]
  34. CEN. EN1993-1-9: Eurocode 3: Design of Steel Structures: Part 1–9: Fatigue; European Committee for Standardization: Brussels, Belgium, 2005. [Google Scholar]
  35. AASHTO. Guide Specifications for Fatigue Evaluation of Existing Steel Bridges; American Association of State Highway and Transportation Officials: Washington, DC, USA, 1990. [Google Scholar]
Figure 1. Bridge and its bearings and expansion devices (units: meters).
Applsci 09 02222 g001
Figure 2. Expansion devices and bearings at Pier 7.
Applsci 09 02222 g002
Figure 3. Locations of the magnetostrictive displacement sensors: (a) Pier 1 (2, 6, 7); (b) Pier 3 (5).
Applsci 09 02222 g003
Figure 4. Atmospheric temperature and its frequency spectrum over the course of one day: (a) time history; (b) power density.
Applsci 09 02222 g004
Figure 5. Longitudinal displacements and the associated low-frequency portion at the south girder end over the course of one day: (a) bearing (B-7-11); (b) expansion joint (EJ-7-1).
Applsci 09 02222 g005
Figure 6. Results of the empirical wavelet transform (EWT) decomposition of the longitudinal displacements at the south girder end over the course of one day: (a) bearing (B-7-11); (b) expansion joint (EJ-7-1).
Applsci 09 02222 g006
Figure 7. Trend of longitudinal displacements at the south girder end from June to December in 2017 (compared with the trend of atmospheric temperature): (a) bearing (B-7-11); (b) expansion joint (EJ-7-1).
Applsci 09 02222 g007
Figure 8. Correlation between longitudinal displacement and atmospheric temperature at the south girder end (bearing (B-7-11) and expansion joint (EJ-7-1)) from June to December in 2017: (a) original longitudinal displacement data; (b) first decomposition part of the EWT results.
Applsci 09 02222 g008
Figure 9. Longitudinal displacements of the bearings on Piers 1~3 and 5~7 versus their distances from Pier 4 in 2015: (a) annual average value with the capacity of bearings; (b) linear fitting line by each 1600 s of data.
Applsci 09 02222 g009
Figure 10. Process used to calculate the relative transverse displacement based on longitudinal displacement data.
Applsci 09 02222 g010
Figure 11. Relative transverse deformation/displacement at the girder ends: (a) main bridge girder (from B-7-11 and B-7-12); (b) expansion joint (from EJ-7-1 and EJ-7-2); (c) expansion joint (from EJ-7-1 and EJ-7-4); (d) expansion joint (from EJ-1-1 and EJ-1-3).
Applsci 09 02222 g011
Figure 12. Mechanical contours of the expansion device under 1 mm relative transverse displacement: (a) displacement contour under −0.5 mm on the fixed side and +0.5 mm on the free side (unit: mm); (b) displacement contour under +1 mm on the free side (unit: mm); (c) displacement contour under −1 mm on the fixed side (unit: mm); (d) stress contour under −1 mm on the fixed side (unit: MPa).
Applsci 09 02222 g012
Figure 13. Kernel probability density function (PDF) of the von Mises stresses belonging to the calculated maximum points of the expansion device members: (a) data-driven calculated results; (b) rainflow equivalent amplitude.
Applsci 09 02222 g013
Figure 14. Transverse deflections of the rail under −1 mm relative transverse displacement of the fixed side.
Applsci 09 02222 g014
Figure 15. Statistical features of transverse rail deflections based on the kernel density estimation: (a) PDF; (b) cumulative distribution function (CDF).
Applsci 09 02222 g015
Table 1. Cumulative longitudinal displacement and wear details of the bridge bearings.
Location of BearingsPier 1Pier 2Pier 3Pier 5Pier 6Pier 7
Cumulation Displacement in One Year (unit: km)0.61651.09101.10181.04890.94560.6154
Wear Rate in One Year (Compared with 50 km)0.01230.02180.02200.02100.01890.0123
Wear Time Every 50 km (unit: Years)81.1045.8345.3847.6752.8881.24
Table 2. Device mechanical responses under −1 mm of transverse displacement on the fixed side.
Mechanical ResponsesMaximum ValueMaximum Value Location
Transverse deflection of rails−1.00069 mmRails fastened on the steel sleepers at the fixed side.
von Mises stress of sliding supports107.60 MPaContact areas of the sliding support and the fixed box mouth.
von Mises stress of guide rails48.05 MPaContact areas of the guide rails and the hanging steel sleeper (including the fasteners).
von Mises stress of rails88.44 MPaContact areas of the rails and the hanging steel sleeper (including the fasteners).
von Mises stress of scissor-like connecting rods42.72 MPaMiddle rotating shafts of the scissor-like connecting rods connected with the steel sleeper.

