A conservative numerical modelling approach was chosen in this work to capture the element’s overall structural behavior. The individual components, i.e., facings, insulation and connectors, were modelled as individual parts made up of structural elements, all while incorporating the interaction between the different parts. This type of detailed global structural model is limited in the sense that it is unable to capture local stress conditions fully accurately, e.g., locally at connectors and anchorage details. As such, mainly bending failures are reflected in the analysis, whereas pull-out failure and buckling of connectors or anchorage failures are not captured. These failure modes are thus verified by local resistance models and/or verified by experimental values. Moreover, as a first step, the chosen modelling concept was validated using the wind load test results, followed by a detailed analysis of a full-scale element. The presented models incorporate the same modelling parameters, but differing geometry, loading and boundary conditions.
4.2.1. General Parameters
To gain a deeper understanding of the performance of the developed façade elements, finite element (FE) calculations were conducted in Abaqus/CAE 6.14-1 (Dassault Systèmes, Vélizy-Villacoublay, France) [
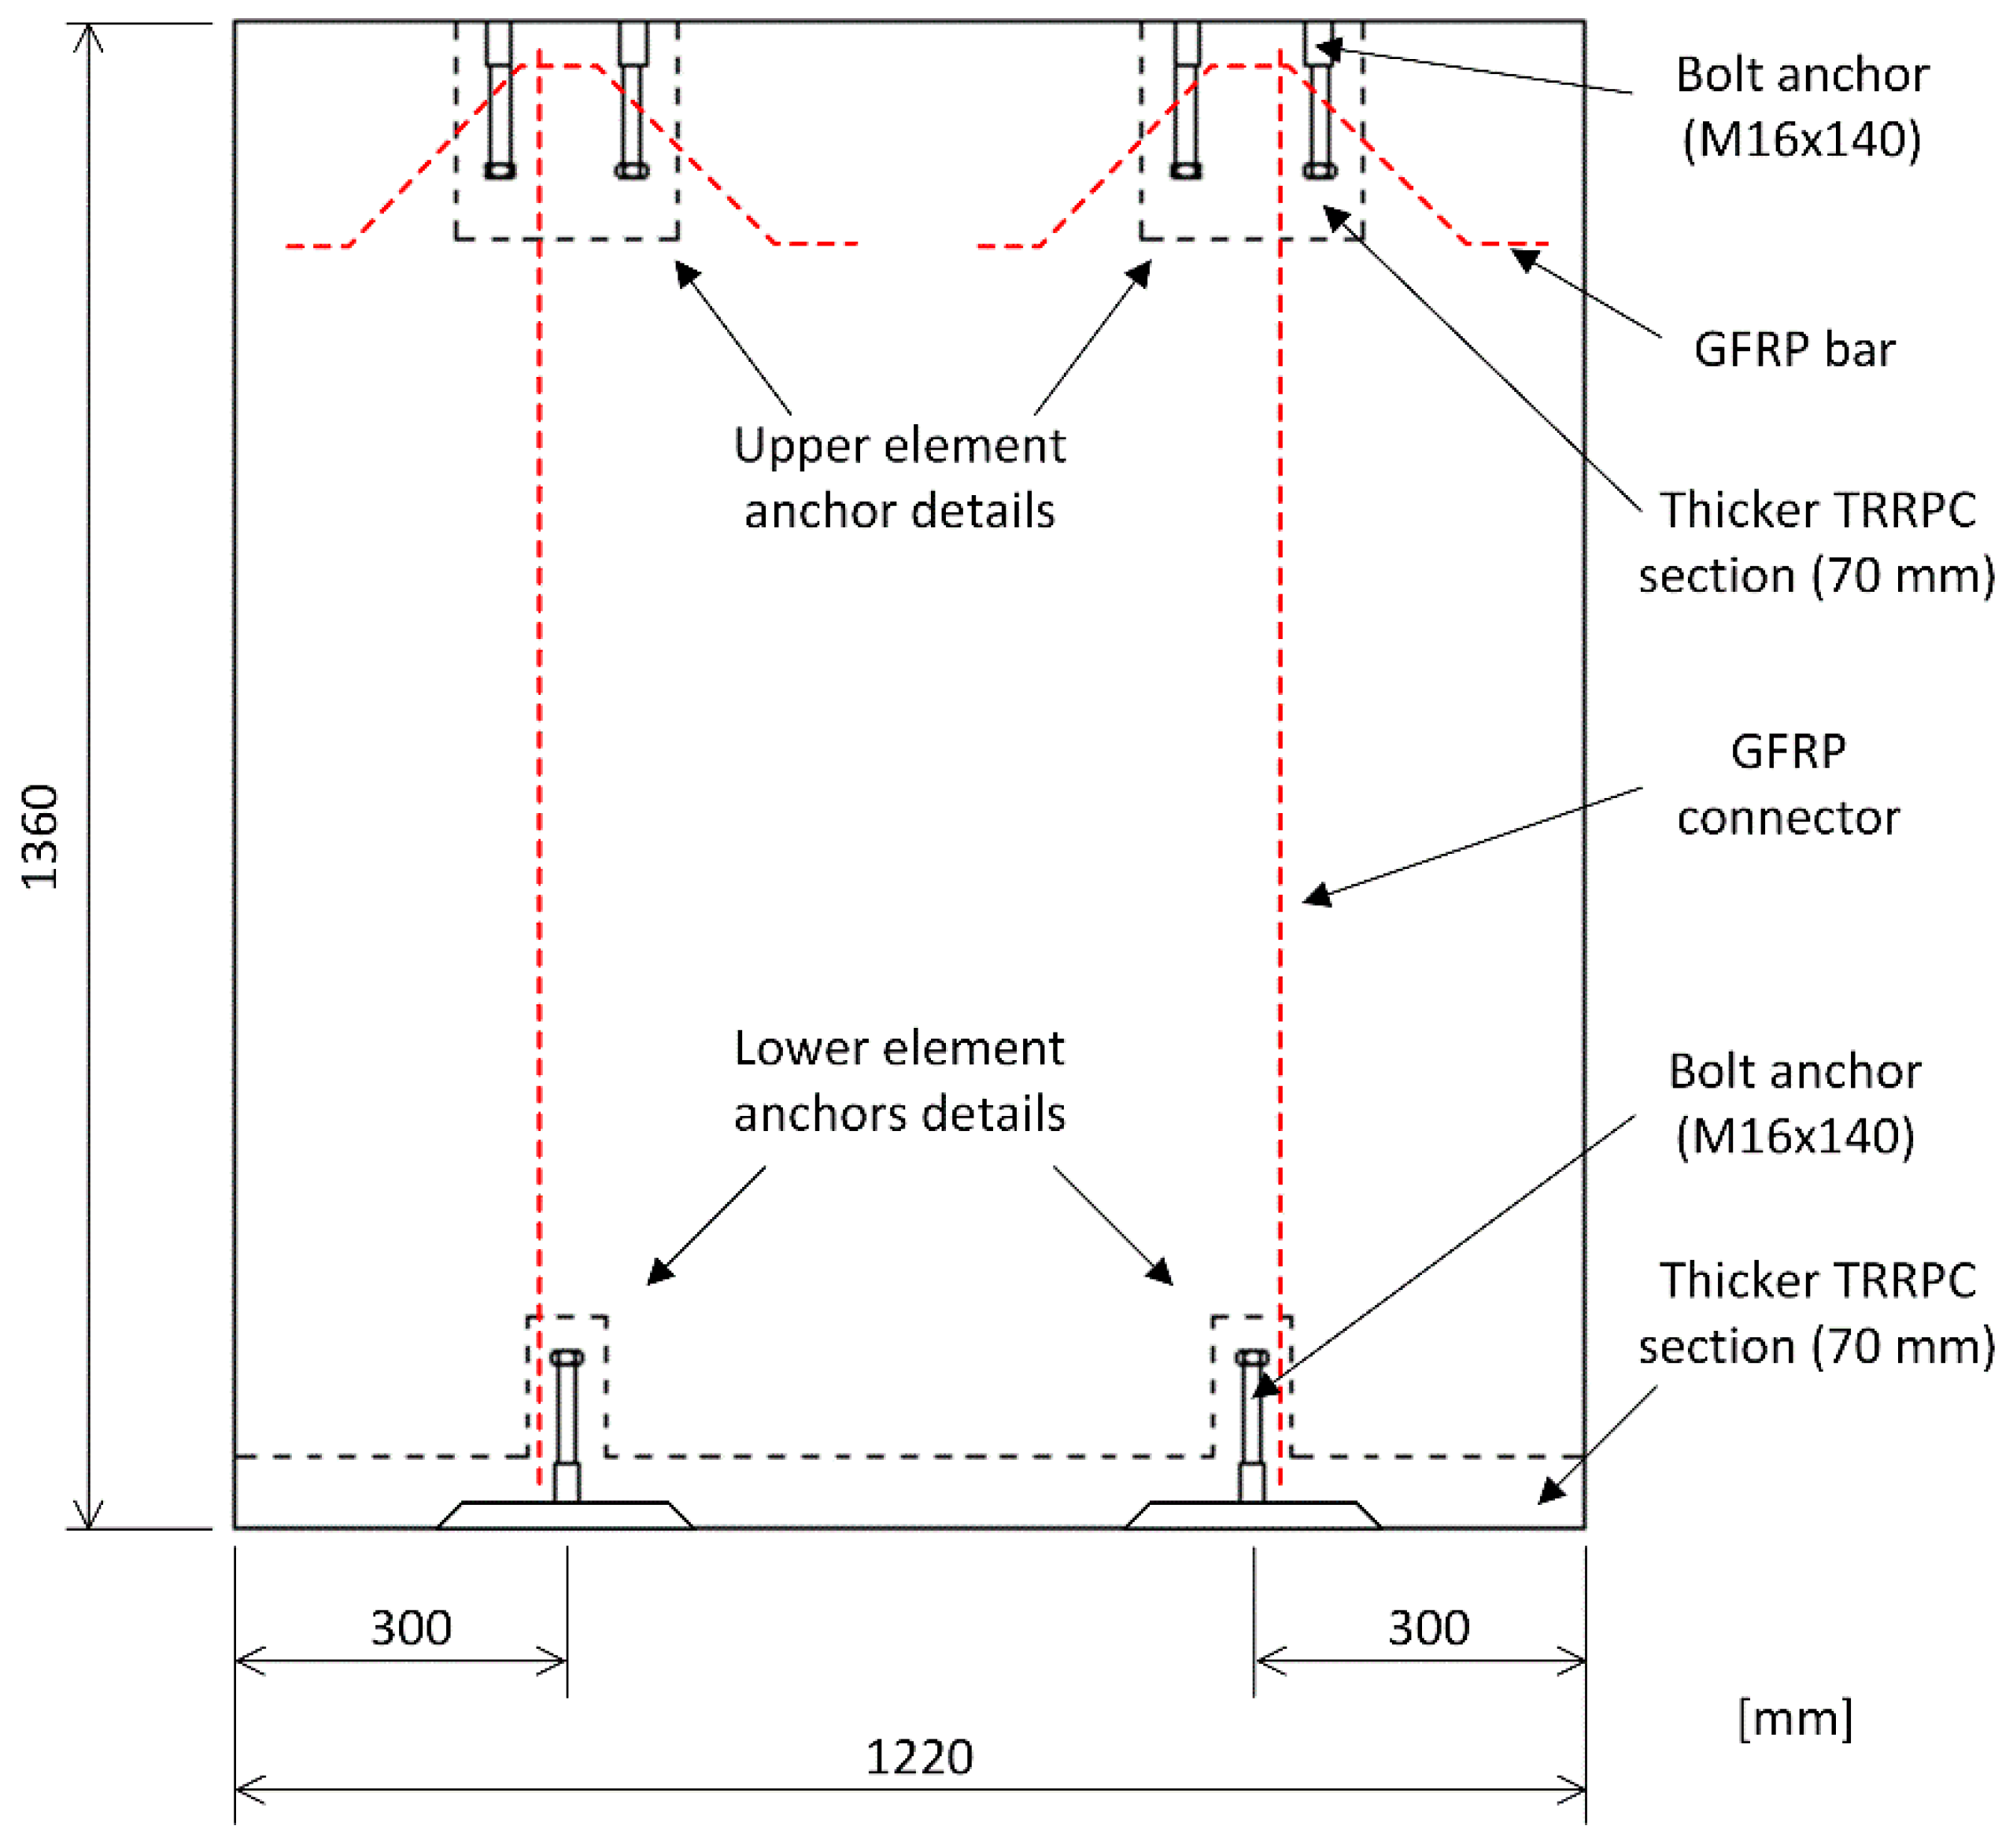
30]. The model consists of discrete parts describing TRRPC facings, FC insulation and GFRP connectors. The thicker section along the lower edge of the inner TRRPC facing and the local strengthening at the position of the two upper anchors were excluded in the model.
Based on the structural behavior observed in associated studies combining experimental and numerical results on a component level, as reported elsewhere [
22,
24], the shear transfer through the FC layer is assumed to be negligible. However, the FC takes on an important function of ensuring the transfer of normal compressive stress between facings, which stabilizes and maintains the spacing between the two facings. Accordingly, specific interaction conditions between the various layers were prescribed to replicate this observed behavior; see
Figure 9. Tie constraints were defined at the interface between the inner facing and FC, which assumes full interaction between these layers. In contrast, a frictionless contact condition was defined at the interface of the outer facing and FC.
The FC core was modelled using linear continuum shell elements with 8-nodes. FC was modelled based on linear elastic material laws. A density of 300 kg/m3 was defined along with an experimentally yielded value for the modulus of elasticity (10 MPa) and assumed Poisson’s ratio (0.1).
The TRRPC facings were modelled using the same type of shell elements as that applied for FC. The mechanical behavior of RPC was incorporated by means of the Concrete damaged plasticity model available in Abaqus with default field variables (dilation angle, eccentricity, etc.), refer to [
30]. This continuum damage model for concrete is based on plasticity and adopts two failure mechanisms: tensile cracking and compressive crushing of concrete. A linear elastic model was applied to describe the compressive behavior, since the compressive stresses in the facings were presumed to be minimal. As for uniaxial tension, the stress-strain response is linear elastic until reaching failure. A tensile strength of 3 MPa was defined, which corresponds to the experimentally measured tensile strength of a textile reinforced RPC facing, see
Section 3.1. Moreover, in tension, a linear softening behavior was defined for the phase after reaching the failure stress, assuming a fracture energy of 70 Nm/m
2. Experimental data, presented in
Table 1, was applied such that the modulus of elasticity in tension and compression corresponded to 50 GPa, and Poisson’s ratio to 0.22.
The carbon textile reinforcement grid was incorporated into the model as embedded reinforcement layers in the shell elements corresponding to the facings It is such that perfect bond between the reinforcement and the concrete is assumed. This interaction choice limits the crack formation from occurring within cracked regions according to the element size, as such individual localized cracking cannot be captured. The shell elements were however sized in accordance to observed crack distances of 40–50 mm, refer to [
22]. The behavior of the reinforcement up to failure was modelled using linear elastic material models. Experimental values (refer to
Section 3.1) were used for the nominal tensile strength (3433 MPa) and the modulus of elasticity (233 GPa). As a simplification, identical properties were assumed in the longitudinal and transversal directions of the textile grid. The cross-sectional area of each carbon grid layer was defined to be 85 mm
2/m.
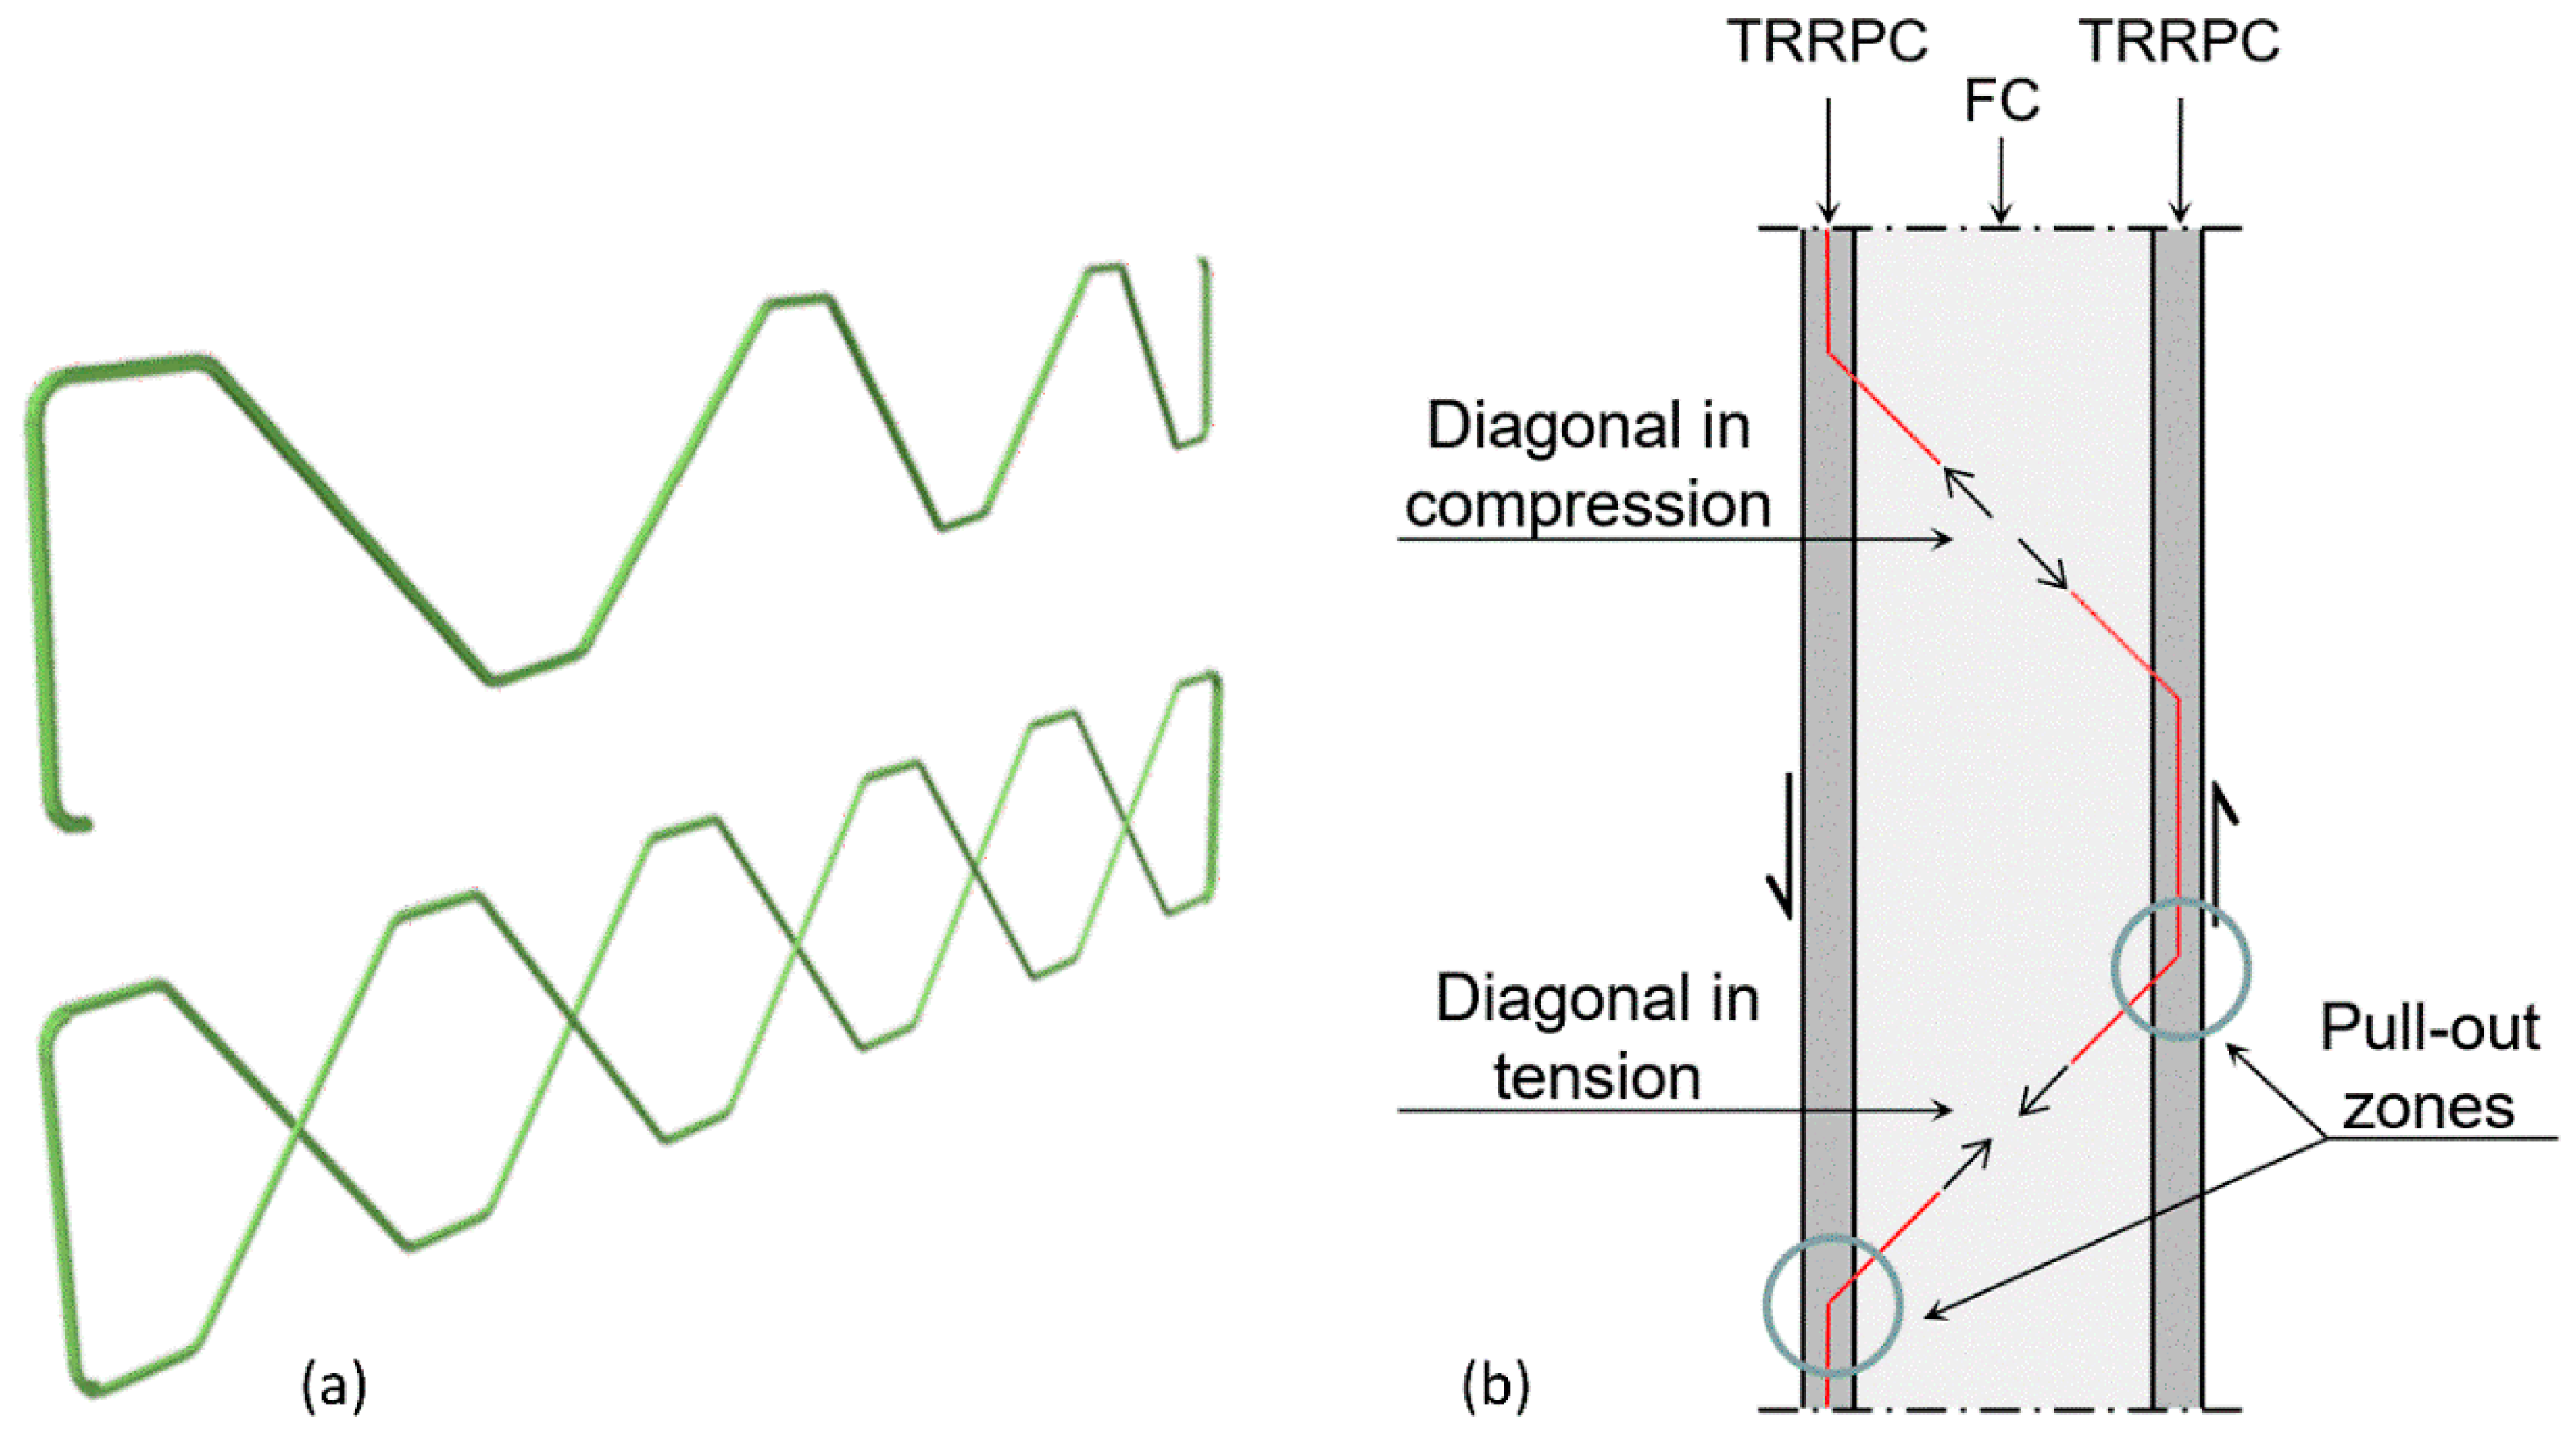
Linear beam elements were used to model the GFRP connectors [
30]. The connectors (nominal diameter of 6.1 mm), were attached to the center of the facings using tie constraints. On the conservative side, no interaction was defined at the connector-FC interface such that the connectors were free to deform, and a so-called initial connector imperfection was defined as 0.5 mm. Moreover, the GFRP bars were modelled according to linear elastic material behavior. The experimentally yielded material properties, i.e., modulus of elasticity (40.3 GPa) and nominal tensile strength (1012 MPa), applied in the model are listed in
Table 2. Since Poisson’s ratio was not tested, it was assumed to be 0.3 for the purpose of the analysis.
The Newton-Raphson iteration method was applied to find equilibrium within each load increment. Additionally, the feature named geometric nonlinear behavior was included in the analysis, i.e., second order theory related to large deformations. Accordingly, geometrical changes of, for instance the GFRP connectors, are included as a stiffening effect during the analysis (updating of stiffness matrix). Given this formulation, the GFRP bars can undergo large deformations in the model but the actual failure mode of the GFRP connectors is checked as a post-processing step with the experimentally yielded critical buckling load and pull-out capacity.
4.2.3. Full-Size Sandwich Element Model
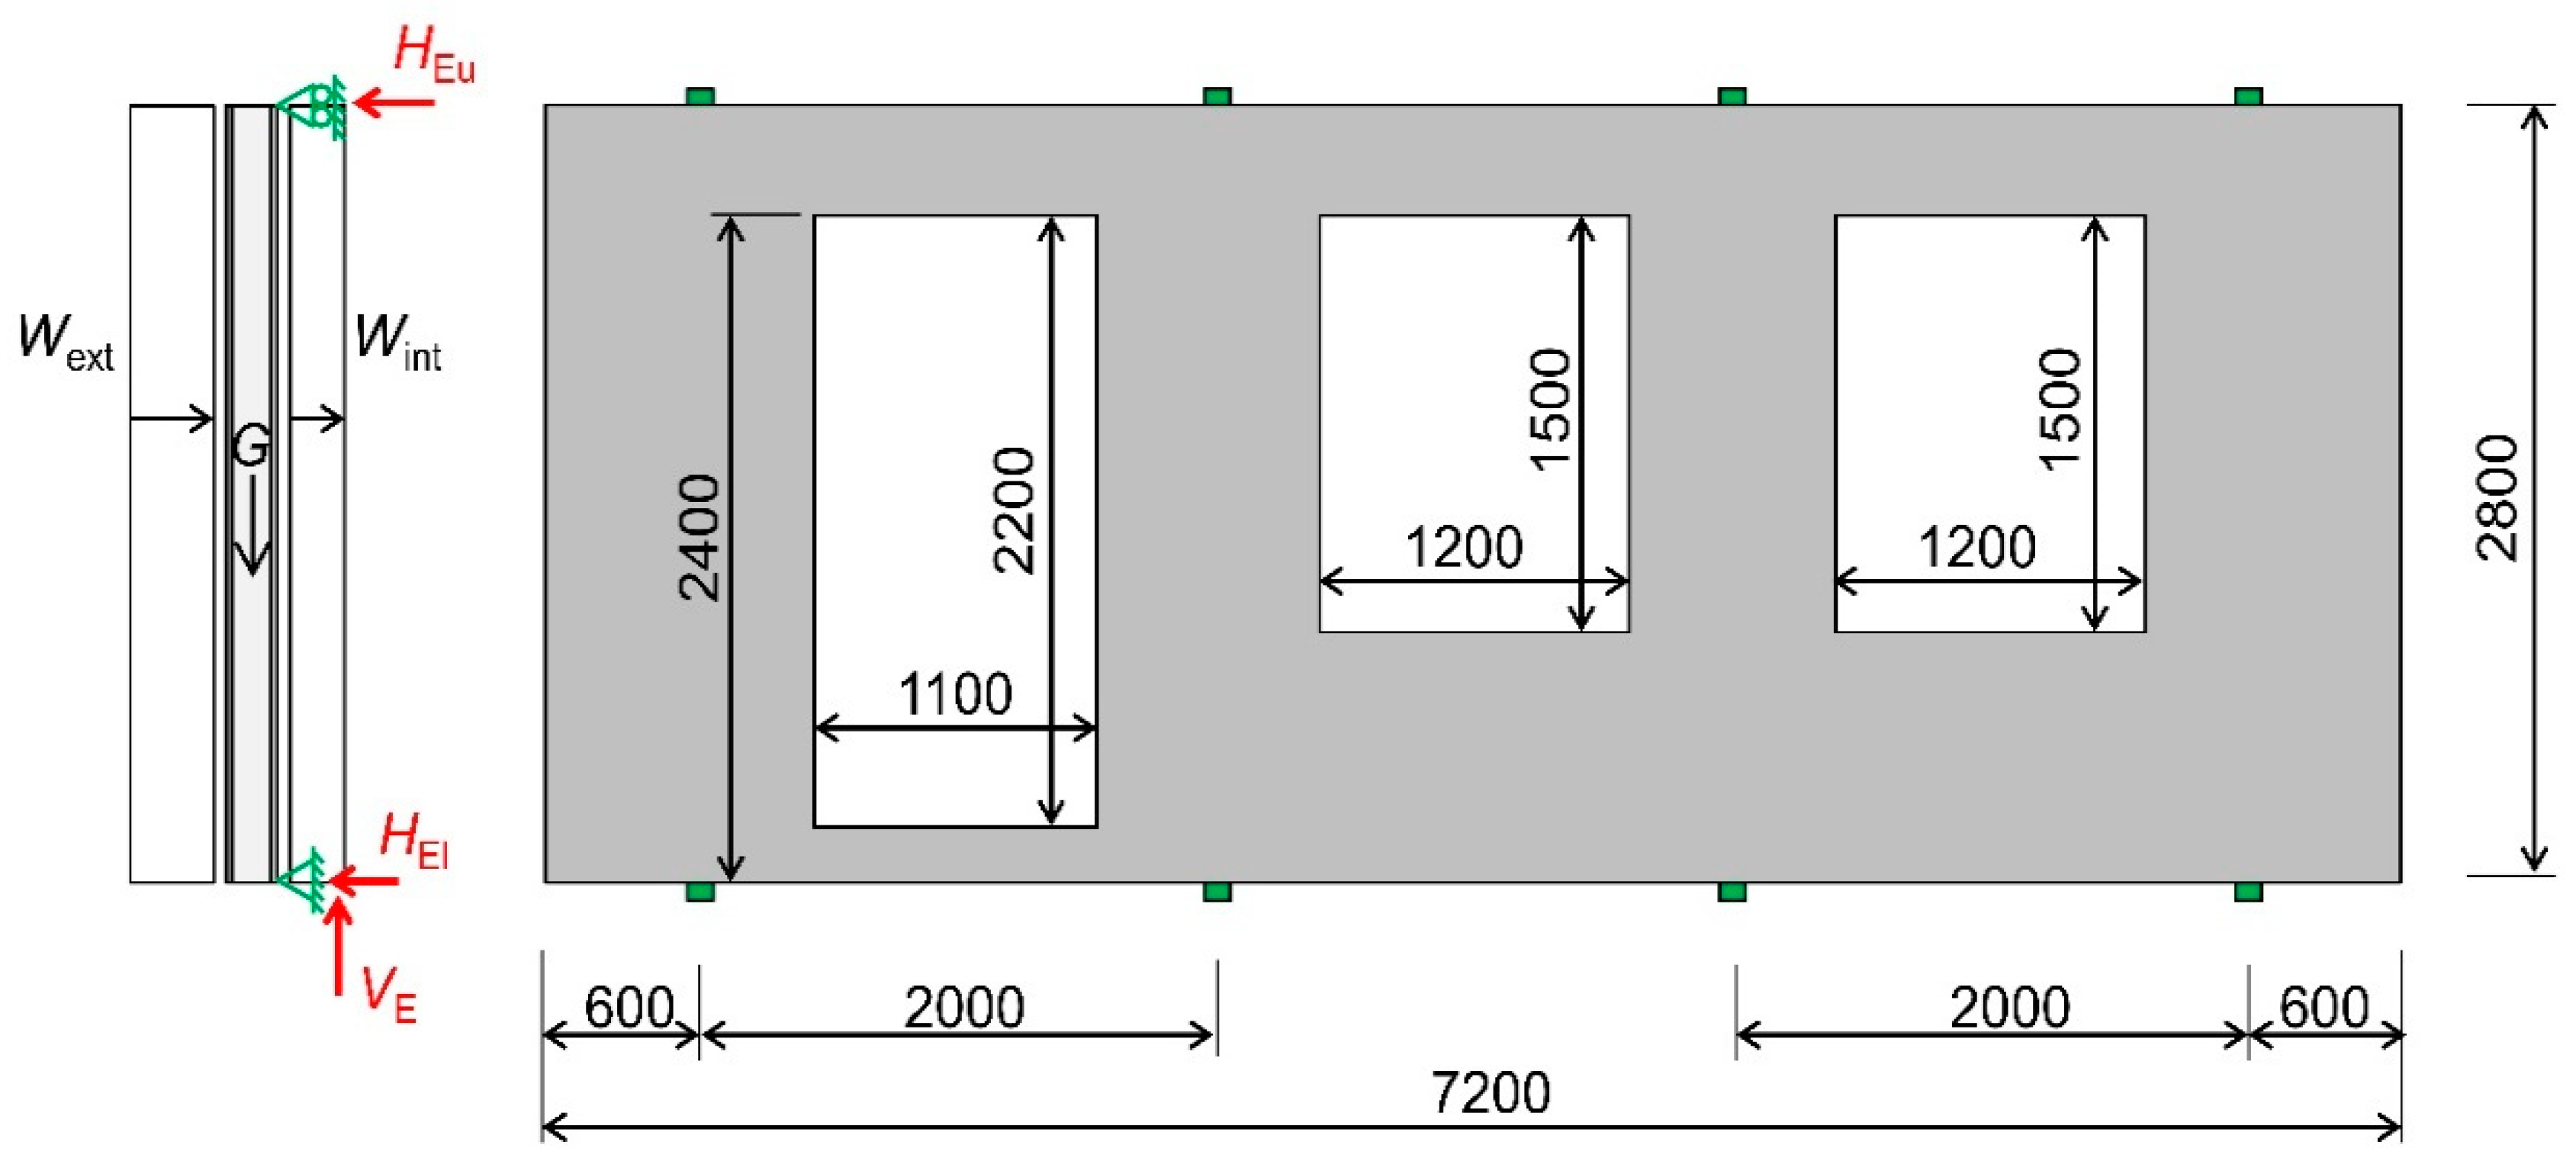
A concept building consisting of residential apartments was defined to calculate the loading schemes. The building is assumed to be situated on the west coast of Sweden. The building is prescribed dimensions of 20 × 72 × 12.4 m (height × length × width). This scenario is limited to a typical element design, as illustrated in
Figure 1, which consists of the materials and layer thicknesses, previously presented in
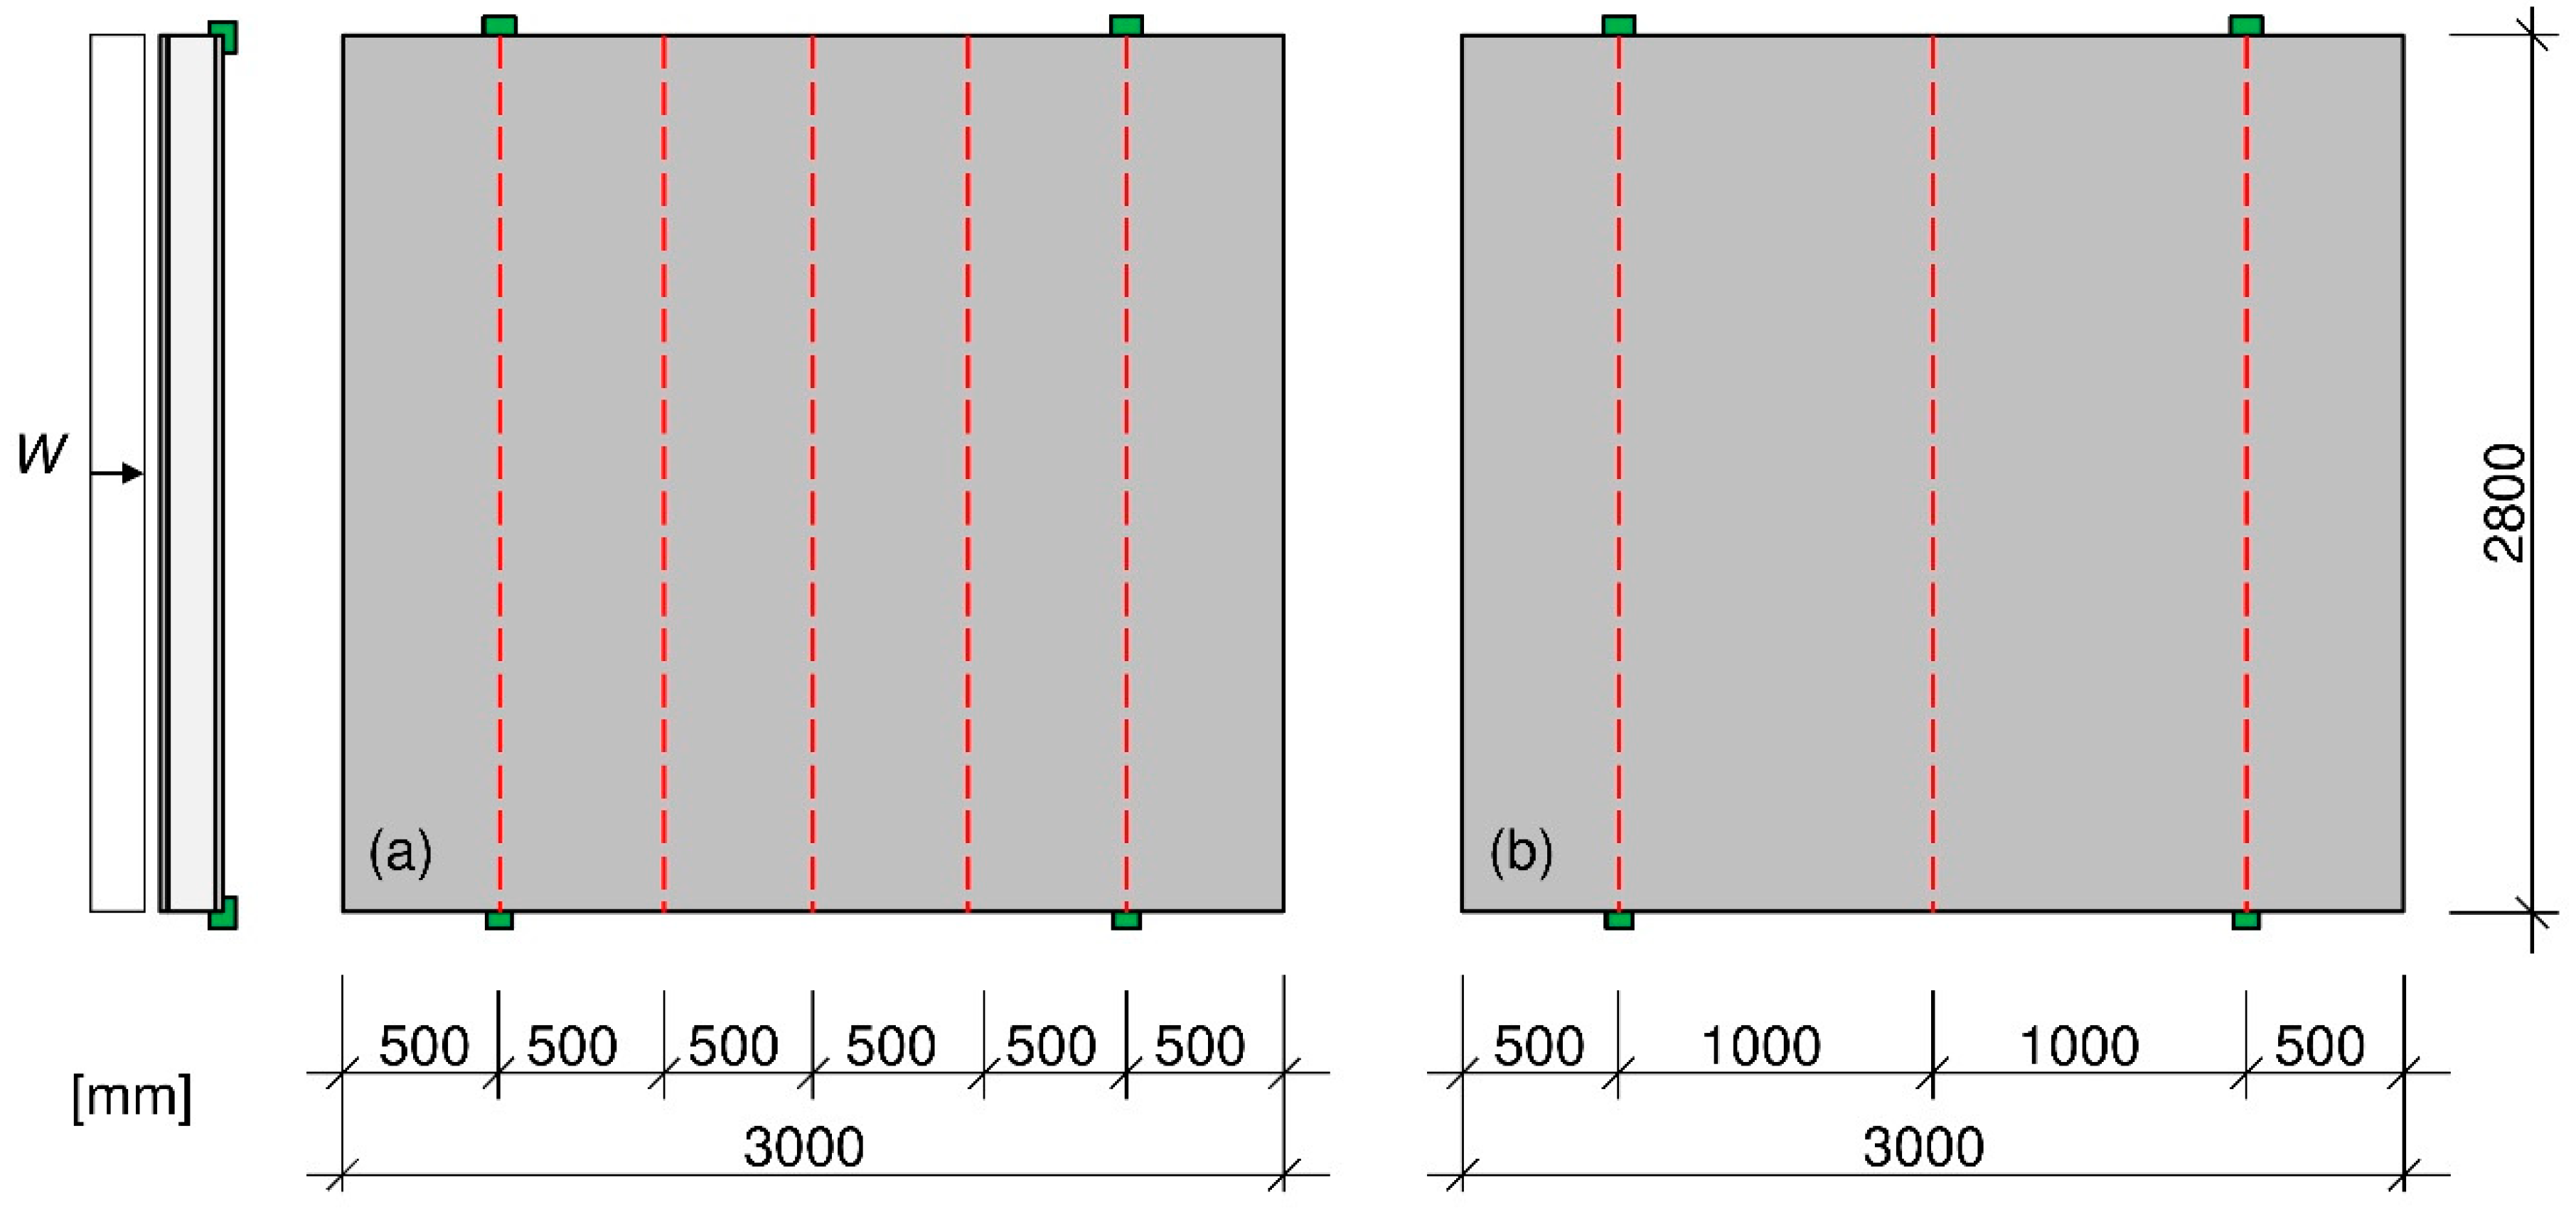
Section 3. However, in this model, the TRRPC facings were limited to one layer of carbon grid reinforcement placed in the center of the facing, as this was found to be a sufficient amount of reinforcement for the applied design wind loads. Moreover, the study of the full-size sandwich element was limited to consider only the double connector configuration developed in this project.
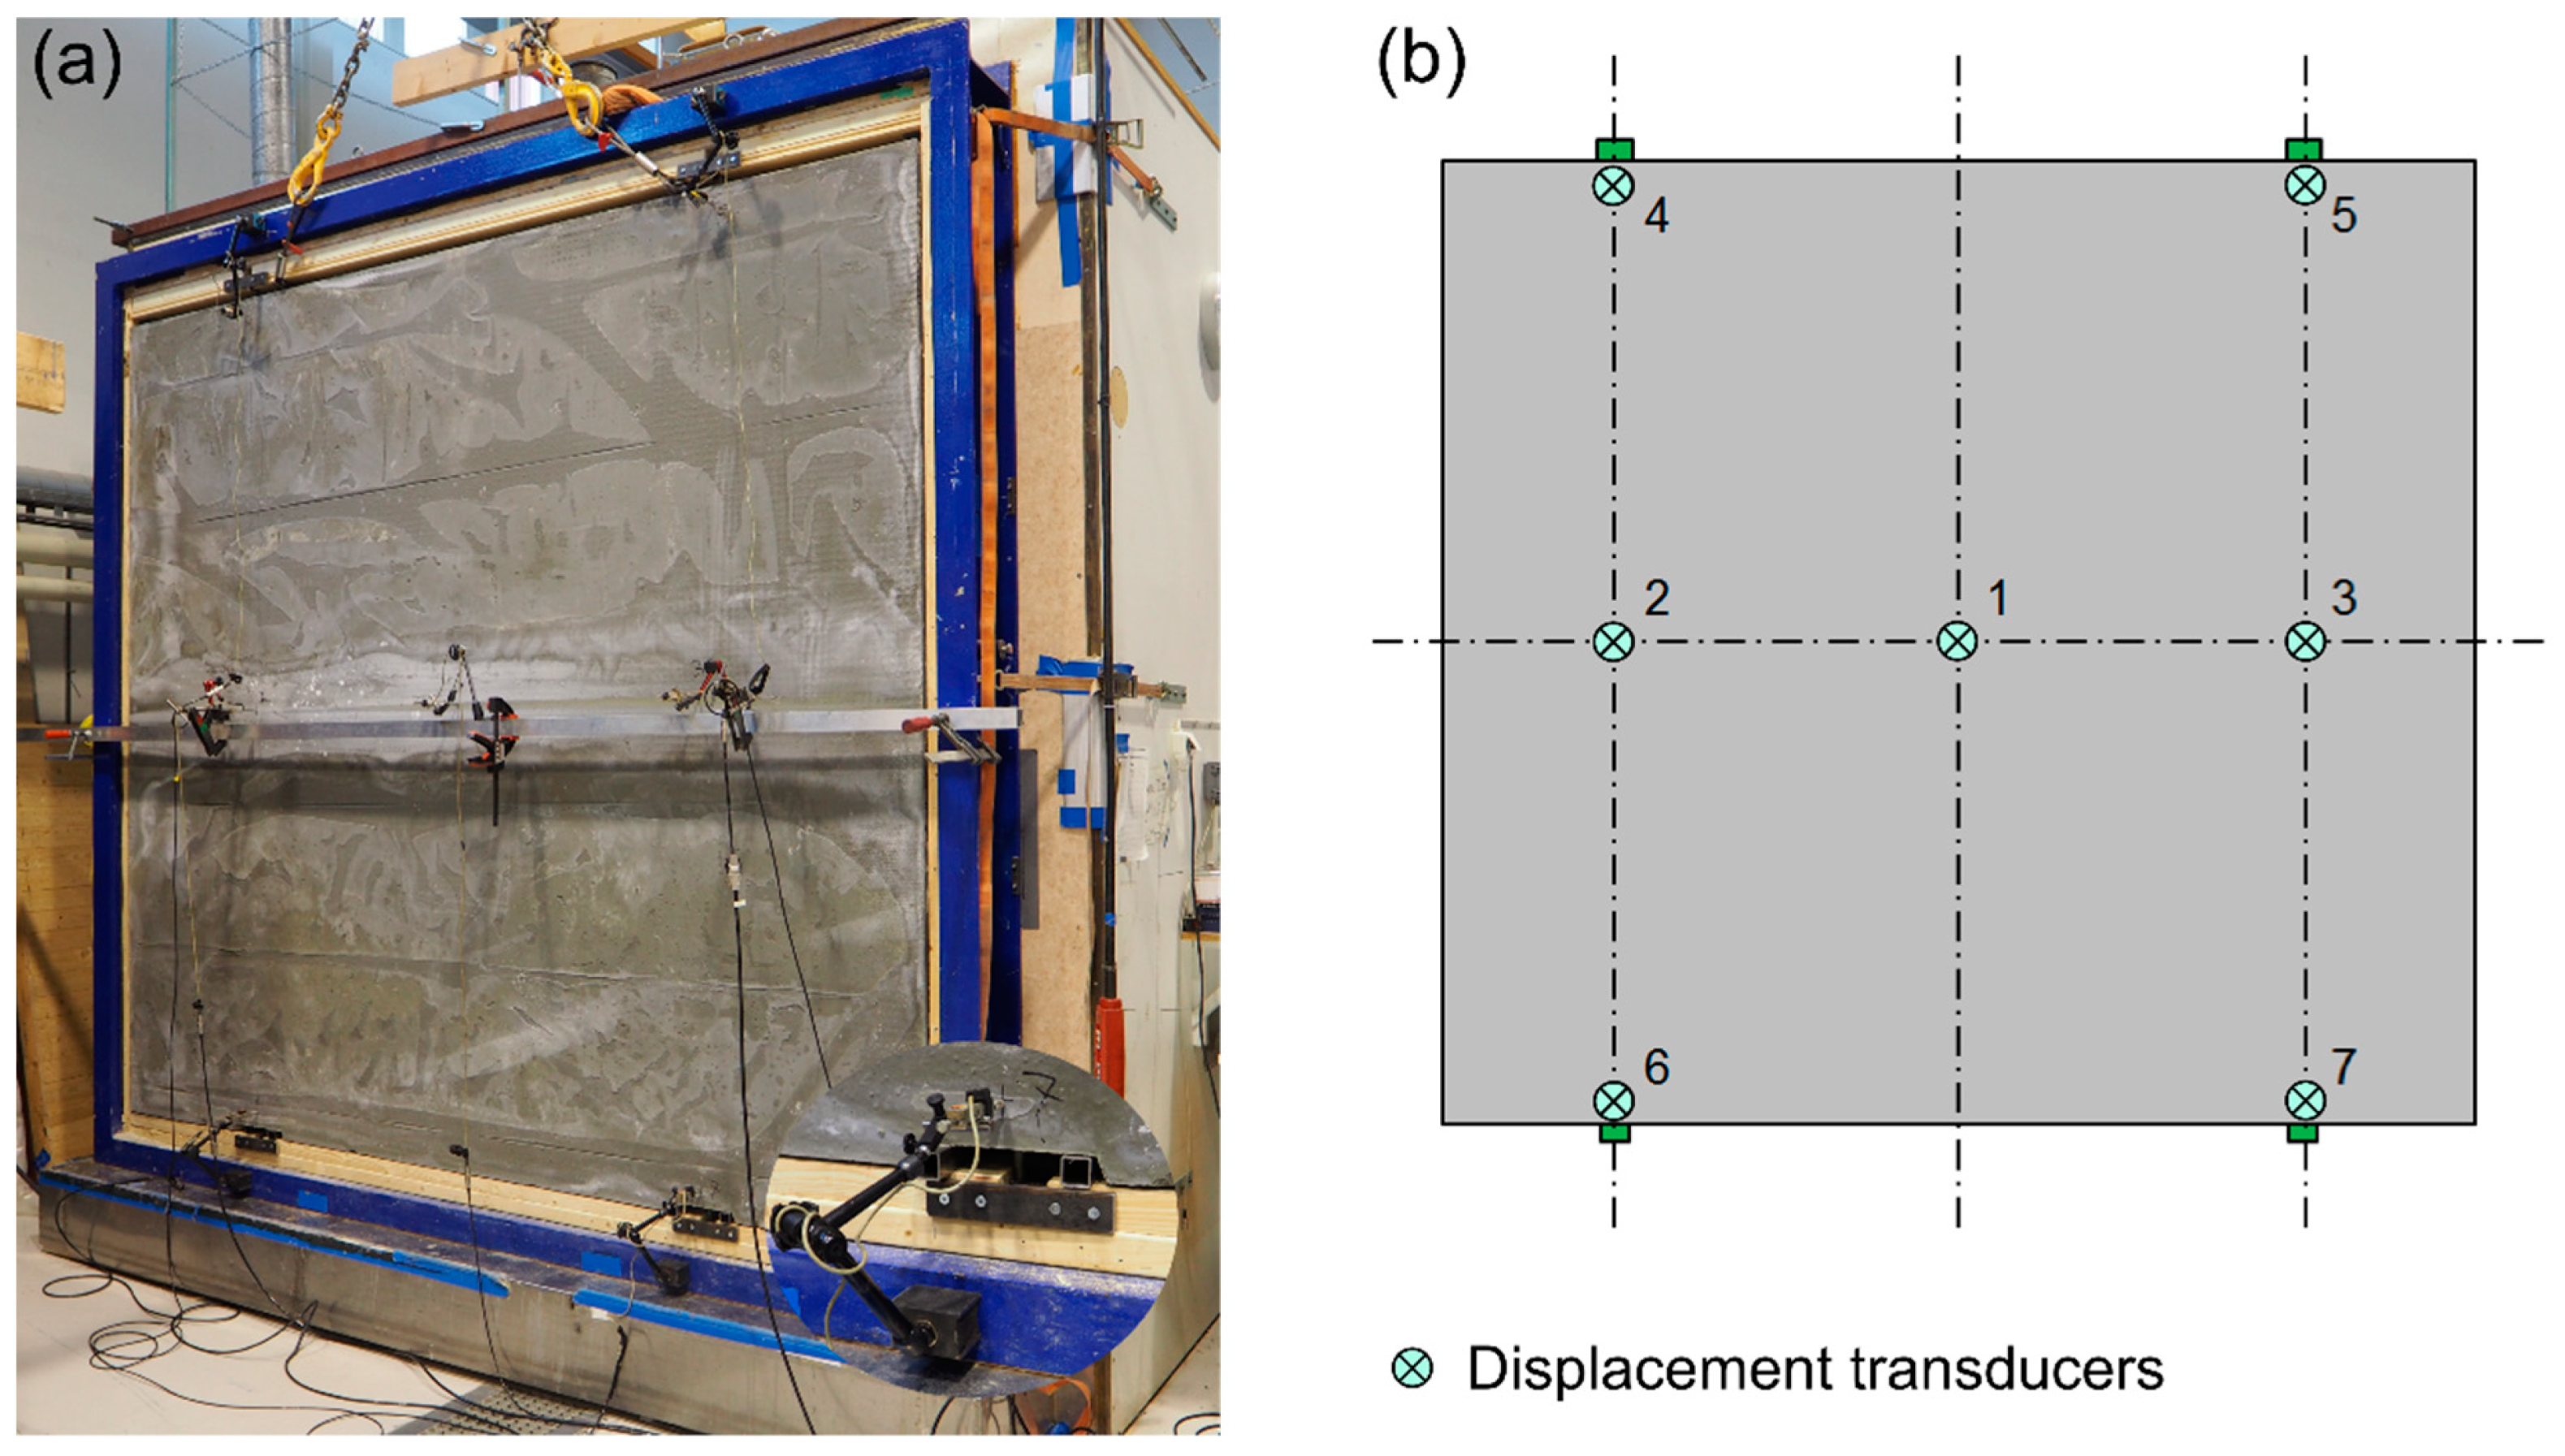
The boundary conditions were the same as for the wind load test model described in
Section 4.2.2, i.e., vertical (
V) and horizontal (
Hl) forces are transferred to the load bearing structure via the lower anchor points, while the horizontal (
Hu) force is transferred by the upper anchor points.
The structural performance of the façade element was verified according to the limit state principle of EN 1990 [
31]. Typically, two types of loads are included in normal design situations: vertical permanent loads from the facing’s self-weight (
G) and variable horizontal loads from wind (
W); see
Figure 1. The wind produces wind actions on the external (
Wext) and internal (
Wint) surfaces according to EN 1991-1-4 [
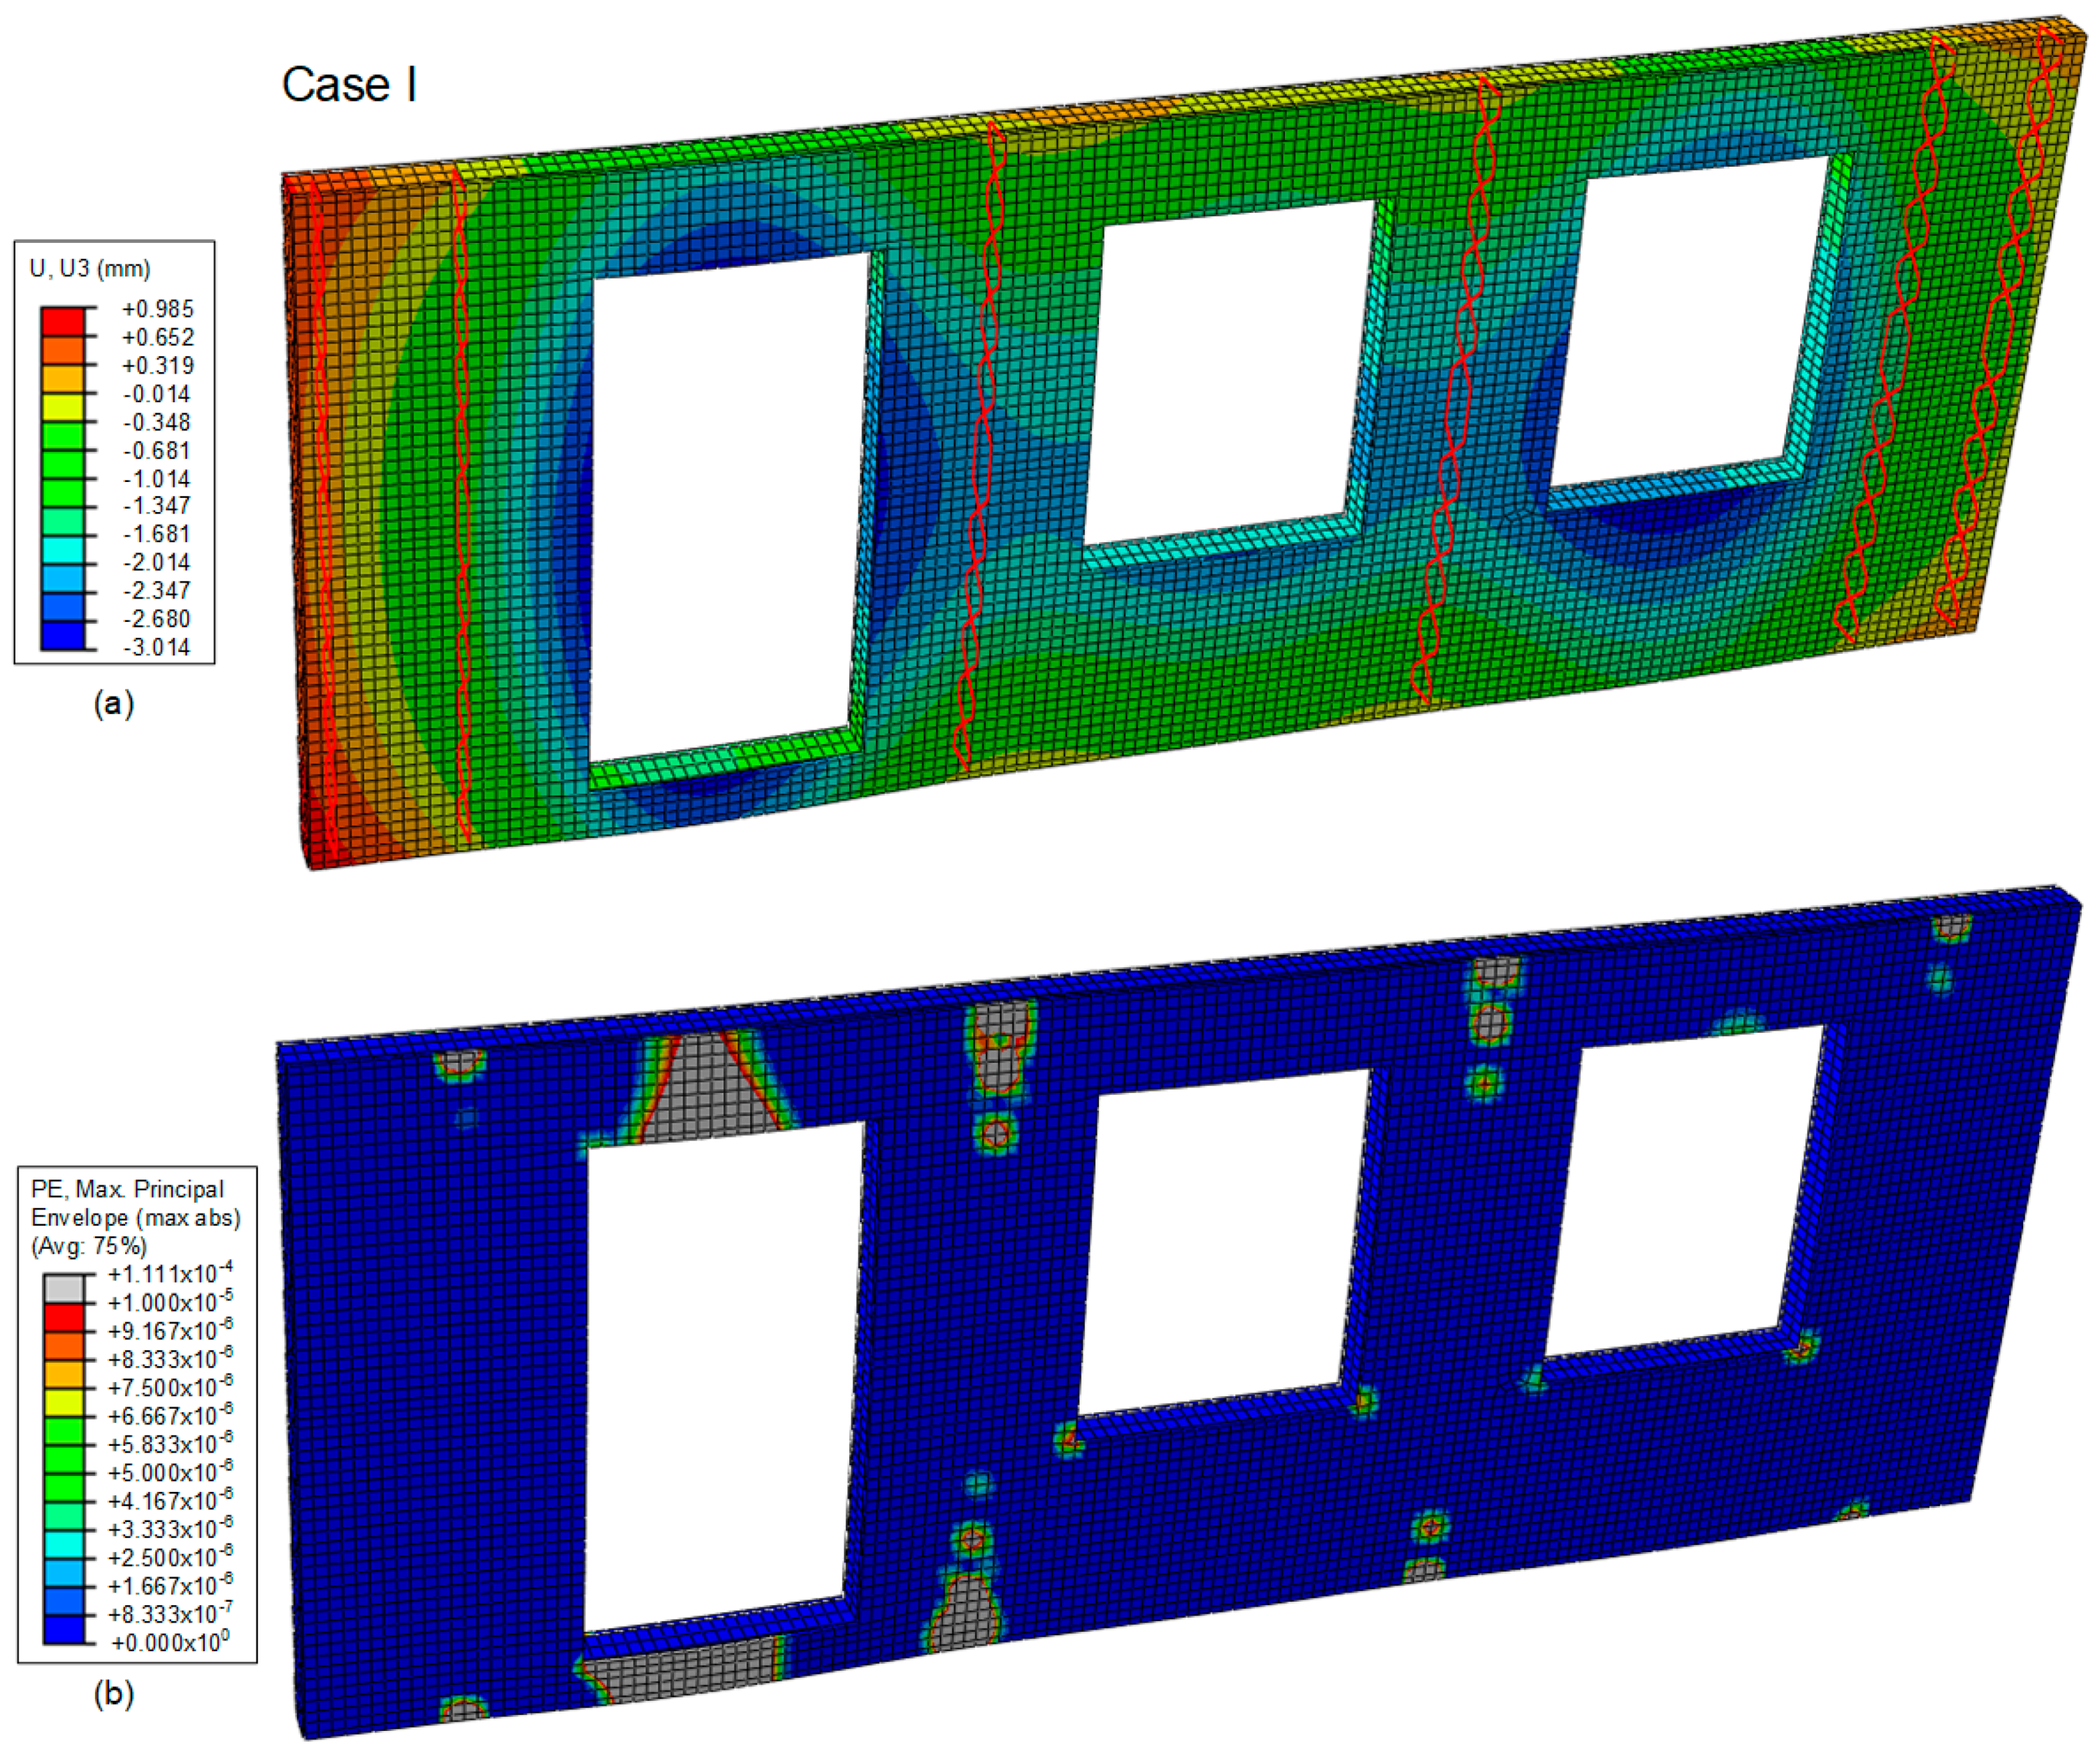
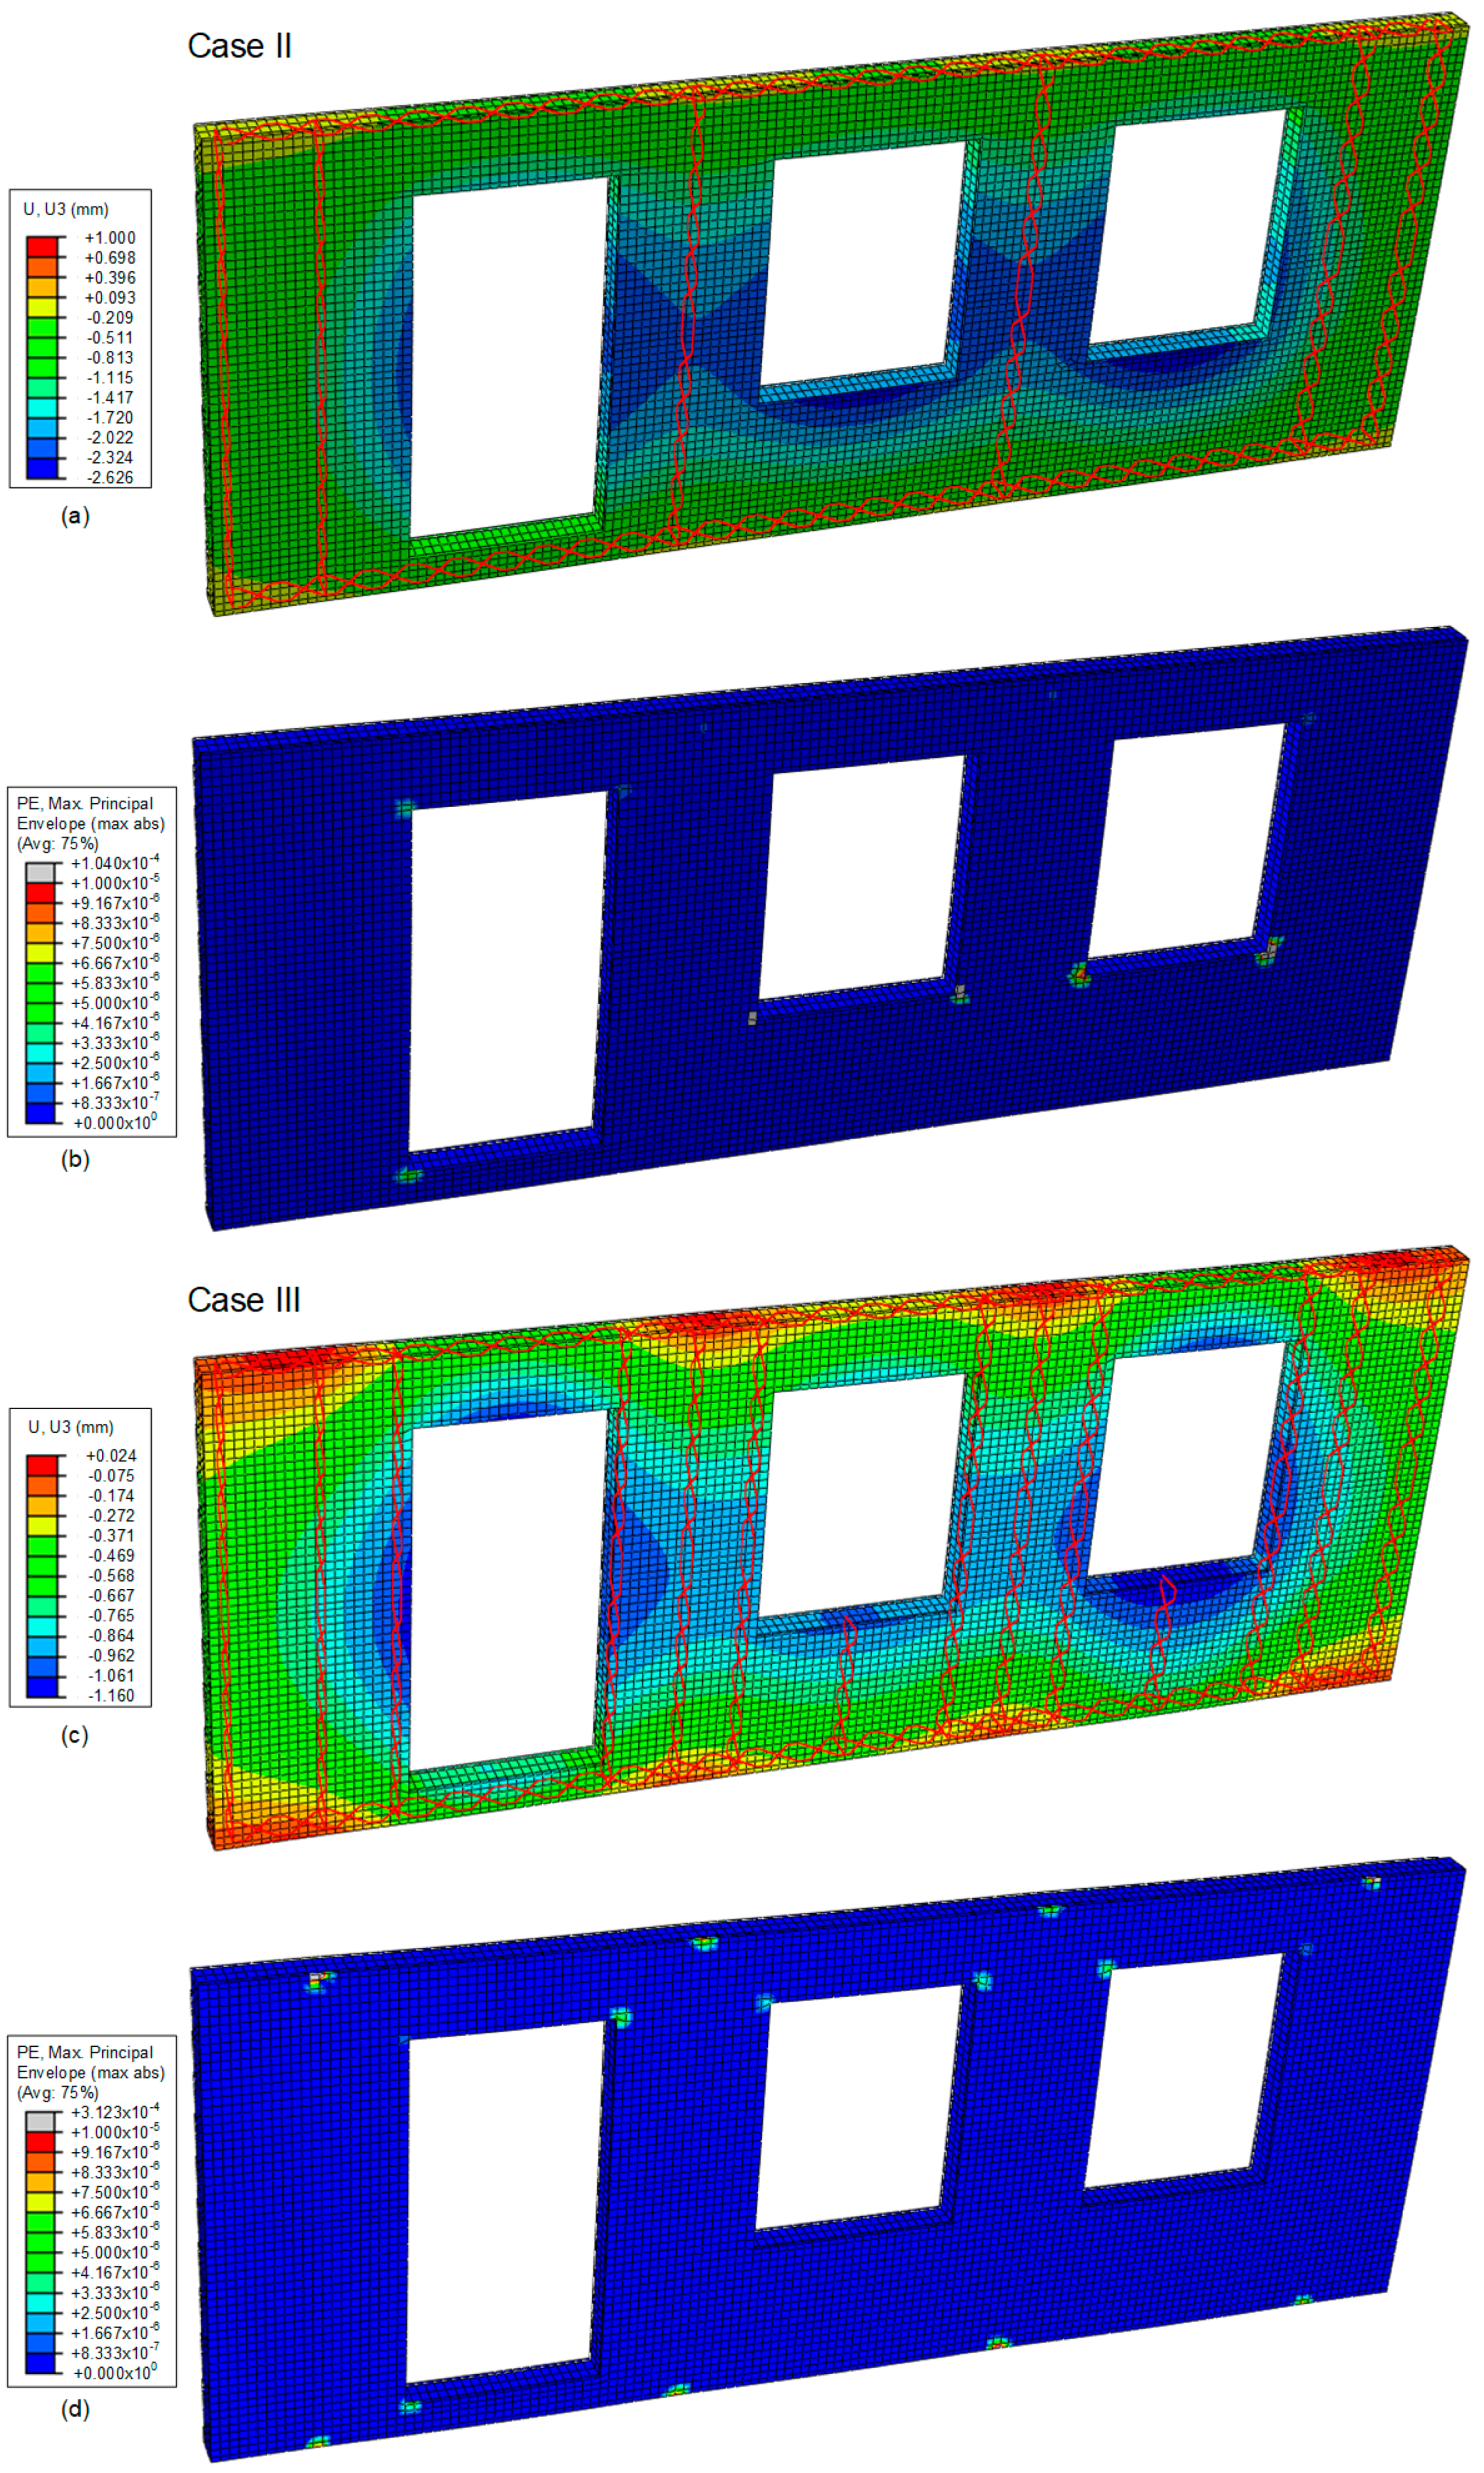
32]. Three load cases (
LC) are thus investigated for the ultimate limit state (ULS) and the serviceability limit state (SLS). In
LC1, the facing’s external surface is under pressure, while the internal surface is under suction. In
LC2, the external facing of the sandwich element is loaded in suction, while the internal layer is loaded in pressure. As for
LC3, the external and internal facings are exposed to wind suction. The considered load combinations are stated in Equation (1) for SLS and in Equation (2) for ULS:
These load cases correspond to different wind directions to which the building could be exposed. The wind loads, given in
Table 3, are calculated based on a concept building situated in Gothenburg (basic wind velocity
vb = 25 m/s) in terrain category IV, which is defined as an area in which at least 15% of the terrain surface is covered by buildings with an average height greater than 15 m. Furthermore, the presented numbers correspond to the most exposed parts of the building (worst case). The external and internal wind load acting on the doors and windows are assumed to act on the edges of the openings at the outer facing.
In the developed model, the sandwich element was first loaded by the self-weight and the wind load actions up to the SLS. Thereafter, the additional self-weight and wind load actions corresponding to the ULS were applied. Finally, the wind load actions were increased further until failure of the element, if not reached at the ULS.
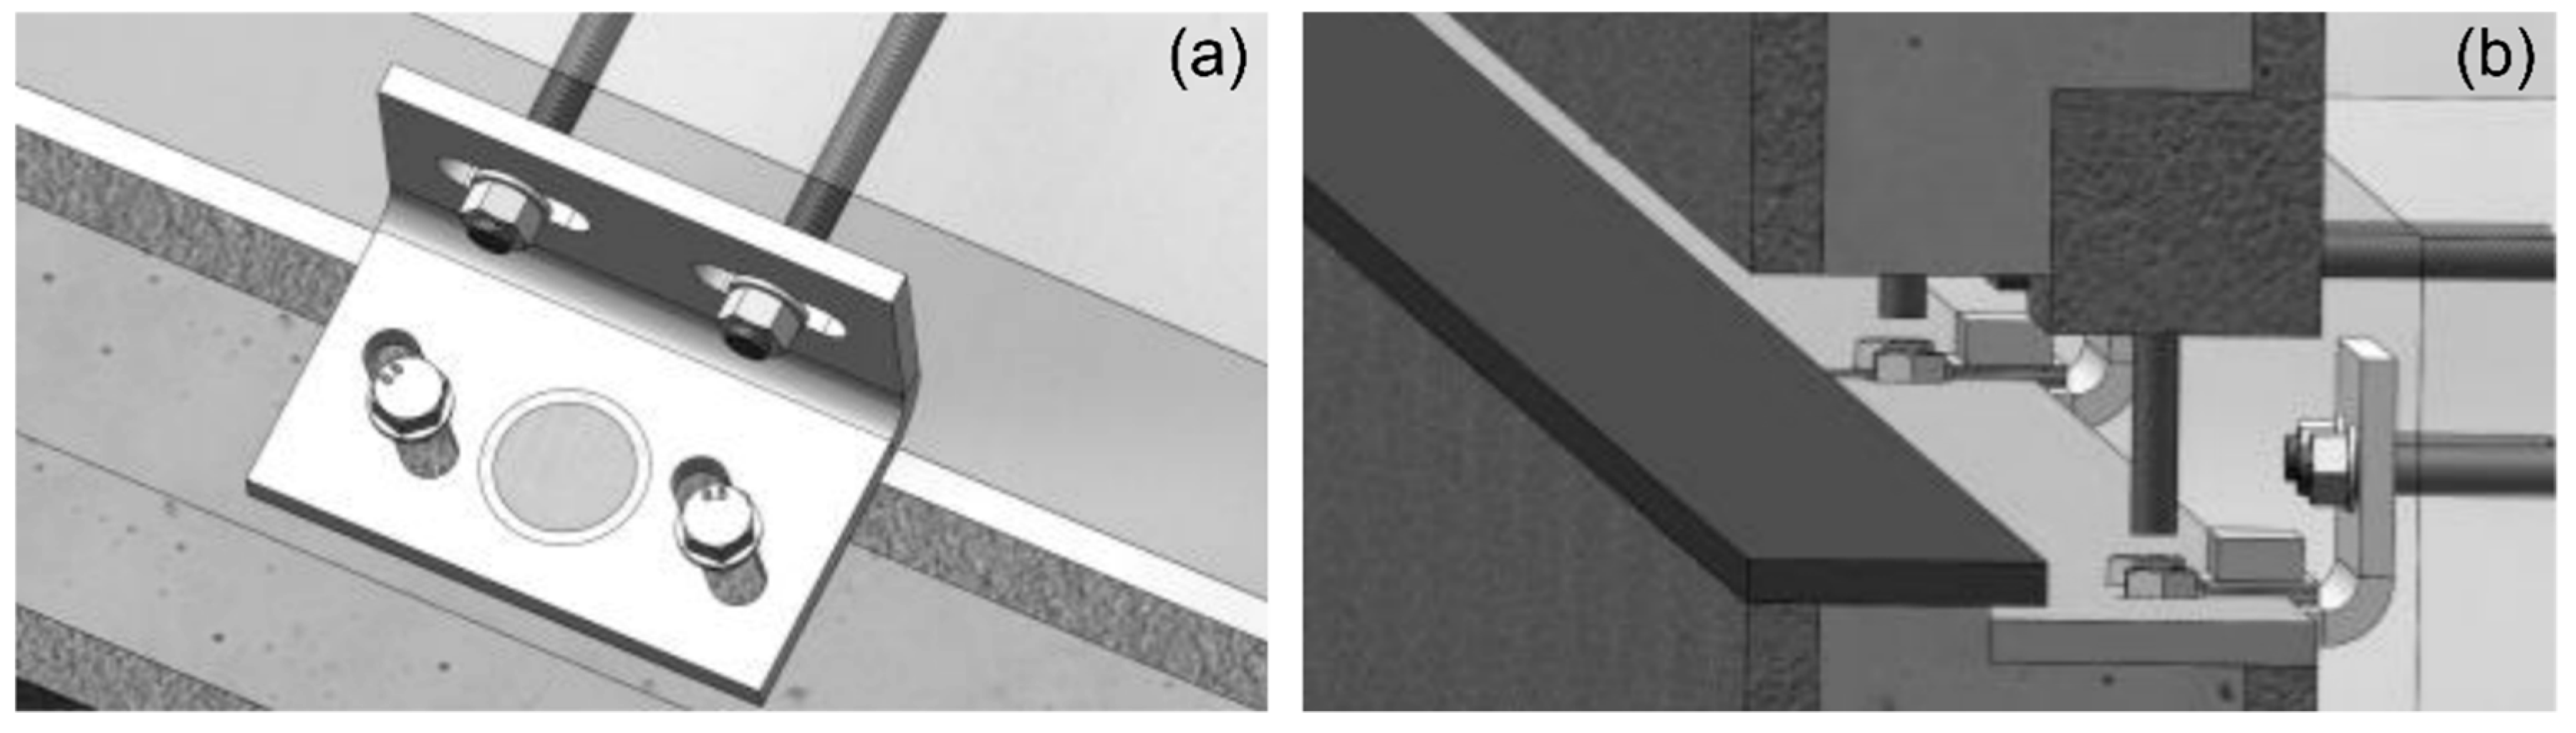
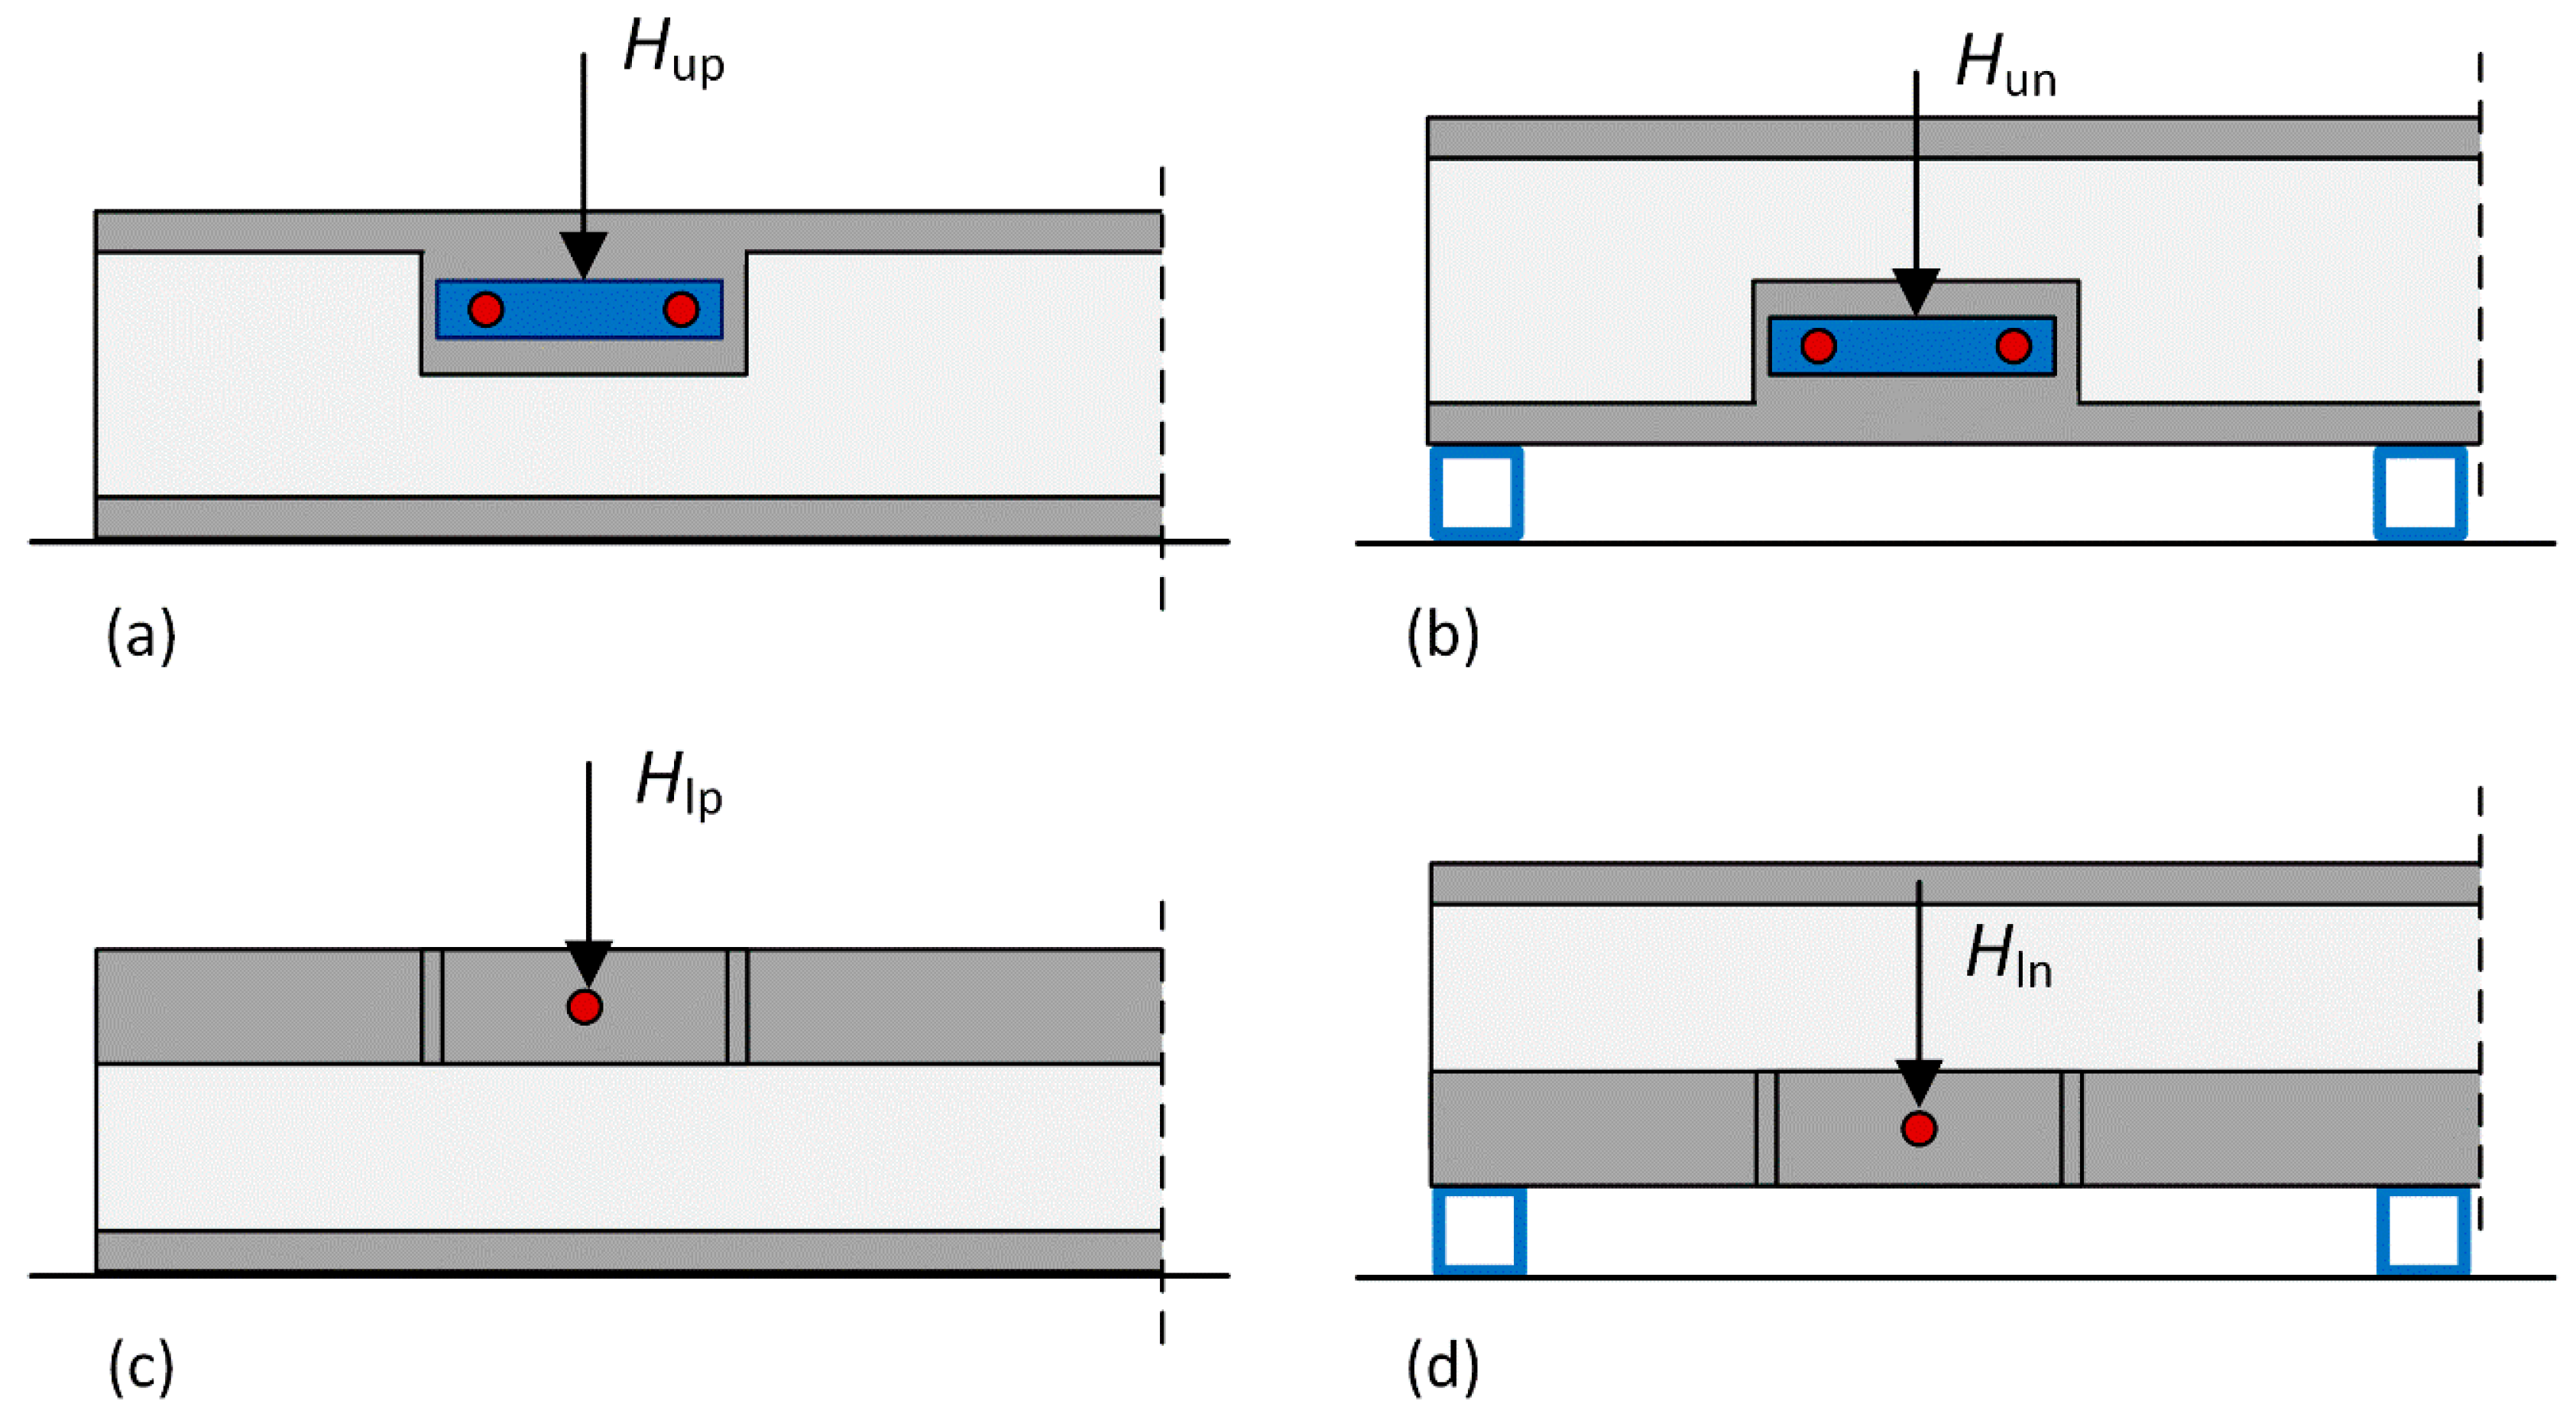
Verification at the ULS corresponds to the failure of the elements and related to human safety. For the sandwich element, this mainly concerns checking for connector failure, connector pull-out failure, textile grid failure and anchor failure. Concerning anchor failure, it should be verified that the horizontal reaction force, i.e., shear load at the anchor, at the different anchor positions and load combinations, are smaller or equal to the corresponding design shear load capacity according to Equation (3). The performance of the anchors was experimentally investigated according to that given in
Section 4.1.1 and the design shear load capacities of the upper (
HRup,d,
HRun,d) and lower (
HRlp,d,
HRln,d) anchors summarized in
Table 4 in
Section 5.1.
Verification at the SLS, representing a lower load level, usually relates to appearance, functioning and comfort of occupants, e.g., deflections and cracking. According to EN 1992-1-1 [
33], the extent of cracking shall be limited in order to ensure the adequate functionality or durability of the structure, as well as to safeguard an aesthetically pleasing surface. The requirements of maximum crack width are normally only valid for steel reinforced concrete structures. When carbon textile reinforcement is used, corrosion is not a concerning issue because the grids are designed to be highly durable. By comparing between different codes given in fib bulletin 40 [
34], the crack width limits are less restricted for FRP reinforced concrete. However, the knowledge is rather scarce, and it is stated that in absence of information the limitations for steel reinforced concrete could be adopted also for FRP reinforced concrete. For the lowest exposure classes given in [
33], the crack width has no influence on durability and the given crack width limit of 0.4 mm is just set to guarantee acceptable appearance. However, crack widths can also be controlled to satisfy specific aesthetic requirements. As stated in ACI 533R-11 [
35], the aesthetic effect of a crack in a facing is correlated to the surface’s texture. For smooth surfaces, e.g., cast-in-place concrete, and coarse textured surfaces, e.g., exposed aggregate concrete, crack widths limited by structural demands are considered aesthetic. Concerning high quality smooth surfaces, it is recommended that cracking be limited to 0.13 mm for interior facings.
According to [
33], the function or appearance of a member or structure should not be negatively impacted by deformation. In general, the limit of the design deflection is specified to either
L/250 or
L/500, where
L is the effective span of the element. In [
35], deflection limits are given specifically for non-load bearing precast wall elements, saying, deflection of any point on the facing measured from its original position should not exceed
L/480. For the element in this study, the more restrictive limit according to [
33] corresponds to a maximum deflection of 2800/500 = 5.6 mm.


