Article

Adaptive Refinements of Pitch Tracking and HNR Estimation within a Vocoder for Statistical Parametric Speech Synthesis

by
Mohammed Salah Al-Radhi
1,*,
Tamás Gábor Csapó
1,2 and
Géza Németh
1
1
Department of Telecommunications and Media Informatics, Budapest University of Technology and Economics, 1117 Budapest, Hungary
2
MTA-ELTE Lendület Lingual Articulation Research Group, Hungarian Academy of Sciences, 1088 Budapest, Hungary
*
Author to whom correspondence should be addressed.
Appl. Sci. 2019, 9(12), 2460; https://doi.org/10.3390/app9122460
Submission received: 8 May 2019 / Revised: 12 June 2019 / Accepted: 13 June 2019 / Published: 16 June 2019
(This article belongs to the Special Issue Sound and Music Computing -- Music and Interaction)

Abstract

:

Featured Application

The work discussed herein provides a reference for selecting appropriate techniques to optimize and improve the performance of current fundamental frequency estimation methods-based text-to-speech.

Abstract

Recent studies in text-to-speech synthesis have shown the benefit of using a continuous pitch estimate; one that interpolates fundamental frequency (F0) even when voicing is not present. However, continuous F0 is still sensitive to additive noise in speech signals and suffers from short-term errors (when it changes rather quickly over time). To alleviate these issues, three adaptive techniques have been developed in this article for achieving a robust and accurate F0: (1) we weight the pitch estimates with state noise covariance using adaptive Kalman-filter framework, (2) we iteratively apply a time axis warping on the input frame signal, (3) we optimize all F0 candidates using an instantaneous-frequency-based approach. Additionally, the second goal of this study is to introduce an extension of a novel continuous-based speech synthesis system (i.e., in which all parameters are continuous). We propose adding a new excitation parameter named Harmonic-to-Noise Ratio (HNR) to the voiced and unvoiced components to indicate the degree of voicing in the excitation and to reduce the influence of buzziness caused by the vocoder. Results based on objective and perceptual tests demonstrate that the voice built with the proposed framework gives state-of-the-art speech synthesis performance while outperforming the previous baseline.

1. Introduction

Parametric representation of speech often implies a fundamental frequency (also referred to as F0 or pitch) contour as a part of the text-to-speech (TTS) synthesis. During voiced speech, such as vowels, pitch values can be successfully estimated over a short time period (e.g., a speech frame of 25 ms). Pitch observations are continuous and usually range from 60 Hz to 300 Hz for human speech [1]. However, in unvoiced speech, such as unvoiced consonants, the long-term spectrum of turbulent airflow tends to be a weak function of frequency [2], which suggests that the identification of a single reliable F0 value in unvoiced regions is not possible. Thus, a commonly accepted assumption is that F0 values in unvoiced speech frames are undefined and must instead be represented by a sequence of discrete unvoiced symbols [3]. In other words, F0 is a discontinuous function of time and voicing classification is made through pitch estimation.
In standard TTS with the mixed-excitation system, frames classified as voiced will be excited with a combination of glottal pulses and noise while frames classified as unvoiced will just be excited with noise. Consequently, any hard voiced/unvoiced (V/UV) classification gives two categories of errors: false voiced, i.e., setting frames to voiced that should be unvoiced, and false unvoiced, i.e., setting frames to unvoiced that are voiced. Perceptually, the synthesized speech with false voiced produces buzziness, mostly in the higher frequencies, while false unvoiced introduces a hoarse quality in the speech signal. Generally, both of them sound unnatural [4].
One solution is to directly model the discontinuous F0 observation with multi-space probability distribution using hidden Markov models (MSD-HMM) [5]. However, MSD-HMM has some restrictions with dynamic features that cannot be easily calculated due to the discontinuity at the boundary between V/UV regions. Hence, separate streams are normally used to model static and dynamic features [6]. However, this also limits the model’s ability to correctly capture F0 trajectories. An alternative solution, random values generated from a probability density with a large variance have been used for unvoiced F0 observations [7], while setting all unvoiced F0 to be zero has been investigated in [8]. Once again, both of these techniques are inappropriate for the TTS system, since it would lead to a synthesis of random or meaningless F0 [9].
In recent years, there has been a rising trend of assuming that continuous F0 observations are similarly present in unvoiced regions, and there have been various modeling schemes along these lines. It was found in [3] that a continuous F0 creates more expressive F0 contours with HMM-based TTS than one based on the MSD-HMM system. Zhang et al. [10] introduced a new approach to improve piece-wise modeling of the continuous F0 trajectory with voicing strength and V/UV decision for HMM-based TTS. Garner et al. [9], whose baseline method is used in this study, proposed a simple continuous F0 tracker, where the measurement distribution is determined from the autocorrelation coefficients. This algorithm is better suited to the Bayesian pitch estimation of Nielsen et al. [11]. Tóth and Csapó [12] have shown that continuous F0 contour can be better approximated with HMM and deep neural network (DNN) than traditional discontinuous F0. In [13], an excitation model has been proposed which combines continuous F0 modeling with Maximum Voiced Frequency (MVF). This model has been shown to produce more natural synthesized speech for voiced sounds than traditional vocoders based on standard pitch tracking, whereas it was also found that there is a room for improvement in modeling unvoiced sounds.
Recently, Tsanas et al. [14] developed a robust method for adaptively weighting the estimates of F0 values using an adaptive Kalman filter framework, while Stoter et al. [15] proposed an F0 method by applying a time warp on the input speech signal in each step. Both of these approaches achieve significantly higher accuracy and smoother F0 trajectory on noisy and clean speech. Therefore, we propose here an improvement to the continuous F0 algorithm in terms of temporal resolution and accuracy by using adaptive the Kalman-filter, time-warping, and instantaneous-frequency approaches. We show its effectiveness with regard to the background noise using some comprehensive evaluation methods already existing in the literature.
Such a statistical framework is guided by the vocoder (which is also called speech analysis/synthesis system) to reproduce human speech. A vocoder is the most important component of various speech synthesis applications such as TTS synthesis [16], voice conversion [17], or singing synthesizers [18]. Although there are several different types of vocoders that use analysis/synthesis, they follow the same main strategy. The analysis stage is used to convert the speech waveform into a set of parameters, whereas in the synthesis stage, the entire parameter set is used to reconstruct the original speech signal. Hu et al. [19] presented an experimental comparison of the wide range of important vocoder types that had previously been invented. In general terms, we can group state-of-the art vocoder-based TTS into three categories. (a) Source-filter models: STRAIGHT [20] and mixed excitation [21]; (b) sinusoidal models: Harmonic plus Noise Model [22] and Ahocoder [23]; (c) end-to-end complex models: WaveNet-based waveform generation [24] and Tacotron [25]. Each model has the advantage of working reasonably well for a particular speaker, which makes them attractive to researchers. Although they offer speech quality comparable to natural human speech, each of them has several drawbacks that we should take into consideration. STRAIGHT synthesis is very slow to use in real-time applications, since it depends on high-order fast Fourier transform for high-resolution spectral synthesis [26]. Sinusoidal vocoders like HNM, on the other hand, usually have more parameters (each frame has to be represented by a set of frequencies, amplitude, and phase) than in the source-filter models, in which more memory would be required to code and store the speech segments. Similarly, neural models (e.g., WaveNet https://deepmind.com/blog/wavenet-generative-model-raw-audio/ [27]) require a large quantity of voice data for each speaker, high-frequency, the autoregressive nature of the model, and a great deal computation power for training the neural networks, making them difficult to use in practice [28,29]. Therefore, we believe that vocoder-based statistical parametric speech synthesis (SPSS) still offers a flexible and tractable solution to TTS that could be improved in terms of quality. We attempt in this study to develop a vocoder-based high-quality TTS synthesis system, while still maintaining the computational efficiency of the approach.
In our recent work in SPSS, we proposed a computationally feasible residual-based vocoder [13] using a continuous F0 model [9] and maximum voiced frequency (MVF) [30]. In this method, the voiced excitation consisting of pitch synchronous residual frames is low-pass filtered while the unvoiced part is high-pass filtered according to the MVF contour as a cutoff frequency. This approach was especially successful for modeling speech sounds with mixed excitation. In [31], we further controlled the time structure of the high-frequency noise component by estimating a suitable true envelope. Similar to other vocoders (e.g., a lack of noise in STRAIGHT [32]), the noise component in the continuous vocoder is still not accurately modeled, and limits the overall perceived quality. To mitigate the problem above, a valid and reliable method for calculating levels of noise in human speech would be required to give appropriate information for SPSS. Existing methods of measuring noise in human speech divide the acoustic signal into two parts: a harmonic and a noise component. Based on this assumption, estimates of the harmonic-to-noise ratio (HNR) have been calculated. We expect that adding a HNR to the voiced and unvoiced components that involve the presence of noise in voiced frames, the quality of synthesized speech in the noisy time regions will be more accurate than the baseline [31]. This method has a twofold advantage: (a) it makes it possible to eliminate most of the noise residuals; and (b) it attempts to reproduce the voiced and unvoiced (V/UV) regions more precisely, that is, it resembles natural sound signal-based TTS synthesis.
The goal of this article is to further improve our earlier vocoder [31] for high-quality speech synthesis. Specifically: (a) it proposes three adaptive techniques that enhance the performance of continuous F0; (b) it studies adding HNR as a new excitation parameter to the voiced and unvoiced segments of speech; and (c) it explores a different methodology for the estimation of MVF. We will finally show that the performance of the proposed vocoder is superior to state-of-the-art vocoder performance (the one based on STRAIGHT) in synthesized speech. This paper is organized as follows: In Section 2, continuous F0 and three refinements methods are described. Then, the new form of continuous vocoder is presented in Section 3. Experimental setup with measurements metric is defined in Section 4. Objective and subjective evaluations are discussed in Section 5. Finally, in Section 6, we conclude this paper with a brief summary.

2. F0 Detection and Refinement

This section is comprised of a background continuous F0 (contF0) estimation algorithm, and a description of three powerful adaptive frameworks for refining it. The effectiveness of these proposed methods is evaluated in Section 5.

2.1. Contf0: Baseline

The contF0 estimator introduced in this paper as a baseline is an approach proposed by Garner et al. [9] that is able to track fast changes. The algorithm starts simply with splitting the speech signal into overlapping frames. The result of windowing each frame is then used to calculate the autocorrelation. Identifying a peak between two frequencies and calculating the variance are the essential steps of the Kalman smoother to give a final sequence of continuous pitch estimates with no voiced/unvoiced decision.
In view of this, contF0 can cause some tracking errors when the speech signal amplitude is low, the voice is creaky, or there is low HNR. Therefore, further refinements were developed.

2.2. Adaptive Kalman Filtering

To begin with, the Kalman filter in its common form can be mathematically described as a simple linear model
x t = A t x t 1 + w t 1 ,   w t N ( 0 ,   Q t )
y t = B t x t + v t ,   v t N ( 0 ,   R t )
Here t is a time index, x t is an unobserved (hidden) state variable, A t is the state transition model to update the previous state, w t (state noise with zero mean) and v t (measurement noise with zero mean) are independent Gaussian random variables with covariance matrices Q t and R t , respectively, y t is the measurement derived from the observation state x t , B t is the measurement model which maps the underlying state to the observation. Alternatively, the Kalman filter operates by propagating the mean and covariance of the state through time. Recently, this method has been used for obtaining smoothed vocal tract parameters [33], and in speech synthesis systems [34,35].
It is known from the literature that the Kalman filter is one of the best state estimation methods in several different senses when the noise of both w t , v t are Gaussian, and both covariances Q t , R t are expected to be known. However, this can be very difficult in practice. If the noise statistics (estimates of the state and measurement noise covariance) are not as expected, the Kalman filter will be unstable or give state estimates that are not close to the true state [36]. One promising approach to overcoming this problem is the use of adaptive mechanisms in a Kalman filter. In particular, signal quality indices (SQIs) have been proposed by [37], and recently used in [38], which give confidence in the measurements of each source. When the SQI is low, the measurement should not be trusted; this can be achieved by increasing the noise covariance. Tsanas et al. [14] proposed an approach to consider both the state noise and the measurement noise covariance, which are adaptively determined based on the SQI (but in [37,38], the state noise was fixed a priori). Therefore, to improve the contF0 estimation method, we used the algorithm reported in [14] based on SQI in order to compute the confidence in both state noise and measurement noise covariance. Thereby, their covariance matrices Q t and R t are updated appropriately at each time step until convergence. Detailed steps of this algorithm are summarized simply in Figure 1. In this formulation, the aim of the adaptive Kalman filter is to use the measurements y t to update the current state x t ˜ = x t 1 to the new estimated state x t when Q t and R t are given at each time step.
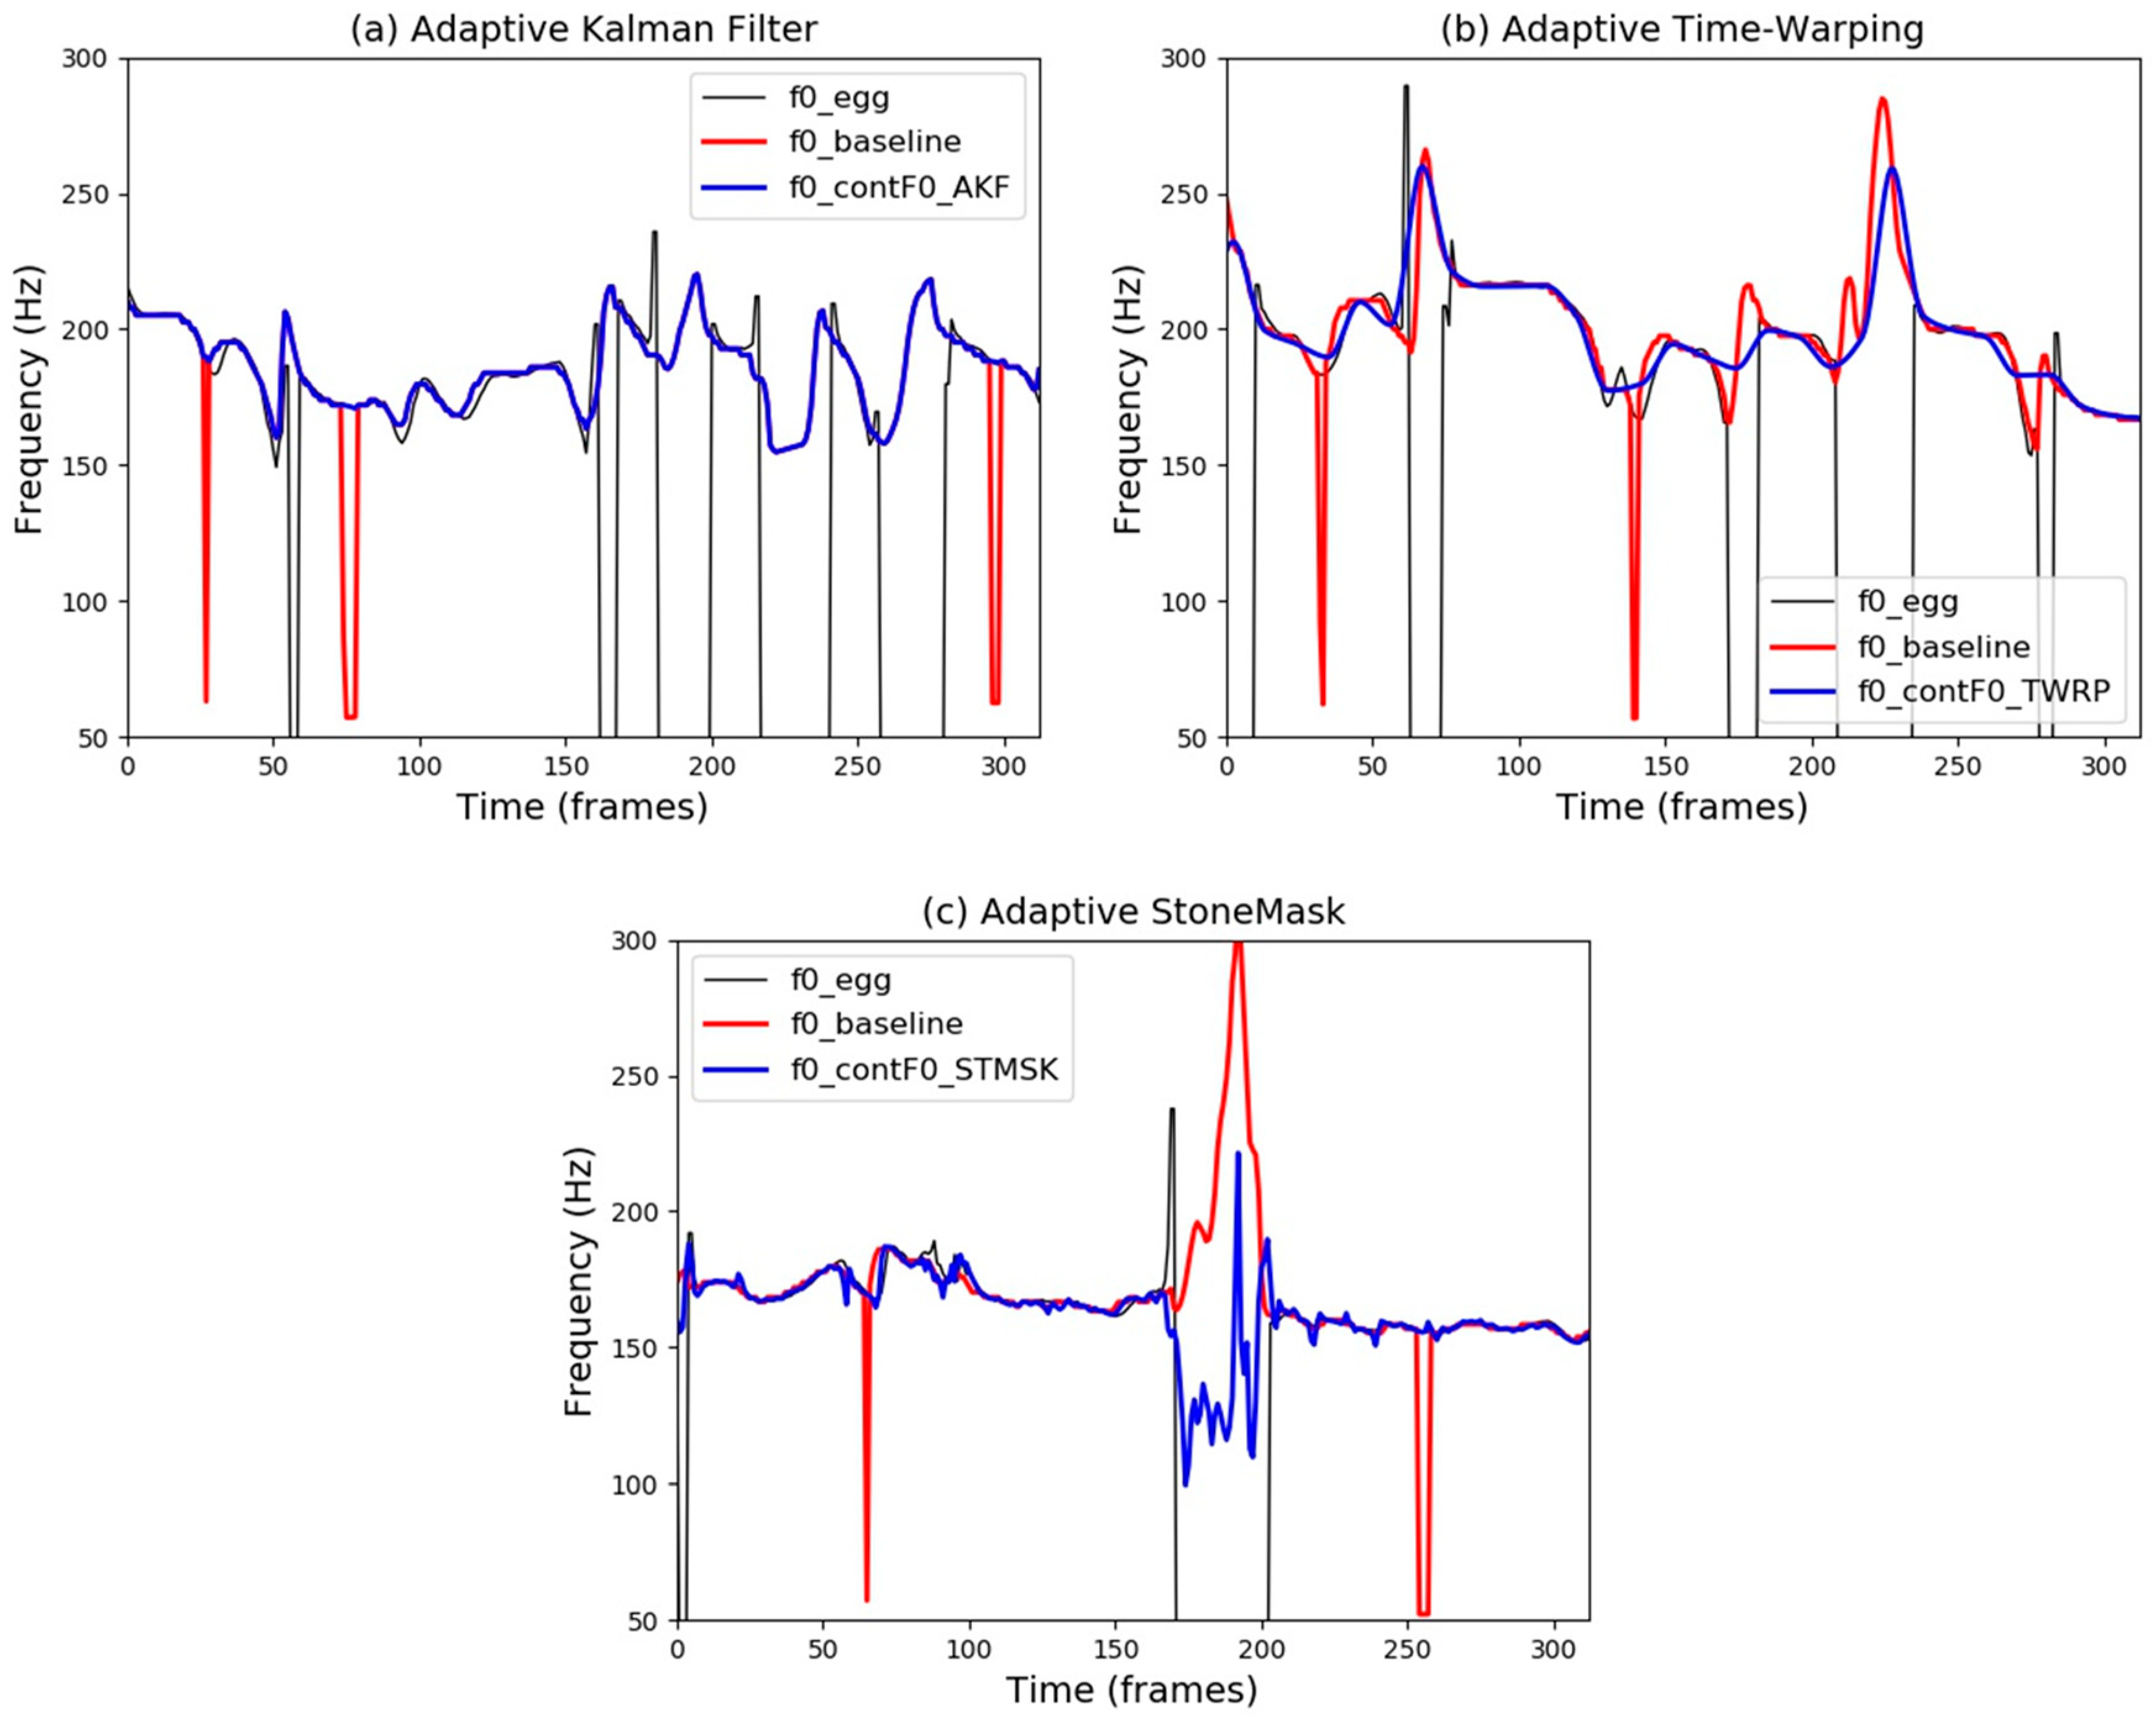
Figure 2a shows the performance of this adaptive methodology, in which the resulting contour is not influenced by the dips at frame 26, 74, and frame 295 occurring in the baseline. However, in such cases, this approach may over-fit to the speech dataset due to the number of manually specified parameters required for tuning. Thus, this technique should be used carefully.

2.3. Adaptive Time-Warping

In the speech signal, it is necessary that harmonic components are separated from each other so that they can be easily found and extracted. Once F0 rapidly changes, harmonic components are subject to overlapping each other, making it difficult to separate these components; closely neighboring components can make separation through filtering very hard, especially with a low spectral voice (such as male pitch) [39]. To overcome this problem, previous work in the literature has provided methods by introducing a time-warping-based approach [40,41].
Abe et al. [42] incorporate time-warping into instantaneous frequency spectrogram frame by frame according to the change of the harmonic frequencies. In view of that, the observed F0 is seen to be constant within each analysis frame. More recently, a time-warping pitch tracking algorithm has also been proposed by [43] which apparently had a significant positive impact on the voicing decision error and led to good results even in very noisy conditions. There has been another approach introduced by Stoter et al. [15] based on iteratively time-warping the speech signal and updating F0 estimate on time-warped speech, which has a nearly constant F0 over a segment of short duration, which sometimes leads to inaccurate pitch estimates. To achieve a further reduction in the amount of contF0 trajectory deviation (deviate from their harmonic locations) and to avoid additional sideband components generation when a fast movement of higher frequencies occurs, the adaptive time warping approach combined with the instantaneous frequency can be used to refine the contF0 algorithm.
We refer to the warping function as p which defines the relationship between two axes
τ = p ( t ) ,   t = p 1 ( τ )
where τ represents a time stretching factor. The first step is to stretch the time axis in order to make the observed contF0 value in the new temporal axis stay unchanged and preserve the harmonic structure intact [40,41]. As the initial estimate of the contF0 is available, the second step of the refinement procedure is to filter the input waveform using the bandpass filter bank h ( τ ) with different center frequencies f c multiplied by Nuttall window w ( τ ) [44] to separate only the fundamental component in the range near f c
h ( τ ) = w ( τ ) cos ( 2 j π f c τ )
w ( τ ) = 0.338946 + 0.481973 cos ( j π 2 f c τ ) + 0.161054 cos ( j π f c τ ) + 0.018027 cos ( 3 j π 2 f c τ )
Next, instantaneous frequencies I F ( τ ) of h ( τ ) have to be calculated. Flanagan’s equation [45] is used to extract them from both the complex-valued signal and its derivative
I F k ( τ ) = a d b d τ b d a d τ a 2 + b 2
where a and b are the real and imaginary parts of the spectrum of h ( τ ) , respectively. k represents the harmonic number. As the I F ( τ ) indicates the value close to F0, the contF 0 ´ is thus refined to a more accurate F0 by using a linear interpolation between I F ( τ ) values and contF0 coordinates. Then, using a weighted average
k = 1 N w k c o n t F 0 k ´ k
where k = 1 N w k = 1 , provides a new c o n t F 0 τ estimate on the warped time axis. The last step is unwarped in time to return the estimated value to the original time axis. Recursively applying these steps gives a final adaptive contF0 estimate (adContF0). An example of the proposed refinement based on the time-warping method is depicted in Figure 2b. It can be seen that the adContF0 trajectory given by the time-warping method is robust to the tracking error (dip at frame 30 and frame 138) to make it a more accurate estimation than the baseline. Despite the good performance, this technique requires a little tweaking the time-warp to achieve the desired results.

2.4. Adaptive StoneMask

Another method used to improve the noise robustness of the result estimated by contF0 is called StoneMask. This approach is also used in WORLD [46], which is a high-quality speech analysis/synthesis system, to adjust its fundamental frequency named DIO algorithm [47]. StoneMask is similarly designed based on instantaneous frequency I F ( t ) that is calculated by Equation (6). Here, a and b are the real and imaginary parts of the spectrum of a waveform S ( w ) , respectively, windowed by a Blackman window function w ( t ) defined in [ T 0 , T 0 ] with the following form
w ( t ) = 0.42 + 0.5 c o s π t N T 0 + 0.08 c o s 2 π t N T 0
where N is a positive integer, and T 0 is the inverse of the contF0 candidate. Hence, contF0 can be further refined by recursively using a formula given by
a d C o n t F 0 = k = 1 k | S ( k w 0 ) | I F ( k w 0 ) k = 1 k k | S ( k w 0 ) |
where w 0 represents the angular frequency of the contF0 candidate, and k represents the harmonic number (we set k = 6 for further refinement of the methodology).
The impact of the proposed method on contF0 performance is illustrated in Figure 2c. It is quite obvious that the adContF0 obtained by StoneMask almost matches the reference pitch contour much better than others. It can also be seen here that the proposed adContF0 in the unvoiced region (frames from 170 to 202) is significantly smaller than for the baseline, which is not the case with previous refined methods.

3. Continuous Speech Analysis/Synthesis System

To construct our proposed method, we adopt a robust and accurate continuous F0 estimator with MVF as its base system, and extend it by proposing a new excitation HNR parameter so that it can appropriately synthesize high-quality speech. In this section, we shortly describe first the baseline of our proposed vocoder, then define the detail of calculating the HNR parameter, and later a new estimate of the MVF parameter is explained. Figure 3 is a schematic diagram showing the main components of the modified version of the continuous vocoder.

3.1. Baseline Vocoder

The baseline system in this paper is based on our previous work [31]. Throughout the analysis phase, the continuous F0 estimator is calculated on the input waveforms using an approach proposed by Garner et al. [9], which is able to track fast changes with no voiced/unvoiced decision. Additionally, the Glottal Closure Instant (GCI) algorithm [48] is used to find the glottal period boundaries of individual cycles in the voiced parts of the inverse filtered residual signal. From these F0 cycles, a principal component analysis (PCA) residual is built which will be used in the synthesis phase to yield better speech quality than those of the excitation pulses. During the production of voiced sounds, MVF is used as the spectral boundary separating low-frequency periodic and high-frequency aperiodic components. Our vocoder follows the algorithm proposed by [30], which has the potential to discriminate harmonicity, exploits both amplitude and phase spectra, and use the maximum likelihood criterion as a strategy to derive the MVF estimate. Finally, a simple spectral model represented by 24-order Mel-Generalized Cepstral analysis (MGC) [49] was used with f r a m e s h i f t = 5   ms , a l p h a = 0.42 , and g a m m a = 1 / 3 .
It was shown in [48] that the PCA-based residual yields better speech quality than pulse-noise excitation. Therefore, during the synthesis phase, voiced excitation in the continuous vocoder is composed of PCA residual overlap-added pitch synchronously based on the continuous F0. Then, at the frequency given by the MVF contour, the voiced excitation is lowpass filtered, while white noise is used at frequencies higher than the value of MVF. A true time envelope of the PCA residual has been applied to further control the time structure of the high-frequency component in the excitation and noise parts [31]. The voiced and the unvoiced excitation are overlap-added. The Mel generalized-log spectrum approximation (MGLSA) filter [50] will finally be used to obtain a synthetic speech signal. Thus, continuous vocoder was designed to overcome the shortcomings of discontinuity in the speech parameters and the computational complexity of modern vocoders.

3.2. Harmonic-to-Noise Ratio

The main goal of vocoders is to achieve high speech intelligibility. It has been shown previously that the mixed excitation source model yields sufficiently good quality in the synthesized speech by reducing buzziness and breathiness [51]. Such an analysis/synthesis system may also suffer from some degradations: (1) loss of the high-frequency harmonic components, (2) high-frequency noise components, and (3) noise components in the main formants. As the degree of these losses increases, more noise appears, consequently degrading the speech quality greatly [52].
In this work, we propose adding a continuous harmonic-to-noise ratio (HNR) as a new excitation parameter to our vocoder in order to alleviate previous problems. Consequently, the excitation model in the proposed vocoder is represented by three continuous parameters: F0, MVF, and HNR. There are various methods of time and frequency domain algorithms available in the literature to estimate HNR in speech signals (for a comparison, see [53]). As we are dealing here with time domain processing, we want to follow the algorithm by [54] to estimate the level of noise in human voice signals for the following reasons: (1) the algorithm is very straightforward, flexible and robust, (2) it works equally well for low, middle, and high pitches, and (3) it is correctly tested for periodic signals and for signals with additive noise and jitter.
For a time signal x ( t ) , the autocorrelation function r x ( τ ) can be defined as
r x ( τ ) x ( t ) x ( t + τ ) d t
This function has a global maximum for τ = 0 . The fundamental period T 0 = 1 / F 0 is defined as the value of τ corresponding to the highest maximum of the r x ( τ ) , and the normalized autocorrelation is
r x ´ ( τ ) = r x ( τ ) r x ( 0 )
We could make such a signal x ( t ) by taking a harmonic signal H ( t ) with a period T 0 and adding a noise N ( t ) to it. We can now write Equation (10) as
r x ( τ ) = r H ( τ ) + r N ( τ )
Because the autocorrelation of a signal at 0 equals the power in the signal, Equation (11) at τ m a x represents the relative power of the harmonic component of the signal, and its complement represents the relative power of the noise component:
r x ´ ( τ m a x ) = r H ( 0 ) r x ( 0 )
1 r x ´ ( τ m a x ) = r N ( 0 ) r x ( 0 )
Thus, the HNR is defined at τ m a x > 0
H N R r x ´ ( τ m a x ) 1 r x ´ ( τ m a x )
Accordingly, the HNR is positively infinite for purely harmonic sounds, while it is very low for noise (see Figure 4). In a continuous vocoder, our approach here is to use the HNR to weight the excitation signal in both voiced and unvoiced frames. If we define the generation of the voiced excitation frame v [ k ] as
v [ k ] = p [ k ] w v
then, the weighted voice w v value can be determined by
w v = h n r [ i ] h n r [ i ] + 1 , i = K F s h i f t f s
where p [ k ] is the residual PCA voiced signal, F s h i f t is 5   ms frame shift, f s is the sampling frequency, and K is the location of impulse in original impulse excitation. Similarly, the unvoiced excitation frame u [ k ] and the unvoiced weight w u value can also be computed by
u [ k ] = n [ k ] w u
w u = 1 h n r [ i ] + 1 , i = k
where n [ k ] is the additive Gaussian noise. As a result, the voiced and unvoiced speech signal are added in the ratio suggested by the HNR, and then used to excite the MGLSA filter as illustrated in the bottom part of Figure 3.

3.3. Maximum Voiced Frequency Estimation

In voiced sounds, MVF is used as the spectral boundary separating a low-frequency periodic and high-frequency aperiodic components. It has been used in numerous speech models, such as [23,48,55], which yields sufficiently better quality in the synthesized speech.
The preliminary version of our vocoder followed the Drugman and Stylianou [30] approach, which exploits both amplitude and phase spectra. Although this approach tends to relatively reduce the acoustic buzziness of the reconstructed signals, it cannot distinguish between a production noise and a background noise. This means that MVF might be underestimated if the speech is recorded in a pseudo noisy environment. Moreover, we found that the estimation-based MVF [30] lacks the ability to capture some components of the sound that lie in the region of the higher frequencies (especially for the females). For this reason, higher MVF is required in this work to yield more natural synthetic speech.
Over the last few years, several attempts, with varying results, have already been made to analyze the MVF parameter. In this paper, similar to [23], we used a sinusoidal likeness measure (SLM) [56]-based approach to extract the MVF. A representative block diagram is shown in Figure 5 using five main functional steps:
(1)
Consecutive frames of the input signal x [ n ] are obtained by using a 3-period-long Hanning window w [ n ] .
(2)
N -point fast Fourier transform (FFT) of every analysis frame m is computed X m [ k ] . N is equal or greater than 4 times of the frame length L .
X m [ k ] = log ( | F F T N { x [ n ] . w [ n n m ] } | L f s )
(3)
The magnitude spectral peak detection for each frame is calculated, and their SLM score λ i is given through cross-correlation [56]
λ i = | S [ k ] · W i * [ k ] | | S [ k ] | 2 · | W i [ k ] | 2
where W is the Fourier transform of w [ n ] multiplied by e j 2 π f n , operator * denotes a complex conjugation, and i is the index of the peak. The λ always lies in the range [0,1]. Consequently,
λ = { 1 , p u r e   s i n u s o i d o t h e r w i s e , p r e s e n c e   o f   n o i s e
(4)
The error of the MVF position at each peak i is figured as
ε i m = 1 P [ j = 1 i 1 ( 1 λ j m ) 2 + j = i P ( λ j m ) 2 ]
where P is the total number of spectral peaks.
(5)
To give a final sequence of MVF estimates, a dynamic programming approach is used to eliminate the spurious values and to minimize the following cost function
C i m = k = 1 K ε i m + γ k = 2 K ( f i m f i 1 m 1 f s 2 ) 2
where f i m is the i m candidate at frame k and γ = 1 at 5   ms .
Figure 6 shows the spectrograms of an example of voiced speech with MVF estimation algorithm obtained by the baseline [30] (blue line) and SLM (black line). It can be seen that the MVF-based SLM approach capture wide frequency segments of data (e.g., between 0.75–1.3 s, and between 1.9–2.5 s). This observation suggests that the baseline often underestimates some of the voicing frequency in the higher frequency regions of the spectrogram.

4. Experimental setup

To evaluate the performance of the suggested methods, a database containing a few hours of speech from several speakers recorded carefully under controlled conditions was required for giving indicative results. Datasets are described in more detail in the first part of this section, while in the second part, objective performance criteria are defined.

4.1. Datasets

The speech data used in the evaluation consist of a database recorded for the purpose of developing TTS synthesis. Three English speakers were chosen from the CMU-ARCTIC (http://www.festvox.org/cmu_arctic/) database [57], denoted BDL (American English, male), JMK (Canadian English, male), and SLT (American English, female); each one can produce one hour of speech data segmented into 1132 sentences, restricting their length from 5 to 15 words per sentence (a total of 10,045 words with 39,153 phones). Moreover, CMU-ARCTIC are phonetically balanced utterances with 100% phonemes, 79.6% diphones, and 13.7% triphones.
The speech waveform of this database was recorded at a 32 kHz sampling rate at a 16-bit resolution; one channel was the waveform, the other laryngograph (from which a reliable pitch estimate can be derived). 20 sentences from each speaker were chosen randomly to be analyzed and synthesized with the baseline and proposed vocoders. These 60 utterances were subsequently down-sampled by a factor of 2 in order to reduce its sampling rate from 32 kHz to 16 kHz, as this is a more typical use in the early baseline vocoder [13].
With the purpose of assessing true performance of the refined contF0, a reference pitch contour (ground truth) is required. The ground truth is estimated from the electro-glottal graph (EGG), as it is directly derived from glottal vibration and is largely unaffected by the nonharmonic components of speech [58]. In our evaluation, the ground truth is extracted from EGG signals using Praat [59]. Additionally, it is of the greatest importance to select some state-of-the-art algorithms for the purpose of comparison. Although there is a lack of such algorithms dealing with the continuous F0 approach in the literature, YANGsaf [60] is the only F0 estimator method that can be compared along with adContF0 and the baseline. The choice of YANGsaf is confirmed by the fact that it was recently shown in [61] to outperform other well-known F0 estimation approaches like YIN, RAPT, or DIO. Moreover, TANDEM-STRAIGHT [62] vocoder that has mostly become the state-of-the-art model in SPSS was used in this experiment as the highest quality vocoder. For all methods across all speakers, the floor and ceiling frequencies of the F0 estimation range were set to 50 and 250 Hz for a male speaker, while for a female speaker, the default range was set to 150 and 350 Hz. The frame shift was set to 5 ms, while all other parameters remain at their default values.

4.2. Error Measurement Metrics

Finding a meaningful objective metric is always a challenge in evaluating the performance of F0 detectors. In fact, one metric may possibly be suitable for a few pitches but not convenient for all. The reason for this may be related to some factors which are influenced by the speed, complexity, or accuracy of the pitch algorithms. Speaker types and environmental conditions should also be taken into account when choosing these metrics. In this article, we try to adopt a series of distinct measurements in accordance with [63,64] to assess the accuracy of the adContF0 estimation. The results were averaged over the utterances for each speaker. The following three evaluation metrics were used:
(1)
Gross Pitch Errors: GPE is the proportion of frames considered voiced N v by both estimated and referenced F0 for which the relative pitch error e ( n ) is higher than a certain threshold (usually set to 20% for speech). The e ( n ) can be calculated as:
e ( n ) = F 0 n , r e f i n e d F 0 n , r e f e r e n c e d 1 , n = 1 , ,   N v
where n is the frame index. If | e ( n ) | > 0.2 , we classified the frame as a gross error N G E . Thus, GPE can be defined as
G P E = N G E N v 100 %
(2)
Mean Fine Pitch Errors: Fine pitch error refers to all pitch errors that are not classified as GPE. In other words, MFPE can be derived from Equation (25) when | e ( n ) | < 0.2
M F P E = 1 N F E n = 1 N F E ( F 0 n ,   r e f i n e d F 0 n ,   r e f e r e n c e d )
where N F E is the number of remaining voiced frames that do not have gross error ( N v N G E ).
(3)
Standard Deviation of the Fine Pitch Errors: STD is firstly stated in [64] as a measure of the accuracy of the F0 detector during voiced intervals, then slightly modified in [63]. For better analysis, STD can be calculated as
S T D = 1 N F E n = 1 N F E ( F 0 n , r e f i n e d F 0 n , r e f e r e n c e d ) 2 M F P E 2
Even if other error analyses are possible, like unvoiced error (UVE), pitch tracking error (which is the mean of VE and UVE), and F0 frame error (based on all voiced/unvoiced frames), it was felt that these metrics were not suitable to algorithms that deal with continuous F0, as there are no unvoiced frames. Therefore, the above metrics are good for checking the performance strengths and weaknesses of each method.

5. Evaluation Results and Discussion

The experimental evaluation has two main goals. First, it aims to evaluate the accuracy of the contF0 using adaptive refinement methods. The second goal is to evaluate the proposed vocoder in the context of statistical parametric speech synthesis and to compare its performance with baseline and STRAIGHT vocoders.

5.1. Objective Evaluation

5.1.1. Noise Robustness of F0 Estimation

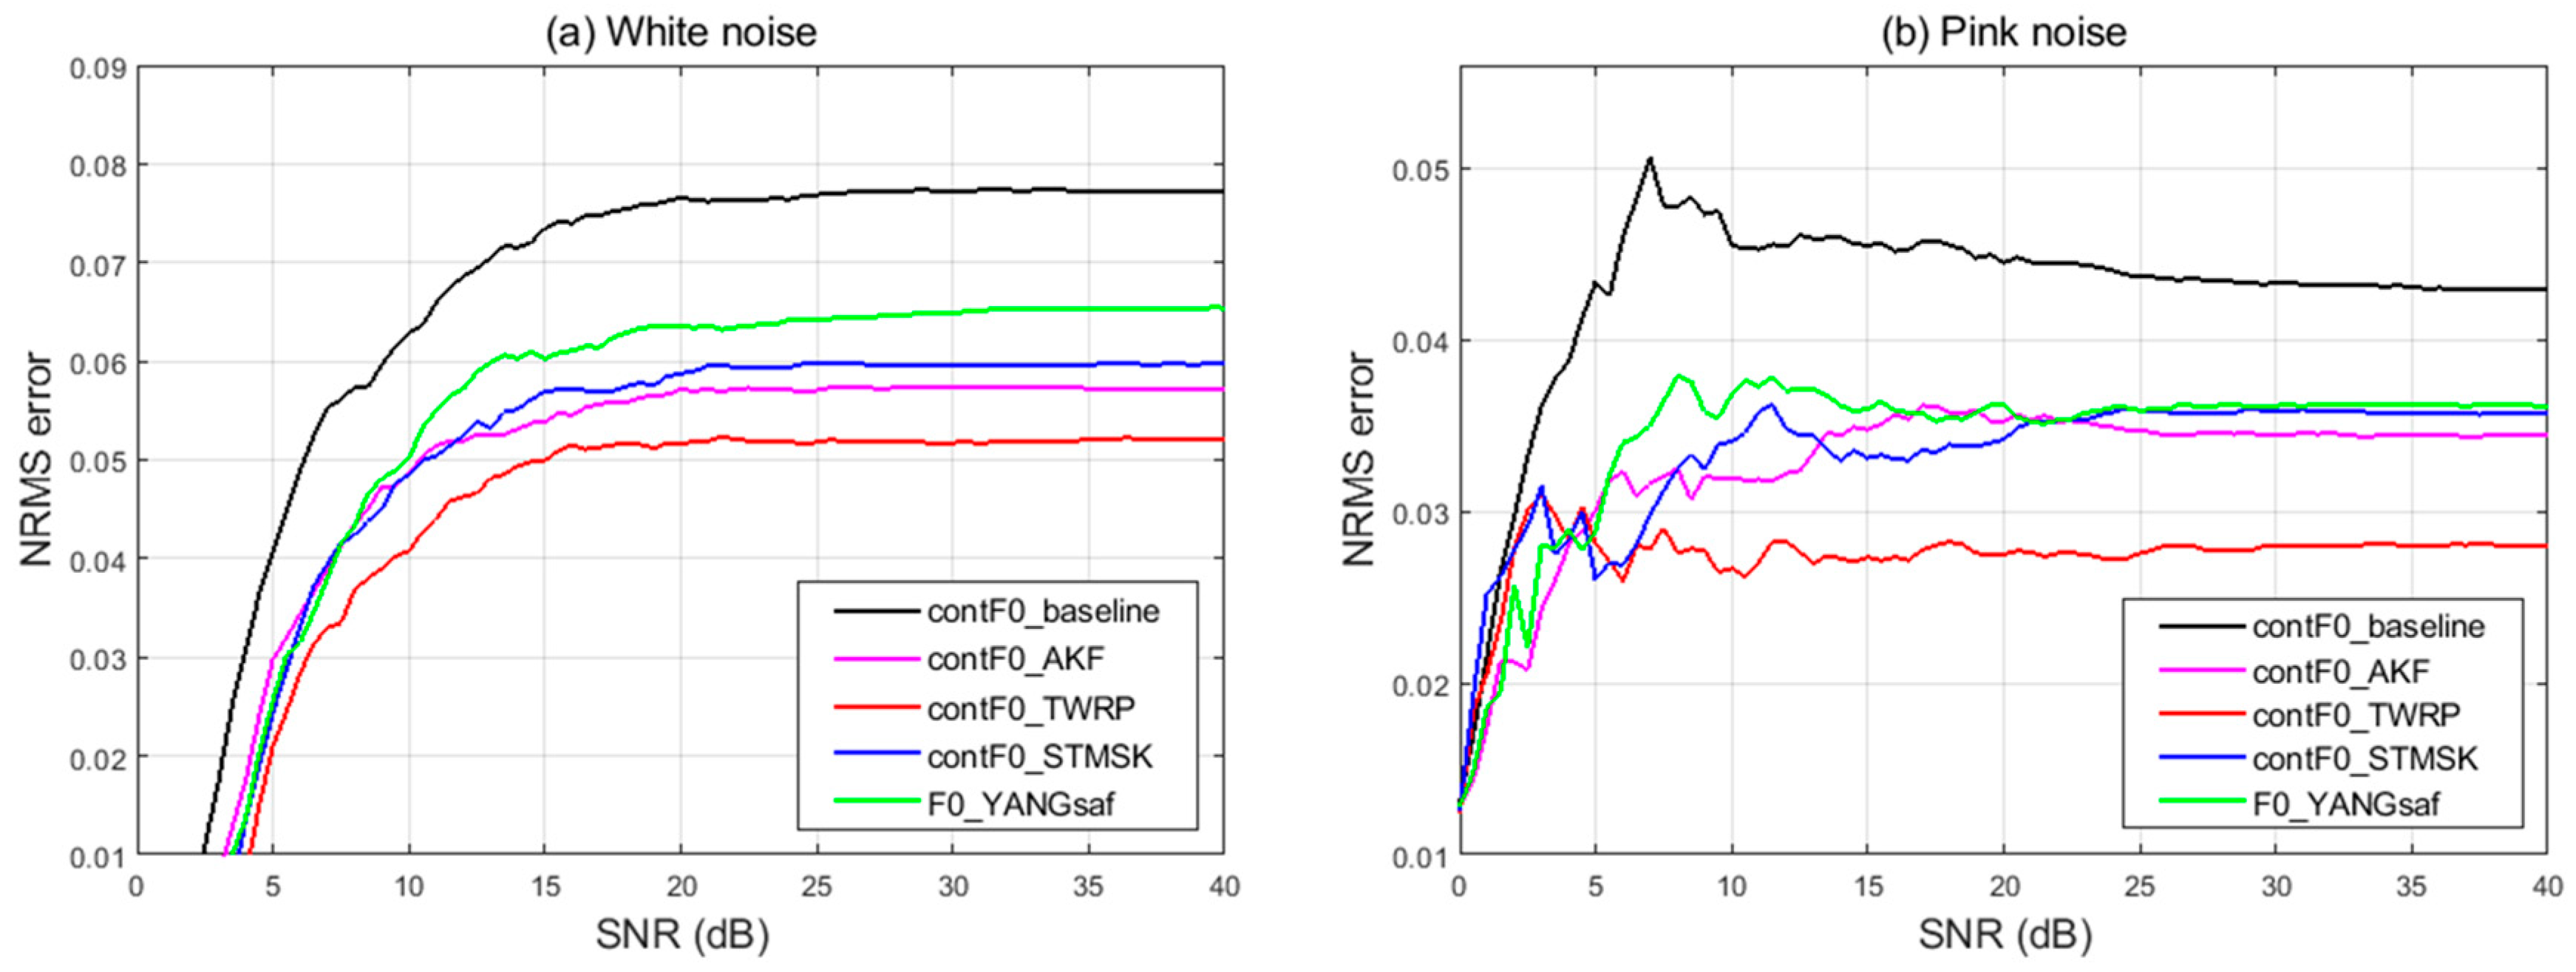
We used white Gaussian noise and pink noise as the background noise to test the quality of the adContF0 and also to clarify the effects of refinement. The amount of noise is specified by the signal-to-noise ratio (SNR) ranged from 0 to 40 dB. We calculated the normalized root mean square error (NRMSE) over selected sentences for each speaker.
Figure 7a,b shows the overall NRMSE values obtained from various methods as a function of the SNR between speech signals and noise. We present the average NRMSE over all three speakers. The smaller the value of NRMSE, the better the F0 estimation’s performance. The results of white and pink noise suggest that the NRMSE for all proposed methods are smaller than the baseline, and the time warping method becomes the best. This means that our proposed one is: (a) robust against white and pink noise; and (b) superior to the one based on YANGsaf. Consequently, this positive result is beneficial in TTS synthesis.
Furthermore, Figure 8 shows the power spectral density (PSD) calculated with the periodogram method for all F0 estimators compared with ground truth. In this figure, the adContF0-based StoneMask method gives a similar performance to that of the ground truth (F0_egg) and better than the baseline [9]. It can be concluded that all refined approaches were robust against the noise and outperformed the conventional one as expected.

5.1.2. Performance Comparison of F0 Estimation

Here, we show the results for the error metrics presented in Section 4.2. The improvement in this work is possible since our refinement approaches use the concept of adaptive structure. We noted several trends from the estimation error in Table 1, Table 2 and Table 3. The best value in each column is bold-faced.
Table 1 displays the results of the evaluation of the three methods for contF0, for female and male speakers, in comparison to the YANGsaf algorithm. When refining the contF0 using the time-warping (contF0_TWRP) technique, the GPE score shows an improvement of 4.46% for the BDL speaker, whereas there is only a 1.07% improvement for the JMK speaker. Nevertheless, we did not see any enhancement for the SLT speaker in the case of ContF0_TWRP. However, a 2.32% improvement was found in the refinement of contF0 based on StonMask method (ContF0_STMSK). For YANGsaf, on the other hand, the improvement was 8.52%, 7.8%, and 3.08% for the BDL, JMK, and SLT speakers, respectively, in comparison with the baseline. Additionally, Table 1 shows that there is no significant difference between ContF0_STMSK and the state-of-the-art YANGsaf approaches based on MFPE and STD measures in all speakers.
In the same way, Table 2 and Table 3 tabulate the GPE, MFPE, and STD measures averaged over all utterances for BDL, JMK, and SLT speakers in the presence of additive white noise and pink noise, respectively, at 0 dB of SNR to test the robustness of the contF0 tracker. adContF0-based Kalman filter (contF0_AKF) is more accurate for the female speaker (as measured by GPE) than for the other two candidates. However, this is not the case with pink noise. Moreover, adContF0-based time-warping showed better performance in terms of GPE measurement in the presence of pink noise with all speakers. In contrast, contF0_STMSK still had the lowest MFPE and STD under SNR conditions for all speakers.
It is interesting to emphasize that the baseline does not at all meet the performance of the other refinement trackers in BDL, JMK, and SLT speakers; that the results reported in Table 1 yield results comparable with state-of-the-art algorithm, while Table 2 and Table 3 strongly support the use of the proposed method-based StoneMask as the most accurate contF0 estimation algorithm. In other words, the findings in Table 2 and Table 3 might demonstrate the robustness of the proposed approaches to additive Gaussian white and pink noise.
It is worth noting that the main advantage of using adaptive Kalman filter is that we can determine our confidence in the estimates of contF0 algorithm-based TTS by adjusting SQIs to update both the measurement noise covariance and the state noise covariance. For example, it can be used to replace the one studied by Li et al. [37] in heart rate assessment applications. Meanwhile, the time warping scheme has the ability to track the time-varying contF0 period, and reduce the amount of contF0 trajectory deviation from their harmonic locations. By considering the system processing speed, adContF0-based StoneMask is computationally inexpensive and can be useful in a practical speech processing application.

5.1.3. Measuring Speech Quality after Analysis and Re-Synthesis

It is well-known that efficient methods for evaluating speech quality are typically based on subjective listening tests. However, there are various issues related to the use of subjective testing. It can sometimes be very expensive, time-consuming, and hard to find a sufficient number of suitable volunteers [65,66]. For that reason, it can often be useful in this work to run objective tests in addition to listening tests. A range of objective speech quality and intelligibility measures are considered to evaluate the quality of synthesized speech based on the modified version of our continuous vocoder:
  • One objective measure is the Weighted-Slope Spectral Distance (WSS) [67], which computes the weighted difference between the spectral slopes in each frequency band. The spectral slope is found as the difference between adjacent spectral magnitudes in decibels.
  • As the speech production process can be modeled efficiently with Linear Predictive Coefficients (LPC), another objective measure is called the Log-Likelihood Ratio (LLR) [65]. It is generally a distance measure that can be directly calculated from the LPC vector of the clean and enhanced speech. The segmental LLR values were limited in the range of [0, 1].
  • We also adopt the frequency-weighted segmental SNR (fwSNRseg) for the error criterion to measure speech quality, since it is said to be much more correlated with subjective speech quality than classical SNR [68]. The fwSNRseg measure applies weights taken from the ANSI SII standard to each frequency band [69]. Instead of working on the entire signal, only frames with segmental SNR in the range of −10 to 35 dB were considered in the average.
  • Moreover, Jensen and Taal introduced an effective objective measure, which they called the Extended Short-Time Objective Intelligibility (ESTOI) measure [69]. The ESTOI calculates the correlation between the temporal envelopes of clean and enhanced speech in short frame segments.
  • The final objective measure used here is the Normalized Covariance Metric (NCM) [70], which is based on the covariance between the clean and processed Hilbert envelope signals.
Before we proceed to further detail on examining the results, we will first describe our experiments. Several experiments based on the HNR parameter were implemented to find out the best continuous pitch algorithm that works well with our continuous vocoder, as well as to understand the behavior of adding a new HNR excitation parameter in both voiced/unvoiced speech frames. The three experiments are summarized in Table 4.
The performance evaluations are summarized in Table 5. For all empirical measures, a calculation is done frame by frame, and higher values indicate better performance, except for the WSS and LLR measures (a lower value is better). From this table, several observations can be made. First, focusing on the WSS, it is clear that all methods for refining contF0 appear to work quite well with the HNR parameter. The fact is that proposed #3 can outperform the STRAIGHT vocoder for the JMK speaker. In terms of fwSNRseg, it can also be seen that all refined methods can perform well with a continuous vocoder (highest results were obtained); nevertheless, proposed #3 is shown to be the best. Similarly, the NCM measure shows similar performance between proposed #3 and STRAIGHT. In terms of LLR, the lowest correlation values were obtained with all proposed methods for all speakers. On the other hand, a good improvement was noted for proposed #1, #2, and #3 in the ESTOI measure. Hence, these experiments showing that adContF0 with HNR was beneficial.

5.1.4. Phase Distortion Deviation

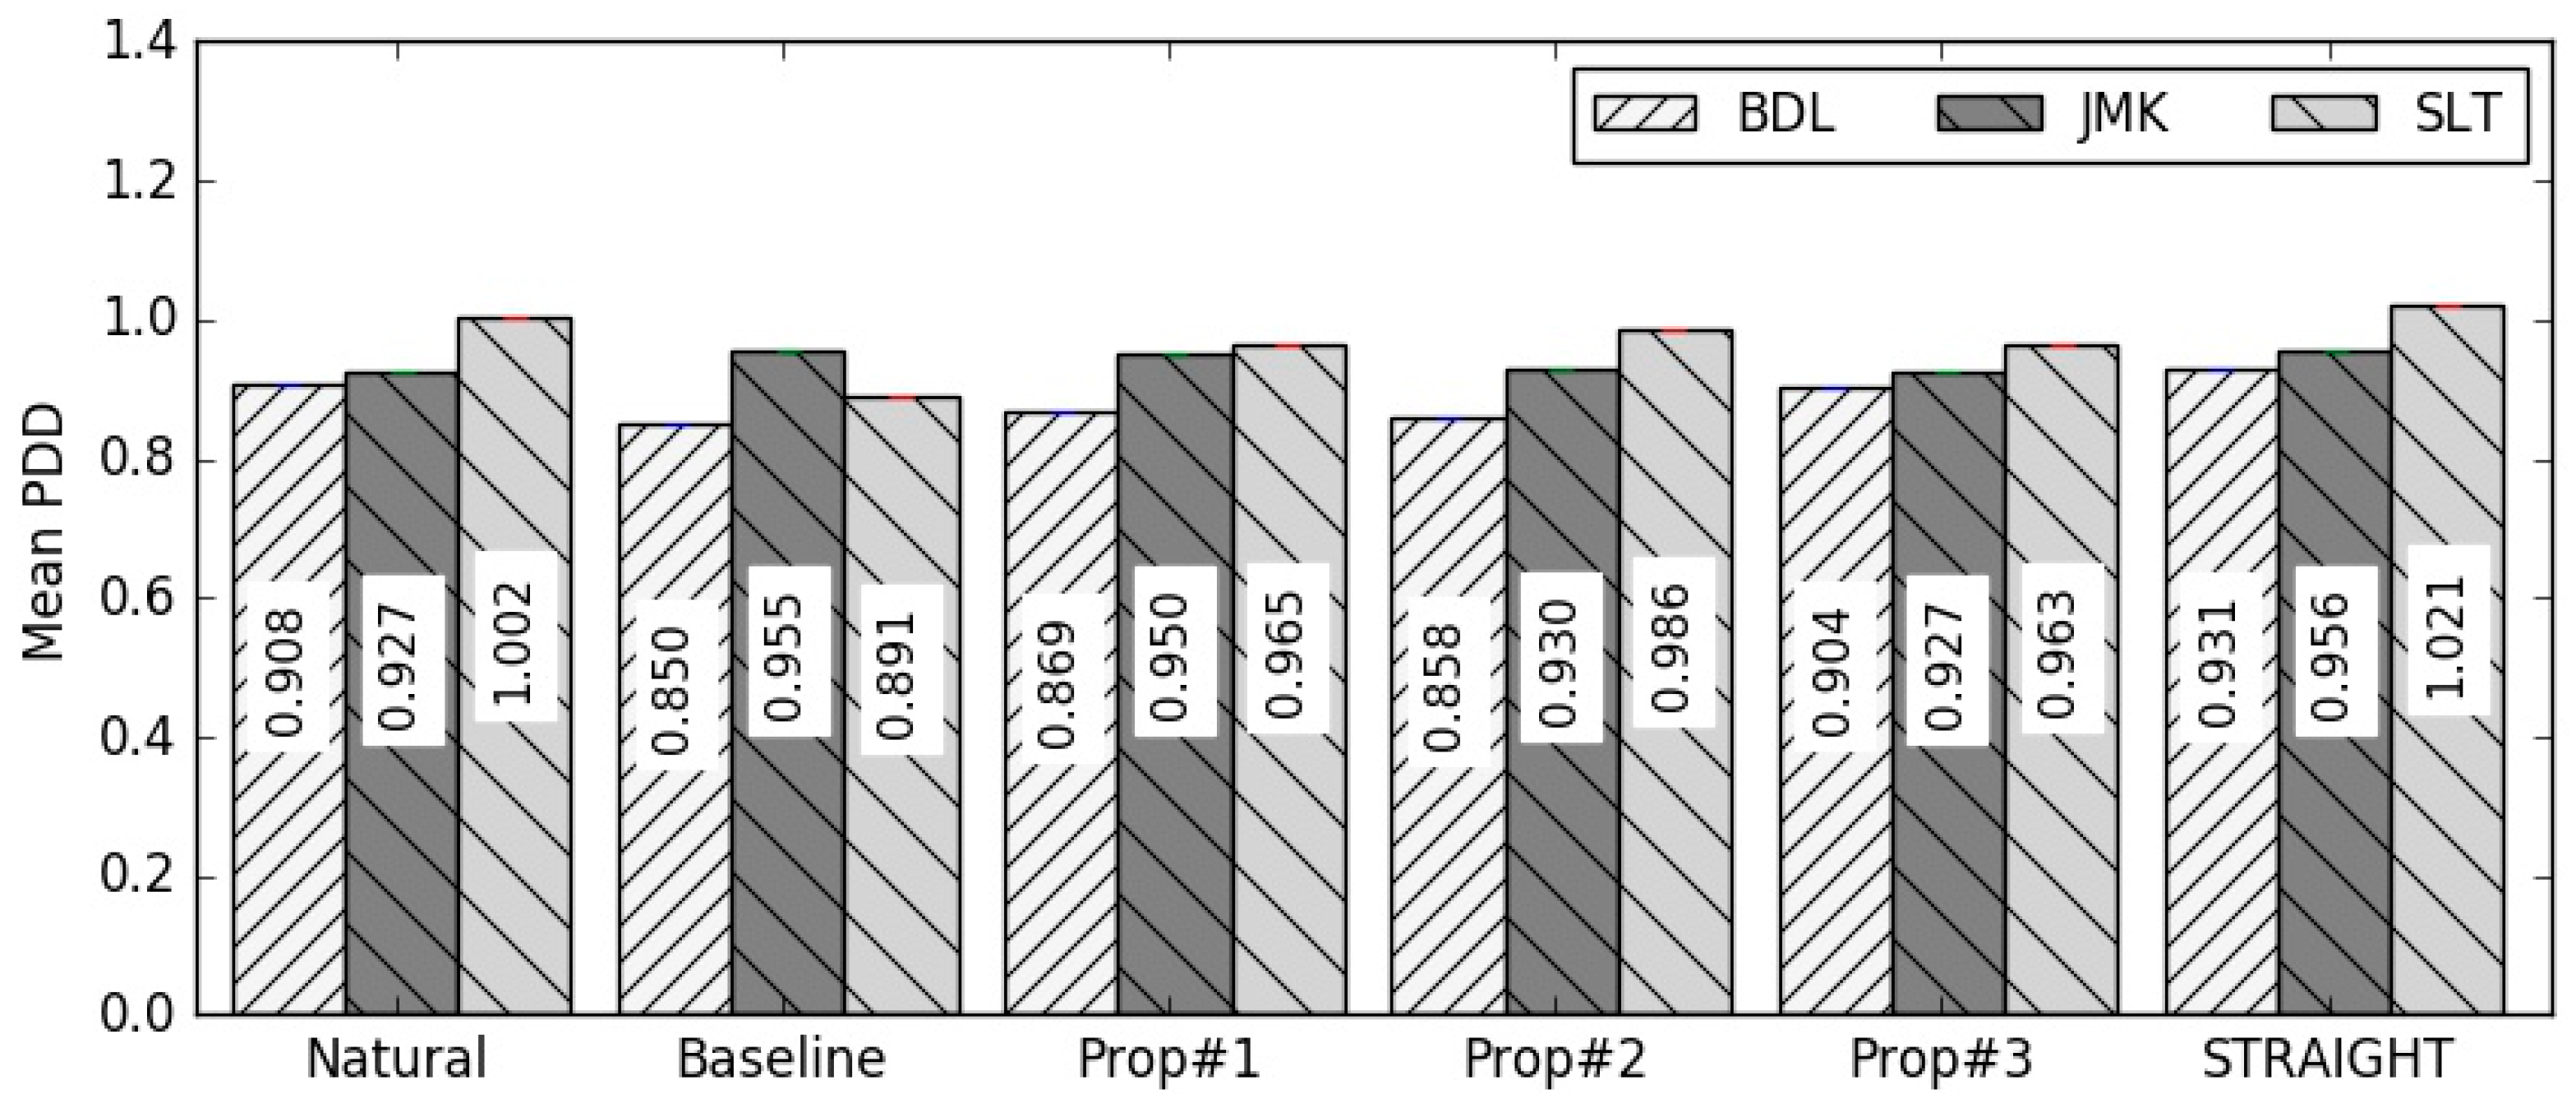
Recent progress in synthesized speech showed that the phase distortion of the signal carries all of the crucial information relevant to the shape of glottal pulses [71]. As the noise component in our continuous vocoder is parameterized in terms of time envelopes and computed for every pitch-synchronous residual frame, we compared the vocoded sentences to the natural and baseline by measuring mean phase distortion deviation (M-PDD). Originally, PDD could be calculated based on early Fisher’s standard-deviation [72]. However, [71] showed two issues related to variance and source shape in voiced segments. By avoiding these limitations, M-PDD can be estimated in this experiment at 5 ms frame shift as
M P D D = μ i ( f ) = ( 1 N n C e j P D n ( f ) )
where C = { i N 1 2 , , i + N 1 2 } , N is the number of frames, PD is the phase difference between two consecutive frequency components, and we denote the phase by ∠.
Figure 9 shows the means of the PDD values of the three speakers grouped by the 6 variants. As can be seen, the M-PDD values of the baseline system are significantly lower in BDL and SLT speakers and higher in JMK speaker compared to natural speech. It can also be noted from the JMK speaker that proposed #3 appears to match the M-PDD value of natural speech, followed by proposed #2. Similarly, the closed M-PDD value to natural speech is shown in proposed #3 and #2 for the female speaker. For the BDL speaker, proposed #3 is the only one that is not different from the natural samples, while the others seem to give lower M-PDD values. In summary, the various experiments result in different M-PDD values, but in general they are closer to the natural speech than the STRAIGHT and baseline vocoders.

5.2. Subjective Evaluation

As a subjective evaluation, the idea was to select the closeness between the re-synthesized and original speech signal that fits our goal. To evaluate which proposed system was closer to natural speech, we conducted a web-based MUSHRA (MUlti-Stimulus test with Hidden Reference and Anchor) listening test [73].
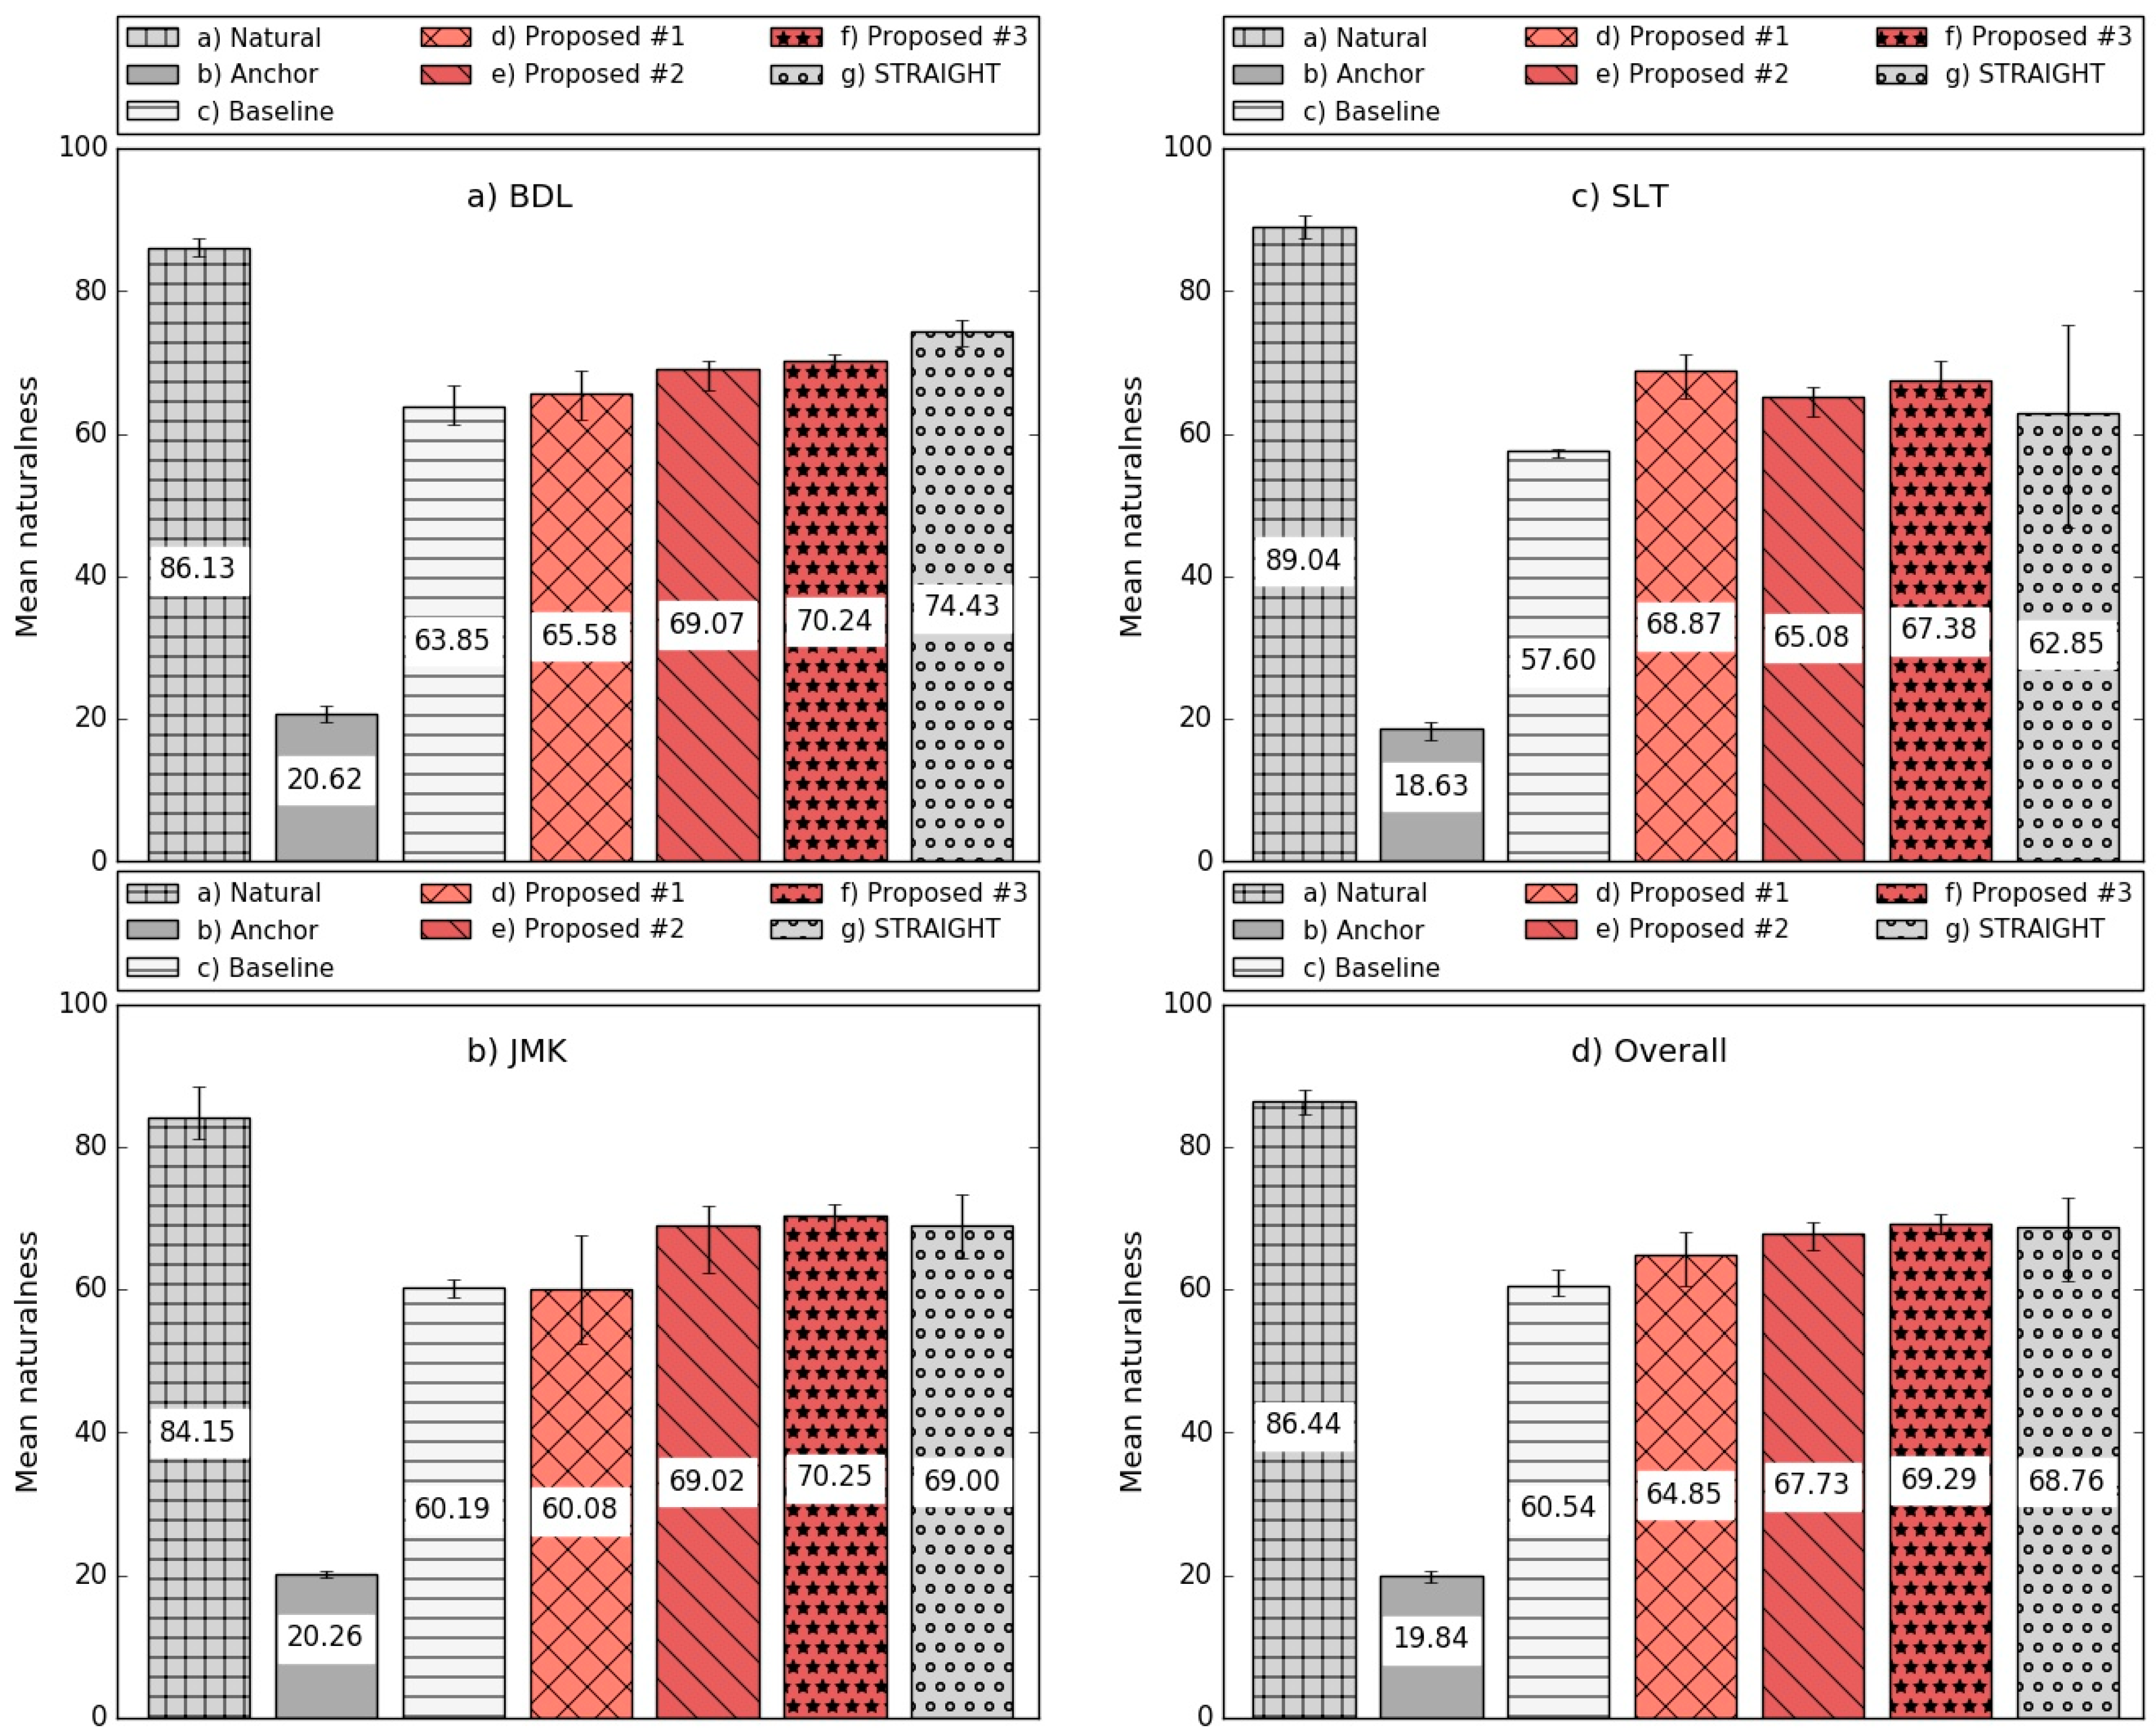
The advantage of MUSHRA is that it enables evaluation of multiple samples in a single trial without breaking the task into many pairwise comparisons. Our aim was to measure the perceived correlation of the ratio of the voiced and unvoiced components; therefore, we compared natural sentences with the synthesized sentences from the baseline, proposed and a hidden anchor system (the latter being a vocoder with simple pulse-noise excitation). From the 60 sentences used in the objective evaluation, 14 sentences were selected. Altogether, 84 utterances were included in the test (6 types × 14 sentences). Before the test, listeners were asked to listen to an example from the male speaker to adjust the volume. In the test, the listeners had to rate the naturalness of each stimulus relative to the reference (which was the natural sentence), from 0 (highly unnatural) to 100 (highly natural). The utterances were presented in a randomized order (different for each participant). The listening test samples can be found online (http://smartlab.tmit.bme.hu/adContF0_2019). Twenty-one participants (12 males, 9 females) with a mean age of 29 years, mostly with an engineering background, were asked to conduct the online listening test. On average, the test took 10 min to complete. The MUSHRA scores for all the systems are shown in Figure 10, showing both speaker by speaker and overall results.
According to the results, the proposed vocoders clearly outperformed the baseline system (Mann-Whitney-Wilcoxon ranksum test, p < 0.05). In particular, one can see that in the case of the female speaker (SLT), all proposed vocoders were significantly better than the STRAIGHT and baseline vocoders (Figure 10c). For the male speaker (JMK), we found that proposed #3 reached the highest naturalness scores in the listening test (Figure 10b). Meanwhile, for the BDL male speaker in Figure 10a, proposed #3 and #2 were ranked as the second and third best choices, respectively. When taking these overall results, the difference between STRAIGHT and the proposed system is not statistically significant (Mann-Whitney-Wilcoxon ranksum test, p < 0.05), meaning that our methods reached the quality of the state-of-the-art vocoder. This positive result was confirmed by metric measures in the statistical aspects of the objective’s experimental test.

6. Conclusions

This paper proposed a new approach with the aim of improving the accuracy of our continuous vocoder. We have proposed a modified version of the simple continuous pitch estimation algorithm in terms of adaptive Kalman filter, time-warping, and instantaneous-frequency methods. A relatively large database containing simultaneous recordings of speech sounds and EGG was used for the performance evaluation. According to our observations of the experiments, we found that refined contF0 methods could provide the expected results for both clean speech and speech contaminated with additive white and pink noise.
Another goal of the work reported here was to add a new excitation HNR parameter to the continuous vocoder to reduce the buzziness caused by the vocoder. We used an algorithm for measuring HNR which is more accurate, more reproducible, and more resistant to rapidly changing sounds compared to other methods found in the literature. Using a variety of error measurements, the performance strengths and weaknesses of the proposed method for different speakers were highlighted. In a subjective (MUSHRA) listening test, experimental results demonstrated that our proposed methods can improve the naturalness of the synthesized speech over our earlier baseline and STRAIGHT vocoders. In particular, we found that proposed #3 was rated better and more closely reached the state-of-the-art performance than the others under most objective and subjective measures.
The authors plan to train and evaluate all continuous parameters (F0, HNR, MVF, and MGC) using deep learning algorithms, such as feed-forward and recurrent neural networks, to test the continuous vocoder in statistical parametric speech synthesis-based TTS. As the HNR parameter is not limited only to our vocoder, we try to apply it to other types of modern parametric vocoders (such as Pulse Model in Log-domain (PML) [32]) to deal with the case of noisy conditions.

Author Contributions

Conceptualization, M.S.A.-R. and T.G.C.; Formal analysis, M.S.A.-R. and T.G.C.; Investigation, M.S.A.-R.; Methodology, M.S.A.-R. and T.G.C.; Project administration, G.N.; Resources, M.S.A.-R.; Software, M.S.A.-R. and T.G.C.; Supervision, G.N.; Writing—original draft, M.S.A.-R.; Writing—review & editing, T.G.C. and G.N.

Funding

This research received no external funding.

Acknowledgments

The research was partly supported by the AI4EU project and by the National Research, Development and Innovation Office of Hungary (FK 124584). The Titan X GPU used was donated by NVIDIA Corporation. We would like to thank the subjects for participating in the listening test.

Conflicts of Interest

The authors declare no conflict of interest.

References

  1. Huang, X.; Acero, A.; Hon, H. Spoken Language Processing; Prentice Hall PTR: Upper Saddle River, NJ, USA, 2001. [Google Scholar]
  2. Talkin, D. A robust algorithm for pitch tracking (RAPT). In Speech Coding and Synthesis; Elsevier: Amsterdam, The Netherlands, 1995; pp. 495–518. [Google Scholar]
  3. Kai, Y.; Steve, Y. Continuous F0 modelling for HMM based statistical parametric speech synthesis. IEEE Trans. Audio Speech Lang. Process. 2011, 19, 1071–1079. [Google Scholar]
  4. Latorre, J.; Gales, M.J.F.; Buchholz, S.; Knil, K.; Tamura, M.; Ohtani, Y.; Akamine, M. Continuous F0 in the source-excitation generation for HMM-based TTS: Do we need voiced/unvoiced classification? In Proceedings of the International Conference on Acoustics, Speech, and Signal Processing (ICASSP), Prague, Czech Republic, 22–27 May 2011. [Google Scholar]
  5. Masuko, T.; Tokuda, K.; Miyazaki, N.; Kobayashi, T. Pitch pattern generation using multi-space probability distribution HMM. IEICE Trans. Inf. Syst. 2000, J85-D-II, 1600–1609. [Google Scholar]
  6. Tokuda, K.; Mausko, T.; Miyazaki, N.; Kobayashi, T. Multi-space probability distribution HMM. IEICE Trans. Inf. Syst. 2002, E85-D, 455–464. [Google Scholar]
  7. Freij, G.J.; Fallsid, F. Lexical stress recognition using hidden Markov modeld. In Proceedings of the International Conference on Acoustics, Speech, and Signal Processing (ICASSP), New York, NY, USA, 11–14 April 1988; pp. 135–138. [Google Scholar]
  8. Jensen, U.; Moore, R.K.; Dalsgaard, P.; Lindberg, B. Modelling intonation contours at the phrase level using continous density hidden Markov models. Comput. Speech Lang. 1994, 8, 247–260. [Google Scholar] [CrossRef]
  9. Garner, P.N.; Cernak, M.; Motlicek, P. A simple continuous pitch estimation algorithm. IEEE Signal Process. Lett. 2013, 20, 102–105. [Google Scholar] [CrossRef]
  10. Zhang, Q.; Soong, F.; Qian, Y.; Yan, Z.; Pan, J.; Yan, Y. Improved modeling for F0 generation and V/U decision in HMM-based TTS. In Proceedings of the IEEE International Conference Acoustics, Speech and Signal Processing, Dallas, TX, USA, 15–19 March 2010. [Google Scholar]
  11. Nielsen, J.K.; Christensen, M.G.; Jensen, S.H. An approximate Bayesian fundamental frequency estimator. In Proceedings of the IEEE Acoustics, Speech and Signal Processing, Kyoto, Japan, 25–30 March 2012. [Google Scholar]
  12. Tóth, B.P.; Csapó, T.G. Continuous fundamental frequency prediction with deep neural networks. In Proceedings of the European Signal Processing Conference (EUSIPCO), Budapest, Hungary, 28 August–2 September 2016. [Google Scholar]
  13. Csapó, T.G.; Németh, G.; Cernak, M. Residual-based excitation with continuous F0 modeling in HMM-based speech synthesis. In Proceedings of the 3rd International Conference on Statistical Language and Speech Processing (SLSP), Budapest, Hungary, 24–26 November 2015; pp. 27–38. [Google Scholar]
  14. Tsanas, A.; Zañartu, M.; Little, M.A.; Fox, C.; Ramig, L.O.; Clifford, G.D. Robust fundamental frequency estimation in sustained vowels: Detailed algorithmic comparisons and information fusion with adaptive Kalman filtering. J. Acoust. Soc. Am. 2014, 135, 2885–2901. [Google Scholar] [CrossRef] [PubMed] [Green Version]
  15. Stoter, F.R.; Werner, N.; Bayer, S.; Edler, B. Refining fundamental frequency estimates using time warping. In Proceedings of the 23rd European Signal Processing Conference (EUSIPCO), Nice, France, 31 August–4 September 2015. [Google Scholar]
  16. Dutoit, T. High-quality text-to-speech synthesis: An overview. J. Electr. Electron. Eng. Aust. 1997, 17, 25–36. [Google Scholar]
  17. Kobayashi, K.; Hayashi, T.; Tamamori, A.; Toda, T. Statistical voice conversion with WaveNet-based waveform generation. In Proceedings of the 18th International Speech Communication Association. Annual Conference, Stockholm, Sweden, 20–24 August 2017; pp. 1138–1142. [Google Scholar]
  18. Kenmochi, H. Singing synthesis as a new musical instrument. In Proceedings of the International Conference on Acoustics, Speech, and Signal Processing (ICASSP), Kyoto, Japan, 25–30 March 2012; pp. 5385–5388. [Google Scholar]
  19. Hu, Q.; Richmond, K.; Yamagishi, J.; Latorre, J. An experimental comparison of multiple vocoder types. In Proceedings of the 8th ISCA Speech Synthesis Workshop, Barcelona, Spain, 31 August–2 September 2013. [Google Scholar]
  20. Kawahara, H.; Masuda-Katsuse, I.; de-Cheveign, A. Restructuring speech representations using a pitch-adaptive time–frequency smoothing and an instantaneous-frequency-based F0 extraction: Possible role of a repetitive structure in sounds. Speech Commun. 1999, 27, 187–207. [Google Scholar] [CrossRef]
  21. McCree, A.V.; Barnwell, T.P. A mixed excitation LPC vocoder model for low bit rate speech coding. IEEE Trans. Speech Audio Process. 1995, 3, 242–250. [Google Scholar] [CrossRef]
  22. Stylianou, Y.; Laroche, J.; Moulines, E. High-quality speech modification based on a harmonic + noise mode. In Proceedings of the EuroSpeech, Madrid, Spain, 18–21 September 1995; pp. 451–454. [Google Scholar]
  23. Erro, D.; Sainz, I.; Navas, E.; Hernaez, I. Harmonics plus noise model based vocoder for statistical parametric speech synthesis. IEEE J. Sel. Top. Signal Process. 2014, 8, 184–194. [Google Scholar] [CrossRef]
  24. Tamamori, A.; Hayashi, T.; Kobayashi, K.; Takeda, K.; Toda, T. Speaker-dependent WaveNet vocoder. In Proceedings of the Interspeech, Stockholm, Sweden, 20–24 August 2017; pp. 1118–1122. [Google Scholar]
  25. Wang, Y.; Ryan, R.J.; Stanton, D.; Wu, Y.; Weiss, R.J.; Jaitly, N.; Yang, Z.; Xiao, Y.; Chen, Z.; Bengio, S.; et al. Tacotron: Towards end-to-end speech synthesis. In Proceedings of the Interspeech, Stockholm, Sweden, 20–24 August 2017; pp. 4006–4010. [Google Scholar]
  26. Agiomyrgiannakis, Y. Vocaine the vocoder and applications in speech synthesis. In Proceedings of the International Conference on Acoustics, Speech, and Signal Processing (ICASSP), Brisbane, Australia, 19–24 April 2015; pp. 4230–4234. [Google Scholar]
  27. Oord, A.V.; Dieleman, S.; Zen, H.; Simonyan, K.; Vinyals, O.; Graves, A.; Kalchbrenner, N.; Senior, A.W.; Kavukcuoglu, K. WaveNet: A generative model for raw audio. arXiv 2016, arXiv:1609.03499. [Google Scholar]
  28. Arik, S.O.; Chrzanowski, M.; Coates, A.; Diamos, G.; Gibiansky, A.; Kang, Y.; Li, X.; Miller, J.; Ng, A.; Raiman, J.; et al. Deep voice: Real-time neural text-to-speech. In Proceeding of the International conference on Machine Learning (ICML), Stockholm, Sweden, 6–11 August 2017; pp. 195–204. [Google Scholar]
  29. Ping, W.; Peng, K.; Chen, J. CLARINET: Parallel wave generation in end-to-end text-to-speech. In Proceedings of the International Conference on Learning Representations (ICLR), New Orleans, LA, USA, 6–9 May 2019. [Google Scholar]
  30. Drugman, T.; Stylianou, Y. Maximum voiced frequency estimation: exploiting amplitude and phase spectra. IEEE Signal Process. Lett. 2014, 21, 1230–1234. [Google Scholar] [CrossRef]
  31. Al-Radhi, M.S.; Csapó, T.G.; Németh, G. Time-domain envelope modulating the noise component of excitation in a continuous residual-based vocoder for statistical parametric speech synthesis. In Proceedings of the Interspeech, Stockholm, Sweden, 20–24 August 2017; pp. 434–438. [Google Scholar]
  32. Degottex, G.; Lanchantin, P.; Gales, M. A log domain pulse model for parametric speech synthesis. IEEE/ACM Trans. Audio Speech Lang. Process. 2018, 26, 57–70. [Google Scholar] [CrossRef]
  33. McKenna, J.; Isard, S. Tailoring Kalman filtering towards speaker characterisation. In Proceedings of the Eurospeech, Budapest, Hungary, 5–9 September 1999. [Google Scholar]
  34. Quillen, C. Kalman filter based speech synthesis. In Proceedings of the IEEE International Conference on Acoustics, Speech and Signal Processing, Dallas, TX, USA, 15–19 March 2010. [Google Scholar]
  35. Vepa, J.; King, S. Kalman-filter based join cost for unit-selection speech synthesis. In Proceedings of the Interspeech, Geneva, Switzerland, 1–4 September 2003. [Google Scholar]
  36. Simon, D. Optimal State Estimation: Kalman, H Infinity, and Nonlinear Approaches; Wiley & Sons, Inc.: Hoboken, NJ, USA, 2006. [Google Scholar]
  37. Li, Q.; Mark, R.G.; Clifford, G.D. Robust heart rate estimation from multiple asynchronous noisy sources using signal quality indices and a Kalman filter. Physiol. Meas. 2008, 29, 15–32. [Google Scholar] [CrossRef] [PubMed]
  38. Nemati, S.; Malhorta, A.; Clifford, G.D. Data fusion for improved respiration rate estimation. EURASIP J. Adv. Signal Process. 2010, 2010, 1–10. [Google Scholar] [CrossRef] [PubMed]
  39. Kumaresan, R.; Ramalingam, C.S. On separating voiced-speech into its components. In Proceedings of the 27th Asilomar Conferance Signals, Systems, and Computers, Pacific Grove, CA, USA, 1–3 November 1993; pp. 1041–1046. [Google Scholar]
  40. Kawahara, H.; Katayose, H.; Cheveigne, A.D.; Patterson, R.D. Fixed point analysis of frequency to instantaneous frequency mapping for accurate estimation of f0 and periodicity. In Proceedings of the EuroSpeech, Budapest, Hungary, 5–9 September 1999; pp. 2781–2784. [Google Scholar]
  41. Malyska, N.; Quatieri, T.F. A time-warping framework for speech turbulence-noise component estimation during aperiodic phonation. In Proceedings of the International Conference on Acoustics, Speech, and Signal Processing (ICASSP), Prague, Czech Republic, 22–27 May 2011; pp. 5404–5407. [Google Scholar]
  42. Abe, T.; Kobayashi, T.; Imai, S. The IF spectrogram: A new spectral representation. In Proceedings of the ASVA, Tokyo, Japan, 2–4 April 1997; pp. 423–430. [Google Scholar]
  43. Stone, S.; Steiner, P.; Birkholz, P. A time-warping pitch tracking algorithm considering fast f0 changes. In Proceedings of the Interspeech, Stockholm, Sweden, 20–24 August 2017; pp. 419–423. [Google Scholar]
  44. Nuttall, A.H. Some windows with very good sidelobe behavior. IEEE Trans. Acoust. Speech Signal Process. 1981, 29, 84–91. [Google Scholar] [CrossRef] [Green Version]
  45. Flanagan, J.L.; Golden, R.M. Phase vocoder. Bell Syst. Tech. J. 2009, 45, 1493–1509. [Google Scholar] [CrossRef]
  46. Morise, M.; Yokomori, F.; Ozawa, K. WORLD: A vocoder based high-quality speech synthesis system for real-time applications. IEICE Trans. Inf. Syst. 2016, E99-D, 1877–1884. [Google Scholar] [CrossRef]
  47. Morise, M.; Kawahara, H.; Nishiura, T. Rapid f0 estimation for high-snr speech based on fundamental component extraction. IEICE Trans. Inf. Syst. 2010, 93, 109–117. [Google Scholar]
  48. Drugman, T.; Dutoit, T. The deterministic plus stochastic model of the residual signal and its applications. IEEE Trans. Audio Speech Lang. Process. 2012, 20, 968–981. [Google Scholar] [CrossRef]
  49. Tokuda, K.; Kobayashi, T.; Masuko, T.; Imai, S. Mel-generalized cepstral analysis—A unified approach to speech spectral estimation. In Proceedings of the International Conference on Spoken Language Processing (ICSLP), Yokohama, Japan, 18–22 September 1994; pp. 1043–1046. [Google Scholar]
  50. Imai, S.; Sumita, K.; Furuichi, C. Mel Log Spectrum Approximation (MLSA) filter for speech synthesis. Electron. Commun. Jpn. Part I Commun. 1983, 66, 10–18. [Google Scholar] [CrossRef]
  51. Griffin, D.W. Multi-Band Excitation Vocoder. Ph.D. Thesis, Massachusetts Institute of Technology (MIT), Cambridge, MA, USA, March 1987. [Google Scholar]
  52. Hoene, C.; Wiethölter, S.; Wolisz, A. Calculation of speech quality by aggregating the impacts of individual frame losses. In Proceedings of the IWQoS, Lecture Notes in Computer Science, Passau, Germany, 21–23 June 2005; pp. 136–150. [Google Scholar]
  53. Severin, F.; Bozkurt, B.; Dutoit, T. HNR extraction in voiced speech, oriented towards voice quality analysis. In Proceedings of the EUSIPCO, Antalya, Turkey, 4–8 September 2005. [Google Scholar]
  54. Boersma, P. Accurate short-term analysis of the fundamental frequency and the harmonics-to-noise ratio of a sampled sound. In Proceedings of the Institute of Phonetic Sciences; University of Amsterdam: Amsterdam, The Netherlands, 1993. [Google Scholar]
  55. Stylianou, Y. Applying the harmonic plus noise model in concatenative speech synthesis. IEEE Trans. Audio Speech Lang. Process. 2001, 9, 21–29. [Google Scholar] [CrossRef]
  56. Rodet, X. Musical sound signals analysis/synthesis: Sinusoidal + residual and elementary waveform models. In Proceedings of the IEEE Time-Frequency and Time-Scale Workshop (TFTS), Coventry, UK, 27–29 August 1997; pp. 131–141. [Google Scholar]
  57. Kominek, J.; Black, A.W. CMU ARCTIC Databases for Speech Synthesis; Carnegie Mellon University: Pittsburgh, PA, USA, 2003. [Google Scholar]
  58. Nakatania, T.; Irino, T. Robust and accurate fundamental frequency estimation basedon dominant harmonic components. Acoust. Soc. Am. 2004, 116, 3690–3700. [Google Scholar] [CrossRef] [PubMed]
  59. Boersma, P. Praat, a system for doing phonetics by computer. Glot Int. 2002, 5, 341–345. [Google Scholar]
  60. Kawahara, H.; Agiomyrgiannakis, Y.; Zen, H. Using instantaneous frequency and aperiodicity detection to estimate f0 for high-quality speech synthesis. In Proceedings of the ISCA Workshop on Speech Synthesis, Sunnyvale, CA, USA, 13–15 September 2016. [Google Scholar]
  61. Hua, K. Improving YANGsaf F0 estimator with adaptive Kalman filter. In Proceedings of the Interspeech, Stockholm, Sweden, 20–24 August 2017. [Google Scholar]
  62. Kawahara, H.; Morise, M. Technical foundations of TANDEM-STRAIGHT, a speech analysis, modification and synthesis framework. Sadhana 2011, 36, 713–727. [Google Scholar] [CrossRef] [Green Version]
  63. Chu, W.; Alwan, A. SAFE: A Statistical Approach to F0 Estimation Under Clean and Noisy Conditions. IEEE Trans. Audio Speech Lang. Process. 2012, 20, 933–944. [Google Scholar] [CrossRef]
  64. Rabiner, L.R.; Cheng, M.J.; Rosenberg, A.E.; McGonegal, C.A. A comparative performance study of several pitch detection algorithms. IEEE Trans. Audio Speech Lang. Process. 1976, 24, 399–417. [Google Scholar] [CrossRef]
  65. Quackenbush, S.; Barnwell, T.; Clements, M. Objective Measures of Speech Quality; Prentice-Hall: Englewood Cliffs, NJ, USA, 1988. [Google Scholar]
  66. Hu, Y.; Loizou, P.C. Evaluation of objective quality measures for speech enhancement. IEEE Trans. Audio Speech Lang. Process. 2008, 16, 229–238. [Google Scholar] [CrossRef]
  67. Klatt, D. Prediction of perceived phonetic distance from critical band spectra: A first step. In Proceedings of the International Conference on Acoustics, Speech, and Signal Processing (ICASSP), Paris, France, 3–5 May 1982; pp. 1278–1281. [Google Scholar]
  68. Tribolet, J.; Noll, P.; McDermott, B.; Crochiere, R.E. A study of complexity and quality of speech waveform coders. In Proceedings of the International Conference on Acoustics, Speech, and Signal Processing (ICASSP), Tulsa, OK, USA, 10–12 April 1978. [Google Scholar]
  69. Jensen, J.; Taal, C.H. An Algorithm for Predicting the Intelligibility of Speech Masked by Modulated Noise Maskers. IEEE/ACM Trans. Audio Speech Lang. Process. 2016, 24, 2009–2022. [Google Scholar] [CrossRef]
  70. Ma, J.; Hu, Y.; Loizou, P. Objective measures for predicting speech intelligibility in noisy conditions based on new band-importance functions. Acoust. Soc. Am. 2009, 125, 3387–3405. [Google Scholar] [CrossRef]
  71. Degottex, G.; Erro, D. A uniform phase representation for the harmonic model in speech synthesis applications. EURASIP J. Audio Speech Music Process. 2014, 38, 1–16. [Google Scholar] [CrossRef]
  72. Fisher, N.I. Statistical Analysis of Circular Data; Cambridge University: Cambridge, UK, 1995. [Google Scholar]
  73. International Telecommunications Union. Method for the Subjective Assessment of Intermediate Audio Quality; ITU-R Recommendation BS.1534; International Telecommunications Union: Geneva, Switzerland, 2001. [Google Scholar]
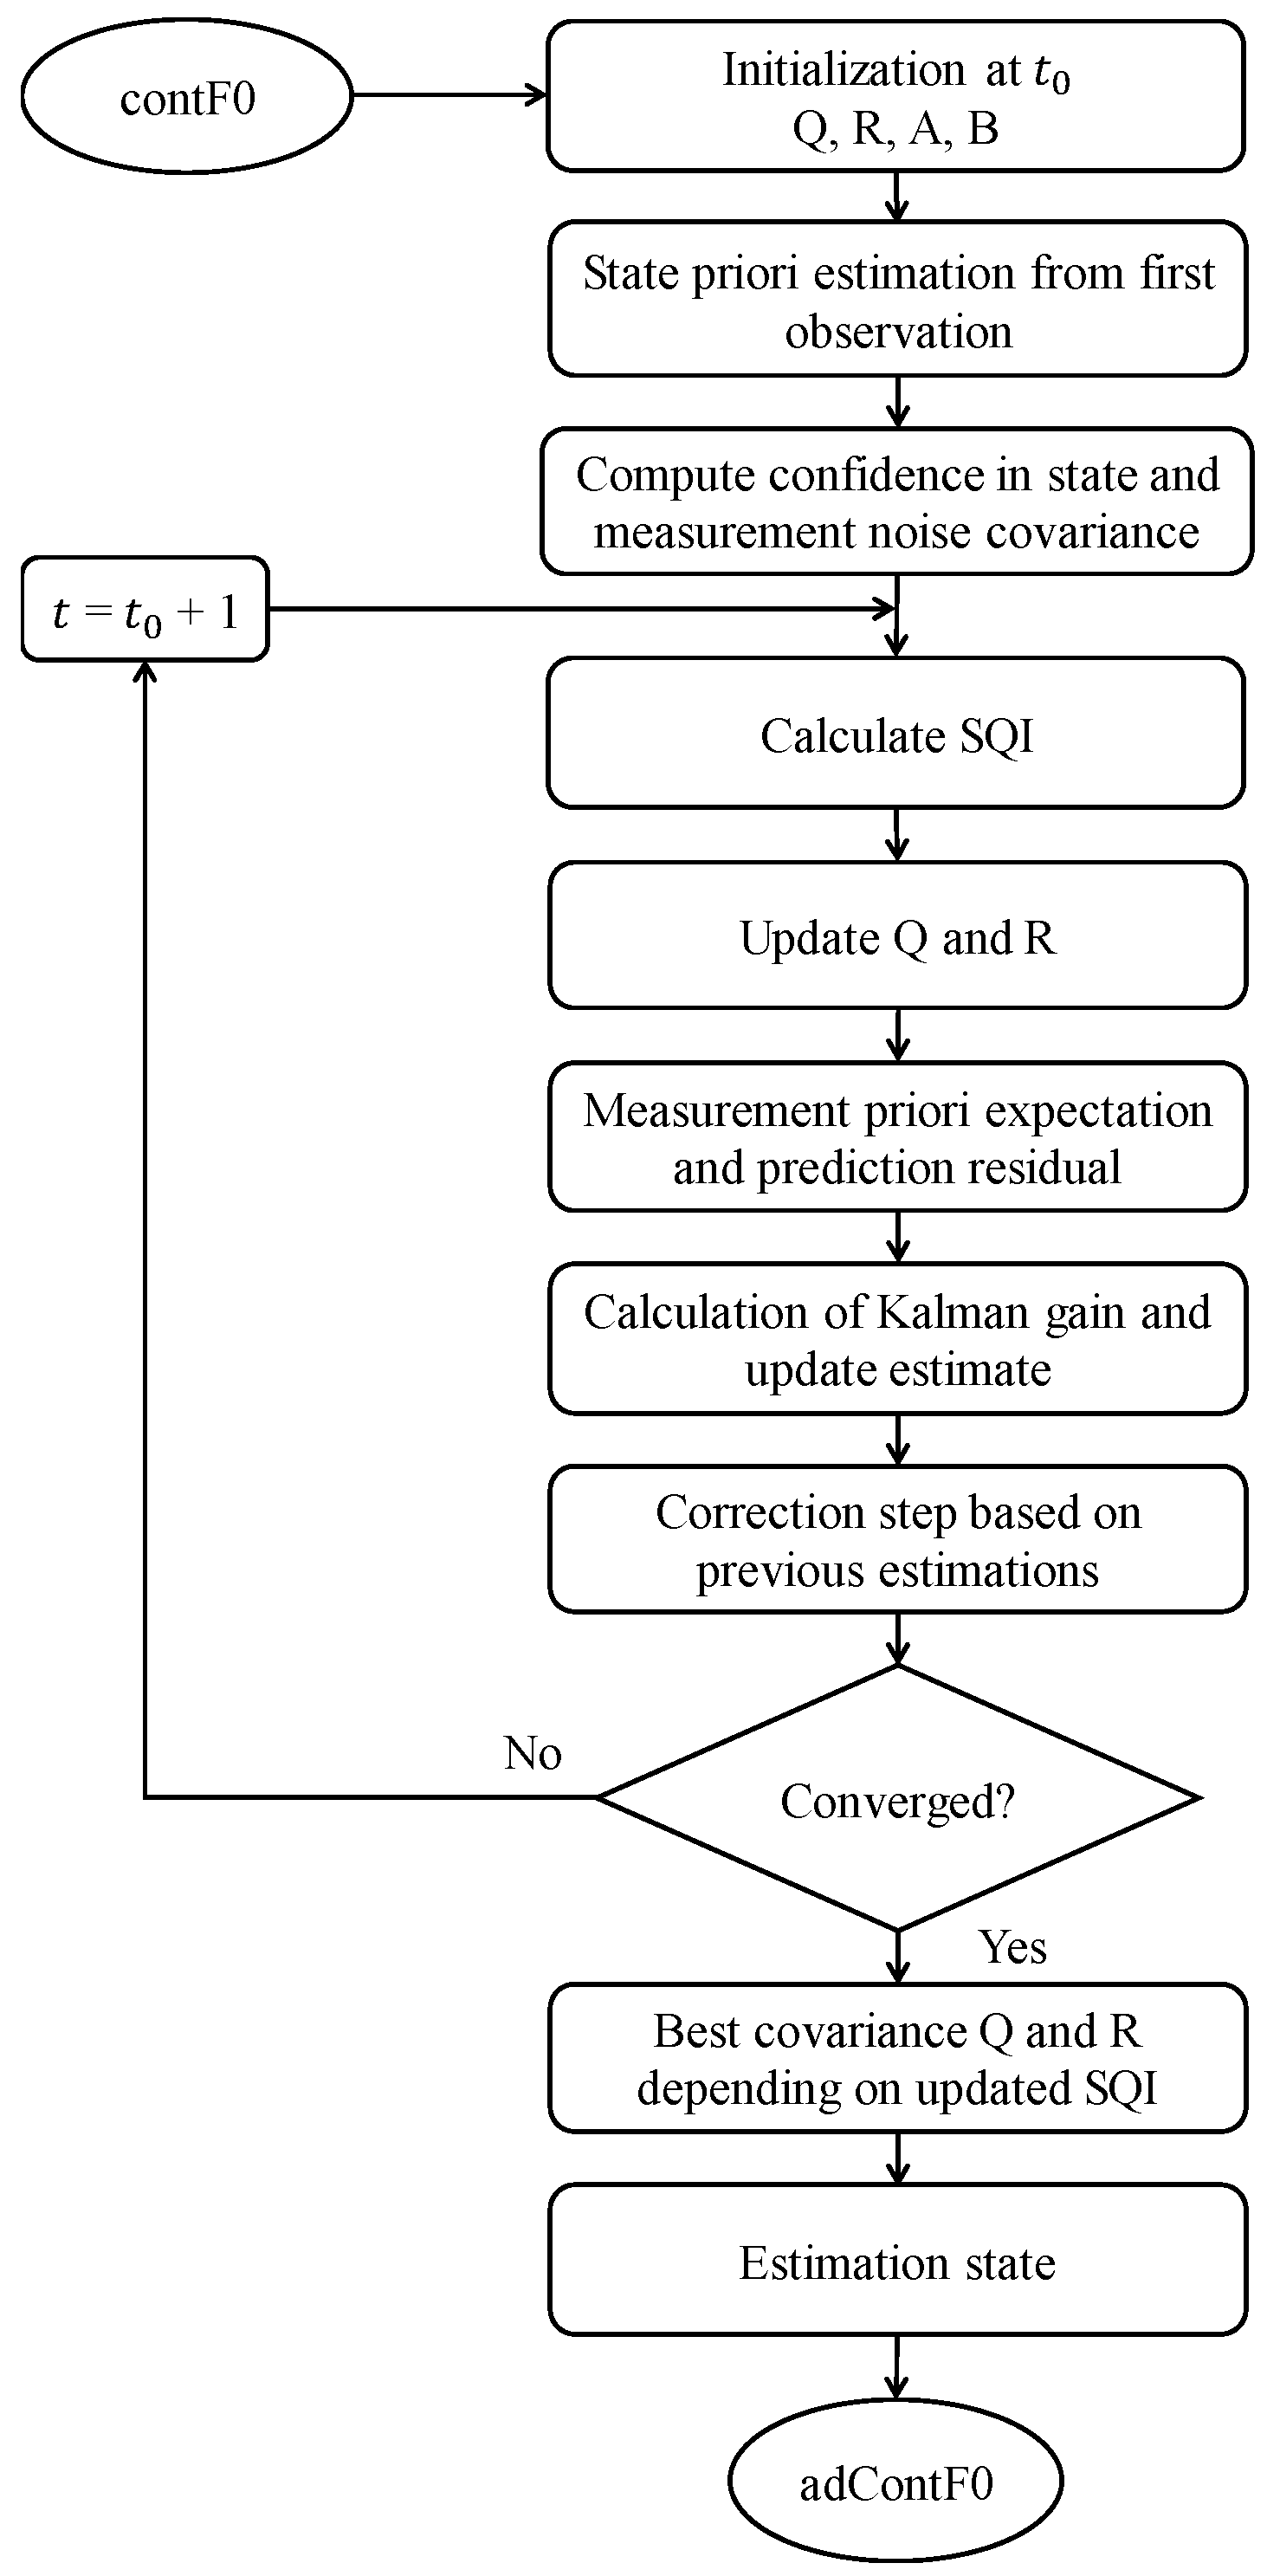
Figure 1. Structure chart of adaptive Kalman filter-based contF0 (adContF0).
Applsci 09 02460 g001
Figure 2. Examples from a female speaker of F0 trajectories estimated by the baseline (red) and ground truth (black) plotted along with proposed refined contF0 (adaptive Kalman filter (AKF), time-warping (TWRP), and StoneMask (STMSK)) methods.
Applsci 09 02460 g002
Figure 3. Illustration of the parametrization of speech with the continuous vocoder. Additions and refines are marked with dashed lines.
Applsci 09 02460 g003
Figure 4. Example of an HNR parameter for the clean speech signal. Sentence: “They die out of spite.” from a male speaker.
Applsci 09 02460 g004
Figure 5. Workflow of the MVF estimation algorithm based on SLM method.
Applsci 09 02460 g005
Figure 6. Importance of the SLM in MVF estimation. Top is the speech waveform from a female speaker, bottom is the spectrogram and MVF contours.
Applsci 09 02460 g006
Figure 7. Influence of the SNR on the average normalized RMSE with proposed refined contF0_AKF (adaptive Kalman filter), contF0_TWRP (time-warping), and contF0_STMSK (StoneMask) methods.
Applsci 09 02460 g007
Figure 8. The periodogram estimate of the PSD for the extracted F0 trajectories.
Applsci 09 02460 g008
Figure 9. Mean PDD values by sentence type.
Applsci 09 02460 g009
Figure 10. Results of the subjective evaluation for the naturalness question. A higher value means greater naturalness. Error bars show the bootstrapped 95% confidence intervals.
Applsci 09 02460 g010
Table 1. Average scores performance per each speaker in clean speech.
MethodGPE %MFPESTD
BDLJMKSLTBDLJMKSLTBDLJMKSLT
baseline12.7549.8507.6773.5583.4284.4214.7564.5136.764
contF0_AKF11.26812.6116.7322.7642.7543.6923.9643.7196.113
contF0_TWRP8.2948.7777.8272.7643.0243.6563.8734.1885.788
contF0_STMSK10.5577.5306.9981.6611.3892.1052.5261.8724.181
YANGsaf4.2312.0494.5921.6581.4522.1422.2391.5754.160
Table 2. Average performance score per each speaker in the presence of additive white noise (SNR = 0 dB).
MethodGPE %MFPESTD
BDLJMKSLTBDLJMKSLTBDLJMKSLT
baseline33.17040.05727.5024.0503.9013.5124.3934.2933.912
contF0_AKF31.72840.86526.1223.2113.2412.8983.4653.6273.448
contF0_TWRP29.46437.83926.9323.1993.1652.8903.4493.5113.186
contF0_STMSK31.41837.05226.3522.1281.8962.0672.1031.6582.058
YANGsaf27.53035.20025.8522.2332.1812.1752.2062.2192.265
Table 3. Average performance score per each speaker in the presence of pink noise (SNR = 0 dB).
MethodGPE %MFPESTD
BDLJMKSLTBDLJMKSLTBDLJMKSLT
baseline25.04126.87033.1242.9192.7992.8453.0612.9363.180
contF0_AKF24.54828.03431.1032.2852.2932.2842.3382.3272.468
contF0_TWRP21.51222.32929.8932.2562.4822.4722.2532.7022.787
contF0_STMSK24.37126.13132.7751.4291.1791.3871.6861.9811.140
YANGsaf15.40112.50922.1861.4191.3071.3932.2822.7322.022
Table 4. An overview of the three proposed methods based on HNR parameters.
MethodPitch Algorithm
Proposed #1adContF0-based adaptive Kalman filter
Proposed #2adContF0-based adaptive Time-warping
Proposed #3adContF0-based adaptive StoneMask
Table 5. Average scores performance based on synthesized speech signal per each speaker.
MetricSpeakerBaselineProposed#1Proposed#2Proposed#3STRAIGHT
fwSNRsegBDL8.08311.81211.80713.03315.062
JMK6.8169.5059.78410.62113.094
SLT7.6059.9069.73611.07915.295
NCMBDL0.6500.8500.8540.9130.992
JMK0.6200.8470.8600.9060.963
SLT0.6730.8500.8540.9100.991
ESTOIBDL0.6420.8560.8610.8920.923
JMK0.6200.8310.8470.8730.895
SLT0.6790.8480.8460.8940.945
LLRBDL0.8200.4570.4560.4530.219
JMK0.8140.6350.6310.6280.391
SLT0.7440.6390.6400.6360.194
WSSBDL48.56932.87532.55924.01322.144
JMK51.78836.23632.17526.23829.748
SLT58.04342.78945.25426.90623.614