Article

Analysis of the Molecular Interactions between Cytochromes P450 3A4 and 1A2 and Aflatoxins: A Docking Study

by
Isui Abril García-Montoya
1,
Norma Rosario Flores-Holguín
2,
Linda-Lucila Landeros-Martínez
1,
Mónica Alvarado-González
3,
Quintín Rascón-Cruz
1,
María Elena Fuentes-Montero
1,
Pedro Palomares-Báez
1 and
Luz María Rodríguez-Valdez
1,*
1
Facultad de Ciencias Químicas, Universidad Autónoma de Chihuahua, Chihuahua 31125, Mexico
2
Grupo Nanocosmos, Centro de Investigación en Materiales Avanzados, Chihuahua 31136, Mexico
3
Centro de Investigación en Alimentación y Desarrollo A.C. Unidad Delicias, Delicias 33088, Mexico
*
Author to whom correspondence should be addressed.
Appl. Sci. 2019, 9(12), 2467; https://doi.org/10.3390/app9122467
Submission received: 30 May 2019 / Revised: 13 June 2019 / Accepted: 13 June 2019 / Published: 17 June 2019
(This article belongs to the Special Issue Novel Methods for Investigating Biomolecular Interactions)

Abstract

:
Mycotoxins known as aflatoxins (AF) are produced as a secondary metabolite by some species of Aspergillus fungi. They are considered carcinogenic, hepatotoxic, teratogenic, and mutagenic. In this study, the molecular structure, chemical reactivity, and charge transfer values of AFB1, B2, G1, and G2 were analyzed using density functional theory. Different methodologies—B3LYP/6-311G(d,p) and M06-2X/6-311G(d,p)—were applied for geometrical calculations. Chemical reactivity parameters were used in the calculation of charge transfer values during the interaction between protein and ligand. The binding energy, the electrostatic interactions, and the amino acids of the active site were determined by molecular docking analysis between AF and cytochromes P450 (3A4 and 1A2), employing different PDB files (CYP3A4:1TQN, 2V0M, 4NY4 and 1W0E, and CYP1A2:2HI4). Molecular docking analysis indicated that the central rings of the AF are involved in the interaction with the HEM group of the active site. The differences in the molecular structure of the AF affect their position regarding the HEM group. The resulting configurations presented considerable variation in the amino acids and the position of the coupling. The charge transfer values showed that there is oxidative damage inside the active site and that the HEM group is responsible for the main charge transferences.

Graphical Abstract

1. Introduction

Aflatoxins (AF) are mycotoxins produced by some species of Aspergillus fungi. It is well known that these molecules are capable of causing death when consumed at high doses and that they co-relate with the occurrence of hepatocellular carcinoma [1]. There are four major naturally produced aflatoxins [2]: B1, B2, G1, and G2 (See Figure 1). AFB1 is the most common aflatoxin found in foods. It has relevance in health problems associated with mutagenesis and carcinogenesis [3]. Due to the amount of information showing that AFB1 increases the risk of hepatocellular carcinoma (HCC) [4], this aflatoxin is classified by the International Agency for Research on Cancer (IARC) as a carcinogen agent of Group 1.
Aflatoxins are metabolized by cytochrome P450 (CYP450), mainly by CYP3A4 and CYP1A2 enzymes. The double bond in the furan ring of AFB1 and AFG1 suffers an epoxidation reaction producing an exo-8,9-epoxide, which can bind to DNA, forming adducts that are linked to hepatocellular carcinoma [5,6]. CYP450 is a superfamily of hemoproteins with catalytic functions, which makes molecules more hydrosoluble and polar in order to be excreted [7]. Around 95% of all organic chemical compounds that are metabolized (oxidation/reduction reactions) are developed by CYP450 [8].
The objective of this study was to describe the active site of the CYP3A4 and CYP1A2 enzymes with aflatoxins B1, B2, G1, and G2 by molecular docking analysis. In general, this computational technique predicts the most stable conformation of a molecule when it is joined to another, thereby providing an idea of how these molecules can potentially bind in vivo or in vitro [9]. The electron transfer (ΔN) inside CYP450 is recognized as an essential process in different metabolic pathways. Thus, modeling the interaction process of the ligand within the activated catalytic cycle provides a reliable approximation of the intermolecular characteristics of the oxidative process [10,11].
In this work, the geometry optimization of the aflatoxins BI, B2, G1, and G2 with two different theoretical methodologies is reported. These geometries were used for molecular docking analysis, predicting the possible electrostatic interactions, the amino acids of the active site, and the binding energies with two proteins: CYP3A4 and CYP1A2. AFB1 was analyzed with several PDB IDs for CYP3A4 to identify the main differences in the active site of the crystallographic structures of the protein. Afterward, single point energy calculations were performed in order to obtain the chemical reactivity parameters. The ionization potential (I), the electron affinity (EA), the chemical potential (μ), and the chemical hardness (η) were used in the determination of charge transfer in the oxidative process of AFB1 inside the protein. The calculation pathway used for quantum chemical calculations and molecular docking analysis is shown in Scheme 1.

2. Computational Details

2.1. Quantum Chemical Calculations

Firstly, aflatoxins B1, B2, G1, and G2 were studied using density functional theory (DFT) methods. These calculations involved two approximations of the quantum potential—1) Becke’s three-parameter hybrid functional with Lee–Yang–Parr’s correlation B3LYP [12] and 2) the meta GGA functional M06-2X [13]—both in combination with a 6-311G(d,p) polarized basis set. Geometrical optimizations were performed for isolated molecules in the gas phase and in water solution. The later was simulated by employing the IEFPCM solvation method [14,15]. After selecting the structures which corresponded to a minimum of the total energy hypersurface, they were compared with X-ray diffraction data. Later on, this comparison was used for the selection of the best methodology for the analysis of the aflatoxin B1 molecular structure [16]. All the computational studies were performed using the Gaussian 09 suite of programs [17].

2.2. Preparation of Proteins for Molecular Docking Calculations

The crystal structures of enzymes CYP3A4 and CYP1A2 were taken from the Protein Data Bank for the simulation of human cytochrome P450. The molecular docking analysis involved different structures: 1) for CYP3A4, the structure 1TQN code (resolution 2.05Å) [18], 1W0E code (resolution 2.8 Å) [19], 4NY4 code (resolution 2.95 Å) [20], and 2V0M code (resolution 2.8 Å) [21], and 2) for the CYP1A2, the structure 2HI4 code (resolution 1.95Å) [22]. See the Supplementary Information for details. The proteins were prepared using the PyMOL [23] program, where water molecules were dismissed. Docking studies were carried out only in one lobule of the protein.

2.3. Molecular Docking

The Autodock 4.2 [24] program was used for docking simulations. Polar hydrogens were added to the protein during the simulation of the intermolecular interactions in the active site between protein and ligand. For these calculations, the protein remained rigid while the ligand was flexible. The optimized structures of AFB1, AFB2, AFG1, and AFG2 calculated with the DFT methodologies previously described were used as ligands within these docking simulations. According to the literature [7,8], it has been reported that the CYP450 catalytic site is located in the HEM group; therefore, the criterion used to define the grid box in the analysis of the couplings was determined by the HEM group localization in the macromolecule. The conditions for docking analysis were as follows. For 1TQN, we used a grid box size of 100 × 86 × 68 Å and a spacing between grid points of 0.220 Å with a center point at x = −12.884, y = −21.822 z = −11.675; for 1W0E, a grid box size of 40 × 40 × 40 Å, spacing of 0.375 Å, center point at x = 58.593 y = 77.393 z = 14.403 Å; for 4NY4, a grid box of 40 × 40 × 40 Å, spacing of 0.375 Å, center point at x = −19.637, y = −24.245, z = −14.04 Å; for 2V0M, grid box size of 48 × 58 × 50 Å, spacing of 0.375 Å, center point at x = 26.579 y = 1.552 z = 5.622 Å; while for the 2HI4 macromolecule, the grid box size was 60 × 44 × 58 Å with spacing of 0.331 Å between points and a center point at x = 4.369, y = 24.489, z = 23.016 Å. A genetic algorithm in combination with a Lamarkian algorithm was selected for searching the best coupling conformations. Ten positions of conformers were considered for calculations, and we selected the one with the lowest binding energy for the active site analysis.

2.4. Chemical Reactivity and Energy Calculations

The amino acids of the active site of each macromolecule (CYP3A4: 1TQN, 2V0M, 4NY4, and 1W0E; CYP1A2: 2HI4) were isolated using the PyMOL program [23]. The original atomic positions and conformations of the amino acids were not modified. The global chemical reactivity parameters [25], such as ionization potential (I), electron affinity (EA), electronegativity (χ), chemical potential (μ), and chemical hardness (η), were calculated for each residue with the functional M06 [13] and the 6-311G(d,p) basis set (see Equations (1)–(4)). The same functional was used to perform identical calculations, but we also employed the LANL2DZ [26] pseudopotential on the metal atom (Fe) that belongs to the HEM group.
This methodology was selected according to previously reported results for similar compounds [27]. Koopmans’ theorem was applied for the approximation of the I and EA from the HOMO (highest occupied molecular orbital) and LUMO (lowest unoccupied molecular orbital) energies, respectively (see Equations (1) and (2)). The reactivity parameters were used for the determination of the charge transfer (ΔN) [25], which describes the fractional number of transferred electrons from System A to System B. In this work, System A is the aflatoxin and System B is any of the amino acids and the HEM group from the active site (see Equation (5)). Only AFB1 was analyzed, as this aflatoxin presents an epoxidation reaction and can form an adduct with DNA [5,6]. Positive values of ΔN indicate that the systems are electron donors, while negative values indicate that the systems are electron acceptors.
I = E H O M O
A = E L U M O
μ = χ =   1 2 ( I + A ) 1 2 ( E H O M O + E L U M O )
η =   1 2 ( I A ) 1 2 ( E L U M O E H O M O )
Δ N = μ B   μ A 2 ( η A +   η B )

3. Results and Discussion

3.1. Geometry Optimization

The geometrical parameters of AFB1 are described in Table 1. These parameters were calculated using two methodologies: B3LYP/6-311G(d,p) and M06-2X/6-311G(d,p) (see the Supplementary Information). Afterwards, the resulting bond distances and angles were used to evaluate which of the two approximations adjusted the best to the experimental data. Table 1 shows correlations up to 0.99 for bond distances in the gas and solvent phases. For bond angles, the correlations were better in the gas phase than in the solvent phase, with values up to 0.97 in the gas phase. Based on these results, it was decided to work with the two functionals in combination with the same basis set, as both methodologies presented a correct description of the molecular structure of aflatoxins. The absence of imaginary frequencies confirmed the global minima in the potential energy surface. The optimized structures of the aflatoxins were used for the remaining calculations. Figure 2 shows the optimized structures of aflatoxins calculated with B3LYP/6-311G(d,p) in the gas phase.

3.2. Docking Analysis

3.2.1. Molecular Interactions between CYP 3A4 (1TQN PDB ID) and AFB1, B2, G1, and G2

Table 2 summarizes the outcome of the dockings between the aflatoxins B1, B2, G1, and G2 with the protein CYP3A4. The docking results between 1TQN and the AF were used to analyze the main differences in the active site, as different methodologies were used in the initial geometry optimization of the aflatoxins (see Scheme 1). The computations showed no significant differences when using the functional M06-2X or B3LYP in the determination of the AF molecular geometries. However, the results of the binding energy indicated that this energy was more stable when the M06-2X functional was used.
In agreement with the calculations, the structural difference between aflatoxins B and G could be responsible for the hydrogen bond formation—that is, for the hydrogen bond with the oxygen atom belonging to the second lactone ring of the G group (See Figure 2) and those with the residues of the active site. This significant behavior was not observed in the B group.
Figure 3 shows the interaction types obtained with the docking calculations. It is important to note that the B group stability is determined only by π–π interactions, which are indicated by yellow tubes. Furthermore, the G group presented hydrogen bonds and fewer π–π interactions. The hydrogen bonds are indicated with green dotted lines in Figure 3.
A cation–π interaction between Arg 105 and the C17 atom of aflatoxins B1 and B2 was found. This interaction was observed with both functionals, M06-2X and B3LYP. The orientation of the best conformation also differs between groups (see Figure 3). In aflatoxins B1 and B2, the HEM group of CYP3A4 attracts the oxygen atom of the lactone and pentone rings, making a planar conformation promoting π–π interactions, while in the G group the same oxygen atom interacts with the residues of the active site.

3.2.2. Molecular Interactions between CYP1A2 (2HI4 PDB ID) and AFB1, B2, G1, and G2

Table 3 describes the molecular interactions between CYP1A2 (2HI4) and the aflatoxins B1, B2, G1, and G2. As can be seen, the functional M06-2X shows a more stable binding energy with almost all aflatoxins. Nevertheless, the B3LYP functional exhibits a more stable binding energy in the B2 interactions with those amino acids belonging to the active site. Figure 4 shows the conformations for the couplings between CYP1A2 and the aflatoxins. In all cases, the best-predicted ligand conformation appears in a position perpendicular to the HEM group. The calculations suggest there are interactions with oxygen 5 and 6 of the B group and 6 and 7 of the G group (see Figure 4). In this analysis, π–π interactions were not predicted. This last finding was observed using both functionals. However, a discrepancy regarding hydrogen bond detection was noticed in the B2 and G1 aflatoxins.
For CYP1A2 with AFB1, our calculated conformation differs from the ones reported by Bonomo et al. in 2017 [28], where they found two conformations: one of them leads to exo-epoxide and the other one leads to endo-epoxide formation. For exo-epoxide, the interaction in the active site with Phe226 was reported by Bonomo et al. [28]. In the present study, the results showed that the predicted coupling could lead to hydroxylation of all the aflatoxins, not only of B1. It is also important to note that in each case, Phe226 was detected in the active site. Sansen et al. in 2007 [22] reported that Gly316, Ala317, Asp320, and Thr321 are important residues in the active site [22], whilst Sohl et al. in 2008 [29] indicated the presence of these amino acids, among others, in the active site of CYP1A2 [29]. In our analysis, the same amino acids were found in the active site (see Table 3).

3.2.3. Molecular Interactions of CYP3A4 with AFB1 Using Different PDB IDs

Because of its high toxicity and carcinogenic ability, AFB1 is the most studied/reported aflatoxin. Due to the double bond in the AFB1 structure, this molecule presents an epoxidation reaction within the cytochrome. The resulting epoxidized aflatoxin can form adducts with DNA. On the other hand, several authors describe different amino acids and conformations in the active site of the cytochrome [28,30,31]. For these reasons, only AFB1 was used in the simulations of the molecular interactions with CYP3A4 using three different files: 2V0M, 4NY4, and 1W0E PDBs. This exploration was made in order to account for these differences within the active site. The calculations were carried out using the M06-2X/6-311G(d,p) level of theory because the first docking analysis of the aflatoxins B1, B2, G1, and G2 with the proteins CYP3A4 (1TQN) and CYP1A2 (2HI4) showed the most stable binding energy when this functional was applied. In our computed models, remarkable differences were found in the conformation of the active site and the orientation of the ligand. Table 4 and Figure 5 show the results, using the amino acids of the active site of 1TQN docking as reference.
Bonomo et al., in 2017 [28], developed a docking analysis of the interaction between AFB1 and CYP3A4, finding different conformations depending on the PDB ID file used in the calculations. The same behavior was observed in our results. The binding pocket could change depending on the ligands included in the original crystallographic structure of the selected protein [8,32]. In another study, using 2V0M PDB ID, it was reported that the interaction with aflatoxin B1 in the active site occurred between the amino acid residues of Leu210, Leu211, and Phe304. These residues are indispensable for the positive homotropic cooperativity of oxidation [30]. However, in our results, these amino acids were not present in the active site.
Sevrioukova et al., in 2013 [31], reported Phe108, Ser119, Ile120, Leu211, Asp214, Ile301, Phe304, Ala305, Thr309, Ala370, and Leu373 as residues involved in the substrate binding, cooperativity, and regioselectivity of CYP3A4. Likewise, Sevrioukova reported that the residues Ser119, Arg212, and Thr224 provide polar contacts. As we can see in Table 4, this information is consistent with the amino acids found in the active sites of the different PDBs studied in this work.
In a previous study, using the CYP3A29 of pig (a human CYP3A4 homolog), it was reported that Thr309 is a residue essential to the correct orientation of AFB1 epoxidation through hydrogen bonding [33]. Our results concur on the role of this amino acid; however, a hydrogen bond was not observed in the interaction. The stability of the conformation for 1TQN PDB was given by π–π interactions between the central aromatic ring of AFB1 and the five rings of the HEM group (see Figure 5A). For 1W0E PDB, no hydrogen bonds or π–π interactions were detected (see Figure 5C). In the case of 4NY4 PDB, a hydrogen bond (Leu 483-O3) was observed (see Figure 5D), whereas for 2V0M PDB, the stability was given by π–π interactions between the central ring of AFB1 and the HEM group rings, as well as by a cation–π interaction between Arg 105 and C17 (see Figure 5B).

3.3. Quantum Chemical Calculations

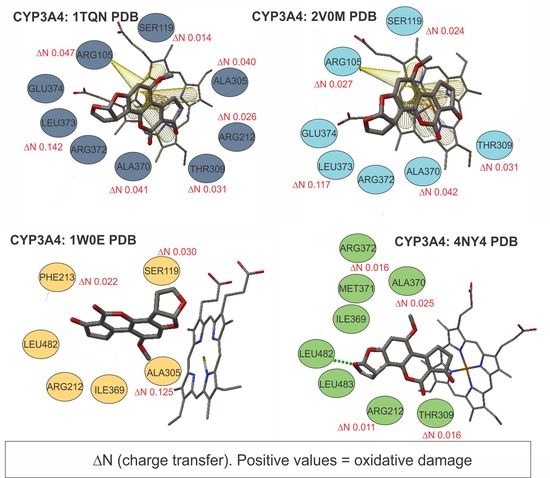
3.3.1. Chemical Reactivity and Charge Transfer Calculations (ΔN) for Protein CYP3A4 (1TQN, 20VM, 4NY4, and 1W0E PDB) with AFB1

Calculated chemical reactivity parameters were used for the determination of the charge transfer parameter (ΔN) during the interaction between the protein and ligand. In this analysis, different PDB files for CYP3A4 (1TQN, 20VM, 4NY4, 1W0E) were employed in order to describe the active site and all the residues involved in the interactions with AFB1. These parameters were approximated using Koopmans’ theorem as stated in Section 2.4 (see Equations (1)–(5)). They were calculated using the M06/6-311G(d,p) methodology, with the exception of the LANL2DZ pseudopotential for the Fe atom of the HEM group.
Table 5 presents the results for the interaction of AFB1 and the corresponding amino acids of the CYP3A4 protein. In this table are mainly included the amino acids reported for the 1TQN PDB ID because this calculation showed the highest number of amino acids interacting with the AFB1 aflatoxin.
As can be observed in Table 5, the reactivity parameters obtained for AFB1 after the docking calculations using several PDB IDs for CYP3A4 show a slight difference in their HOMO and LUMO energy values. This can be attributed to the electronic density rearrangements during the interaction with different amino acids in the active site. These values of the HOMO and LUMO energies lead to different values of the reactivity parameters. Table 6 shows the ΔN calculated for each residue. They match with the results obtained using the 1TQN file.
It is important to note that each PDB file presented different conformations inside the active site. As mentioned in the Section 2.4, positive values of ΔN indicate that the compound is an electron donor, while negative values indicate that the compound is an electron acceptor. As noted in Table 6, all the calculated values of ΔN using different PDB IDs are positive, which means that once the ligand is inside the active site, it acts as an electron acceptor, while the protein residues behave as electron donors. These ΔN values could highlight the oxidative process involved in the chemical reaction occurring inside the active site. Figure 6 shows the calculated ΔN of each residue of CYP3A4 when they are in contact with the ligand AFB1.

3.3.2. Chemical Reactivity and Charge Transfer Calculations (ΔN) for Protein CYP1A2 (2HI4 PDB) with AFB1

In order to obtain the chemical reactivity parameters described in Table 7, all the amino acids involved in the interaction between AFB1 and CYP1A2 were isolated. The HOMO and LUMO energy values of the AFB1 were similar to those obtained in the interaction with CYP3A4 (see Table 5). This similarity could be indicative that the electron density of AFB1 presents the same perturbation during the interactions inside the active site. Meanwhile, the HEM group showed similar values of chemical reactivity parameters when these were compared with the values obtained with CYP3A4.
Table 8 details the ΔN values obtained for the amino acids related to the interaction with AFB1 inside protein CYP1A2. Unlike for CYP3A4, negative values for ΔN were found, specifically for the aspartic acid residues that acted as electron acceptors. The rest of the amino acids presented electron donor behavior with positive ΔN values (see Figure 7). It is remarkable that for all ΔN values calculated, the HEM group presented the highest positive values, falling in the range of 0.6–0.8. This behavior was observed for each CYP450 (1A2 and 3A4), demonstrating that electron transference is taking place.
This level of interaction between amino acids and ligands could be related to the charge transfer values, which means that the higher the ΔN values, the higher the interaction between compounds [34,35]. As was expected, the HEM group was responsible for the main interaction in the active site, with ΔN values higher than 0.6. In the same way, the oligopeptides are second in the order of interaction with AFB1. Thus, finally, there are specific peptides with less electron donor activity contributing to the oxidative process (see Table 8).
The observed differences in the interactions between CYP450 and AF, using several approaches of molecular modeling, provide a better understanding of the AF-CYP450 complex. Techniques like molecular docking and quantum chemical methods [36] and multivalent/multitargeted systems [37] are efficient approaches to determine the drug–macromolecule interactions and can lead to the design of specific drugs for the prevention or treatment for the toxicity of these aflatoxins.

4. Conclusions

In this study, the interactions between aflatoxins B1, B2, G1, and G2 and the proteins CYP1A2 and CYP3A4 using different PDB files were modeled by DFT and molecular docking. This analysis allowed a complete study of the molecular interactions, where the following conclusions should be remarked:
The observed differences in the binding energies between the amino acids and aflatoxins were related to the theoretical methodology used in the geometric calculations of the ligands. The functional M06-2X in combination with the 6-311G(d,p) basis set indicated couplings with more stable energies.
The aflatoxins’ position within the active site was related to their molecular structure. The differences between the groups B and G were associated with an extra lactone ring present in the latter. Group B aflatoxins were oriented in a parallel position regarding the HEM group, while group G adopted a direction perpendicular to that of the HEM.
The electrostatic interactions, such as the hydrogen bonds, cation–π interactions, and π–π stacking, were determined by the chemical structure of the AF and the position of the coupling.
The fractional number of transferred electrons (ΔN) showed that the HEM group was responsible for the main interactions in the active site with aflatoxin B1. These values might indicate that enzymes CYP 1A2 and 3A4 suffer oxidative damage when they metabolize this aflatoxin.
It is important to note that at least one oxygen atom appeared near the HEM group in most of the calculated conformations. This behavior can be explained by the ability of the HEM group to transfer electrons to the oxygen atom and catalyze oxidation reactions in organic compounds. This ability of the HEM group could be the reason for the different conformations inside the active site.
It was demonstrated that the demarcation of the binding pocket depends on the ligands included in the original crystallographic structure of the selected PDB file. The use of only one protein PDB file for calculations could not provide accurate information on the active site. However, it was an excellent approximation for the determination of the active site and the interactions with the AF.
The molecular docking analysis between aflatoxins and cytochrome P450 showed the complexity of the interactions between them. For this reason, it is recommended to continue the analysis of the molecular structure of the AF and their epoxidation reaction by a molecular relaxation of the active site in order to allow complete interaction between protein and ligand.

Supplementary Materials

The following are available online at https://www.mdpi.com/2076-3417/9/12/2467/s1, S2: Optimized geometries and Cartesian coordinates for aflatoxins AFB1, AFB2, AFG1 and AFG2 obtained with DFT:B3LYP/6-311G(d,p) and DFT:M06-2X/6-311G(d,p); S10: Fasta sequence of different PDB ID’s of Cytochrome P450 3A4 obtained from Protein Data Bank; S11: Fasta sequence of Cytochrome P450 1A2 obtained from Protein Data Bank.

Author Contributions

Formal analysis, I.A.G.-M. and L.-L.L.-M.; Investigation, I.A.G.-M.; Methodology, N.R.F.-H.; Project administration, L.M.R.-V.; Writing—original draft, I.A.G.-M., L.-L.L.-M. and L.M.R.-V.; Writing—review and editing, M.A.-G., Q.R.-C., M.E.F.-M., P.P.-B. and L.M.R.-V.

Funding

This research was funded by Consejo Nacional de Ciencia y Tecnología, grant number 230319.

Acknowledgments

IAGM thanks Consejo Nacional de Ciencia y Tecnología for doctoral grant 230319. IAGM and NRFH acknowledge Centro de Investigación en Materiales Avanzados for a research stay. MAG thanks Centro de Investigación en Alimentación y Desarrollo for their support of this project. All the researchers are grateful to Universidad Autónoma de Chihuahua for the support and infrastructure provided.

Conflicts of Interest

The authors declare no conflict of interest. The founding sponsors had no role in the design of the study, in the collection, analyses or interpretation of data; in the writing of the manuscript; or in the decision to publish the results.

References

  1. Bbosa, G.S.; Kitya, D.; Lubega, A.; Ogwal-Okeng, J.; Anokbonggo, W.W.; Kyegombe, D.B. Review of the Biological and Health Effects of Aflatoxins on Body Organs and Body Systems. In Aflatoxins-Recent Advances and Future Prospects; Razzaghi-Abyaneh, M., Ed.; InTech: Rijeka, Croatia, 2013; Ch. 12. [Google Scholar] [CrossRef] [Green Version]
  2. Sweeney, M.J.; Dobson, A.D.W. Mycotoxin production by Aspergillus, Fusarium and Penicilliium species. Int. J. Food Microbiol. 1998, 43, 141–158. [Google Scholar] [CrossRef]
  3. Lizárraga-Paulín, E.G.; Moreno-Martínez, E.; Miranda-Castro, S.P. Aflatoxins and Their Impact on Human and Animal Health: An Emerging Problem. In Aflatoxins—Biochemistry and Molecular Biology; InTech: Rijeka, Croatia, 2011; pp. 255–284. [Google Scholar]
  4. Anttila, A.; Bhat, R.V.; Bond, J.A.; Borghoff, S.J.; Bosch, F.X.; Carlson, G.P.; Castegnaro, M.; Cruzan, G.; Gelderblom, W.C.; Hass, U.; et al. IARC monographs on the evaluation of carcinogenic risks to humans. Some traditional herbal medicines, some mycotoxins, naphthalene and styrene. IARC Monogr. Eval. Carcinog. Risks Hum. 2002, 82, 1–556. [Google Scholar] [CrossRef]
  5. Kensler, T.W.; Roebuck, B.D.; Wogan, G.N.; Groopman, J.D. Aflatoxin: A 50-year Odyssey of mechanistic and translational toxicology. Toxicol. Sci. 2011, 120 (Suppl. 1), 28–48. [Google Scholar] [CrossRef] [PubMed]
  6. Carvajal-Moreno, M. Metabolic Changes of Aflatoxin B1 to become an Active Carcinogen and the Control of this Toxin. Immunome Res. 2015, 11, 1. [Google Scholar] [CrossRef]
  7. González, J.C.R.; Guerra, I.R. El sistema citocromo P450 y el metabolismo de xenobióticos Cytochrome P450 system and xenobiotic metabolism. Rev. Cuba. Farm. 2014, 48, 495–507. [Google Scholar]
  8. Guengerich, F.P.; Waterman, M.R.; Egli, M. Recent Structural Insights into Cytochrome P450 Function. Trends Pharmacol. Sci. 2016, 37, 625–640. [Google Scholar] [CrossRef] [Green Version]
  9. Landeros-Martinez, L.-L.; Flores-Holguín, N. Predicción de la reactividad química de tamoxifeno en receptores hormonales. Mem. Congr. Investig. Cient. Multidiscip. 2017, 4, 24–38. [Google Scholar]
  10. Jett, J.E.; Lederman, D.; Wollenberg, L.A.; Li, D.; Flora, D.R.; Bostick, C.D.; Tracy, T.S.; Gannett, P.M. Measurement of electron transfer through cytochrome p450 protein on nanopillars and the effect of bound substrates. J. Am. Chem. Soc. 2013, 135, 3834–3840. [Google Scholar] [CrossRef]
  11. Kumar, V.; Jain, G.; Kishor, S.; Ramaniah, L.M. Chemical reactivity analysis of some alkylating drug molecules—A density functional theory approach. Comput. Theor. Chem. 2011, 968, 18–25. [Google Scholar] [CrossRef]
  12. Stephens, P.J.; Devlin, F.J.; Chabalowski, C.F.; Frisch, M.J. Ab Initio Calculation of Vibrational Absorption and Circular Dichroism Spectra Using Density Functional Force Fields. J. Phys. Chem. 1994, 98, 11623–11627. [Google Scholar] [CrossRef]
  13. Zhao, Y.; Truhlar, D.G. The M06 suite of density functionals for main group thermochemistry, thermochemical kinetics, noncovalent interactions, excited states, and transition elements: Two new functionals and systematic testing of four M06-class functionals and 12 other function. Theor. Chem. Acc. 2008, 120, 215–241. [Google Scholar] [CrossRef]
  14. Amovilli, C.; Barone, V.; Cammi, R.; Cancès, E.; Cossi, M.; Mennucci, B.; Pomelli, C.S.; Tomasi, J. Recent Advances in the Description of Solvent Effects with the Polarizable Continuum Model. In Advances in Quantum Chemistry; Löwdin, P.-O., Ed.; Academic Press: Cambridge, MA, USA, 1998; Volume 32, pp. 227–261. [Google Scholar]
  15. Mennucci, B.; Cancès, E.; Tomasi, J. Evaluation of Solvent Effects in Isotropic and Anisotropic Dielectrics and in Ionic Solutions with a Unified Integral Equation Method: Theoretical Bases, Computational Implementation, and Numerical Applications. J. Phys. Chem. B 1997, 101, 10506–10517. [Google Scholar] [CrossRef]
  16. Van Soest, T.C.; Peerdeman, A.F. The crystal structures of aflatoxin B1. I. The structure of the chloroform solvate of aflatoxin B1 and the absolute configuration of aflatoxin B1. Acta Cryst. B 1970, 26, 1940–1947. [Google Scholar] [CrossRef]
  17. Frisch, M.J.; Trucks, G.W.; Schlegel, H.B.; Scuseria, G.E.; Robb, M.A.; Cheeseman, J.R.; Scalmani, G.; Barone, V.; Mennucci, B.; Petersson, G.A.; et al. Gaussian 09, Revision A.02. Gaussian 09, Revision B.01; Gaussian, Inc.: Wallingford, CT, USA, 2009. [Google Scholar]
  18. Yano, J.K.; Wester, M.R.; Schoch, G.A.; Griffin, K.J.; Stout, C.D.; Johnson, E.F. The structure of human microsomal cytochrome P450 3A4 determined by X-ray crystallography to 2.05 A resolution. J. Biol. Chem. 2004, 279, 38091–38094. [Google Scholar] [CrossRef]
  19. Williams, P.A.; Cosme, J.; Vinković, D.M.; Ward, A.; Angove, H.C.; Day, P.J.; Vonrhein, C.; Tickle, I.J.; Jhoti, H. Crystal Structures of Human Cytochrome P450 3A4 Bound to Metyrapone and Progesterone. Science 2004, 305, 683–686. [Google Scholar] [CrossRef]
  20. Brändén, G.; Sjögren, T.; Schnecke, V.; Xue, Y. Structure-based ligand design to overcome CYP inhibition in drug discovery projects. Drug Discov. Today 2014, 19, 905–911. [Google Scholar] [CrossRef]
  21. Ekroos, M.; Sjögren, T. Structural basis for ligand promiscuity in cytochrome P450 3A4. Proc. Natl. Acad. Sci. USA 2006, 103, 13682–13687. [Google Scholar] [CrossRef] [Green Version]
  22. Sansen, S.; Yano, J.K.; Reynald, R.L.; Schoch, G.A.; Griffin, K.J.; Stout, C.D.; Johnson, E.F. Adaptations for the oxidation of polycyclic aromatic hydrocarbons exhibited by the structure of human P450 1A2. J. Biol. Chem. 2007, 282, 14348–14355. [Google Scholar] [CrossRef]
  23. DeLano, W.L. The PyMOL Molecular Graphics System; DeLano Scientific LLC: San Carlos, CA, USA, 2002. [Google Scholar]
  24. Morris, G.M.; Huey, R.; Lindstrom, W.; Sanner, M.F.; Belew, R.K.; Goodsell, D.S.; Olson, A.J. AutoDock4 and AutoDockTools4: Automated docking with selective receptor flexibility. J. Comput. Chem. 2009, 30, 2785–2791. [Google Scholar] [CrossRef] [Green Version]
  25. Parr, R.G.; Pearson, R.G. Absolute hardness: Companion parameter to absolute electronegativity. J. Am. Chem. Soc. 1983, 105, 7512–7516. [Google Scholar] [CrossRef]
  26. Hay, P.J.; Wadt, W.R. Ab initio effective core potentials for molecular calculations. Potentials for the transition metal atoms Sc to Hg. J. Chem. Phys. 1985, 82, 270–283. [Google Scholar] [CrossRef]
  27. Martinez-Araya, J.I.; Glossman-Mitnik, D. Assessment of ten density functionals through the use of local hyper—Softness to get insights about the catalytic activity Iron—Based organometallic compounds for ethylene polymerization as testing molecules. J. Mol. Model. 2018, 24, 42. [Google Scholar] [CrossRef] [PubMed]
  28. Bonomo, S.; Jørgensen, F.S.; Olsen, L. Dissecting the Cytochrome P450 1A2- and 3A4-Mediated Metabolism of Aflatoxin B1 in Ligand and Protein Contributions. Chem. Eur. J. 2017, 23, 2884–2893. [Google Scholar] [CrossRef] [PubMed]
  29. Sohl, C.D.; Isin, E.M.; Eoff, R.L.; Marsch, G.A.; Stec, D.F.; Guengerich, F.P. Cooperativity in oxidation reactions catalyzed by cytochrome P450 1A2: Highly cooperative pyrene hydroxylation and multiphasic kinetics of ligand binding. J. Biol. Chem. 2008, 283, 7293–7308. [Google Scholar] [CrossRef] [PubMed]
  30. Bren, U.; Fuchs, J.E.; Oostenbrink, C. Cooperative binding of aflatoxin B1 by cytochrome P450 3A4: A computational study. Chem. Res. Toxicol. 2014, 27, 2136–2147. [Google Scholar] [CrossRef] [PubMed]
  31. Sevrioukova, I.F.; Poulos, T.L. Understanding the mechanism of cytochrome P450 3A4: Recent advances and remaining problems. Dalton Trans. 2013, 42, 3116–3126. [Google Scholar] [CrossRef]
  32. Gay, S.C.; Roberts, A.G.; Halpert, J.R. Structural Features of Cytochromes P450 and Ligands that Affect Drug Metabolism as Revealed by X-ray Crystallography and NMR. Future Med. Chem. 2010, 2, 1451–1468. [Google Scholar] [CrossRef]
  33. Wu, J.; Chen, R.; Zhang, C.; Li, K.; Xu, W.; Wang, L.; Chen, Q.; Mu, P.; Jiang, J.; Wen, J.; et al. Bioactivation and regioselectivity of pig cytochrome P450 3A29 towards aflatoxin B1. Toxins 2016, 8, 267. [Google Scholar] [CrossRef]
  34. Wang, X.; Song, L.; Tian, C.; He, J.; Wang, S.; Wang, J.; Li, C. DFT Investigation of the Effects of Coexisting Cations and Complexing Reagents on Ni(II) Adsorption by a Polyvinylidene Fluoride-Type Chelating Membrane Bearing Poly(Amino Phosphonic Acid) Groups. Metals 2017, 7, 61. [Google Scholar] [CrossRef]
  35. Song, L.Z.; Zhou, W.Y.; Wang, X.L.; He, J.; Han, K.D.; Niu, L.J. Interaction of Chlorpyrifos with Purine Bases: A Study of Electrochemical Measurement and Density Functional Theory Calculation. Asian J. Chem. 2015, 27, 2445–2451. [Google Scholar] [CrossRef]
  36. Dutkiewicz, Z.; Mikstacka, R. Structure-Based Drug Design for Cytochrome P450 Family 1 Inhibitors. Bioinorg. Chem. Appl. 2018, 2018. [Google Scholar] [CrossRef] [PubMed]
  37. Legnani, L.; Compostella, F.; Sansone, F.; Toma, L. Cone Calix[4]arenes with Orientable Glycosylthioureido Groups at the Upper Rim: An In-Depth Analysis of Their Symmetry Properties. J. Org. Chem. 2015, 80, 7412–7418. [Google Scholar] [CrossRef] [PubMed]
Figure 1. Aflatoxins’ chemical structure.
Applsci 09 02467 g001
Scheme 1. Calculation scheme used in the quantum chemical calculations and molecular docking analysis.
Applsci 09 02467 sch001
Figure 2. Optimized molecular structure of aflatoxins calculated with B3LYP/6-311G(d,p) in the gas phase.
Applsci 09 02467 g002
Figure 3. Analysis of the molecular interactions in the active site of CYP 3A4 (1TQN PDB ID) with ligands AFB1, AFB2, AFG1, and AFG2. π–π interactions are indicated as yellow tubes and hydrogen bonds are indicated with green dotted lines.
Applsci 09 02467 g003
Figure 4. Analysis of the molecular interactions in the active site of CYP1A2 (2HI4 PDB ID) with ligands AFB1, AFB2, AFG1, and AFG2. Hydrogen bonds are indicated with green dotted lines.
Applsci 09 02467 g004
Figure 5. Analysis of the molecular interactions between aflatoxin AFB1 and CYP3A4 (using different PDB ID files): (A) 1TQN, (B) 2V0M, (C) 1W0E, and (D) 4NY4. π–π interactions are indicated as yellow tubes and hydrogen bonds are indicated with green dotted lines.
Applsci 09 02467 g005
Figure 6. Schematization of the transferred electron values (ΔN) calculated for the interactions between AFB1 and the CYP3A4 protein. (A) ITQN, (B) 2V0M, (C) 1W0E, and (D) 4NY4. Values in red indicate electron donors.
Applsci 09 02467 g006
Figure 7. Schematization of transferred electron values (ΔN) calculated for the interactions between AFB1 and CYP1A2 protein. Red values indicate electron donors, while blue values indicate electron acceptors.
Applsci 09 02467 g007
Table 1. Geometrical parameters for AFB1 calculated in the gas and solvent phases using the IEFPCM solvation model and the X-ray diffraction data reported for the same compound.
ParametersDFT Functional/Basis set 6-311G(d,p)Experimental Reference (a)
GasSolvent (water)
B3LYPM06-2XB3LYPM06-2X
Bond Distance
(Å)
20C-22C1.321.321.321.321.30
20C-12C1.511.511.511.511.50
12C-15C1.561.551.551.551.55
15C-3O1.411.401.411.401.41
3O-22C1.381.371.381.371.38
22C-31H1.071.071.071.071.04
20C-28H1.071.071.071.071.06
12C-23H1.091.091.091.091.01
Correlation (r)0.99170.99070.99260.9918
Bond Angles
(°)
22C-3O-15C107.5107.7107.5107.7107.2
3O-15C-12C107.5107.4107.5107.4107.5
15C-12C-20C101.0101.0101.0101.0101.0
31H-22C-20C130.8130.6130.9130.7132.0
28H-20C-22C126.9127.1124.7126.6129.0
31H-22C-3O114.0114.2114.2114.4113.0
28H-2OC-12C124.5124.5124.7124.8122.0
23H-12C-15C113.1113.5112.7113.0114.0
23H-12C-20C112.5112.9112.7113.1113.0
Correlation (r)0.97080.97510.95250.9688
(a) Van Soest et al., Acta Crystallographica. (1970). B26, 1940–1947.
Table 2. Analysis of the molecular interactions between CYP3A4 (1TQN PDB ID) and aflatoxins provided by molecular docking simulations.
LigandDFT
Functional/
6-311G(d,p)
Binding Energy (kcal/mol)Active SiteHydrogen Bondsπ–π
Interactions
AFB1B3LYP−8.53Arg105, Ser119, Arg212, Ala305, Thr309, Ala370, Arg372, Leu373, Glu374, HEM50805
M06-2X−8.78Arg105, Ser119, Arg212, Ala305, Thr309, Ala370, Arg372, Leu373, Glu374, HEM50805
AFG1B3LYP−8.44Arg105, Ser119, Arg212, Ala305, Ala370, Arg372, Leu373, Glu374,
HEM 508
Arg212 – O5 Ser119 – O72
M06-2X−8.70Arg105, Ser119, Arg212, Ala305, Ala370, Arg372, Leu373, Glu374,
HEM 508
Arg212 – O5 Ser119 – O72
AFB2B3LYP−8.77Arg105, Ser119, Arg212, Ala305, Thr309, Ala370, Arg372, Leu373, Glu374, HEM50805
M06-2X−8.86Arg105, Ser119, Arg212, Ala305, Thr309, Ala370, Arg372, Leu373, Glu374, HEM508.05
AFG2B3LYP−8.40Arg105, Ser119, Arg212, Ala305, Ala370, Arg372, Leu373, Glu374, HEM508Ser119 – O7 Arg212 – O52
M06-2X−8.39Arg105, Ser119, Arg212, Ala305, Ala370, Arg372, Glu374, HEM508Ser119 – O7 Arg212 – O52
Table 3. Analysis of the molecular interactions between CYP1A2 (2HI4 PDB ID) and aflatoxins provided by molecular docking simulations.
LigandDFT
Functional/
6-311G(d,p)
Binding Energy (kcal/mol)Active SiteHydrogen Bondsπ–π
Interactions
AFB1B3LYP−6.66Thr124, Phe125, Phe226, Asp313, Gly316, Ala317 Asp320, Thr321, Leu382, Ile386, Thr498, HEM90000
M06-2X−6.96Thr124, Phe125, Phe226, Asp313, Gly316, Ala317, Asp320, Thr321, Leu382, Ile386, HEM 90000
AFB2B3LYP−8.41Ile117, Thr118, Thr124, Phe125, Phe226, Val227, Asn312, Asp313, Ala317, Thr321, HEM90000
M06-2X−6.35Thr124, Phe125, Phe226, Asp313, Gly316, Ala317, Asp320, Trh321, Leu382, Ile386, Thr498, HEM900Asp320 –O40
AFG1B3LYP−4.92Thr124, Phe125, Phe226, Asp313, Gly316, Ala317, Asp320, Thr321, Leu382, Ile386, Thr498, HEM900Gly316-O40
M06-2X−5.52Thr124, Phe125, Asp313, Gly316, Ala317, Asp320, Thr321, Leu382, Ile386, Leu497, Thr498, HEM90000
AFG2B3LYP−3.51Thr124, Phe125, Phe226, Asp313, Gly316, Ala317, Asp320, Thr321, Leu382, Ile386, Leu497, Thr498, HEM90000
M06-2X−3.97Thr124, Phe125, Phe226, Asp313, Gly316, Ala317, Asp320, Thr321, Leu382, Ile386, Leu497, Thr498, HEM90000
Table 4. Analysis of the active site in CYP3A4 (using different PDB IDs) after interaction with aflatoxin AFB1, provided by molecular docking simulations.
1TQN2V0M1W0E4NY4
Active SiteArg105, Ser119, Arg212, Ala305, Thr309, Ala370, Arg372, Leu373, Glu374, HEM508Arg105, Ser119, Thr309, Ala370, Arg372, Leu373, Glu374, HEM497Ser119, Arg212, Phe213, Ala305, Ile369, Leu482, HEM501Arg212, Thr309, Ile369, Ala370, Met371, Arg372, Leu482, Leu483, HEM601
Table 5. Chemical reactivity parameters of amino acids present in the active sites of CYP3A4 (using different PDB IDs) provided by the interaction with aflatoxin AFB1.
ResiduePDBEHOMO
(eV)
ELUMO
(eV)
Electron Affinity
(eV)
Ionization Potential
(eV)
Hardness
(eV)
Chemical Potential
(eV)
AFB11TQN−7.4236−1.19781.19787.42363.1128−4.3107
1W0E−6.6317−2.07102.07106.63172.2803−4.3514
20VM−6.7898−2.19922.19926.78982.2953−4.4945
4NY4−6.5922−2.05062.05066.59222.2708−4.3214
ARG1051TQN−7.1661−0.72810.72817.16613.2190−3.9471
1W0ENot present
20VM−7.3185−1.07671.07677.31853.1209−4.1976
4NY4Not present
SER1191TQN−7.4236−1.19781.19787.42363.1128−4.3107
1W0E−7.1000−0.93900.93907.10003.0804−4.0195
20VM−7.5033−0.93550.93557.50333.2839−4.2194
4NY4Not present
ARG2121TQN−7.6189−0.70070.70077.61893.4591−4.1598
1W0ENot present
20VMNot present
4NY4−7.5411−0.84190.84197.54113.3496−4.1915
ARG212-PHE2131TQNNot present
1W0E−7.2195−1.00681.00687.21953.1063−4.1131
20VMNot present
4NY4Not present
THR3091TQN−7.2559−0.99430.99437.25593.1308−4.1251
1W0ENot present
20VM−7.1833−1.13201.13207.18333.0256−4.1576
4NY4−7.1795−1.11371.11377.17953.0328−4.1466
ALA3051TQN−7.1635−0.89660.89667.16343.1334−4.0300
1W0E−7.25780.8408−0.84087.25784.0493−3.2085
20VMNot present
4NY4Not present
ALA3701TQN−7.1631−0.87400.87407.16313.1445−4.0186
1W0ENot present
20VM−7.2899−0.75620.75627.28993.2668−4.0231
4NY4−7.1765−0.90690.90697.17653.1347−4.0417
ARG3721TQNNot present
1W0ENot present
20VMNot present
4NY4−7.4102−0.86280.86287.41023.2736−4.1365
ARG372-LEU373-GLU3741TQN−5.8205−0.30960.30965.82052.7554−3.0651
1W0ENot present
20VM−5.8007−0.96380.96385.80072.4184−3.3822
4NY4Not present
HEM1TQN−0.62150.4008−0.40080.62150.5111−0.1103
1W0E−0.01570.6718−0.67180.01570.34380.3280
20VM−0.21400.8375−0.83750.21440.52600.3115
4NY4−0.93820.4794−0.47940.93820.7088−0.2293
Table 6. Fractional number of transferred electrons (ΔN) calculated for the interactions between AFB1 and the CYP3A4 protein (using different PDB IDs).
Residue/PDB1TQN1W0E20VM4NY4
ARG1050.048--0.027--
SER1190.0140.0310.025--
ARG2120.027----0.012
ARG212-PHE213--0.22----
THR3090.032--0.0320.016
ALA3050.0410.126----
ALA3700.042--0.0420.026
ARG372-LEU373-GLU3740.142--0.118--
ARG372------0.017
HEM0.8160.8920.8520.687
Table 7. Chemical reactivity parameters of amino acids present in the active site of CYP1A2 (2HI4 PDB ID) provided by the interaction with aflatoxin AFB1.
ResidueEHOMO
(ev)
ELUMO
(ev)
Electron Affinity
(ev)
Ionization Potential
(ev)
Hardness (ev)Chemical Potential
(ev)
AFB1−6.7195−2.22452.22456.71952.2787−4.5032
THR124- PHE125−7.0529−1.22181.22187.05292.9155−4.1373
ASP313−9.7003−8.70718.70719.70030.4966−9.2037
PHE226−7.0339−0.72020.72027.03393.1568−3.8771
GLY316- ALA317−7.0088−0.80410.80417.00883.1023−3.9065
ASP321- THR322−8.9063−8.09988.09988.90630.4032−8.5030
LEU382−7.2668−0.50470.50477.26683.3810−3.8858
ILE386−6.9087−0.95830.95836.90872.9751−3.9335
THR498−7.2769−0.77410.77417.27693.2513−4.0255
HEM900−1.05520.5227−0.52271.05520.7890−0.2662
Table 8. Fractional number of transferred electrons (ΔN) calculated for the interactions between AFB1 and the CYP1A2 protein.
THR124, PHE125ASP313PHE226GLY316, ALA317ASP321, THR322LEU382ILE386THR498HEM900
ΔN0.035−0.8460.05750.0554−0.74560.05450.05420.04310.6905

