Featured Application
This indirect measurement method can be utilized to improve the remote meter reading technology for gas meter.
Abstract
At present, the remote meter reading problem for a large number of existing domestic diaphragm gas meters has not been reliably solved. The diaphragm gas meter uses a physical structure to measure gas consumption, so the main problem of remote meter reading is the digitization of gas consumption. Although it is possible to digitize the consumption data by modifying the internal structure of the gas meter or adding sensors, thereby realizing the function of remote meter reading, the modification process is complicated, the modification cost is high, and manual meter reading can only be used for the existing diaphragm gas meters. For this reason, this paper proposes an indirect measurement method of gas consumption based on gas pressure signal detection. The method can digitalize the metering results of the mechanical diaphragm gas meter and develop a state detection function by analyzing the pressure signal of the outlet of the meter without modifying the internal structure of a meter, thus addressing the key difficulties in the construction of a gas meter remote meter reading system. The experimental results show that this method has small calculation error and high reliability.
1. Introduction
With the rapid development of modern computer technology and communication technology, the remote intelligent collection of domestic gas meter, water meter, electric energy meter and thermal energy meter information has become a major priority. The remote meter reading scheme has obvious technological advancement and economic advantages, while the traditional artificial way to check meters has many drawbacks and cannot meet the requirements of the new form. The remote meter reading system can transmit the data displayed on the user’s gas meter to the server of the gas company in a timely manner [1]. Currently, the remote meter reading system is widely used in developed countries.
Mechanical diaphragm gas meters are still widely used. Digitizing the gas measurement results of the existing gas meters has the following advantages. Firstly, using an intelligent meter reading method instead of the traditional manual meter reading method can greatly reduce the cost of labor. Secondly, the digital gas metering terminal can monitor the state of the user’s gas usage in real time, thereby facilitating remote control. Thirdly, the intelligent gas meter can improve the safety of users’ gas equipment and reduce the accident rate of gas leakage. In addition, the digital measurement results can be adjusted according to temperature and pressure to improve the accuracy of measurement results. At present, there are a large number of traditional mechanical diaphragm gas meters in the user market, which makes it difficult to install and popularize intelligent gas management equipment.
Scholars in China and abroad have put forward some intelligent management schemes for diaphragm gas meters, among which the transformation of the meter body can be mainly classified as adding image processing equipment and changing the internal structure. Cai Shun studies a remote control gas meter reading system based on ZigBee wireless communication technology and digital image recognition technology [2]. In this scheme, the sensor node takes a picture of the gas meter using a CMOS camera, and sends it to the sink node through a multi-hop ZigBee network in the residential area. Similar to the above method, Kun Wang studies a remote gas meter reading system based on a wireless communication technology named LoRa [3]. This scheme mainly includes a machine vision system and a wireless communication system. The former refers to acquiring the image information of the dial of a diaphragm gas meter, and then obtaining the value by using image processing. The latter involves using the LoRa module to send the gas consumption data to the server. Although these methods have high credibility and do not require changing the existing gas meter and gas pipelines, they demand high levels of the image transmission and processing algorithm’s efficiency and the computer hardware used to process pictures. Ying Xie utilizes the M-Bus networks and GPRS wireless transmission technology to achieve remote control and transmission of data using the gas meter [4]. In the paper, the author mounts the nonmetallic-metal valves rotating wheel on the character wheel. The MSP430FW427 generates the excitation signal to the LC circuit to produce damped oscillation. When the inductor is in the nonmetallic film, the damping attenuation becomes smaller, while when the inductor is not in the nonmetallic film, it becomes larger. Finally, the rotation of the character wheel is recognized by detecting the status of the inductor. The biggest drawback of this retrofit method is that the diaphragm gas meter needs to be disassembled and reconstructed. M.Tewolde studies the intelligent meter reading scheme based on AC-250 film gas meter produced by the American Meter Company [5]. The scheme involves installing the Omega FMA3340 high-precision airflow meter and pressure detecting device at the gas outlet of the diaphragm gas meter, and then adding an optical encoder to the gas meter gear to obtain the rotation parameters. This method can achieve high-precision gas metering and gas leakage monitoring, but the method is carried out in an ideal experimental environment without considering the actual gas network pressure fluctuations and noise. In addition, the retrofit of the solution is costly and requires the disassembly of the gas meter. In general, intelligent management schemes for existing diaphragm gas meter have complicated transformation steps and high costs, and are not suitable for the existing large number of conventional membrane gas meters. In view of the above problems, this paper proposes an indirect gas measurement method by analyzing the working principle of the automatic gas meter and the pressure value of the gas outlet. The method can realize the digital transformation of the gas consumption data with high reliability, low cost and easy implementation without requiring any modification or disassembly of the meter.
The rest of this paper is organized as follows. In Section 2, some related principles about diaphragm gas meter are presented. Section 3 introduces the gas consumption measurement method proposed in the paper and the associated key technologies. Section 4 analyzes the rationality of this method. Section 5 illustrates the experimental process and results. Conclusions are presented in Section 6.
2. Related Theory
2.1. Working Principle of Diaphragm Gas Meter
The gas meter is mainly composed of a movable diaphragm, measuring chamber, rotating valve and connecting lever. The chamber is composed of left and right measuring chambers. Each measuring chamber is divided into two small measuring chambers by the diaphragm. Within the meter there are four small measuring chambers with the same structure. The diaphragm can expand and contract with the filling and discharging of the gas, and the two chambers separated by the diaphragm have the opposite states of intake and exhaust. The rotating valve installed above the metering chamber is connected with the diaphragm through a linkage rod, so that the inlet and outlet of the meter are connected alternately. When a chamber is switched from intake state to outflow state, the other side of the chamber is forced to reciprocate. This periodic alternating movement is passed through the mechanical linkage device, and the gas consumption is recorded [6,7,8].
2.2. Indirect Calculation of Gas Consumption
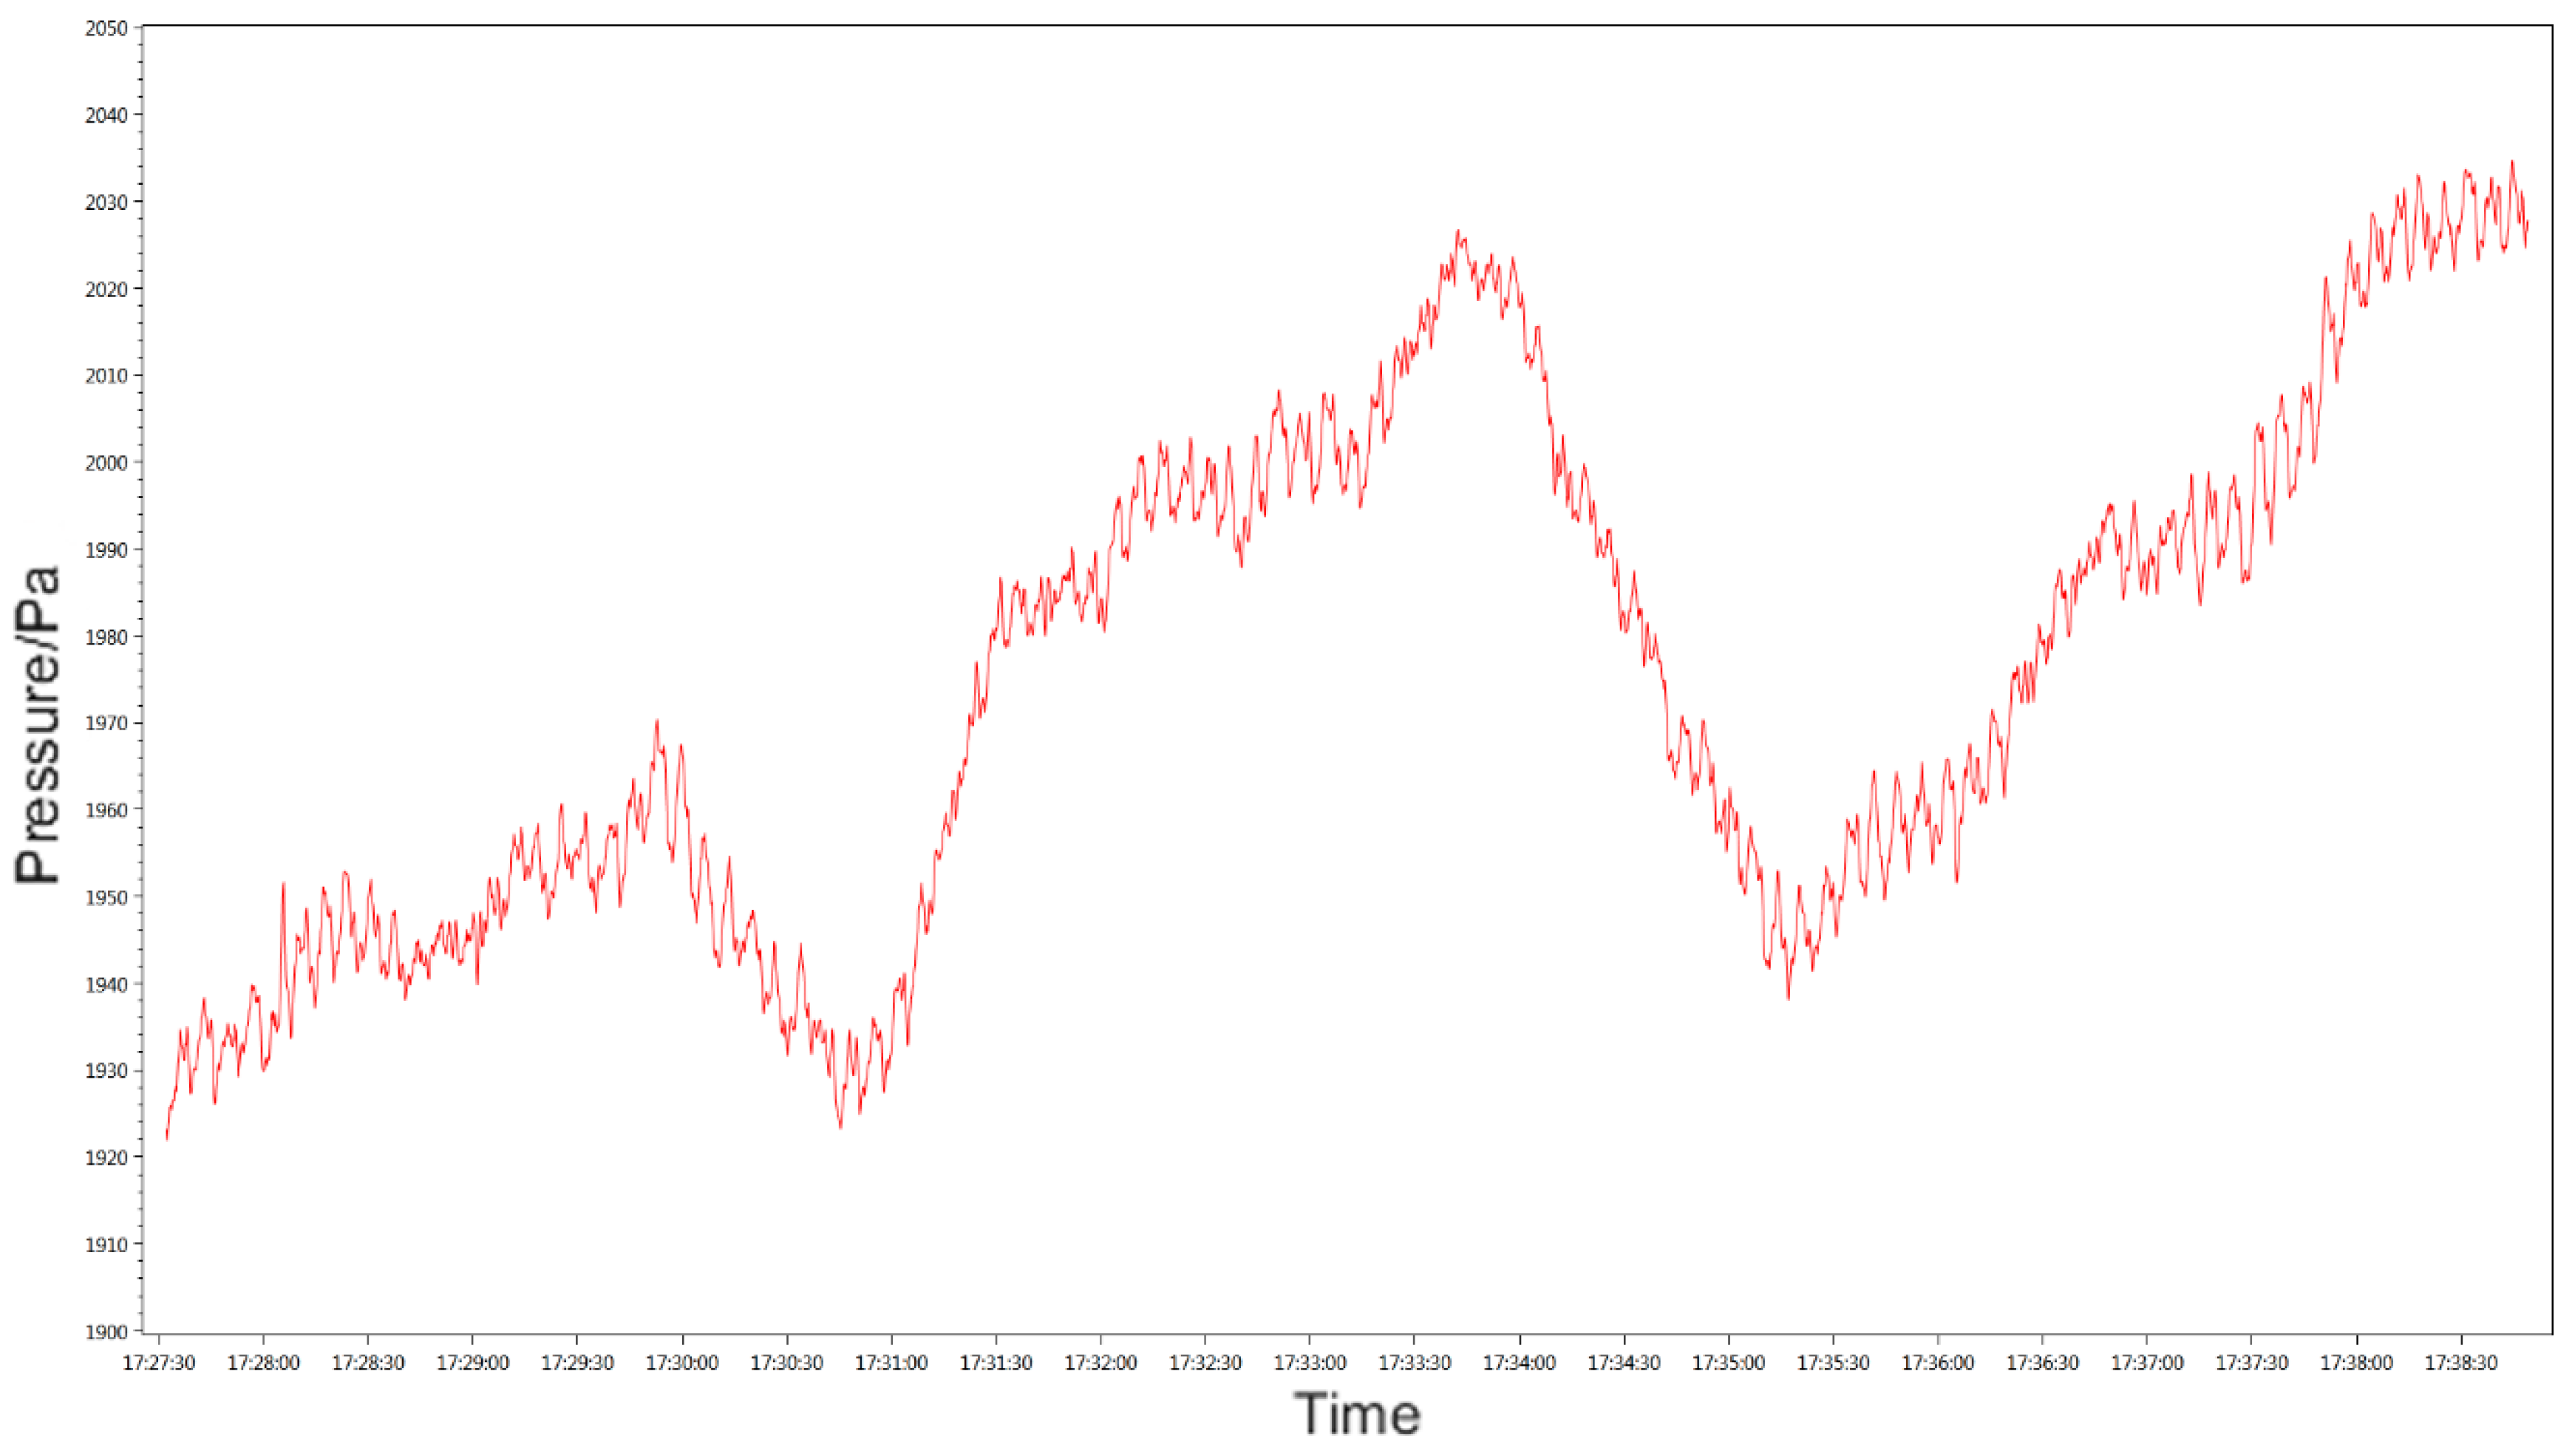
Because the working state of the internal mechanism of the diaphragm gas meter shows periodic variation characteristics, the gas pressure at the outlet will also produce periodic fluctuations of increased and reduced pressure. The gas pressure waveform at the outlet of a diaphragm gas meter at a fixed exhaust rate detected by the Omega PX409 high-precision gas pressure sensor (Omega Engineering Inc., Norwalk, CT, USA) is shown in Figure 1.
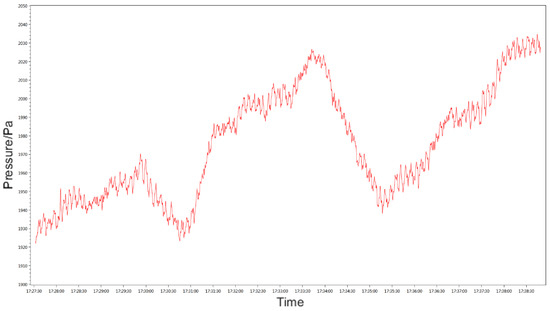
Figure 1.
The gas pressure waveform at the outlet of a diaphragm gas meter.
The Figure 1 indicates that the gas pressure will periodically shift up and down, and the pressure will fluctuate greatly over a long period of time due to the pressure disturbance of the pipe network. Because the periodic fluctuation of the gas pressure at the outlet is caused by the reciprocating movement of the diaphragm in the internal chamber of the gas meter, the relationship between the pressure signal period and the time required for the fixed volume to be discharged by the gas meter can be expressed by
When the intake is fixed and the running time of the diaphragm gas meter is , the gas throughput is equal to fixed volume gas discharged by the diaphragm gas meter, and the volume can be calculated by
where is the fixed gas capacity of the diaphragm gas meter, usually 1.2 in China; is the use time of the gas under a fixed intake; is the periodic value of the pressure signal of the outlet of the gas meter; is the volume of the gas discharged from the meter.
3. An Indirect Measurement Method for Gas Consumption
3.1. Measuring Process
Figure 2 shows that the indirect calculation process of gas consumption mainly consists of five main steps, which are the ignition detection, gas pressure data collection, removal of pressure fluctuation of the pipe network and fire transition point detection, the detection of weak signal periods, and the correction according to gas temperature and pressure. The detailed process is shown in Figure 3.
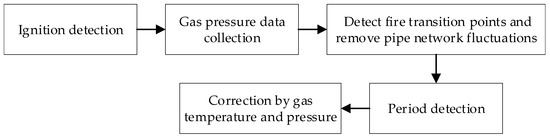
Figure 2.
The block diagram of indirect calculation of gas consumption.
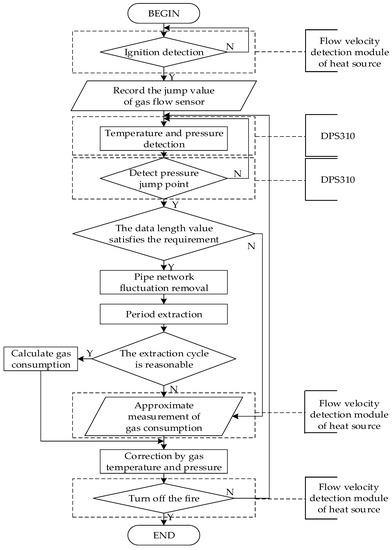
Figure 3.
The gas consumption indirect measurement process.
As is shown in Figure 3, firstly, the system detects the firing state by means of the flow velocity detection module of heat source type. When the user turn on a gas stove, the flow rate of the internal combustion gas in the pipeline is raised from the static state to 0.1–0.15 instantly, and the flow sensor will produce a sharp jump along the rising edge. The jump value of the rising edge is similar to the gas velocity in a single stove with high fire, so the value of the rising edge is recorded as a reference for the flow velocity interval. When the firing state is detected, the gas temperature and pressure are continuously detected by DPS310 gas temperature and pressure sensor (Infineon Technologies, Neubiberg, Germany), and the sampling frequency is 6 times per second. The user’s fire conversion operation is detected through pressure jump. When the fire conversion operation is detected, if the array length meets the requirements of period extraction, the pressure baseline drift of the pressure array pipeline network will be fitted and filtered. Afterwards, the pressure signal obtained after filtering the baseline will be extracted and verified by an average magnitude different function (AMDF) algorithm [9]. However, if the length of the array does not meet the requirement of period extraction, an approximate gas measurement is obtained by the recorded value of the velocity sensor. Finally, when the fire is turned off, the gas temperature and pressure are corrected and the data are uploaded to the gas management terminal through the DSP (Digital Signal Processor), and the gas consumption metering process is over.
3.2. Key Technologies
3.2.1. Ignition and Fire off Detection
The operation of igniting and turning off needs to be detected by a gas velocity sensor. The sampling rate of the sensor is set to 6 times per second. Before the user executes the igniting action, the output A/D voltage of the velocity sensor module is stable in a certain range and the signal has no obvious jump. At this time, the reference value of the sensor shutting off fire velocity should be recorded. When the user executes the igniting operation, the gas velocity of the outlet of the diaphragm gas meter increases instantaneously, and the output signal of the flow velocity sensor clearly shifts upward. The output waveforms of the flow velocity sensor in the state of multiple ignition operation and maximum fire in a stove are shown in Figure 4.
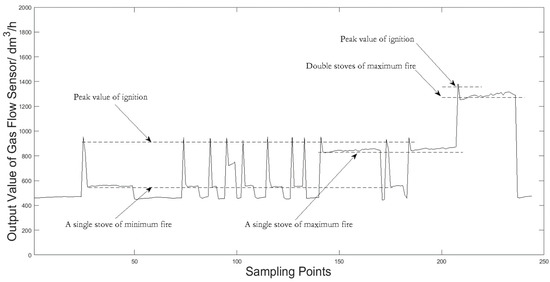
Figure 4.
The output waveforms of the flow velocity sensor.
Usually, when the user uses a gas stove, the ignition stove knob is pressed down to increase the gas output of the gas cooker. Tests on 11 different brands of domestic natural gas stoves show that the difference between gas flow rate and in this case is about 1.1 times of that when the fire is at the maximum level in a stove, which is shown as
When the igniting operation is detected, the peak value near the igniting jump is extracted as the reference value of the gas flow velocity in a single stove of maximum fire. When the user turns off the fire, the value of the flow velocity sensor will quickly fall back to the vicinity of . Therefore, the off-fire operation can be detected by comparing the output value of the flow velocity sensor with . The process of igniting and turning off fire detection is shown in Figure 5.
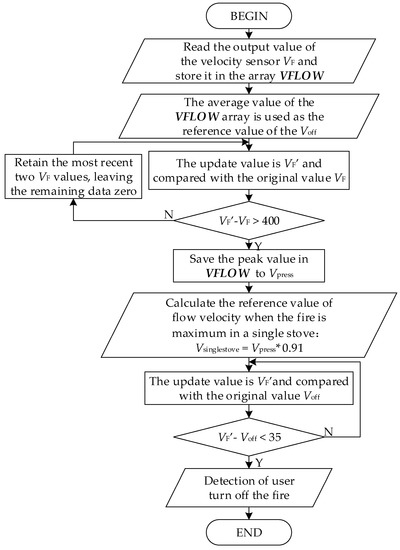
Figure 5.
The flow chart of igniting and turning off fire detection.
3.2.2. Removal of Pipe Network Fluctuation
In this paper, a baseline drift noise removal method based on time domain feature extraction is proposed. The principle of this method is to obtain the baseline of the signal by curve fitting of the extracted pressure fluctuation characteristic line segment of the pipeline network, and then subtracting the original signal from the calculated baseline to achieve baseline noise removal. This algorithm is simple in operation and is different from the median filtering method, which needs to adjust the filter window width according to the signal period. The method is less affected by the period of the original signal. The processed signal retains the effective periodic signal components in the gas pressure signal, and can reduce the serious distortion of the signal when eliminating the baseline drift.
The algorithm is mainly divided into two parts: the first part is detecting the time-domain feature line segment, the second part is the median filter of the feature line segment to get the baseline, subtracting the baseline curve from the original signal to get the signal without the baseline drift. The flow chart of the algorithm is shown in Figure 6.
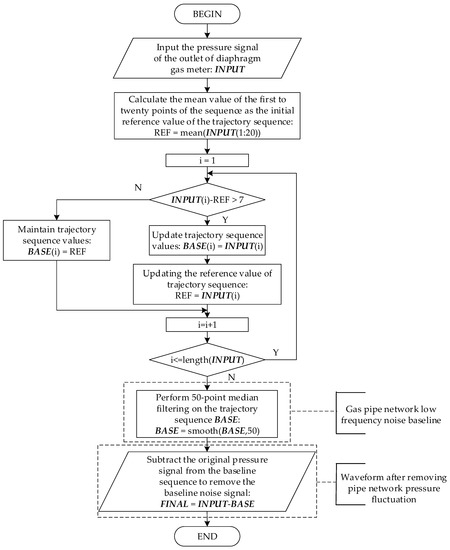
Figure 6.
The flow chart of removing the pipe network fluctuation.
3.2.3. Fire State Changing Detection
When the user adjusts the fire knob of the gas stove, the gas flow velocity in the gas pipeline will jump and the gas pressure will fluctuate steeply. Figure 7 shows the fire state changing detection results for four different situations. The fluctuation range of the pressure signal caused by the user adjusting the gas fire power is usually 50 Pa~300 Pa, so the identification of the user’s adjusting fire action can be realized by detecting the jump of pressure output value of the DPS310 sensor. The test results show that the pressure of the outlet of the gas meter fluctuates about 40 Pa when the user adjusts the fire minimally. However, the peak and valley values of the periodic signal waveforms are between 10 Pa and 50 Pa, so it is necessary to set the characteristic limit conditions to distinguish the jump of the fire conversion from the jump of periodic signal. The flow chart of the fire conversion point recognition algorithm is shown in Figure 8.
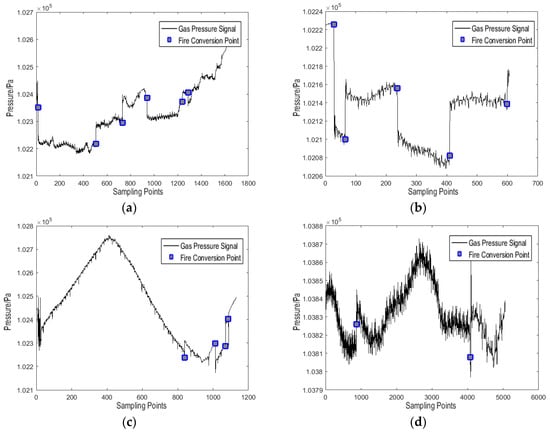
Figure 7.
The detecting result of the fire conversion points. (a) The first situation with 6 large degree fire conversions; (b) The second situation with 5 large degree fire conversions; (c) The third situation with 4 small degree fire conversions; (d) The fourth situation with 2 small degree fire conversions.
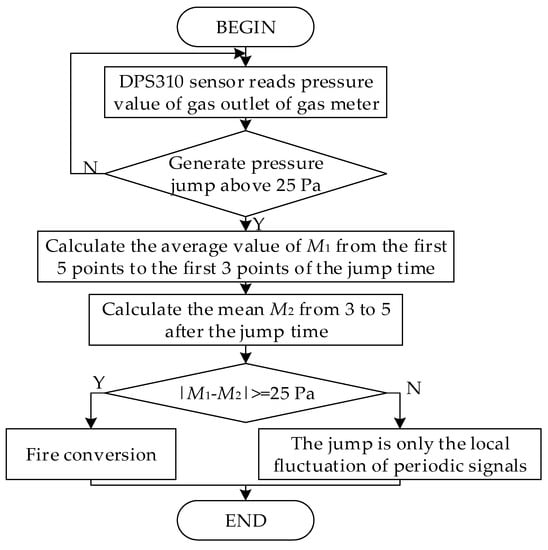
Figure 8.
The flow chart of fire conversion point recognition algorithm.
As depicted in Figure 8, if the absolute value of the difference between the pressure value of the current sampling point and the previous point is greater than 25 Pa, it will temporarily be regarded as a fire conversion point. However, in order to avoid the judgment error due to the noise signal, this method judges the difference between the mean value of the first 5 points to the first 3 points of the above conversion point and the mean value of the last 3 points to the last 5 points of that conversion point.
3.2.4. Signal Period Detection Method Based on AMDF
The conventional AMDF is defined as [10]:
where are the frames of input signal whose length is N, is the lag number.
has the same characteristic of the period with the original signal, and there are notches located in the position of and its multiple where is the period of the periodic or quasi periodic original signal. Therefore, the period of the useful signal can be determined by calculating to find the position of the highest notch (except for the zero position).
In order to accurately extract the periodic characteristics of the signal, the window length should at least be longer than two complete signal periods: if the period is N, the sampling length of the signal should be greater than 2N, and the corresponding gas pressure periodic signal should be more than . In order to ensure the implementation of AMDF in the limited hardware storage space, it is usually necessary to segment the long-term signal. This system truncates the data according to the fire conversion point. In addition, when the number of signal sampling points exceeds 3600 points in a fixed fire state (a sampling frequency of 6 times per second and a signal duration of 600 s), the program will force the execution cycle extraction. The peak amplitude of AMDF will decrease with the increase of the lag time [11]. Therefore, this paper divides the AMDF value by the number of overlapping points to suppress this downward trend, and reciprocates the non-zero amplitude to convert the valley point to the peak value.
3.2.5. Correction by Gas Temperature and Pressure
Diaphragm gas meters are measured by the volume of gas, but the volume is compressed or expanded by the influence of pressure and temperature [12]. For gas companies in China, the standard temperature of gas is 293 K and the pressure is 101.325 KPa. Therefore, it makes sense to correct the gas volume based on the gas temperature and pressure.
The compression factor is used in the project to describe the state of the gas, which is described as [13]:
where is the absolute pressure of the gas, is the volume of the gas, is the amount of the substance, is the compression factor, is the general gas constant, is the thermodynamic temperature of the gas.
For natural gas in the metered state and the same amount of natural gas in the standard state, the volume conversion Equation (6) can be obtained according to Equation (5), which can be represented as:
where is the volume of the gas under the metered state, is the volume under the standard state, and are the compression factors in the working state and the standard state respectively, can be expressed by the symbol . The pressure in urban gas pipeline belongs to the low pressure range, the compression factor has little change, so can be considered as 1 [14]. Therefore, the Equation (6) can be simplified to the following:
where is defined as the volume correction factor in this paper.
4. Rationality Test of the Proposed Measurement Method
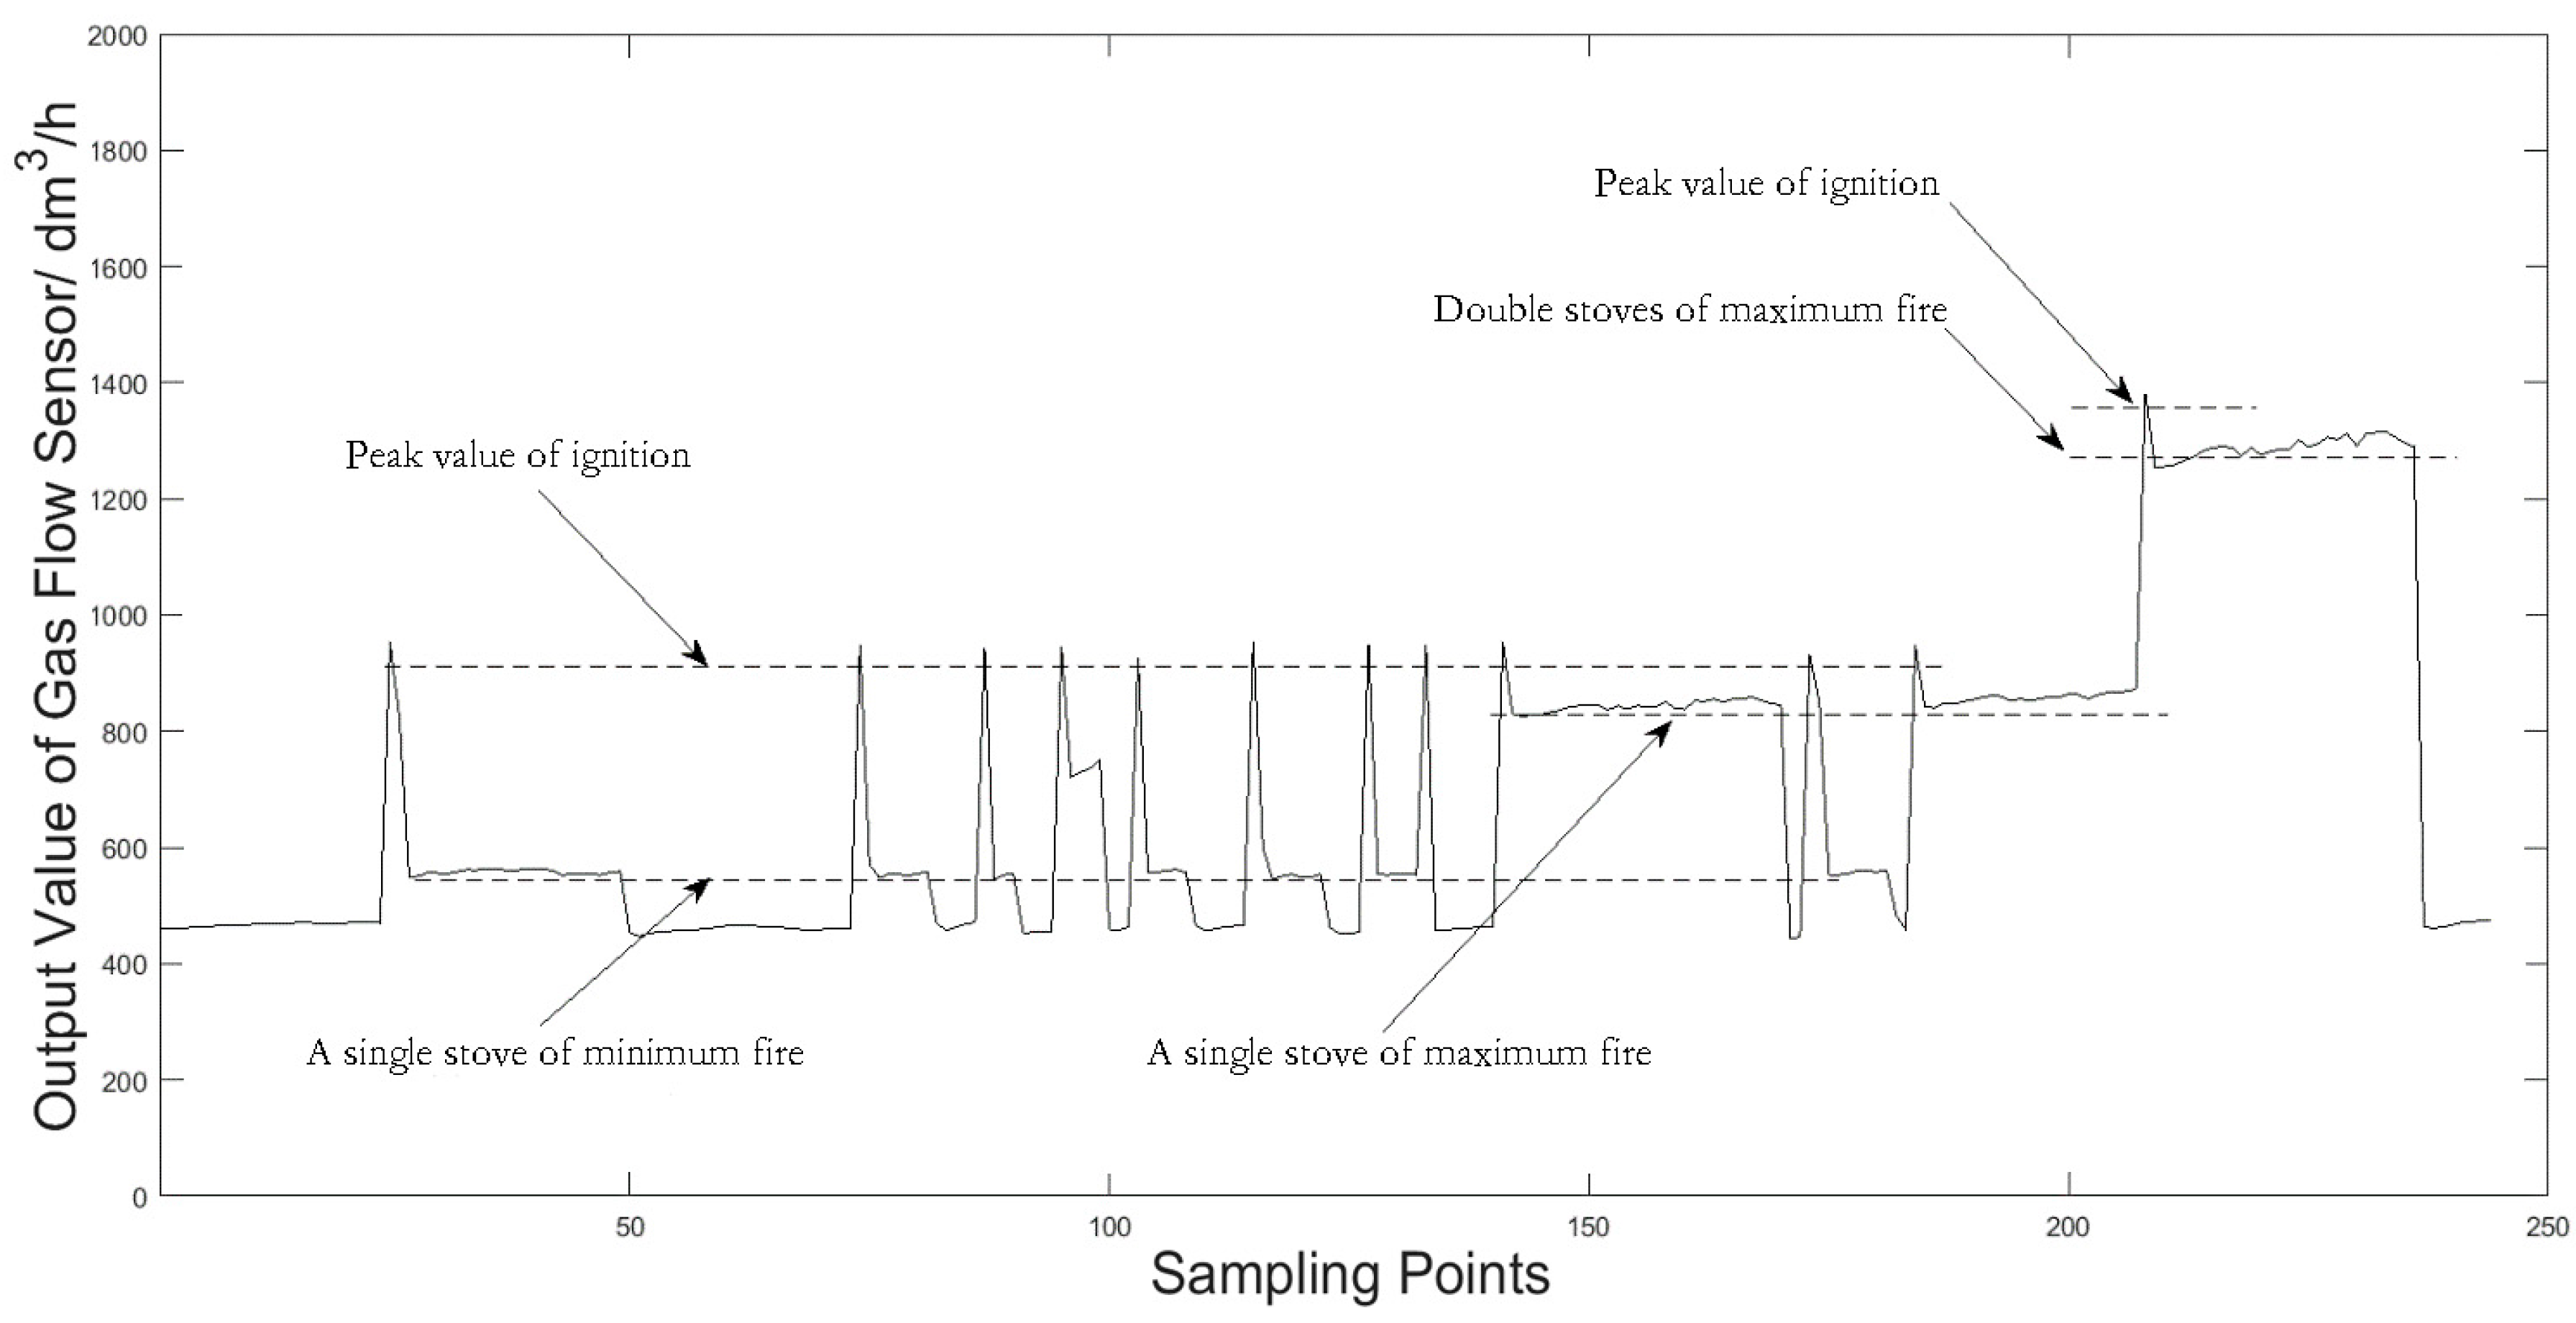
The flow range of household gas stove is usually 0.005 m3/h to 0.87 m3/h, and the operation cycle time range corresponding to the discharge of 1.2 fixed volume gas is about 90 s to 5 s. Therefore, when the extraction period exceeds this range, the calculation error can be judged. In addition to the above conditions, the system will judge the flow velocity range according to the rough output value of the gas flow velocity sensor. For the period extraction results beyond the normal range of the flow velocity range and the unbelievable signal segment in the period extraction process, the gas consumption will be approximately measured according to the output value of the gas flow velocity sensor. The output value of the gas flow velocity sensor during the use of a household gas stove is shown in Figure 9.
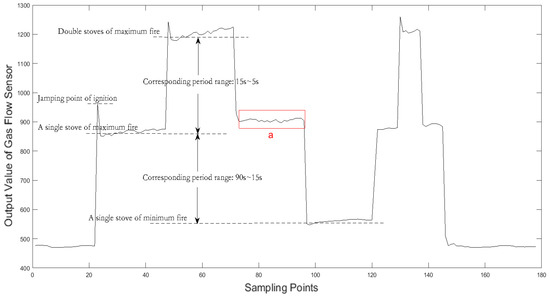
Figure 9.
The output value of gas flow velocity sensor and its corresponding signal period interval.
Record the output value of the flow velocity sensor in the off-fire state is , the peak value of the igniting jump is , and then calculate the value in the maximum fire state in a signal stove according to Equation (3). The flow velocity of the maximum fire of double stove is approximately 2 times that of the . Therefore, the velocity output value can be divided into 4 intervals, as shown in Table 1. Taking the signal segment a in Figure 9 as an example, firstly, the period extraction algorithm is used to extract the signal period. When the extraction results do not meet the reasonable judgment conditions, the approximate calculation of gas consumption is carried out according to Table 1.

Table 1.
Signal periodic rationality test and approximate value of period.
When the deviation between the calculation period value and the current flow velocity interval signal period value is too large, it is determined as a calculation error and the gas consumption is calculated according to the approximate flow velocity sensor output value. The method can compensate for the shortcomings of the low accuracy of the flow velocity sensor, and at the same time greatly reduce the measurement deviation caused by the period extraction error. Usually, the period extraction error is caused by a shorter signal length, that is, less than 5 complete periods of consuming 6 dm3 of gas. This error would not have a major impact on the overall gas consumption metering. After the gas consumption is approximately calculated, the cumulative error caused by the long-term operation of the system can be reduced.
5. System Test
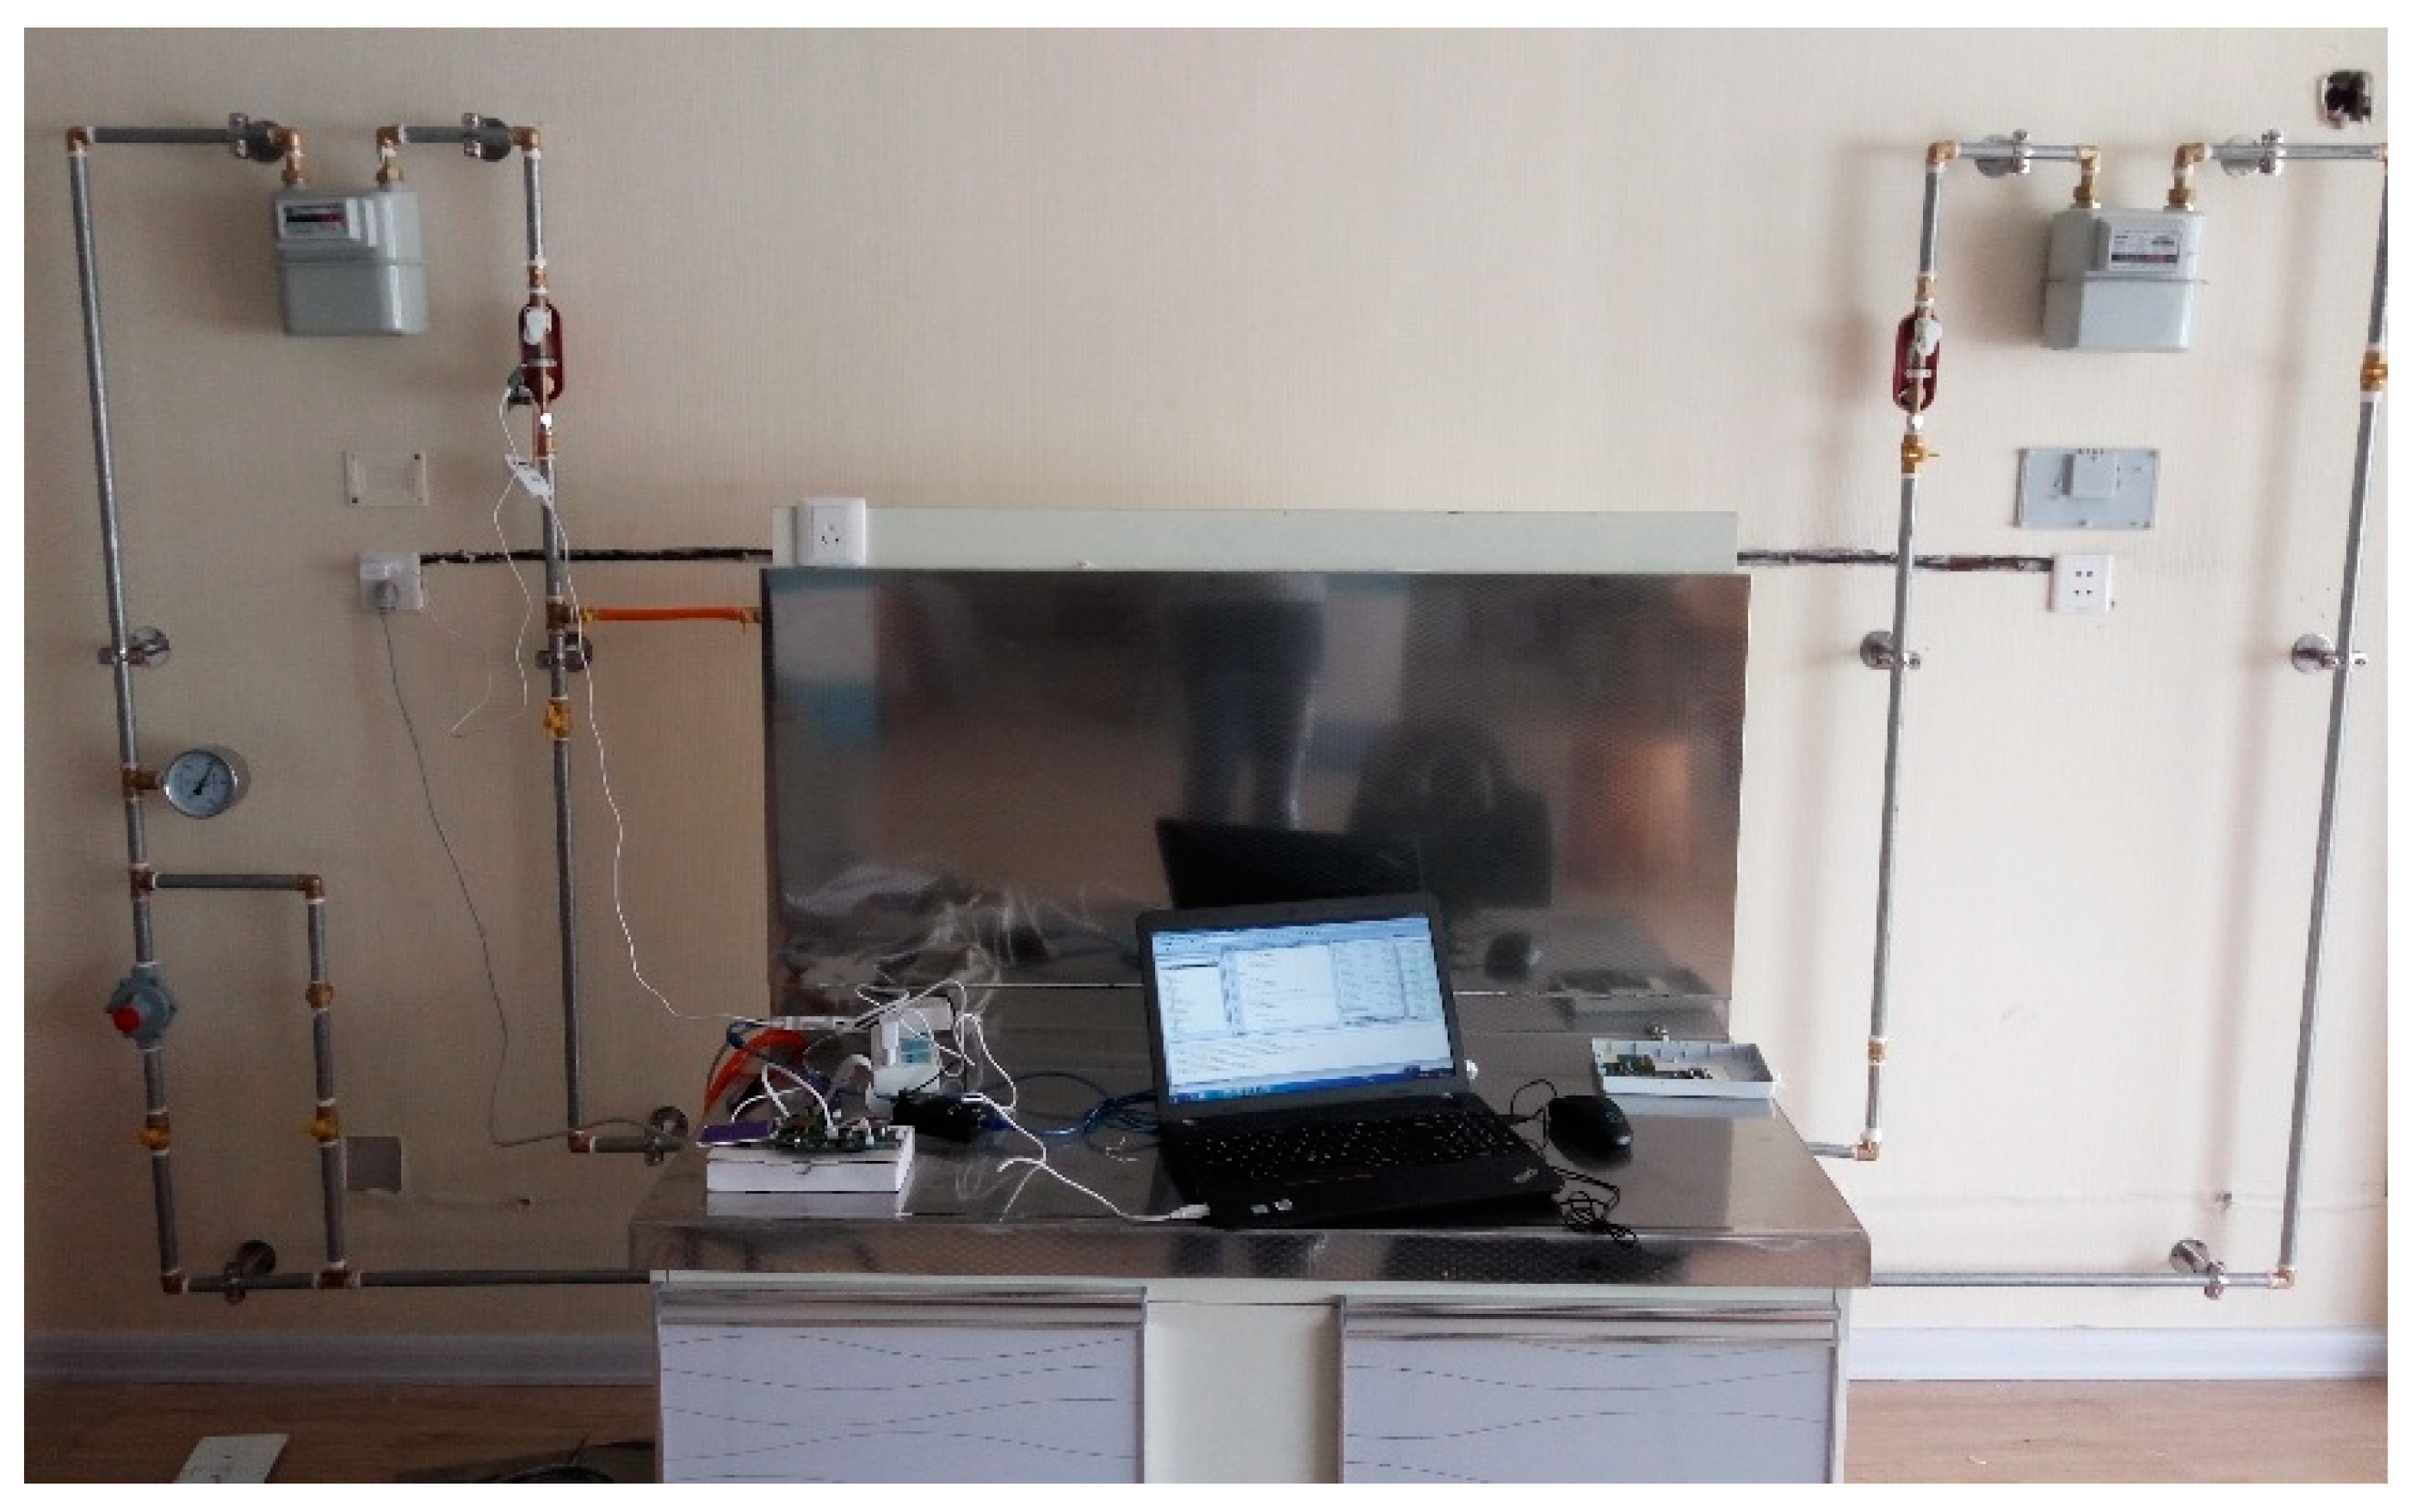
The test environment of the system mainly includes gas equipment laboratory and user’s home environment. The test system mainly consists of a gas pipeline, diaphragm gas meter, indirect gas consumption metering terminal, indoor gas safety valve and domestic gas stove. The users’ homes are located in different floors between the 1st and 22th floors. Diaphragm gas meters of different brands and specifications are tested and used. In the laboratory test environment of gas equipment, the inlet of the gas pipeline is equipped with a high precision gas flowmeter, which can control the system parameters precisely under the condition of large flow. In addition, two or four household gas cookers can be extended to the end of the gas pipeline through the two-way pipe, so as to realize the system experimental test of the diaphragm gas meter under the limit flow velocity (2.5 m3/h). The gas consumption indirect metering device test system is shown in Figure 10.

Figure 10.
The system for indirect metering.
The user cooking process involves one or more gas use states, including single stove and double stoves in the use of various fire states, a long-term use process (the gas dosage is greater than 6 dm3), and a short-term use process (the gas dosage is less than 6 dm3). The process also includes a variety of unconventional operating conditions, such as multiple igniting operations due to fire failure, frequent fire adjustments and minimal fire adjustments. Each group of experiments is a complete family cooking process. The test site is distributed over different floors and test times, including peak gas use and non-peak gas use periods. According to the experimental results, the maximum error rate of the test group is 7.88%. The gas consumption is 4357.56 dm3 in all the experiments, and the calculated measurement value is 4420.64 dm3. The cumulative error rate is 1.45%. The gas metering test results of household cooking process are shown in Table 2. The single group of experimental errors are mainly caused by the approximate gas metering signal section and the user’s igniting operation. However, due to the positive and negative error rate, the statistical average can further reduce the system error rate.
Table 2.
Gas metering test results of the household cooking process.
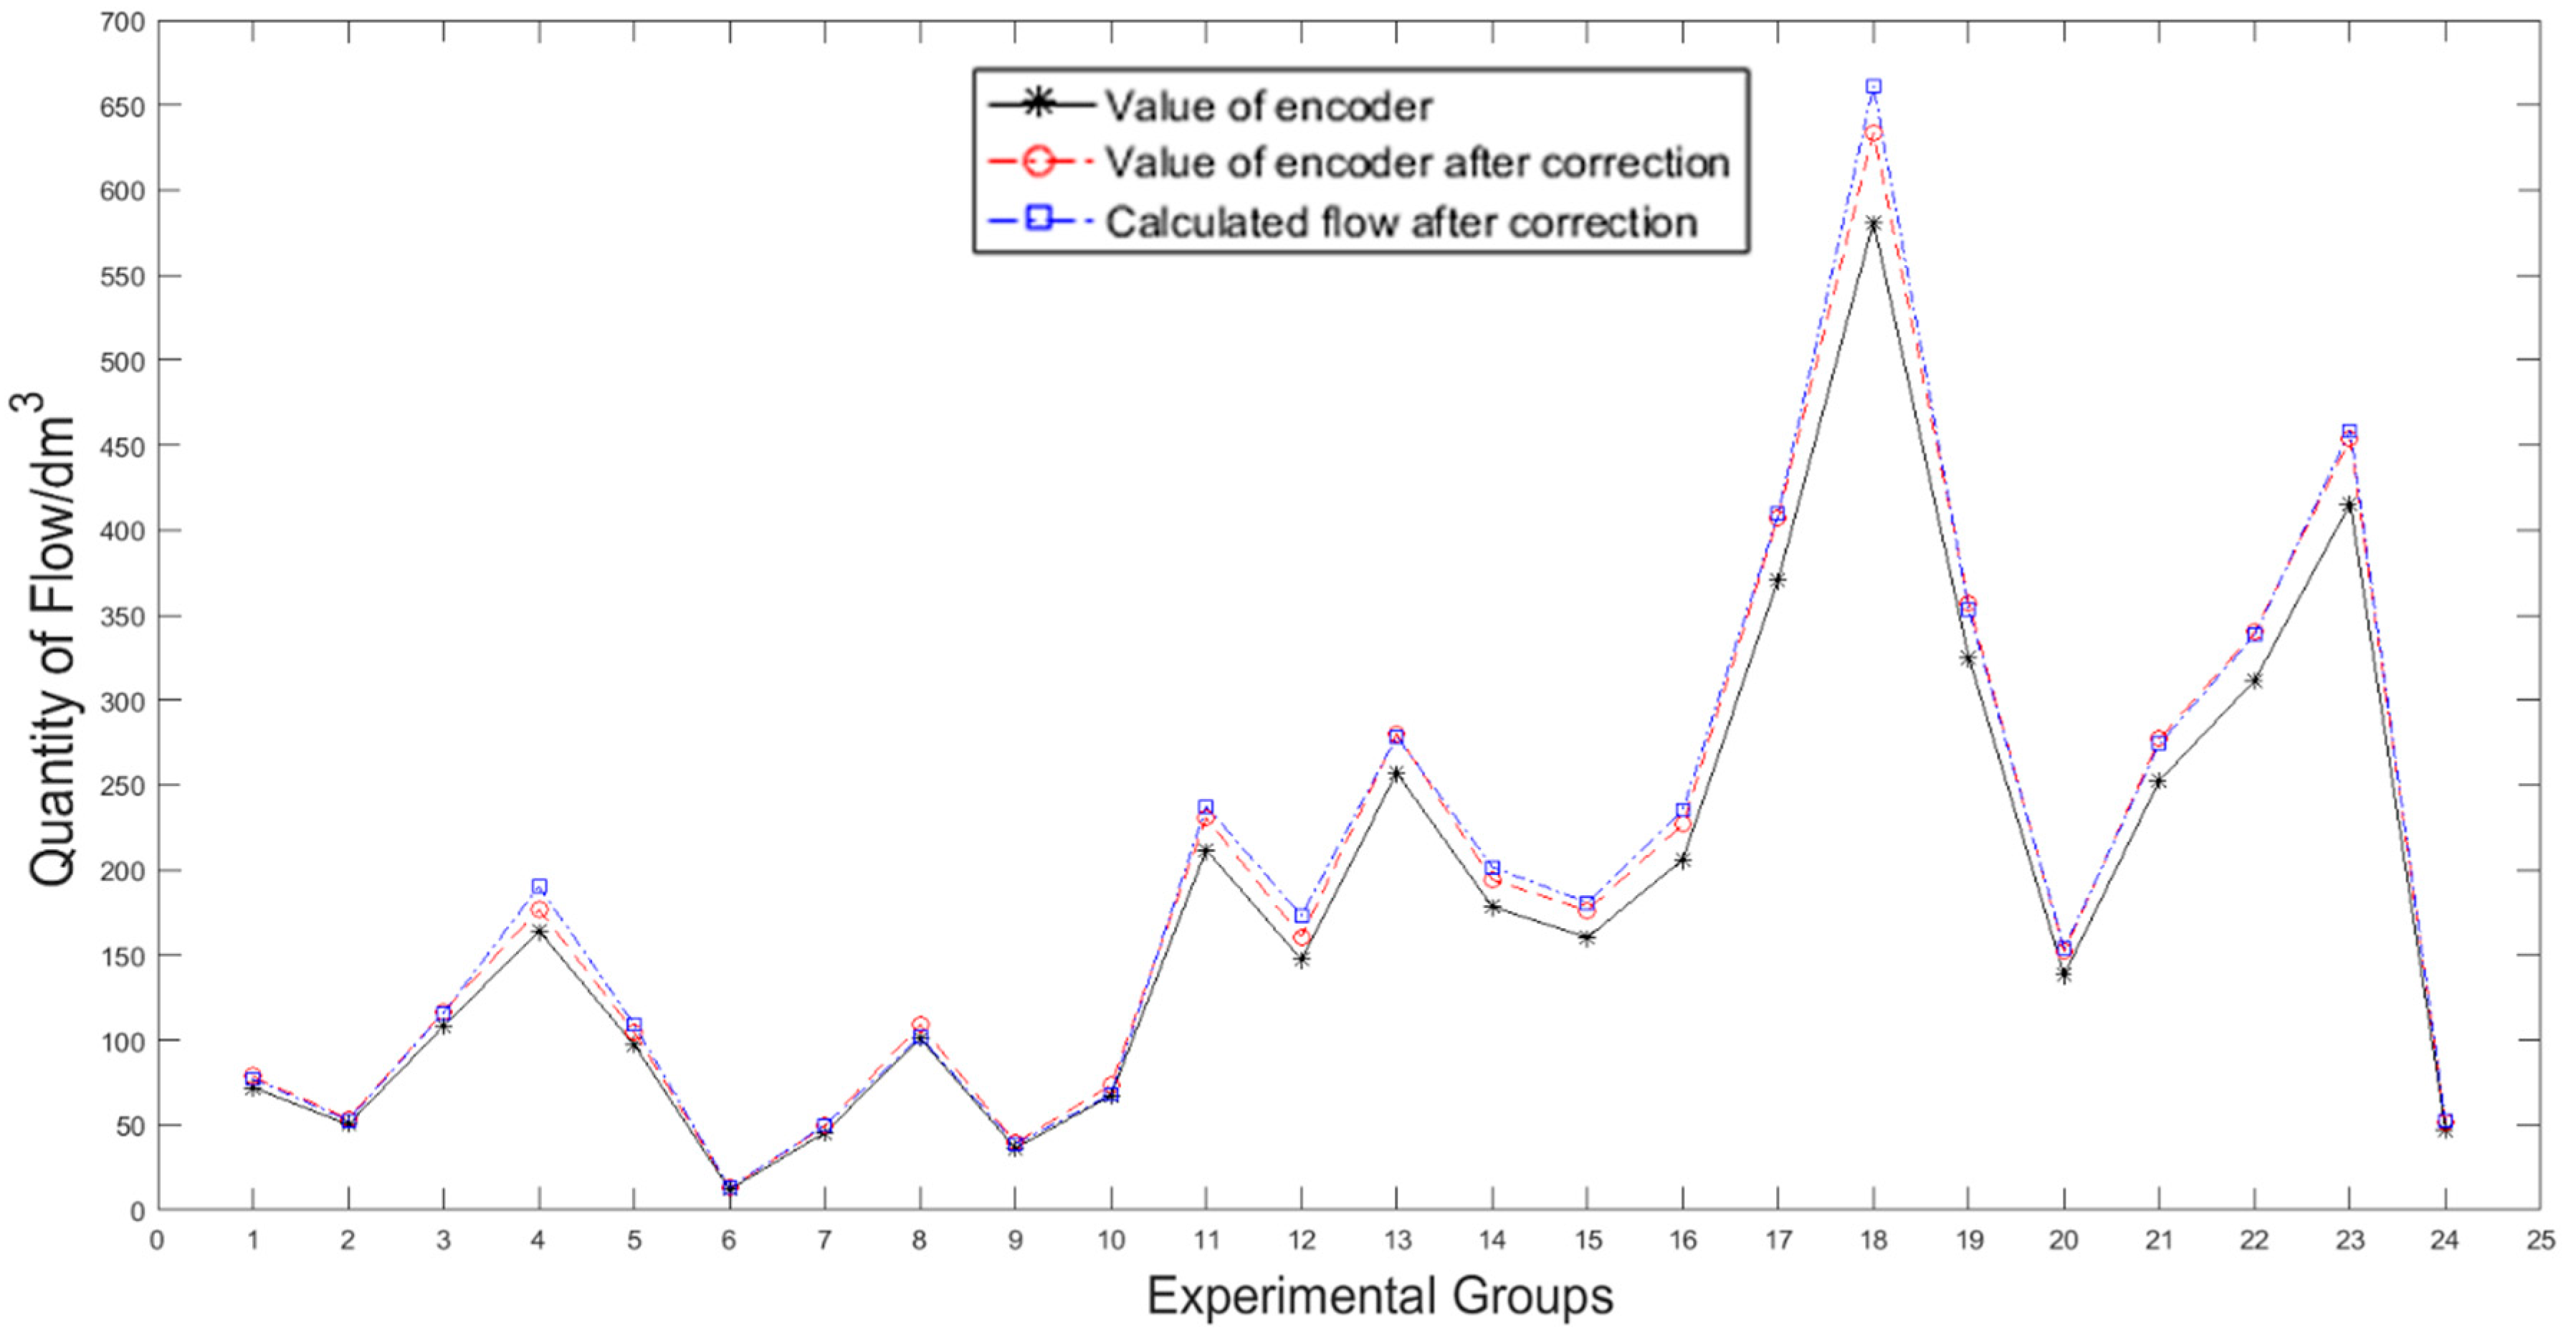
Because the test time is winter, the gas temperature is low and the static pressure of the gas pipeline is 2000–3000 Pa higher than the standard atmospheric pressure, it is necessary to multiply the measured value by the corresponding temperature-pressure correction coefficient to get the gas measurement value under the standard condition. Figure 11 shows the numerical comparison of gas volume before and after correcting by the temperature and pressure.
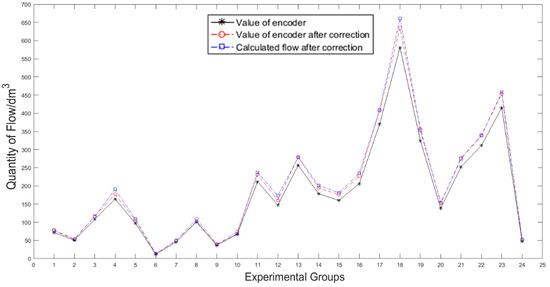
Figure 11.
The numerical comparison of gas volume before and after correcting by temperature and pressure.
As shown in the Figure 11, the gas metering value of the diaphragm gas meter in winter is lower than the gas volume of the standard condition, and the pipe pressure is higher than the standard atmospheric pressure. The gas volume temperature and pressure correction method used in this paper can reduce the measurement error caused by ambient temperature or pipeline pressure to a certain extent. This group of experiments verify the accuracy and validity of the indirect gas metering functions and the correction function of the gas volume temperature and pressure.
6. Conclusions
At present, there are still a large number of mechanical gas meters or IC (Integrated Circuit) card gas meters in the household gas charging system. The main method of charging for gas usage is through manual meter reading, which has the shortcomings of high cost and low efficiency. The key difficulty in building an intelligent home gas management platform is the digitalization of a large number of existing mechanical diaphragm gas meters. In this study, an additional device is designed, which is installed at the back end of the outlet of the diaphragm gas meter and the front end of the gas appliance. It can obtain the indirect measurement of gas, real-time monitoring of the gas temperature, pipeline pressure, and service state without any disassembly and modification inside the gas meter, thus solving the key problems of household gas safety management.
In addition, various functions of indirect gas metering device, such as signal acquisition, gas metering and temperature and pressure correction, are tested and analyzed. Finally, the gas volume before and after the temperature-pressure correction is compared and analyzed. The experiment proves that the system can realize the functions proposed in the design stage and can also make the gas indirect measurement function more credible.
Author Contributions
Conceptualization, X.W. and B.J.; methodology, Z.H. and X.C.; software, Z.H.; validation, X.W. and B.J.; investigation, Z.H.; data curation, X.C.; writing—original draft preparation, X.C.; writing—review and editing, Z.H.; project administration, X.W. and B.J.
Funding
The research received no external funding.
Acknowledgments
We gratefully acknowledge the technical assistance of DL850E ScopeCorder.
Conflicts of Interest
The authors declare no conflict of interest.
References
- Landolsi, T.; Hassan, M.H.; Ezzeddine, M.; Abdelsalam, M.; Baseet, M. An IoT-Based Smart Utility Meter. In Proceedings of the 2nd International Conference on Smart Grid and Smart Cities (ICSGSC), Kuala Lumpur, Malaysia, 12–14 August 2018. [Google Scholar]
- Cai, S.; Zhang, S.F.; Huang, D.; Yu, S.F. Remote gas meter reading system based on zigbee networks. In Proceedings of the Spring World Congress on Engineering and Technology, Xi’an, China, 27–30 May 2012. [Google Scholar]
- Wang, K. Application of wireless sensor network based on LoRa in city gas meter reading. Int. J. Online Eng. 2017, 13, 104–115. [Google Scholar] [CrossRef]
- Xie, Y. Development of the remote record and control of gas meter based on M-Bus networks. In Proceedings of the 4th International Conference on Digital Manufacturing and Automation, Qingdao, China, 29–30 June 2013. [Google Scholar]
- Tewolde, M.; Fritch, J.C.; Longtin, J.P. High-resolution meter reading technique for appliance gas usage monitoring for the smart grid. In Proceedings of the 8th International Conference and Expo on Emerging Technologies for a Smarter World, Hauppauge, NY, USA, 2–3 November 2011. [Google Scholar]
- Wiratama, F.I.; Syaifuddin, M.; Wibowo, I.K.; Ardilla, F.; Purnomo, A. Gas billing system based on automatic meter reading on diaphragm gas meter with email notification. In Proceedings of the International Electronics Symposium on Knowledge Creation and Intelligent Computing (IES-KCIC), Bali, Indonesia, 29–30 October 2018. [Google Scholar]
- Ficco, G. Metrological performance of diaphragm gas meters in distribution networks. Flow. Meas. Instrum. 2014, 37, 65–72. [Google Scholar] [CrossRef]
- Crabtree, G.M. Fundamental principles of diaphragm displacement meters. In Proceedings of the International School of Hydrocarbon Measurement, Norman, OK, USA, 21–23 May 1991. [Google Scholar]
- Kumar, S.; Singh, K.S.; Bhattacharya, S. Performance evaluation of a ACF-AMDF based pitch detection scheme in real-time. Int. J. Speech Technol. 2015, 18, 521–527. [Google Scholar] [CrossRef]
- Zong, Y.; Zeng, Y.M.; Zhang, M.; Li, P.C. Modified AMDF pitch detection algorithm based on trend analysis. J. Vib. Shock. 2014, 33, 35–39. [Google Scholar]
- Erden, R.; Alkar, A.Z.; Cetin, A.E. Contact-free measurement of respiratory rate using infrared and vibration sensors. Infrared Phys. Technol. 2015, 73, 88–94. [Google Scholar] [CrossRef]
- Qin, C.K.; Gao, D.Y. Calculation of natural gas compression factor and volume measurement. Nat. Gas Ind. 2003, 23, 130–132. (In Chinese) [Google Scholar]
- Qin, C.K.; Gao, D.Y. Calculation of volume-correction coefficient of natural gas. Tongji Daxue Xuebao 2004, 32, 27–30. (In Chinese) [Google Scholar]
- Li, C.H.; Dai, J.M.; Li, C.W.; Chen, S.R. Discussion on compressibility factor correction in gas flow measurement. Nat. Gas Ind. 2004, 24, S124–S127, 18–19. (In Chinese) [Google Scholar]


© 2019 by the authors. Licensee MDPI, Basel, Switzerland. This article is an open access article distributed under the terms and conditions of the Creative Commons Attribution (CC BY) license (http://creativecommons.org/licenses/by/4.0/).