Article

Numerical Study on Gaseous CO2 Leakage and Thermal Characteristics of Containers in a Transport Ship

1
School of Mechanical Engineering, Chung-Ang University, Seoul 06974, Korea
2
Korea Research Institute of Ships & Ocean Engineering (KRISO), Daejeon 34103, Korea
*
Author to whom correspondence should be addressed.
Appl. Sci. 2019, 9(12), 2536; https://doi.org/10.3390/app9122536
Submission received: 16 May 2019 / Revised: 15 June 2019 / Accepted: 19 June 2019 / Published: 21 June 2019
(This article belongs to the Section Mechanical Engineering)

Abstract

:
This study investigates numerically gaseous CO2 leakage characteristics inside the containers of a transport ship and examines thermal effects on the structural damage that might happen in the containers. First, with consideration of the phase change, the ejected mass flow rate was estimated using the commercial code of DNV PHAST. Based on this estimated mass flow rate, we introduced an effective area model for accounting for the fast evaporation of liquefied CO2 occurring in the vicinity of a crack hole. Using this leakage modeling, along with a concept of the effective area, the computational fluid dynamics (CFD) simulations for analyzing transient three-dimensional characteristics of gas propagation in a confined space with nine containers, as well as the thermal effect on the walls on which the leaking gas impinges, were conducted. The commercial code, ANSYS FLUENT V. 17.0, was used for all CFD simulations. It was found that there are substantial changes in the pressure and temperature of the gas mixture for different crack sizes. The CO2 concentration at human nasal height, a measure of clear height for safety, was also estimated to be higher than the safety threshold of 10% within 200 s. Moreover, very cold gas created by the evaporation of liquefied CO2 can cool the cargo walls rapidly, which might cause thermal damage.

1. Introduction

Carbon dioxide (CO2) is one of the most significant greenhouse gases; however, it is still emitted into the environment from large industrial facilities. Carbon capture and storage (CCS) technologies have been developed as an option to stabilize the concentration of CO2 in the atmosphere [1]. Generally, the CCS chain consists of three stages: capture, transportation, and storage [2]. Ocean storage is becoming the most promising approach to sequestering CO2 due to the large capacity of deep saline aquifers [3]. Although pipelines have recently been developed for transporting CO2, there are major obstacles related to the initial installation, as well as maintenance costs [4]. Alternatively, CO2 shipping vessels (or water carriers) are more attractive alternatives when considering maintenance costs [5]. To be specific, the capacity of a CO2 transport ship is determined by the daily production of CO2 and the sailing period of the ship [6]. Much effort to build CO2 transport ships has been conducted in the Republic of Korea, because Korea is a peninsula surrounded by the sea [7]. Currently, CO2 transport is still in the development stage but, because of its importance, a persistent effort is being made regarding the better design of transport ships.
In general, gaseous CO2, compressed and liquefied, is stored in tanks for efficient transportation [8]. Because the tanks are used for transportation on the ocean [9], the possibility of gas leakage should be examined for confirming the safety of the transportation facilities [10]. The transport ships may be damaged if an accidental CO2 leak occurs in the container during sailing [11]. When an accidental leak occurs, liquefied CO2 undergoes rapid vaporization and expansion, causing a significant pressure rise [12]. Even if CO2 is not classified as a dangerous substance, two important factors clearly affect safety, one of which is the occurrence of personal injury such as suffocation by workers exposed to an environment with a high CO2 concentration [13]. The other is associated with thermal damage to the tank structure during leakage, because very cold CO2 gas might impinge on the cargo walls, causing a local change in solid temperature and thermal deformation [14]. Thus, we need a good deal of information on thermal characteristics depending on different scenarios of gas leakage.
In spite of its importance, as noted above, it is very hard to directly measure temperature and CO2 concentration in a real-scale cargo to obtain information on thermal behavior during leakage. As an alternative, the computational fluid dynamics (CFD) simulation is a promising way to get useful information on the variations in concentration and thermal characteristics during the leakage of CO2 gas. Thus, to provide a better understanding when designing CO2 cargo facilities, the present study aims to numerically investigate CO2 propagation characteristics inside a container and to examine thermal effects on the cargo walls on which thermal damage might occur. We also suggest a new engineering model with an effective area concept to consider the phase change during leakage. Moreover, the influence of crack size on the transient evolution of CO2 concentration and structure temperature is analyzed.

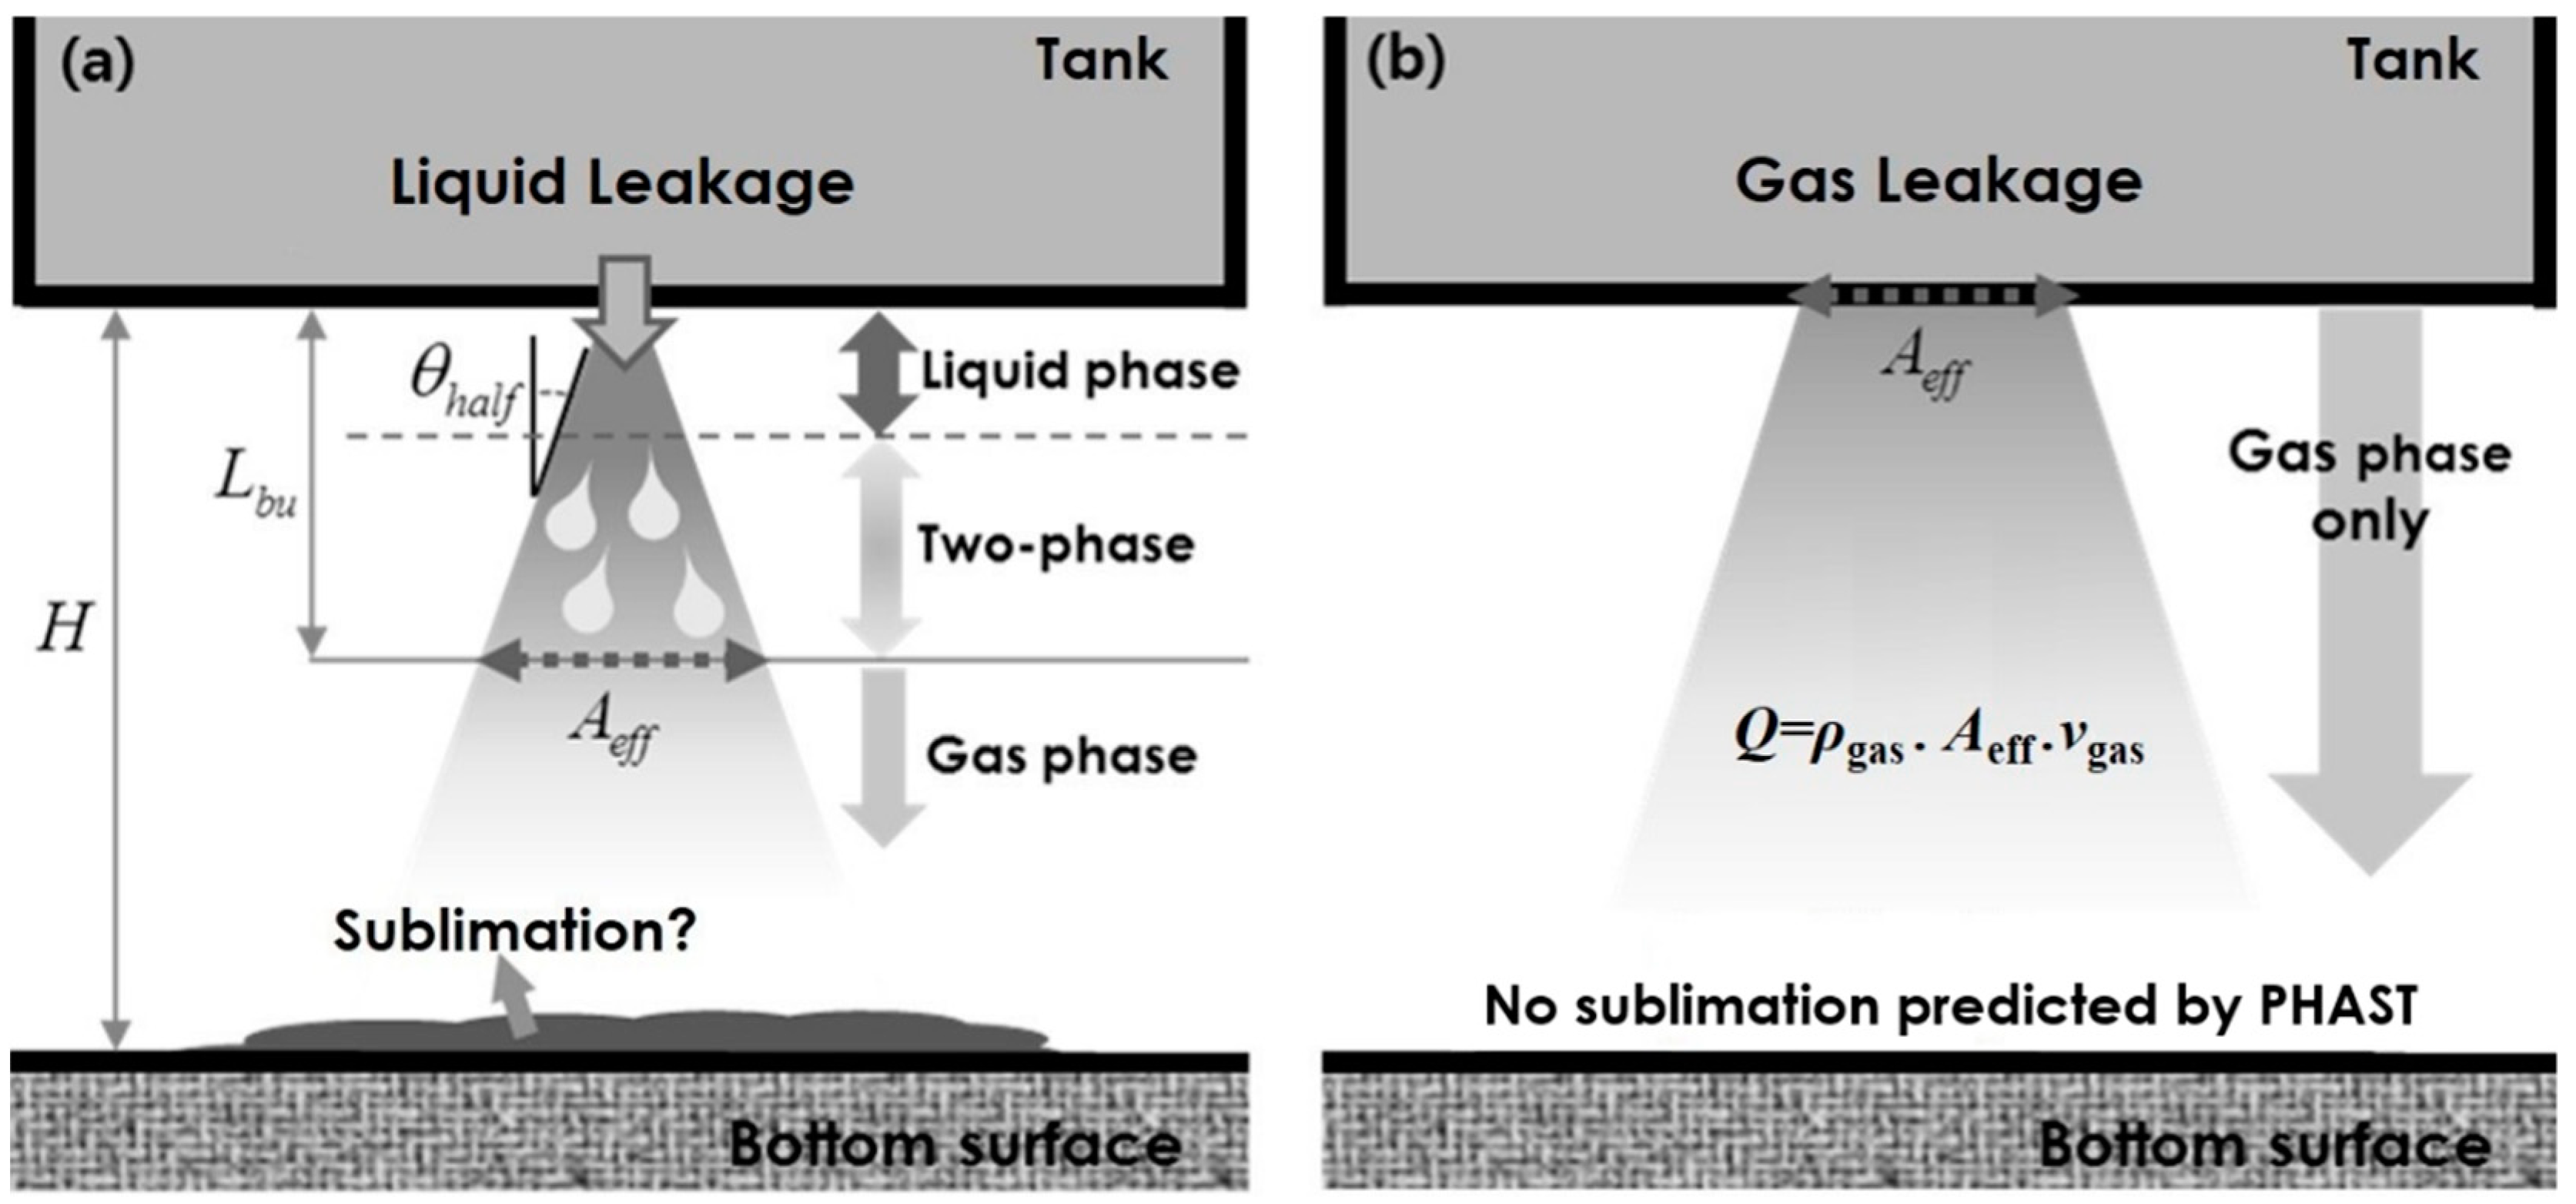
2. Modeling of Gas Leakage

In the literature [15,16], it is reported that there were serious gas leak accidents through various size of cracks near the pipe connections. Based on these reports, it is assumed that CO2 gas escape caused by a leakage under the tank flows in a downward vertical direction at the corner of the container. There might be many factors related to leak scenarios, but the current work focuses mainly on the crack size effect on the leakage characteristics. Indeed, various crack sizes, depending on the defect types, have been reported [17]. Based on the reports, we used three leakage scenarios for a crack diameter ranging from 10 mm to 30 mm by assuming that the crack is caused by external damage, not by corrosion defects in the weld portion. The mass flow rate through the crack had to be determined because it must be used as input at the crack position in the CFD simulation. We used the commercial code of DNV PHAST (V.7.0), which includes the phase change model, for predicting the mass flows rate. From the results, the initial leakage mass flow rates were estimated to be 2.175 kg/s, 8.698 kg/s, and 19.569 kg/s for crack sizes of 10 mm, 20 mm, and 30 mm, respectively.
Because the phase change occurs after the leakage of liquefied CO2, we tried to estimate the required time for phase change theoretically based on the dispersion of flashing jets model [18]. In the case of the pressurized swirling nozzle at 6.8 bars (which was the same as the CO2 storage pressure condition), the spray cone angle and the breakup length were estimated to be 82.13° and 9.34 mm, respectively, based on the atomization model with Re = 2.05 × 10⁶ and We = 3.99 × 10⁵ [19,20]. The predicted Sauter mean diameter (SMD) was 0.0204 μm, obtained from mechanical break-up criterion [21]. For the in-flight evaporation of water drops with a diameter smaller than 230 μm, the lifetime of a drop can be estimated by tlife = D02/(q0 ΔT), where D0 is the initial drop diameter [22]. Here, ΔT is the temperature difference between the ambient temperature and the drop temperature, and q0 is an empirical constant [22]. Finally, the lifetime of CO2 droplets after the break-up was estimated to be 2.40 × 10⁻²⁶ s. With the droplet velocity and lifetime, a distance required for phase change from liquid to gas was estimated to be 5.7 × 10⁻²⁴ m from the crack, which means that the liquefied CO2 changes into the gas phase almost instantly, immediately after leaking. Thus, considering break-up length (Lbu), the total distance required for vaporization of CO2 droplets is less than 0.5% of the total height (H) from the bottom surface, as shown in Figure 1a. It has also been reported that dry ice due to phase change might form and accumulate on the impingement surface according to the operating and environmental conditions. From simulations by the DNV PHAST program under the present conditions, it was found that there was no accumulation of dry ice on the impingement surface because the break-up length was much smaller than the distance between the crack and the bottom surface.
Next, the appropriate inlet boundary condition at the crack position where a rapid phase change occurs had to be determined. Because the phase change occurs rapidly, direct multiphase simulation near the crack becomes very difficult and complicated, resulting in high computational costs as well as causing high numerical uncertainty. As noted before, the total distance required for drop evaporation is much smaller than the impingement distance. Hence, for the sake of simplicity, the present study introduced the effective area concept, as depicted in Figure 1b, for imposing the reasonable boundary condition with the same mass flow rate of gaseous CO2. Here, it is assumed that the liquefied CO2 exposed from the crack evaporates spontaneously. Gas phase velocity, vgas, which is predicted by the DNV PHAST program, considering substantial expansion and phase change, is used as an inlet boundary condition for CFD simulations. The DNV PHAST software assumes one-dimensional homogeneous flow along the expansion zone, which is in thermal equilibrium with zero air entrainment [21]. It also contains the expansion model and the orifice model, based on the conservation of energy and the isentropic process, and is able to estimate gas velocity and mass flow rate. Based on mass conservation, the effective area was calculated by considering the expansion and was used as the modified inlet area, with CO2 gas velocity and mass flow rate obtained by the DNV PHAST code. The present study estimated the effective crack sizes to be 66 mm, 132 mm, and 198 mm for different crack sizes of 10 mm, 20 mm, and 30 mm, respectively.
It is important to make an appropriate and rapid response after CO2 leakage. In this work, a transient simulation was conducted until a flow time of 300 seconds to analyze the gas propagation behavior in the early stage of gas leakage was achieved. More detailed numerical conditions are summarized in Table 1.

3. Mathematical Representations for CFD Simulations

For the simulations, a set of conservation equations, as expressed below, were solved simultaneously for mass, momentum, energy, and species.
ρ t + ( ρ u i ) x i = 0
t ( ρ u i ) + ρ u j u i x j = p x i + τ j i x j + S M
t ( ρ E ) + x i [ u i ( ρ E + p ) ] = x j [ k e f f T x j k h k J j k ]
t ( ρ Y k ) + ( ρ u i Y k ) x i = J j k x j
where ρ is the density; τji is the stress; SM is the external body force; keff is the effective conductivity; Jjk is the diffusion flux of species k; and Yk is the mass fraction of species k. The standard k-ε turbulence model was used, and the standard wall function considering buoyancy effects was employed to describe the turbulent dissipation energy near the wall. The transport equations for the turbulent kinetic energy, k, and the rate of energy dissipation, ε, are given by [23] as follows:
t ( ρ k ) + x i ( ρ u i k ) = x j [ ( μ + μ t σ k ) k x j ] + G k + G b ρ ε + Y M
t ( ρ ε ) + x i ( ρ u i ε ) = x j [ ( μ + μ t σ ε ) ε x j ] + C 1 ε k ( G k + G b ) C 2 ρ ε 2 k
where the turbulent viscosity μt can be obtained by
μ t = C μ ρ k 2 ε
where Gk represents the generation of turbulent kinetic energy due to mean velocity gradients. Gb is the generation of turbulent kinetic energy due to buoyancy. YM represents the contribution of the fluctuating dilatation in compressible turbulence to the overall dissipation rate to account for the compressibility effect. The empirical constants are given by
C 1 = 1.44 , C 2 = 1.92 , C μ = 0.09 , σ k = 1.0 , σ ε = 1.3 .
This simulation used a target CO2 ship that was designed using the hazard identification (HAZID) method, originally developed by the Korea Research Institute of Ships and Ocean Engineering (KRISO). The HAZID method is usually used for obtaining the basic design of a CO2 ship. It provides useful information about the frequency index, severity index, consequence, location, and hazard event [24]. Figure 2 shows a three-dimensional computational model and the specifications of the CO2 ship’s optimized container. The computational domain has a size of 30(L) m × 30(W) m × 21(H) m with a total cargo capacity of 18,000 m3. The container has nine tanks for storing liquefied CO2 in a 3 × 3 square arrangement standing 8.4 m apart from each other. The height and diameter of the cylindrical tanks are 12.5 m and 7 m, respectively. The top and bottom of these tanks are shaped like a spherical cap to distribute high internal pressure up to 6.8 bars. Air pockets in the surrounding regions have an interval of 2 m between the boundary and inner walls, and they are divided by seven lateral and 12 horizontal plates to support the structure. The tween deck is placed horizontally at the height of 14.75 m from the bottom boundary to reinforce the structure of the container.
In the simulation, two separate volumes were constructed for considering conjugate heat transfer between the container and the air pocket. As shown in Figure 3, polyhedral meshes were employed for the entire domain to reduce computational costs. The number of grids selected was approximately 400,000, as determined by the results of the grid independence test. Finer meshes were generated in the vicinity of the crack position to capture rapid variations in temperature and flow motion. Boundary conditions for solving the governing equations were as follows: first, the inlet mass flow rates were estimated to be 2.175 kg/s, 8.698 kg/s, and 19.569 kg/s for different crack sizes of 10 mm, 20 mm, and 30 mm, respectively. The inlet CO2 gas was leaking at −78.37 °C, which is the saturation temperature under atmospheric pressure. It was assumed that the container is filled with air at room temperature and atmospheric pressure.
The Pressure Implicit with Splitting of Operator (PISO) scheme was adopted for pressure-velocity coupling. Moreover, the first order upwind scheme was used in the discretization of all equations. The density of the mixture was calculated using the ideal gas law, and its specific heat was predicted by the mixture properties of temperature. The initial time step was fixed as 10−6 s, depending on the Courant number related to flow stability. The total computational time of each case was approximately two weeks for 300 s of flow time. The commercial CFD code (ANSYS FLUENT V.17.0) was used, and the simulation was carried out using a computer system with a 3.50 GHz processor (IntelR CoreTM i7-3770K CPU) and 8 GB RAM with four nodes.

4. Results and Discussion

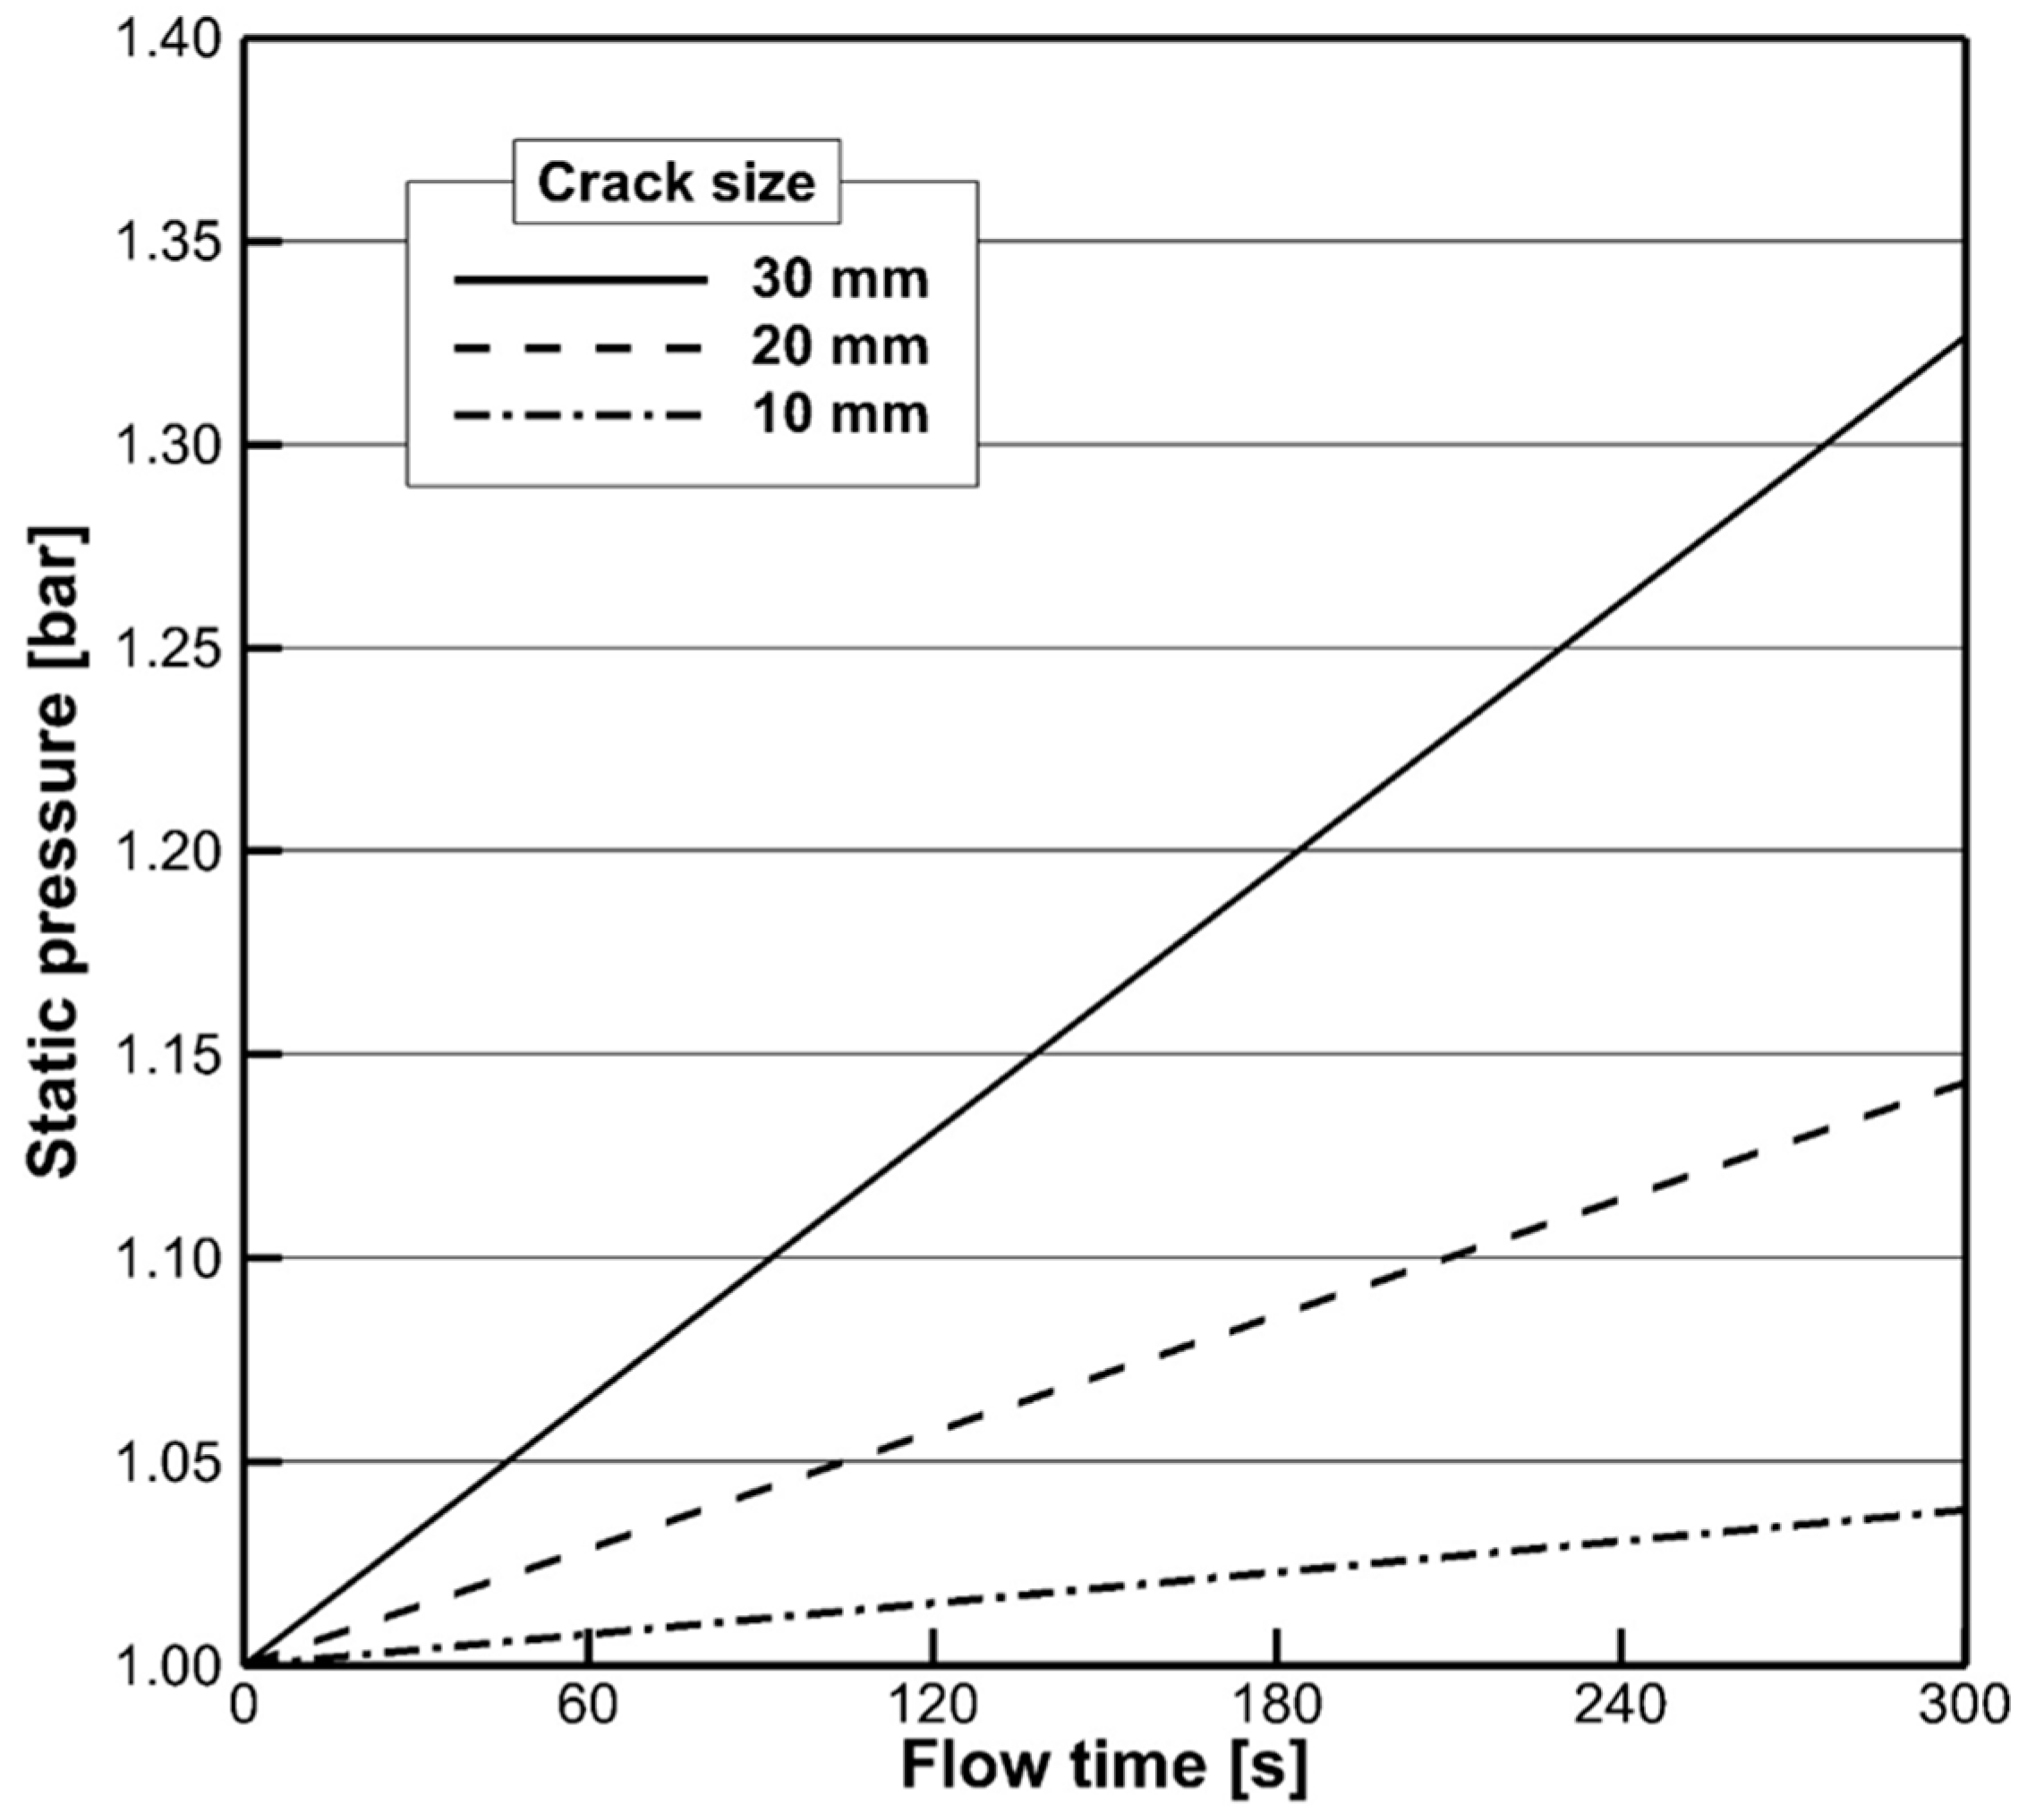
4.1. Flow Characteristics

For a crack size of 10 mm, corresponding to the effective crack size of 66 mm as listed in Table 1, the velocity field at t = 300 s after leakage is shown in Figure 4a. As mentioned, the maximum velocity was predicted to be 237.7 m/s by using DNV PHAST, and it was used for the input boundary condition at the crack position. Rapid expansion occurs after leakage, as discussed above, and the gas phase with high velocity generated by the phase change and rapid volume expansion was considered in the CFD simulation. In Figure 4a, this CO2 gas flow impinges on the bottom surface and spreads in a radial direction, similar to the impinging jet flow characteristics [25]. Owing to the flow diffusion, a rapid decrease in flow velocity was observed, e.g., the flow velocity decreased by up to 28 m/s approximately at y = 0.3 m. The velocity profiles at different locations from the bottom surface are presented in Figure 4b. A substantial change in the flow velocity is shown because of the rapid transport of momentum and energy through convection and diffusion in the free jet zone.
As mentioned, the present study used the gas leakage model for appropriate inlet conditions at the prescribed crack position. The well-predicted velocity profile becomes very important because it significantly affects the flow behavior near the bottom surface. For validation, the present study conducted additional simulations under the same experimental conditions [26]. We compared the predicted velocity profile and the radius at half-maximum velocity with the experimental results [26], as shown in Figure 5. The prediction of the mean velocity profile shows very good agreement with the experimental measurements, showing that the current gas leakage model is acceptable for determining the inlet conditions.
After a leak, the decrease of the hydraulic level in the tank leads to a gas pressure increase in the container due to the accumulated mass of leaked CO2 gas. The present simulation considered the change in the pressure difference between the tank pressure and the environmental pressure, resulting in a decrease in the mass flow rate of the leaked gas. We made a controllable user-defined function embedded in the commercial code of FLUENT to control the mass flow rate varying with time.
Figure 6 presents the predicted volume-averaged static pressure. The static pressure increased linearly with a gradient proportional to the leakage flow rates, depending on the effective crack area. The estimated pressures at t = 300 s were reported to be 1.04 bars, 1.14 bars, and 1.32 bars for crack sizes of 10 mm, 20 mm, and 30 mm, respectively. According to the design guidelines of the transport ship, such ventilation or decompression systems should be operated when the static pressure exceeds 1.2 bars. Thus, the estimated pressure would be useful information to have when assessing the needs of ventilation system operation. Additionally, we considered that the local pressure near the crack would exceed the average pressure value because the CFD simulation was considering non-homogeneous conditions. However, the dynamic pressure of leaking gas on the bottom surface was less than 0.01 bars, indicating that the dynamic pressure effect was negligible, compared to the order of static pressure.

4.2. Accumulation of CO2 Concentration

Since humans can lose consciousness within a few minutes when exposed to CO2 gas at a concentration of over 10% [27,28], a CO2 concentration of 10% can be regarded as a safety threshold. The predicted CO2 concentration distribution passing through the crack is provided in Figure 7. The results show that the maximum CO2 concentration occurs at the corner region near the crack location. A much higher CO2 concentration in comparison to other regions is also predicted around the corner. For efficient evacuation, it is important to analyze a critical time at which the CO2 concentration reaches 10% at human nasal height. The first critical time is observed at the corner and estimated to be 195 s, 48 s, and 25 s for crack sizes of 10 mm, 20 mm, and 30 mm, respectively. With the increase in the crack size, the critical time is inversely proportional to the square of the crack size depending on the leakage mass flow rate.
From an engineering viewpoint, as shown in Figure 8, it would be useful to define a dangerous volume of CO2 concentration being over 10%, to characterize three-dimensional leakage behavior. Physically, the leaked CO2 gas is rarely propagated toward the upper tween deck region because of the buoyancy effect. In the case of the 30 mm crack size, it was reported that the whole region below the tween deck could become a dangerous volume within 300 s. To investigate the propagation tendency, the dangerous volume fraction, defined as the ratio of the dangerous volume to the entire cargo volume, is presented in Figure 9. We see that a substantial difference in dangerous volume depending on crack size is observed at the initial stage of leakage. As noted previously, the initial leakage mass flow rates were estimated to be 2.175 kg/s for a crack size of 10 mm, which is about nine times lower than a crack size of 30 mm. Thus, the diffusion effect is dominant in the early stage of leakage owing to a lower mass flow rate, showing a lower increasing rate of the dangerous volume, compared to the other two cases. When the crack size increases, the gradient at the initial stage becomes higher than the ratio of the mass flow rate. From the results, it was noted that the gas sensor systems should be installed near the bottom corners of the container for the rapid detection of leaked gas.

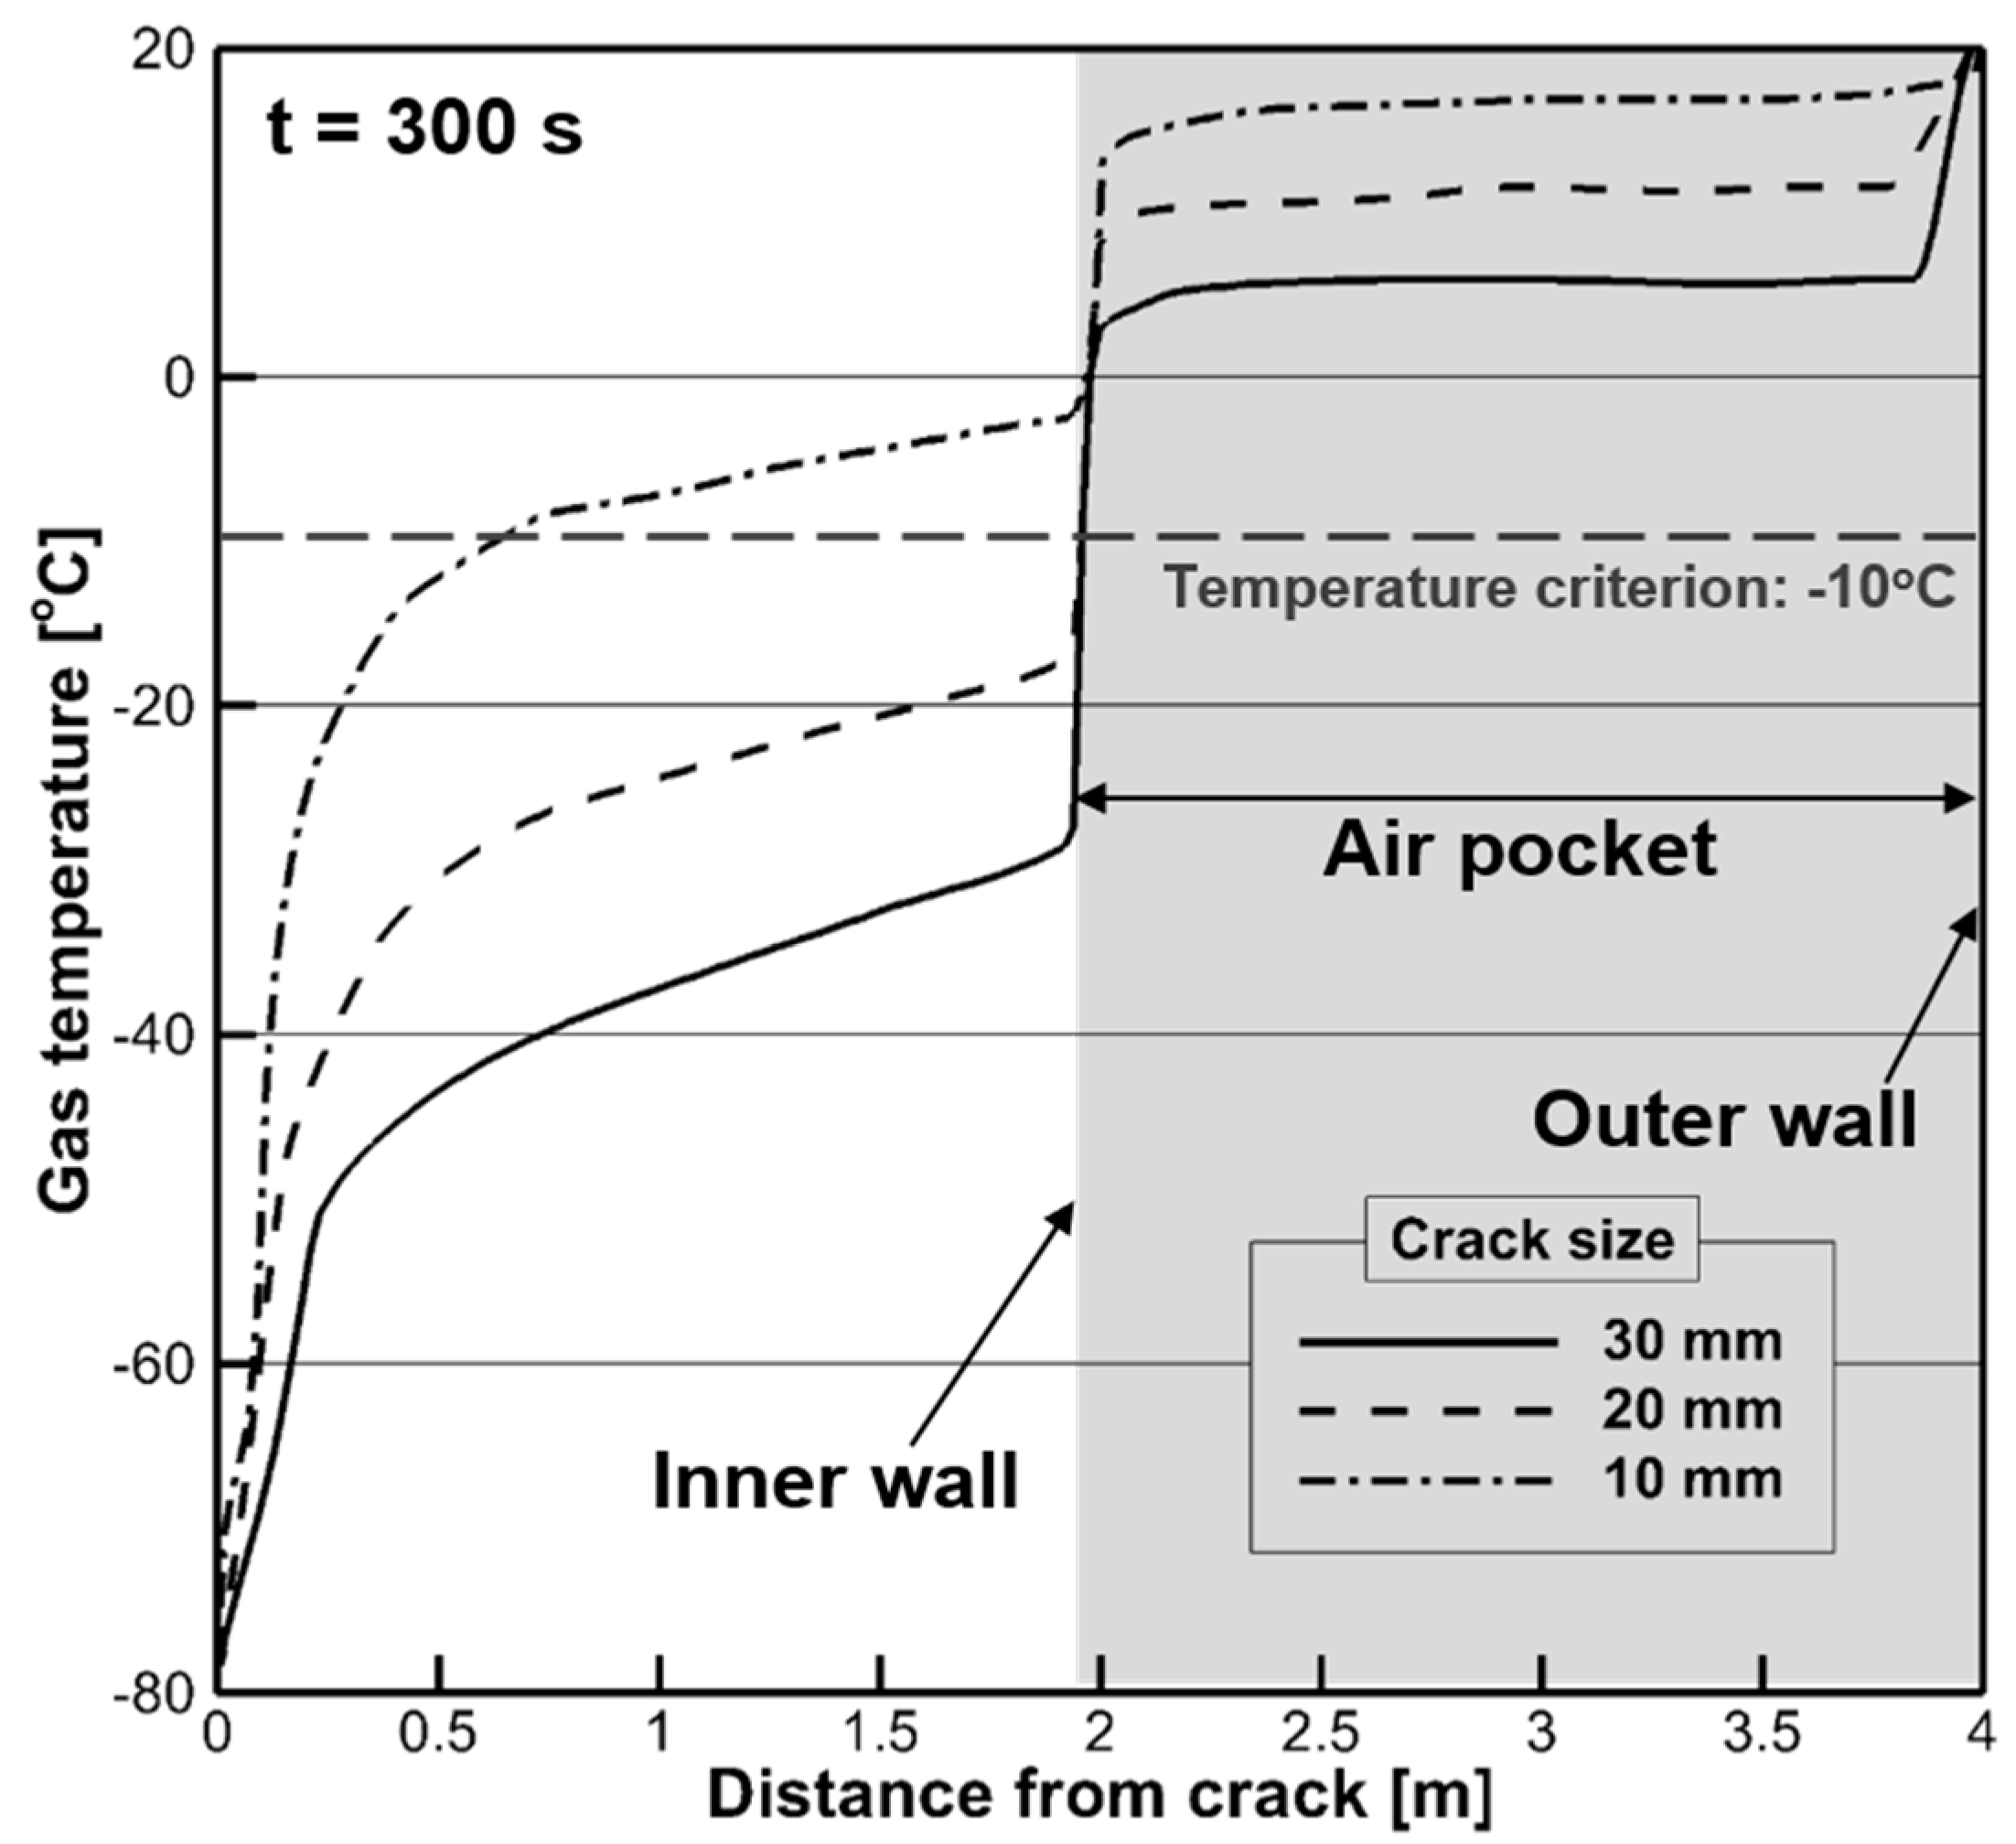
4.3. Evolution of Wall Temperature

The leaked CO2 temperature might drop rapidly to −78.37 °C under atmospheric pressure according to the phase diagram [9]. AH steel, which is a higher tensile steel of grade “A”, is typically used as a material for hull structures [14]. In the case of AH steel in the manufacturing industry, the design temperature was determined as −10 °C when considering the thickness of hull structure during thermal deformation, based on the Charpy V-notch test results. Based on the IGC code, this AH steel was determined as the material for hull construction, without a secondary barrier in container [29]. Figure 10 shows the temperature profile with respect to the vertical distance from the crack to the bottom surface at 300 s. The inlet gas temperature is −78.37 °C, and the gas impinges on the wall with an initial temperature of 20 °C in the CFD simulation. A steep gradient of gas temperature is shown in the vicinity of the crack due to intensive convective heat transfer. The temperature gradient increases with the crack size because of the increased thermal mass, proportional to the leakage flow rate. Variations in temperature affect the air pocket region where conjugated heat transfer occurs through the wall.
According to the regulations regarding ship classification, the design temperature of AH Steel for a hull structure is known to be −10 °C [14]. To avoid thermal damage, it is necessary to evaluate temperature evolution based on the given design temperature. The minimum solid temperature near the impingement surface was estimated to be −2.54 °C, −15.77 °C, and −28.17 °C for crack sizes of 10 mm, 20 mm, and 30 mm, respectively. For crack sizes larger than 20 mm, the impingement surface temperature decreased below −10 °C, which could cause structural damage induced by thermal stress. This result supports the fact that material selection and structural design should be carefully made by considering the threshold temperature to avoid thermal damage.

5. Conclusions

The present study investigated CO2 gas propagation and thermal characteristics in a tank of a transport ship numerically by using two commercial codes. The local variations of temperature and gas concentration behavior were examined for different crack sizes. Moreover, an effective crack area was introduced to determine the boundary conditions for CFD simulations. The following conclusions were drawn.
  • Considering the phase change, the gas velocity exhausted from the crack was estimated by considering rapid gas expansion. According to the mass conservation principle, an effective crack area was calculated for making appropriate boundary conditions for CFD simulations. The ejected gas flow was rapidly diffused and impinged on solid surfaces. In particular, the CO2 concentration changed rapidly depending on the crack size. The present study provided the evolution of a dangerous volume with a CO2 concentration above 10 %, showing an increasing tendency as the crack size increased.
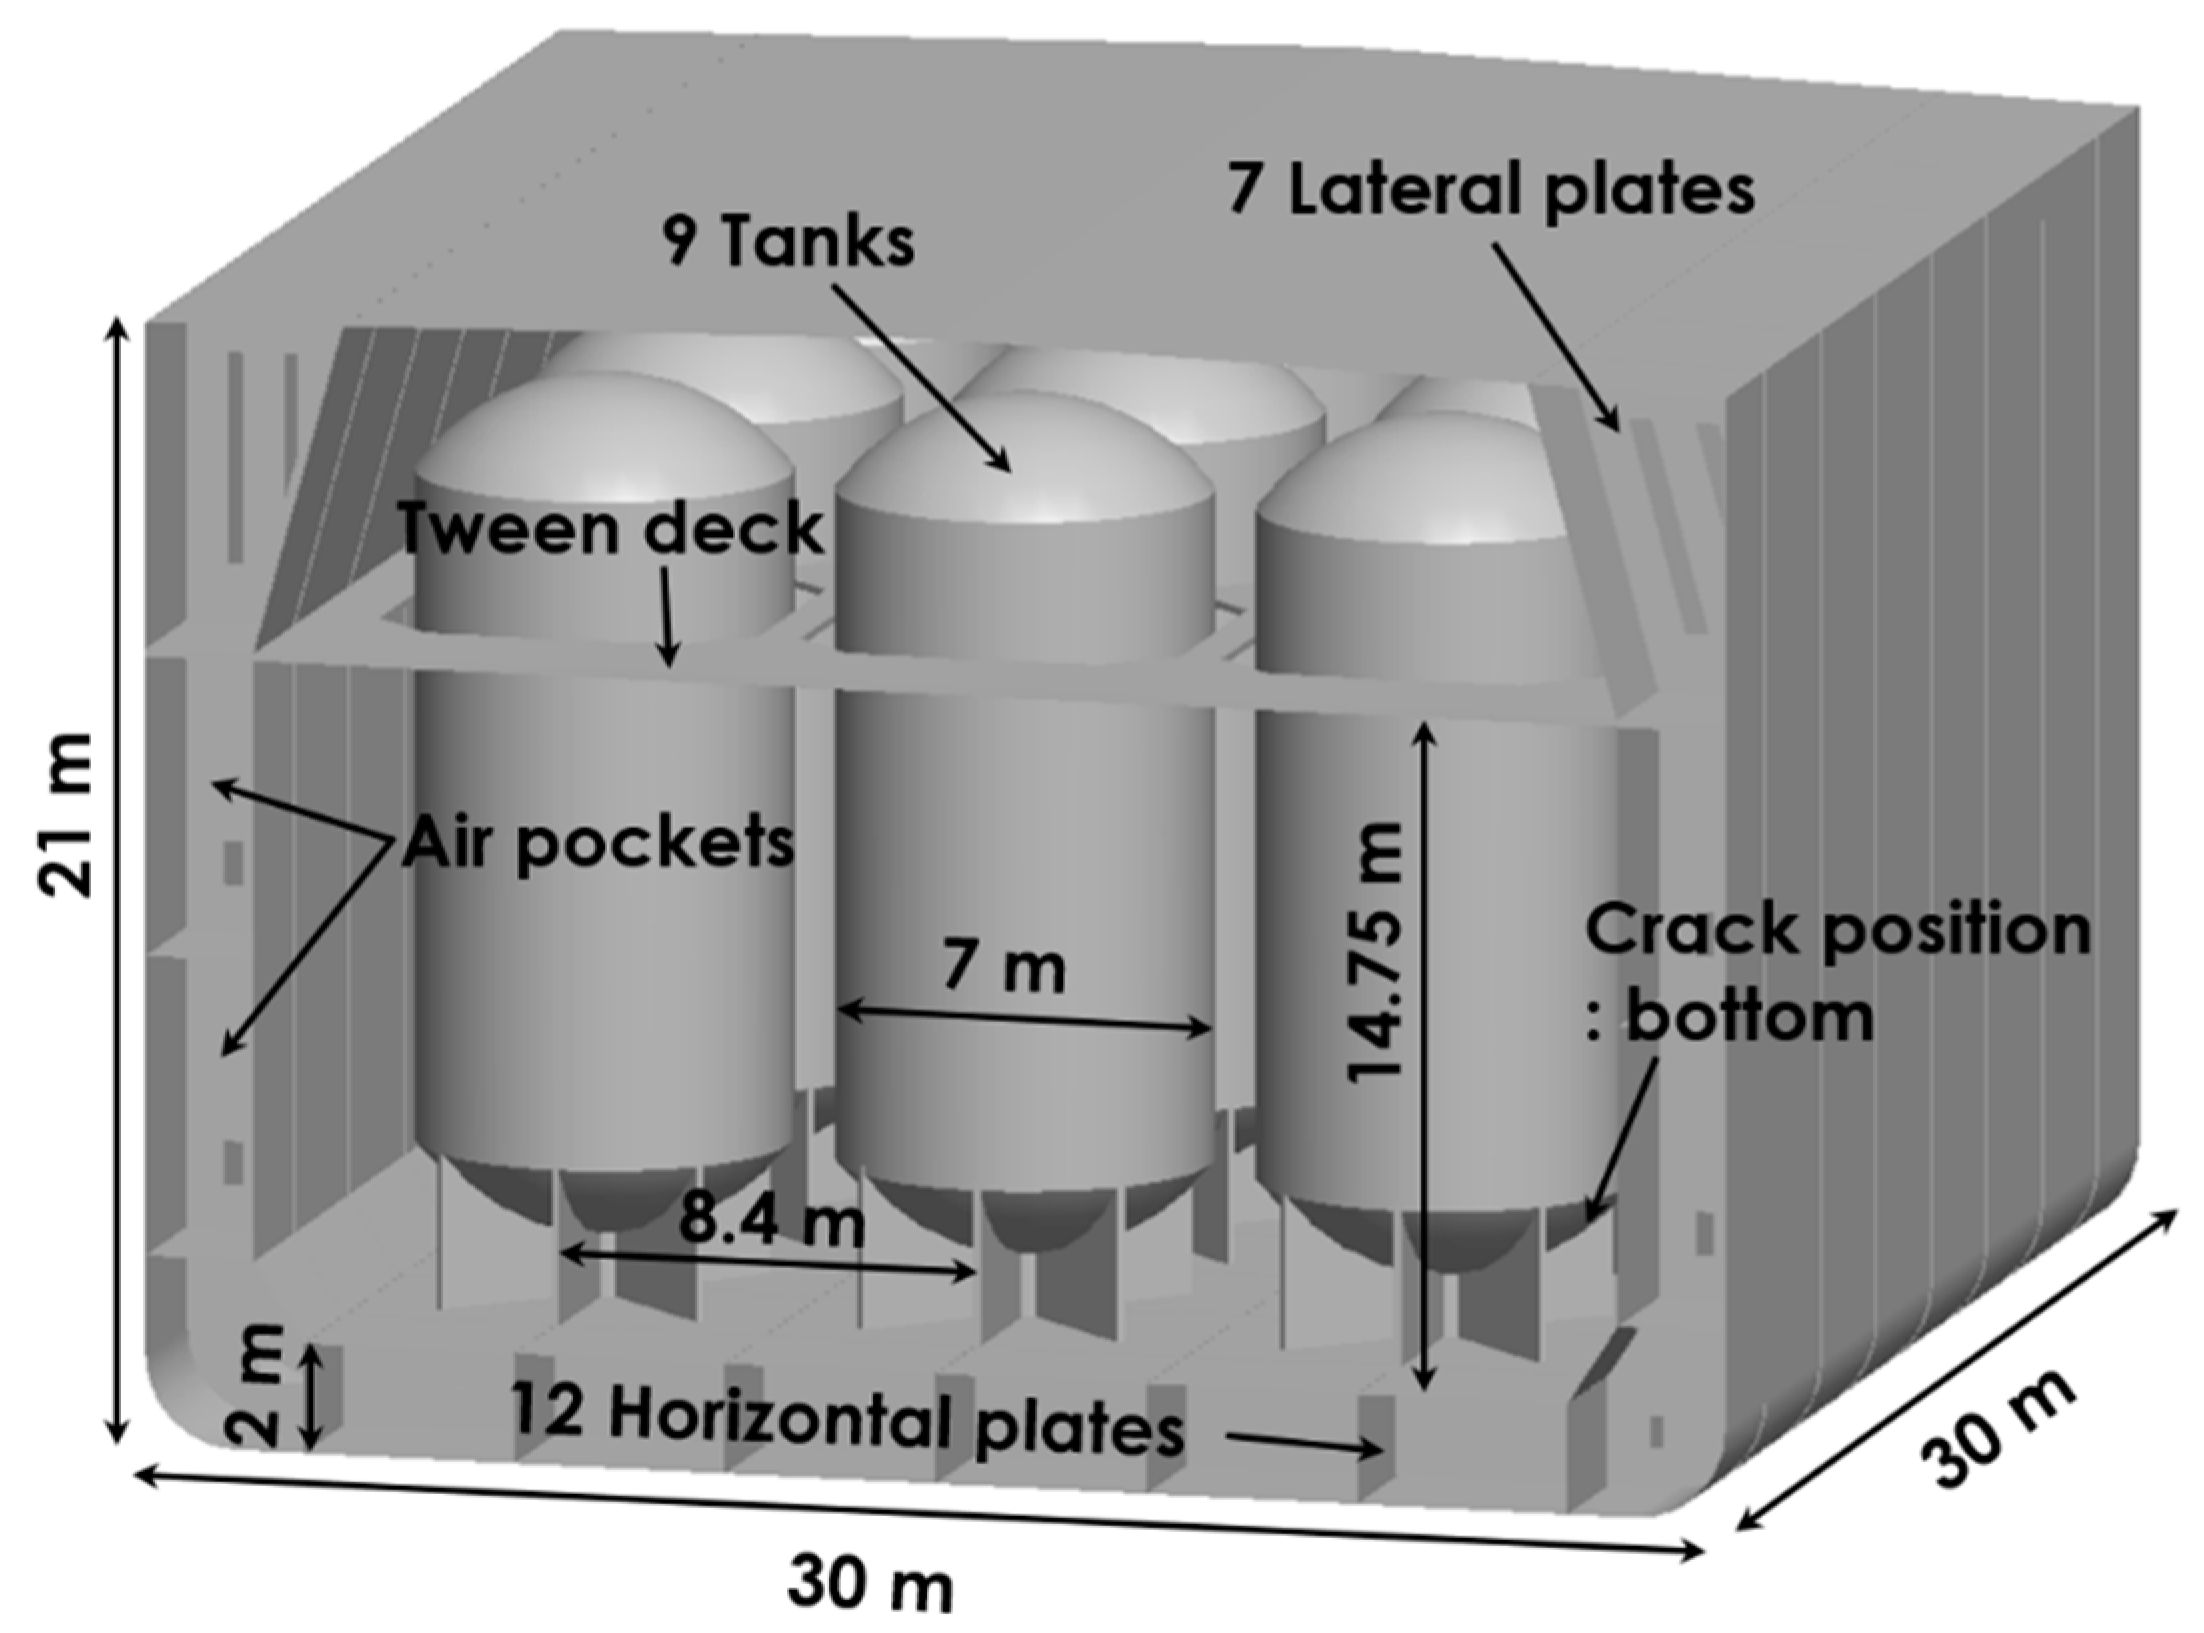
  • Numerical results showed that the leaked CO2 gas rarely propagated toward the upper tween deck region because of the buoyancy effect. For a crack size of 30 mm, it was predicted that the entire region below the tween deck could become a dangerous volume within 300 s. Moreover, a substantial difference in dangerous volume with differing crack sizes was observed at the initial stage of leakage. The present CFD result supported the fact that, for quick detection before propagation, the gas sensors should be mounted near the bottom corners of the container of a transport ship.
  • The temperature profile from the crack to the air pocket exhibited a decreasing tendency as the crack size increased. The solid temperature of the impingement surface decreased rapidly below the design temperature when the crack size was larger than 20 mm. However, the sudden change in the wall temperature was delayed owing to the conjugate heat transfer from the air pocket.

Author Contributions

Conceptualization, S.H.L. and M.-S.S.; investigation, D.Y.K., C.H.J., B.J.P., and M.S.K.; methodology, D.Y.K. and C.H.J.; supervision, S.H.L.; writing of the original draft, D.Y.K.

Acknowledgments

This research was supported by the development of human resources for design specialists in applications of functional materials (Brain Korea (BK) 21).

Conflicts of Interest

The authors declare no conflict of interest.

References

  1. Metz, B.; Davidson, O.; de Coninck, H.; Loos, M.; Meyer, L. IPCC Special Report on Carbon Dioxide Capture, Storage; Cambridge University Press: Cambridge, UK, 2005. [Google Scholar]
  2. McCoy, S.T.; Rubin, E.S. An engineering-economic model of pipeline transport of CO2 with application to carbon capture and storage. Int. J. Greenh. Gas Control 2008, 2, 219–229. [Google Scholar] [CrossRef]
  3. Michael, K.; Golab, A.; Shulakova, V.; Ennis-Kng, J.; Allinson, G.; Sharma, S.; Aiken, T. Geological storage of CO2 in saline aquifers-A review of the experience from existing storage operations. Int. J. Greenh. Gas Control 2010, 4, 659–667. [Google Scholar] [CrossRef]
  4. Pires, J.C.M.; Martins, F.G.; Aluim-Ferraz, M.C.M.; Simoes, M. Recent development on carbon capture and storage: An overview. Chem. Eng. Res. Des. 2011, 89, 1446–1460. [Google Scholar] [CrossRef]
  5. Svensson, R.; Odenberger, M.; Johnsson, F.; Stromberg, L. Transportation systems for CO2-application to carbon capture and storage. Energy Convers. Manag. 2004, 45, 2343–2353. [Google Scholar] [CrossRef]
  6. Jeon, S.H.; Choi, Y.U.; Kim, M.S. Review on boil-off gas (BOG) re-liquefaction system of liquefied CO2 transport ship for carbon capture and sequestration (CCS). Int. J. Air-Cond. Refrig. 2016, 24, 1650017. [Google Scholar] [CrossRef]
  7. Yoo, B.Y.; Choi, D.-K.; Huh, C.; Kang, S.-G.; Kim, I.-S. A feasibility study on CO2 marine transport in South Korea. Energy Procedia 2013, 37, 3199–3211. [Google Scholar] [CrossRef]
  8. Vandeginste, V.; Piessens, K. Pipeline design for a least-cost router application for CO2 transport in the CO2 sequestration cycle. Int. J. Greenh. Gas Control 2008, 2, 571–581. [Google Scholar] [CrossRef]
  9. Jeon, S.H.; Kim, M.S. Compressor selection methods for multi-stage re-liquefaction system of liquefies CO2 transport ship for CCS. Appl. Therm. Eng. 2015, 82, 360–367. [Google Scholar] [CrossRef]
  10. Mazzoldi, A.; Hill, T.; Colls, J.J. CFD and Gaussian atmospheric dispersion models: A comparison for leak from carbon dioxide transportation and storage facilities. Atmos. Environ. 2008, 42, 8046–8054. [Google Scholar] [CrossRef]
  11. Wang, Z.; Fimbres Weihs, G.A.; Cardenas, G.I.; Wiley, D.E. Optimal pipeline design for CCS projects with anticipated increasing CO2 flow rates. Int. J. Greenh. Gas Control 2014, 31, 165–174. [Google Scholar] [CrossRef]
  12. Mazzoldi, A.; Hill, T.; Colls, J.J. CO2 transportation for carbon capture and storage: Sublimation of carbon dioxide from a dry ice bank. Int. J. Greenh. Gas Control 2008, 2, 210–218. [Google Scholar] [CrossRef]
  13. Zhang, Z.X.; Wang, G.X.; Massarotto, P.; Rudolph, V. Optimization of pipeline transport for CO2 sequestration. Energy Convers. Manag. 2006, 47, 702–715. [Google Scholar] [CrossRef]
  14. Okumoto, Y.; Takeda, Y.; Mano, M.; Okada, T. Design of Ship Hull Structures—A Practical Guide for Engineers; Springer: New York, NY, USA, 2009. [Google Scholar]
  15. Minescu, M.; Pana, I. Safety evaluation of the pipelines systems for petroleum products. Appl. Mech. Mater. 2013, 371, 782–786. [Google Scholar] [CrossRef]
  16. Eparu, C.; Albulescu, M.; Neacsu, S.; Albulescu, C. Gas leaks through corrosion defects of buried gas transmission pipelines. Rev. Chim-Buchar. 2014, 65, 1385–1390. [Google Scholar]
  17. Bai, M. Risk assessment for CO2 leakage along abandoned wells using a Monte Carlo simulation in a CO2 sequestration site. Pet. Sci. Technol. 2014, 32, 1191–1200. [Google Scholar] [CrossRef]
  18. Calay, R.K.; Holdo, A.E. Modelling the dispersion of flashing jets using CFD. J. Hazard. Mater. 2008, 154, 1198–1209. [Google Scholar] [CrossRef] [PubMed]
  19. Laryea, G.N.; No, S.Y. Spray angle and breakup length of charge-injected electrostatic pressure-swirl nozzle. J. Electrost. 2004, 60, 37–47. [Google Scholar] [CrossRef]
  20. Ghurri, A.; Kim, J.D.; Kim, H.G.; Jung, J.Y.; Song, K.K. The effect of injection pressure and fuel viscosity on the spray characteristics of biodiesel blends injected into an atmospheric chamber. J. Mech. Sci. Technol. 2012, 26, 2941–2947. [Google Scholar] [CrossRef]
  21. DNV Software. Droplet Size Theory Document; Palace House: London, UK, 2011. [Google Scholar]
  22. Holterman, H.J. Kinetics and Evaporation of Water Drops in Air; IMAG Report; Institute of Agricultural and Environmental Engendering: Wageningen, The Netherlands, 2012. [Google Scholar]
  23. ANSYS Inc. Ansys Fluent User’s Guide 16.1; ANSYS Inc.: Canonsburg, PA, USA, 2010. [Google Scholar]
  24. Kim, K.; Kang, H.; Kim, Y. Risk assessment for natural gas hydrate carriers: A hazard identification (HAZID) study. Energies 2015, 8, 3142–3164. [Google Scholar] [CrossRef]
  25. Hong, S.K.; Cho, H.H. The review of studies on heat transfer in impinging jet. Int. J. Air-Cond. Refrig. 2005, 13, 196–205. [Google Scholar]
  26. Anderson, A.; Johns, F.R. Characteristics of free supersonic jets exhausting into quiescent air. J. Jet Propuls. 1955, 25, 13–15. [Google Scholar] [CrossRef]
  27. Langford, N.J. Carbon dioxide poisoning. Toxicol. Rev. 2005, 24, 229–235. [Google Scholar] [CrossRef] [PubMed]
  28. Canadian Center for Occupational and Health and Safety (CCOHS). Chemical Profiles—Carbon Dioxide; CCOHS: Hamilton, ON, Canada, 2005; Available online: http://www.ccohs.ca/oshanswers/ (accessed on 30 April 2018).
  29. IMO Publication. IGC Code: International Code for the Construction and Equipment of Ships Carrying Liquefied Gases in Bulk (IA 104E); IMO Publication: London, UK, 2016. [Google Scholar]
Figure 1. (a) Physics of phase change during leakage, and (b) gas leakage modeling.
Applsci 09 02536 g001
Figure 2. Geometric design configuration of the CO2 container.
Applsci 09 02536 g002
Figure 3. Grid system and boundary conditions for CO2 cargo room.
Applsci 09 02536 g003
Figure 4. (a) Velocity field from crack to bottom surface, and (b) velocity profile in radial direction with respect to height from bottom in the case of 10 mm crack size at 300 s.
Applsci 09 02536 g004
Figure 5. Validation of (a) radial velocity profile and (b) jet radius at half-maximum velocity.
Applsci 09 02536 g005
Figure 6. Volume-averaged static pressure evolution with time at different crack sizes.
Applsci 09 02536 g006
Figure 7. CO2 concentration distribution at the cross-sectional plane passing through the crack.
Applsci 09 02536 g007
Figure 8. Dangerous volume evolution in the container.
Applsci 09 02536 g008
Figure 9. Dangerous volume fraction with time in the container.
Applsci 09 02536 g009
Figure 10. Gas temperature profile with respect to the distance from the crack.
Applsci 09 02536 g010
Table 1. Summary of numerical details.
Description (unit)DetailNote
Crack size (mm)10/20/30
Mass flow rate (kg/s)2.175/8.698/19.569estimation by PHAST
Effective crack size (mm)66/132/198
Density (kg/m3)air@20°C = 1.225
CO2@20°C = 1.789
ideal gas law
Heat capacity (J/kg∙K)air@20°C = 1006.43
CO2@20°C = 847.07
piecewise-polynomial profile
Thermal conductivity (W/m∙K)air@20°C = 0.0242
CO2@20°C = 0.0145
steel@20°C = 16.27
piecewise-polynomial profile
Inlet conditionsTCO2 = −78.37 °C
YCO2 = 1
saturation temperature of CO2 at 1 bar [9]
Initial environmental conditionsTair = 20 °C
Yair = 1
room temperature
Boundary conditionsTamb = 20 °Cambient temperature
Design temperatureTdesign = −10 °Cdamage to AH steel [14]
CO2 concentration limitYCO2 = 0.1injury to humans
Flow time (s)300sufficient time to analyze the gas propagation

