Article

A Novel Remote Sensing Index for Extracting Impervious Surface Distribution from Landsat 8 OLI Imagery

1
School of Geography, Nanjing Normal University, Nanjing 210023, China
2
Key Laboratory of Virtual Geographic Environment (Nanjing Normal University), Ministry of Education, Nanjing 210023, China
3
Jiangsu Center for Collaborative Innovation in Geographical Information Resource Development and Application, Nanjing 210023, China
*
Author to whom correspondence should be addressed.
Appl. Sci. 2019, 9(13), 2631; https://doi.org/10.3390/app9132631
Submission received: 25 April 2019 / Revised: 6 June 2019 / Accepted: 27 June 2019 / Published: 28 June 2019

Abstract

:
The area of urban impervious surfaces is one of the most important indicators for determining the level of urbanisation and the quality of the environment and is rapidly increasing with the acceleration of urbanisation in developing countries. This paper proposes a novel remote sensing index based on the coastal band and normalised difference vegetation index for extracting impervious surface distribution from Landsat 8 multispectral remote sensing imagery. The index was validated using three images covering urban areas of China and was compared with five other typical index methods for the extraction of impervious surface distribution, namely, the normalised difference built-up index, index-based built-up index, normalised difference impervious surface index, normalised difference impervious index, and combinational built-up index. The results showed that the novel index provided higher accuracy and effectively distinguished impervious surfaces from bare soil, and the average values of the recall, precision, and F1 score for the three images were 95%, 91%, and 93%, respectively. The novel index provides better applicability in the extraction of urban impervious surface distribution from Landsat 8 multispectral remote sensing imagery.

1. Introduction

Impervious surfaces are artificial surfaces that water cannot infiltrate to reach the soil, such as parking lots, streets, and highways [1]. Changes in land use and land cover caused by the expansion of impervious surfaces are likely to influence the regional climate [2]. Jacobson et al. and Huszar et al. pointed out that the impervious surface area and land surface temperature are positively correlated, and the expansion of impervious surfaces will result in the increase of the land surface temperature which may cause uneven distribution of urban heat and trigger the urban heat island effect [3,4].
Accurate and fast extraction methods for impervious surface distribution are important which is helpful for detecting regional environmental changes in urban areas and achieving sustainable urban development. They can be divided into two categories, namely, field surveys and remote sensing [1]. Field surveys can provide more detailed information on impervious surface distribution but are time-consuming, laborious, and difficult to apply to the assessment of large areas. In contrast, widely-used remote sensing methods can extract impervious surface distribution quickly, and sources of commonly used remote sensing images include the QuickBird [5], WorldView-2 [6], and Landsat satellites [7], etc. When extracting impervious surface distribution in a large urban area, Landsat imagery is often the primary choice because of its medium spatial resolution and free availability, while remote sensing imagery with fine spatial resolution is subject to economic constraints.
Remote sensing methods used in the extraction of impervious surface distribution include index methods, spectral mixture analysis (SMA), and classification methods. Firstly, index methods construct a feature index based on the spectral difference between impervious surfaces and other ground objects and have been a popular research focus because of their simplicity in calculation. Zha et al. constructed the normalised difference built-up index (NDBI) on the basis of the near-infrared and shortwave-infrared bands [7]. Xu proposed the index-based built-up index (IBI), which is based on the NDBI, soil-adjusted vegetation index (SAVI) and modified normalised difference water index (MNDWI) [8]. Xu constructed the normalised difference impervious surface index (NDISI) on the basis of the thermal band, MNDWI, near-infrared band, and shortwave-infrared band [9]. Wang et al. devised the normalised difference impervious index (NDII), which is based on the visible and thermal bands [10]. Sun et al. developed the combinational built-up index (CBI) by combining the first principal component (PC1), normalised difference water index (NDWI), and SAVI [11]. Secondly, SMA calculates the fractions of land cover types in a pixel and models a mixed spectrum as a combination of the spectra for pure types of land cover, and it includes linear SMA (LSMA) and nonlinear SMA (NLSMA). Voorde et al. utilised LSMA to extract the impervious surface distribution [12]. Zhao et al. revised LSMA using principal component analysis and the NDBI [13]. Roberts et al. proposed multiple-endmember spectral mixture analysis [14], which was improved by Fan et al. to achieve higher efficiency and precision [15]. Finally, classification methods divide pixels into impervious and permeable surfaces according to the features of the image, and commonly used classifiers include support vector machines (SVMs) [16], artificial neural networks (ANNs) [17], and random forest (RF) [18], etc. Tehrany et al. extracted impervious surface distribution in Malaysia by an SVM [19]. Patel and Mukherjee used the ANN method [20]. Pelletier et al. utilised the RF method to extract impervious surface distribution in France and compared it with the SVM method [21]. In general, SMA and classification methods are complex and time-consuming, and their accuracy is easily influenced by the quality of the selected samples, whereas index methods involve no additional parameters and are more easily applied [11].
Extraction methods of impervious surface distribution from Landsat imagery (Thematic Mapper (TM) and Landsat 7 Enhanced Thematic Mapper Plus (ETM+)) have often been validated using imagery obtained in summer, when the vegetation is lush and often distinguished from impervious surfaces easily [7,8,9,10]. However, remote sensing images are not always available in every area in summer, such as the east of China where summer is often rainy. Besides, the methods themselves have poor abilities to mask bare soil [10,11]. The quality of Landsat 8 Operational Land Imager (OLI) imagery is better than that of Landsat 5 TM and Landsat 7 ETM+ imagery, but the existing index methods for the extraction of impervious surface distribution may lose applicability because of the differences in the sensor, wavelength range, and image quantisation bit [22].
In this study, a ratio-based impervious surface index (RISI) was proposed to simplify the extraction process and mask permeable surfaces such as bare soil. The index was validated by three typical images covering urban areas of China in winter and summer and the results were compared with those of five other typical methods for the extraction of impervious surface distribution, namely, the NDBI, IBI, NDISI, NDII, and CBI.

2. Data and Methods

2.1. Data

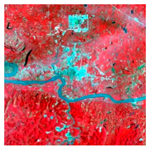
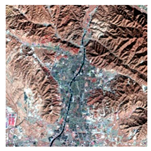
In this study, three case images without cloud or snow downloaded in Geospatial Data Cloud [23] were used of which two were obtained in summer when vegetation is lush and one was obtained in winter when vegetation is withered and bare soil is widely distributed. The image sizes are 480 rows × 480 columns with a pixel size of 30 m, and their (5, 4, 3) false colour composites are shown in Figure 1.
Typical ground objects in these case images include vegetation, bare soil, water body, and impervious surfaces, and present more representative and complexely. In the (5, 4, 3) false colour composite image with a 2% linear stretch, the vegetation is red in summer such as Cases 1 and 2 and easily distinguished from impervious surfaces because of their different spectral features; bare soil is exposed in winter, such as in Case 3, and is easily confused with impervious surfaces because of their similar spectral features.

2.2. Extraction of Impervious Surface Distribution

2.2.1. Proposed Method

According to the vegetation–impervious surface–soil (VIS) model [24], land cover consists mainly of vegetation (V), impervious surfaces (I) and bare soil (S), with the exception of water bodies. In remote sensing imagery, the largest difference in land cover is that between water bodies and land, and land can further be divided into impervious surfaces and permeable surfaces (vegetation and bare soil). Hence, the workflow can be divided into two steps, namely, masking water bodies and extracting impervious surfaces from land.
An impervious surface is an area without vegetation coverage and thus has a lower NDVI value [25]. Studies by Wang et al. and Mu et al. showed that impervious surfaces usually have higher values in the blue band [10,26]. Besides, Chen pointed out that the coastal band in Landsat 8 imagery can enhance information on impervious surfaces more significantly than the blue band, and the addition of the coastal band in the supervised classification of land use is beneficial for further distinguishing impervious surfaces from other ground objects [27].
In this study, a RISI was proposed for extracting impervious surface distribution on the basis of the coastal band and NDVI of a digital number (DN) image and is defined by Equation (1):
R I S I = B 1 N D V I 1
where B1 and NDVI1 denote the coastal band and NDVI, respectively, after a 0–1 transformation.
The workflow comprises the following four steps:
(a) Water bodies are first masked;
(b) The coastal band undergoes a 0–1 transformation to obtain B1;
(c) The NDVI is calculated, and then a 0–1 transformation is performed to obtain NDVI1; and
(d) The RISI is calculated and then segmented using a threshold determined by the Otsu method [28].
1. Water Body Masking
The water body index (WI) is calculated using Equation (2) [29]:
W I = G r e e n S W I R 1
where Green denotes the green band and SWIR1 denotes the shortwave-infrared band.
The value corresponding to the right valley of the WI histogram is manually fine-tuned as the segmentation threshold to mask water bodies.
2. 0–1 Transformation of the Coastal Band
The coastal band undergoes a 0–1 transformation to obtain B1 according to Equation (3):
T 1 = T 0 m i n m a x m i n
where T0 and T1 denote the band before and after the 0–1 transformation according to Equation (3), respectively, and max and min are the maximum and minimum values of the band, respectively.
3. Calculation of the NDVI
The NDVI is calculated using Equation (4) [30]:
N D V I = N I R R e d N I R + R e d
where Red denotes the red band and NIR denotes the near-infrared band. Then, the NDVI undergoes a 0–1 transformation to obtain NDVI1 in an analogous way to Equation (3).
4. Calculation of the RISI
The RISI is calculated using Equation (1), and then its threshold is determined by the Otsu method and used to segment the image to obtain the impervious surface region.
The Otsu method is an adaptive threshold determination method and is widely used in image segmentation, which maximizes the class variance between objects and background [28].

2.2.2. Comparison of Methods

The NDBI, IBI, NDISI, NDII, and CBI methods were used for comparison. The segmentation thresholds of the NDBI and NDISI were both set to 0, which is the default threshold according to the authors who proposed these indices, whereas the thresholds of the other three indices were determined by the Otsu method here because the authors who proposed these indices determined the thresholds manually rather than setting a fixed threshold. In addition, in all the methods, water bodies were masked first so as to ensure the comparisons coincided.
(1) NDBI: Zha et al. proposed the NDBI for extracting impervious surface distribution [7]:
N D B I = S W I R 1 N I R S W I R 1 + N I R
(2) IBI: Xu constructed the IBI to extract impervious surface distribution [8]:
B I = N D B I ( S A V I + M N D W I ) 2 N D B I + ( S A V I + M N D W I ) 2
where SAVI [31] is calculated as follows:
S A V I = ( N I R R e d ) ( 1 + L ) N I R + R e d + L
where L is a correction factor that ranges from 0 to l. In this study, L was set to 0.5, which can minimise noise due to soil [11,31].
(3) NDISI: Xu proposed the NDISI for extracting impervious surface distribution [9]:
N D I S I = T I R ( M N D W I + N I R + S W I R 1 ) / 3 T I R + ( M N D W I + N I R + S W I R 1 ) / 3
where TIR denotes the thermal band, which we replaced with the TIR1 band (10.6–11.19μm) in Landsat 8 imagery. MNDWI is calculated as follows [32]:
M N D W I = G r e e n S W I R 1 G r e e n + S W I R 1
(4) NDII: Wang et al. devised the NDII to extract impervious surface distribution [10]:
N D I I = V I S T I R V I S + T I R
where VIS represents one of the red, green and blue bands. Wang pointed out that the accuracy of extraction is highest when VIS represents the red band [10], and hence we also used the red band to calculate the NDII.
(5) CBI: Sun et al. developed the CBI to extract impervious surface distribution [11]:
C B I = ( P C 1 + N D W I ) 2 S A V I ( P C 1 + N D W I ) 2 + S A V I
where NDWI is calculated as follows [33]:
N D W I = G r e e n N I R G r e e n + N I R

2.2.3. Method for Accuracy Assessment

Accuracy is determined in terms of precision, recall, and the F1 score.
According to their actual and predicted values, pixels are divided into true positives (TP), false positives (FP), true negatives (TN), and false negatives (FN), and then the precision (P), recall (R), and F1 score are calculated using Equations (13)–(15) [34]:
P = T P _ N T P _ N + F P _ N × 100 %
where TP_N and FP_N are the total numbers of pixels in TP and FP, respectively.
R = T P _ N T P _ N + F N _ N × 100 %
where FN_N is the total number of pixels in FN.
F 1 = 2 × P × R P + R × 100 %
The closer the F1 score is to 1, the higher the accuracy of the extraction of impervious surface distribution is.

3. Results

3.1. Spectral Features of Impervious Surfaces, Bare Soil, and Vegetation

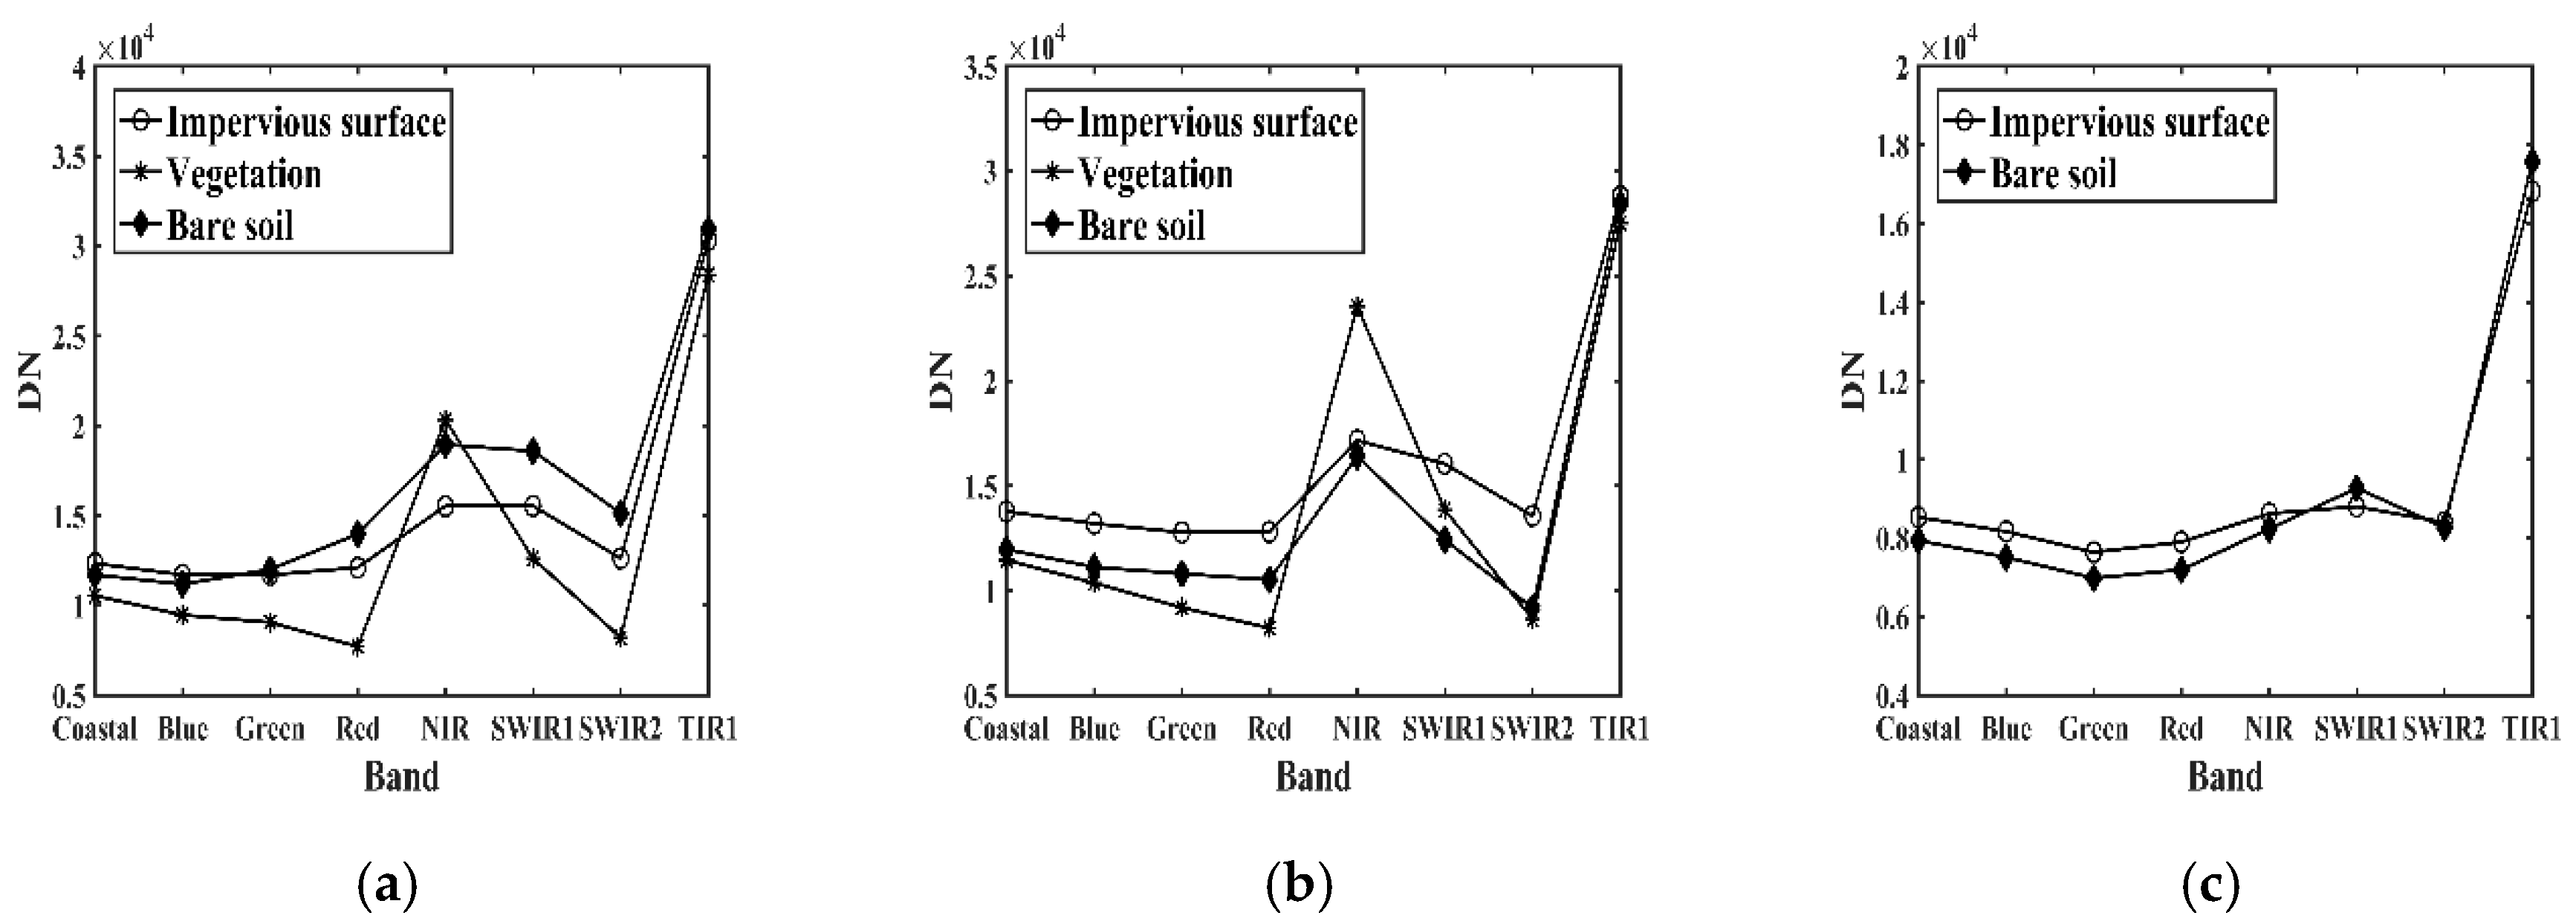
Typical samples of impervious surfaces, bare soil, and vegetation were selected from each case image after water bodies were masked, and the mean spectral values for each type of sample were calculated to obtain their spectral curves (Figure 2). These show that impervious surfaces had similar spectral features to those of bare soil. The DN value of impervious surfaces in the coastal band was higher than those of vegetation and bare soil, and vegetation had the largest difference between the DN values in the red and near-infrared bands, followed by bare soil. In the TIR1 band, the DN value of impervious surfaces was the highest in Case 2, whereas in Cases 1 and 3 the DN value of bare soil was the highest.

3.2. Results of Extraction of Impervious Surface Distribution

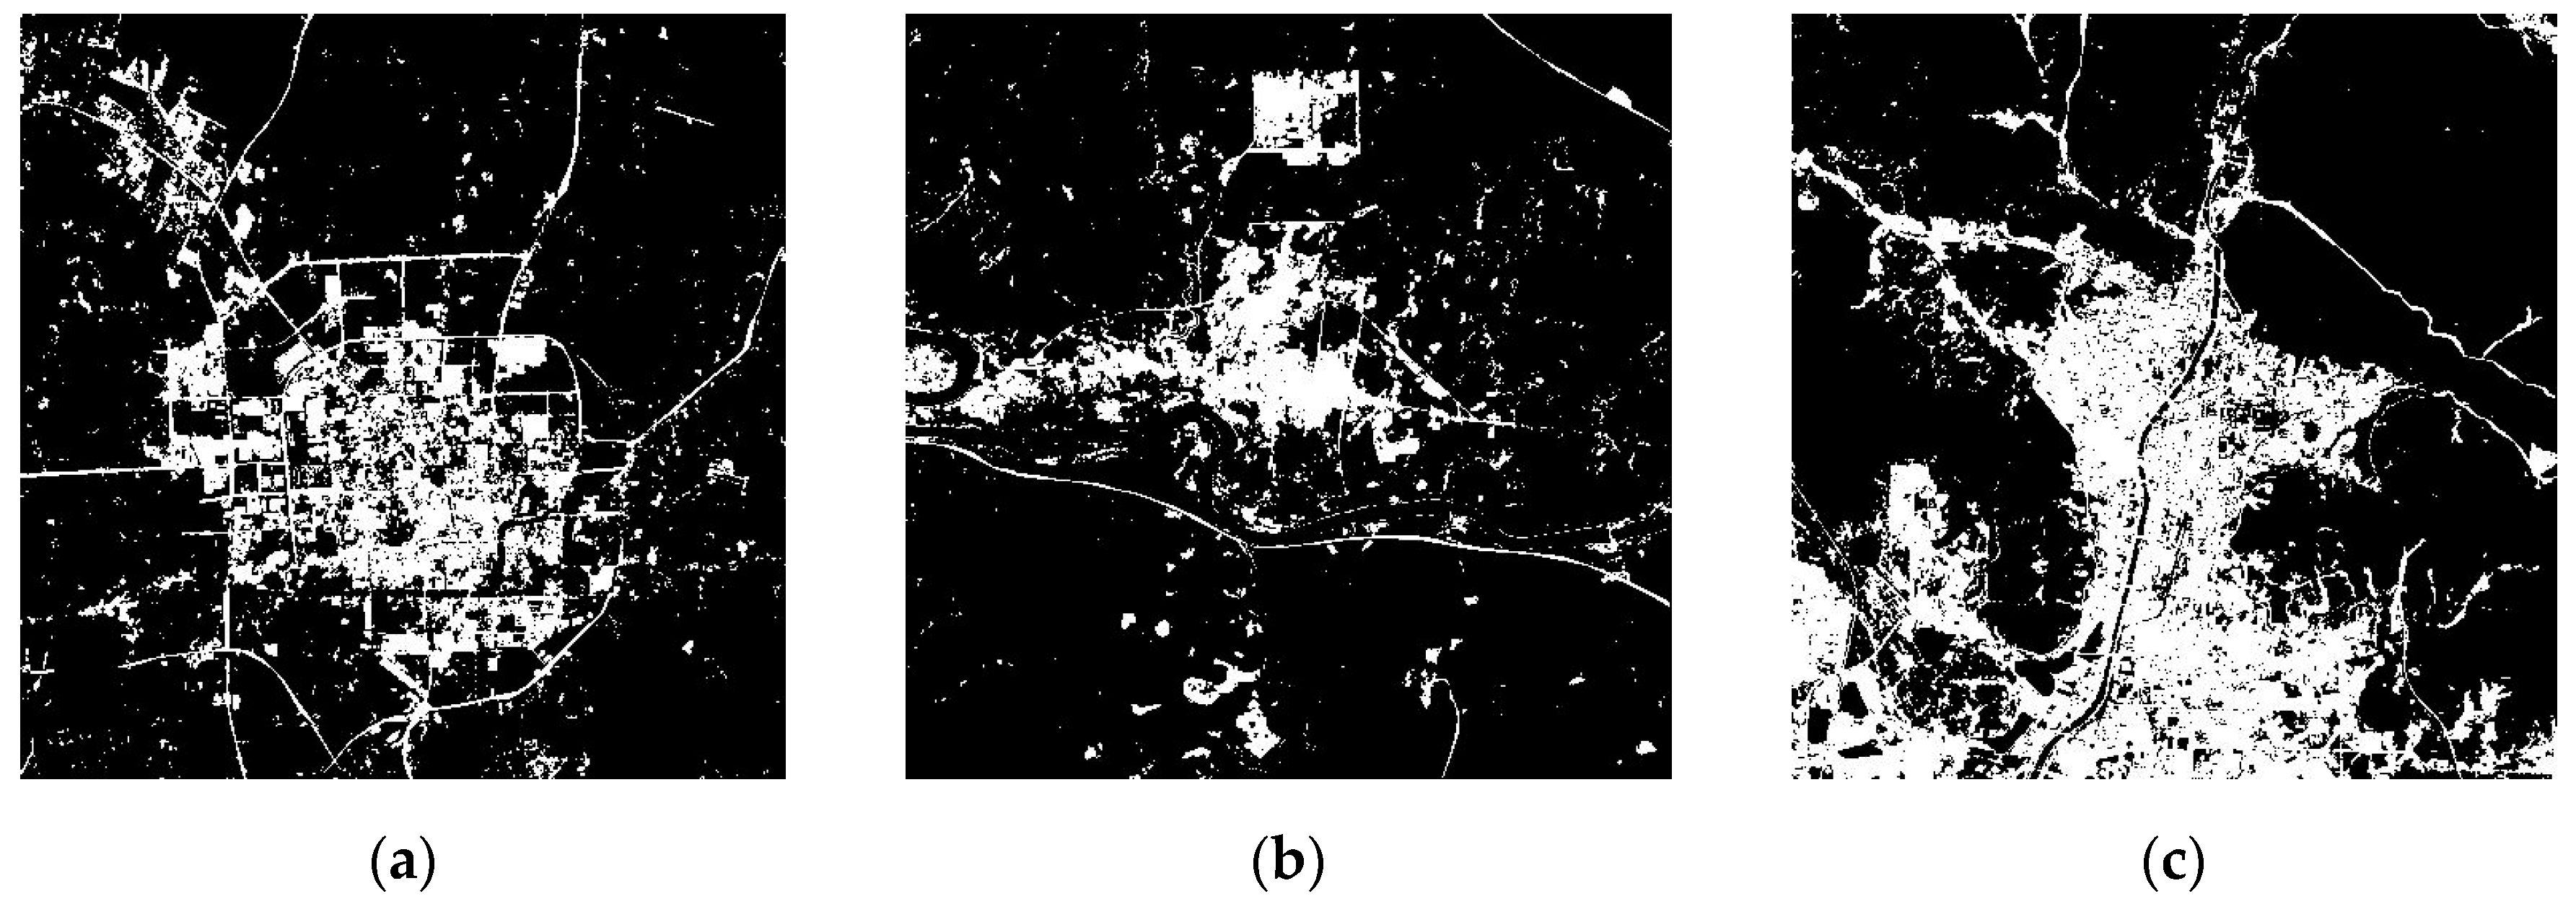
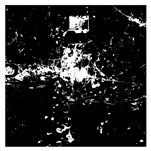
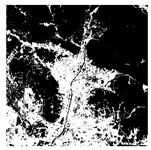
The ground truth for impervious surface distribution was determined by visual interpretation in each case image and is shown in Figure 3:
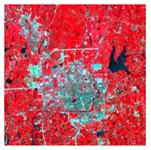
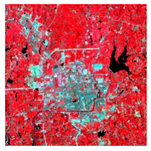
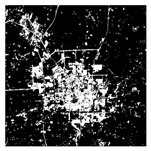
Impervious surface distribution extracted by the proposed method is shown in Table 1. We can see that water bodies were masked well by the WI. The RISI effectively distinguished impervious surfaces from bare soil and vegetation, especially the large amount of bare soil in Case 3.
The impervious surface distribution extracted by six methods are shown in Figure 4, Figure 5 and Figure 6. The segmentation thresholds of the NDBI and NDISI were both set to 0, and the thresholds of the other methods were determined by the Otsu method. In general, the impervious surfaces extracted by the five reference methods were still mixed with other ground objects even though water bodies were masked. In Case 3, bare soil were seriously mis-extracted.
Figure 4 shows that the NDBI resulted in serious omissions while the other four reference methods provided higher accuracy. Figure 5 shows that the NDBI lost a large amount of impervious surfaces and other reference methods also resulted in serious errors. Figure 6 shows that all five reference methods mis-extracted a large amount of bare soil, and the NDBI and IBI lost a large amount impervious surfaces.

3.3. Accuracy

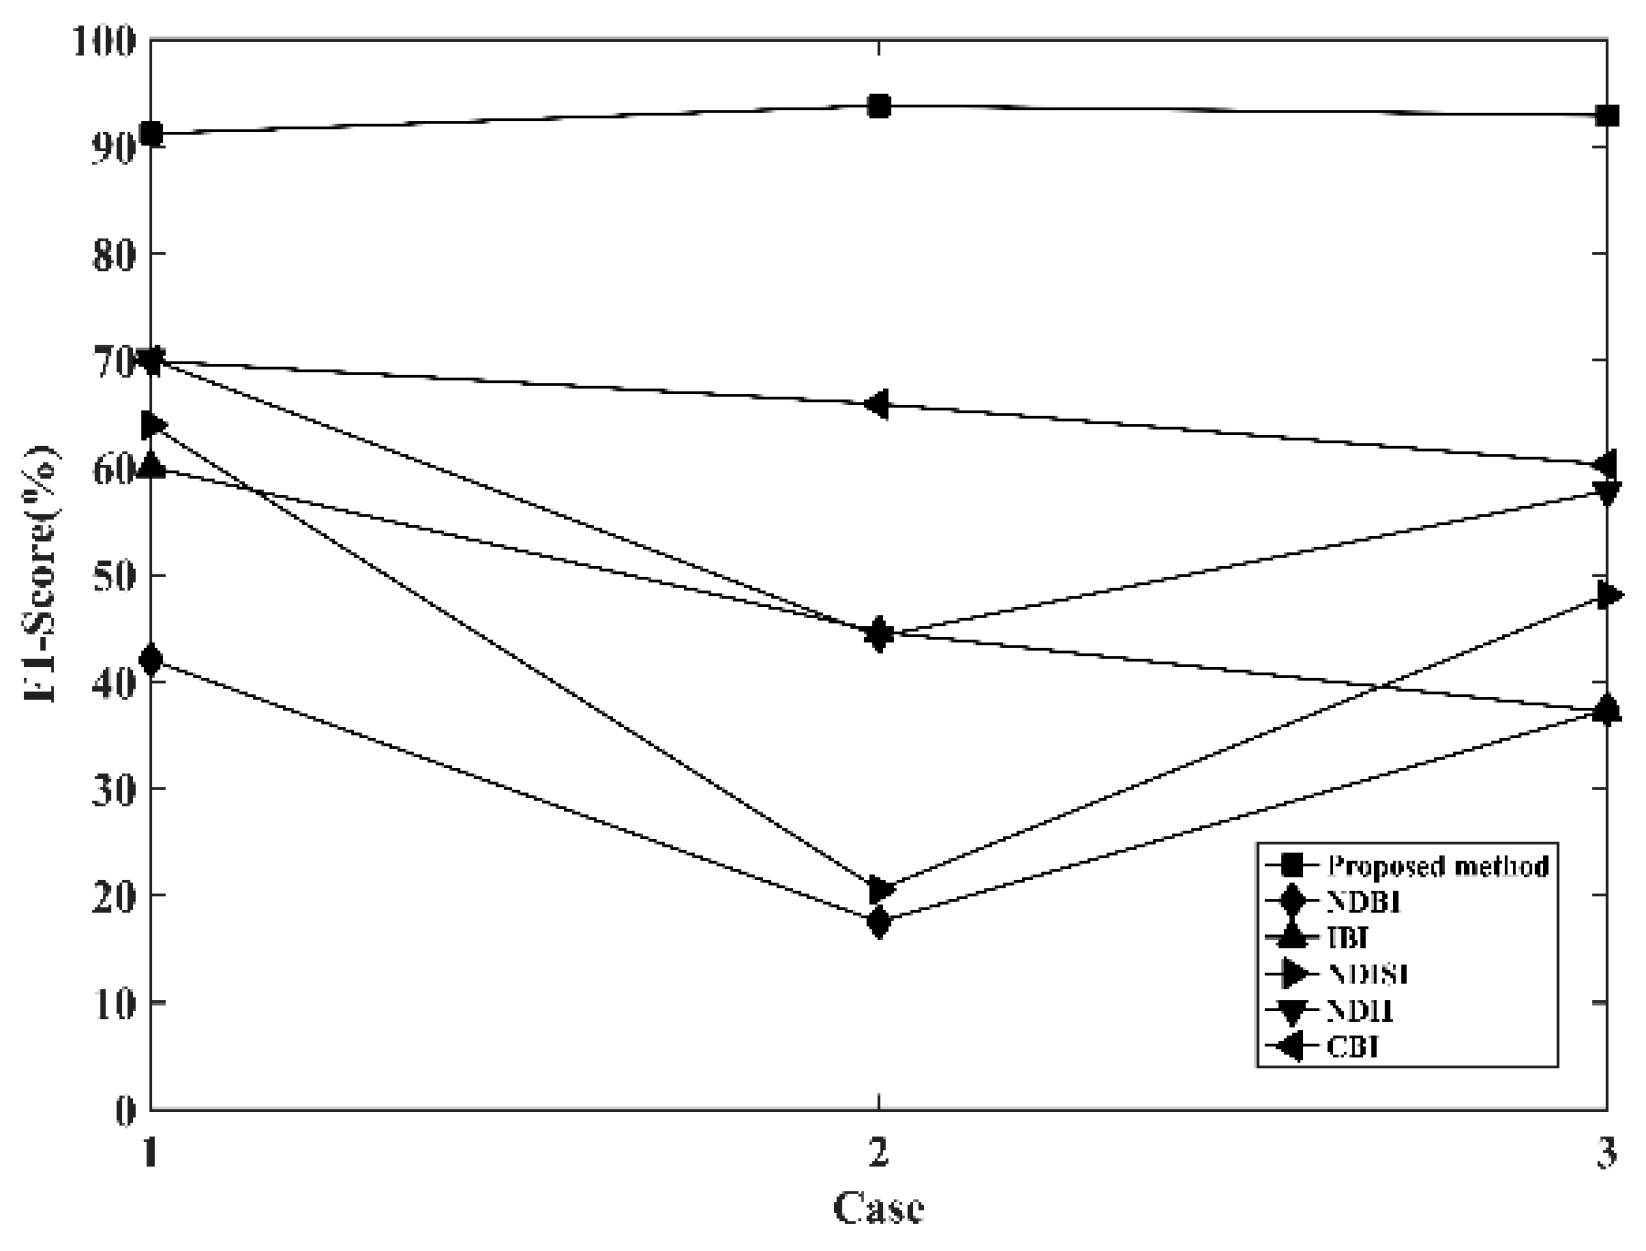
The recalls and precisions of the six extractions are shown in Figure 7, and the F1 scores are shown in Figure 8. The NDBI, IBI, NDISI, NDII, and CBI gave high recalls and low precisions, especially in Case 3 which had a large amount of bare soil, where the F1 scores were all less than 65%. The extraction accuracy by the proposed method was higher than others in our three case images, and the average values of the recall, precision, and F1 score were 95%, 91%, and 93%, respectively.

4. Discussion

With the economic growth of developing countries, the rapid urbanisation of rural land and its conversion to urban land directly lead to an increase in the area of impervious surfaces, which may lead to the urban heat island effect. Impervious surfaces are artificial surfaces that water cannot infiltrate to reach the soil, such as parking lots, streets, and highways. They often have a low specific heat capacity and heat up fast, which often leads to the higher temperature in urban areas than rural areas, the uneven distribution of heat, the abnormal hydrothermal cycle, and the harmful urban heat island effect [35]. It is important to build accurate and fast methods to extract impervious surface distribution which is helpful for detecting regional environmental changes in urban areas and achieving sustainable urban development.
The existing methods for the extraction of impervious surface distribution increased the difference between impervious surfaces and other ground objects and achieved high precisions in some cases [7,8,9,10,11]. However, differences between sensors, regions, and seasons often lead to inconsistencies in the spectral features of ground objects in images. Many methods have poor abilities to distinguish impervious surfaces from bare soil because of their spectral similarity [36], and it is also not easy to distinguish withered vegetation in winter from impervious surfaces.

4.1. Ability of the Proposed Method to Distinguish Impervious Surfaces from Vegetation and Bare Soil

Figure 9 shows the differences between typical samples of impervious surfaces, bare soil, and vegetation in terms of the coastal band, blue band, green band, red band, ratio vegetation index (RVI) [37], NDVI, and difference vegetation index (DVI) [38], where all features underwent a 0–1 transformation. Of these three vegetation indices, the NDVI gave the greatest difference between impervious surfaces and other ground objects. Besides, the values for impervious surfaces in the coastal band were higher than those for vegetation and bare soil, and the contrast between impervious surfaces and bare soil gradually decreased in the coastal, blue, green, and red bands.
Therefore, the ratio of the coastal band to the NDVI can maximise the information on impervious surfaces and increase the difference between impervious surfaces and other ground objects, and thus effectively distinguish impervious surfaces from bare soil, which is the main advantage of our method in comparison with the other five methods.

4.2. Extraction of Impervious Surface Distribution by Different Methods

The five methods used for comparison are applicable to different conditions and provide higher accuracy in other cases [7,8,9,10,11]. They exhibited differences in performance after water bodies were masked in our three cases, and the average F1 scores of extractions by six methods from the lowest to the highest value were in the following order: the NDBI, NDISI, IBI, NDII, CBI, and our proposed method.
The average F1 score of extractions by the NDBI after water bodies were masked was 32%. This index utilises the feature that the values for impervious surfaces in the SWIR1 band in Landsat 5 TM imagery are higher than those in the NIR band. However, the spectral features of impervious surfaces in Landsat 8 OLI imagery are different from those in Landsat 5 TM imagery because of the differences in the sensor, wavelength range, and quantisation bit. Figure 2 shows that the values for impervious surfaces in the SWIR1 band were comparable to those in the NIR band in Cases 1 and 3, whereas the values in the SWIR1 band were lower than those in the NIR band in Case 2. Conversely, the bare soil in Case 3 gave higher values in the SWIR1 band than in the NIR band, which resulted in more instances of error.
The average F1 score of extractions by the NDISI after water bodies were masked was 44%. The author who devised the NDISI pointed out that the values for impervious surfaces are higher than those of other ground objects in the thermal infrared band. This index led to instances of error in Cases 2 and 3, which were caused by the fact that the values for impervious surfaces in the Landsat 8 thermal infrared band were not always higher than those for other ground objects (Figure 2). Thermal radiation from impervious surfaces is more obvious in summer but may be lower than that from other ground objects in winter [39,40]. Therefore, the use of the NDISI for the extraction of impervious surface distribution in summer may provide high accuracy [9], but its accuracy may be low if it is employed in winter.
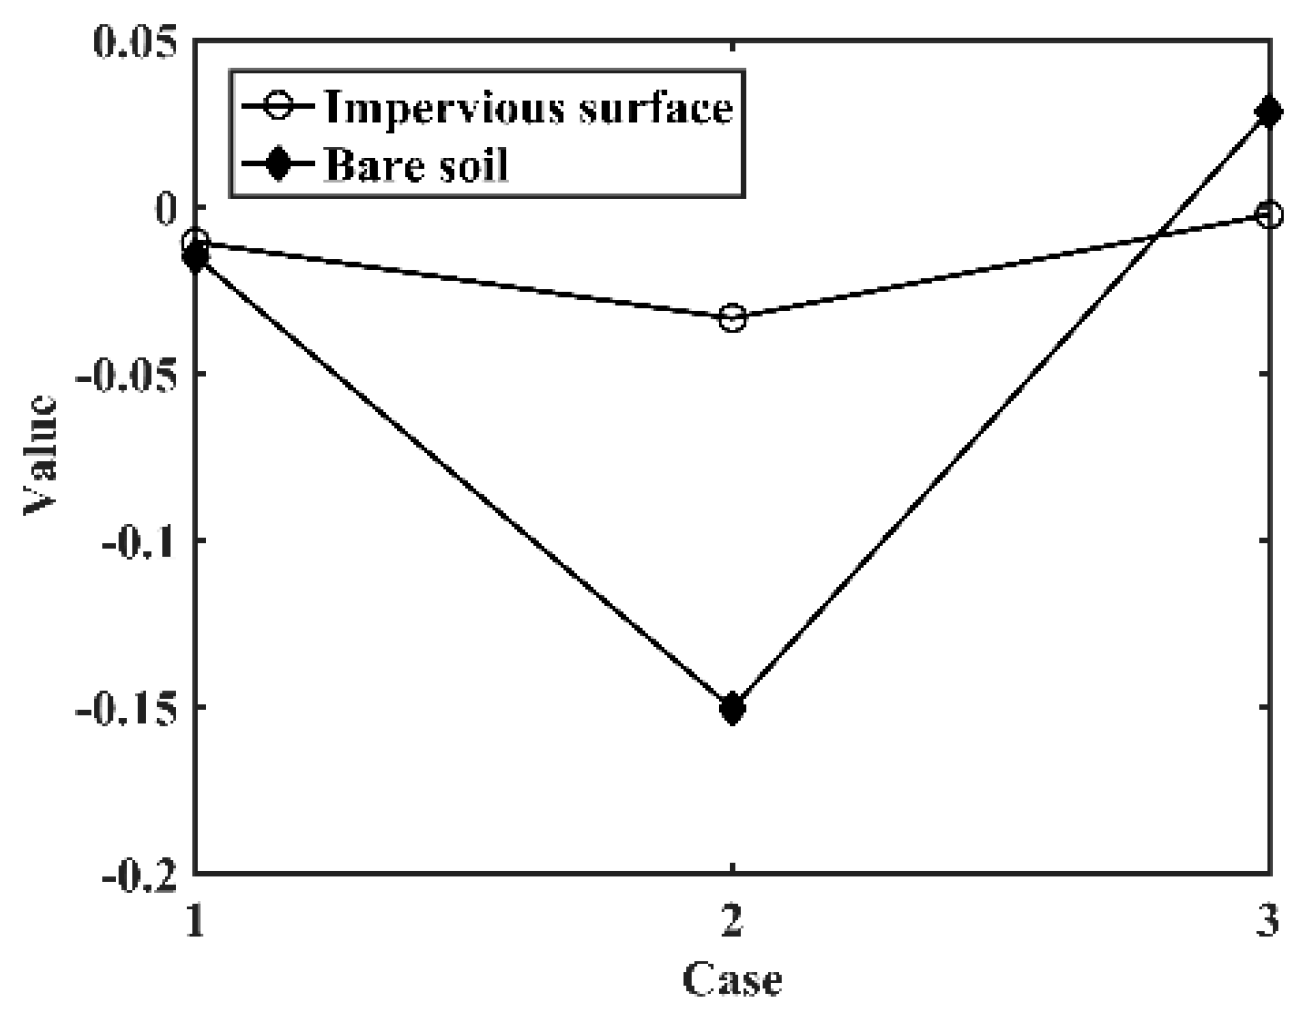
The average F1 score of extractions by the IBI after water bodies were masked was 47%. This index combines three indices, namely, the NDBI, MNDWI, and SAVI. In our cases, the NDBI values for impervious surfaces were not always higher than those for other ground objects such as the bare soil in Case 3 (Figure 10), which may have led to many instances of error.
The average F1 score of extractions by the NDII after water bodies were masked was 57%. Xu et al. pointed out that this index is unreliable because the values for impervious surfaces in the thermal infrared band are significantly lower than those in the visible light band [36]. Besides, this index requires that bare soil is masked in advance [10], which is difficult in practice.
The average F1 score of extractions by the CBI after water bodies were masked was 65%. This index combines the PC1, NDWI, and SAVI, which represent high-albedo surfaces, low-albedo surfaces, and vegetation, respectively, but the ability to mask bare soil needs to be further enhanced [36].
The average F1 score of extractions by our proposed method was 93%. Our method not only identified impervious surfaces but also masked other ground objects such as bare soil and therefore provided higher accuracy than the other five methods.

4.3. Atmospheric Effect of the Proposed Method

The abovementioned impervious surface distributions were extracted on the basis of the DN values in the images.
When electromagnetic waves are transmitted across the atmosphere, they are scattered because of molecules and minute particles; the shorter the wavelength is, the stronger the scattering is, which causes radiation distortion in the coastal and blue bands of Landsat 8 images. Atmospheric correction of images is usually required in order to obtain more realistic surface reflectivity, but this is often a cumbersome process.
As a comparison, the case images were corrected according to the FLAASH model in ENVI, and reflectance values that were less than 0 or greater than 100 were modified according to Equation (16):
g ( x , y ) = { 0 f ( x , y ) < 0 f ( x , y ) 0 f ( x , y ) 100 100 f ( x , y ) > 100
where f ( x , y ) and g ( x , y ) represent the images before and after modification, respectively.
The impervious surface distributions extracted after atmospheric correction are shown in Figure 11. From a comparison with Table 1, impervious surfaces were less widely distributed, and the average recall, precision, and F1 score were 89%, 77%, and 83%, respectively, which represented decreases by 6%, 14%, and 10%, respectively.
Atmospheric correction did not provide additional information that could supplement the results based on the DN, but instead resulted in more mis-extraction and losing results.
Taking Case 3 as an example, Figure 12 shows the difference between the impervious surface distribution extracted before and after atmospheric correction, where (a) is a false colour composite of the (5, 4, 3) band and (b) is an RGB composite of the impervious surface distribution extracted before atmospheric correction, ground truth for the impervious surface distribution and the impervious surface distribution extracted after atmospheric correction. Here, the white areas were extracted in both instances, the green areas were lost in both instances, the purple areas were mis-extracted in both instances, the yellow areas were lost after atmospheric correction, and the blue areas were only mis-extracted after atmospheric correction.
Actually, atmospheric correction using an atmospheric correction model is not always necessary and may decrease the accuracy of the extraction of remote sensing information [41]. With respect to our three case images, atmospheric correction did not help to improve the accuracy of the extraction of impervious surface distribution.

4.4. Alternatives to the Coastal Band

There is no coastal band in other Landsat imagery, which may influence the applicability of the proposed method. Here, we compare and discuss the differences that occur if impervious surface distribution is extracted using the blue band instead of the coastal band.
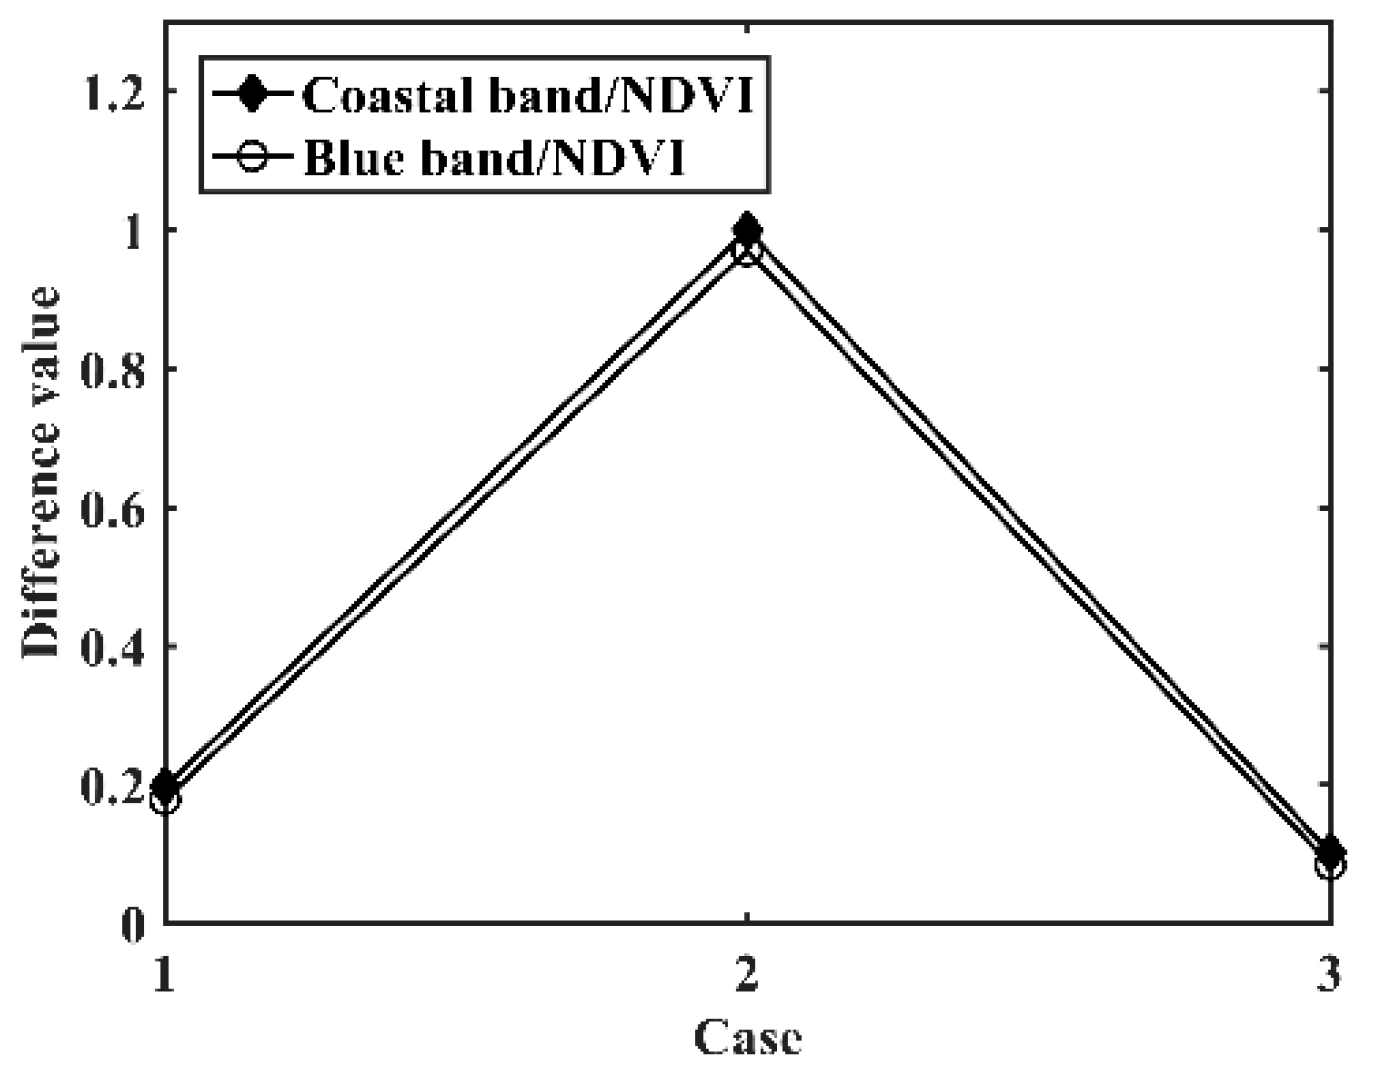
The differences between the values for typical samples of impervious surfaces and other ground objects of the ratio of the coastal band to the NDVI (coastal band/NDVI) and the ratio of the blue band to the NDVI (blue band/NDVI) were calculated, as shown in Figure 13. We can see that if the blue band/NDVI is used, the difference between impervious surfaces and other ground objects decreases slightly.
The coastal band was replaced with the blue band, and the other parameters were the same as those used in the previous workflow to extract the impervious surface distribution from the above three case images. We also determined the accuracy and found that the average recall, precision, and F1 score were 93%, 87%, and 90%, respectively, which represented decreases by 2%, 4%, and 3%, respectively.
Therefore, it is feasible to use the blue band to extract impervious surface distribution from other Landsat remote sensing images without using the coastal band, albeit with a certain decrease in accuracy.
In contrast to validation using images for a single region and season [7,8,9,10], our study used three images obtained in summer and winter. The RISI exhibited higher accuracy and better applicability than the other methods used for comparison, and it avoids the additional feature selection and classifier selection processes used in classification methods.

5. Conclusions

This study proposed a novel index, namely, the RISI, for extracting impervious surface distribution from Landsat 8 imagery and validated it using three images covering urban areas of China in winter and summer. The results of the extraction were compared with those obtained using the NDBI, IBI, NDISI, NDII, and CBI. The main conclusions are as follows:
(1) The RISI effectively distinguishes impervious surfaces from other ground objects, especially bare soil, and gives higher recalls, precisions, and F1 scores, of which the average values for the three case images were 95%, 91%, and 93%, respectively. The validation confirmed the robustness of the RISI.
(2) The use of the coastal band after a 0–1 transformation can further increase the difference between impervious surfaces and bare soil.
(3) The workflow has been shown to have good applicability in the extraction of impervious surface distribution from Landsat imagery.
It is still necessary to perform validation using more images with complex compositions and distributions of ground objects to refine the workflow so that it suits more situations.

Author Contributions

H.F. performed the experiments, analyzed the data, and wrote the paper; Y.W. revised and commented on the manuscript; Q.D. performed the data processing and examination of the experiments.

Funding

This study is supported by the National Natural Science Foundation of China (No. 41471283).

Acknowledgments

The authors would like to thank the reviewers and the editor for precise and excellent comments that greatly improved this paper.

Conflicts of Interest

The authors declare no conflict of interest.

References

  1. Weng, Q. Remote sensing of impervious surfaces in the urban areas: Requirements, methods, and trends. Remote Sens. Environ. 2012, 117, 34–49. [Google Scholar] [CrossRef]
  2. Mckinney, M.L. Urbanization, biodiversity, and conservation the impacts of urbanization on native species are poorly studied, but educating a highly urbanized human population about these impacts can greatly improve species conservation in all ecosystems. Bioscience 2002, 52, 883–890. [Google Scholar] [CrossRef]
  3. Jacobson, M.Z.; Ten Hoeve, J.E. Effects of urban surfaces and white roofs on global and regional climate. J. Clim. 2012, 25, 1028–1044. [Google Scholar] [CrossRef]
  4. Huszar, P.; Halenka, T.; Belda, M.; Zak, M.; Sindelarova, K.; Miksovsky, J. Regional climate model assessment of the urban land-surface forcing over central europe. Atmos. Chem. Phys. 2014, 14, 18541–18589. [Google Scholar] [CrossRef]
  5. Jian, Y.; Li, P. Impervious surface extraction in urban areas from high spatial resolution imagery using linear spectral unmixing. Remote Sens. Appl. Soc. Environ. 2015, 1, 61–71. [Google Scholar]
  6. Gao, Z.; Liu, X. Support vector machine and object-oriented classification for urban impervious surface extraction from satellite imagery. In Proceedings of the International Conference on Agro-geoinformatics, Beijing, China, 11–14 August 2014. [Google Scholar]
  7. Zha, Y.; Ni, S.X.; Yang, S. An effective approach to automatically extract urban land-use from tm lmagery. J. Remote Sens. 2003, 7, 37–41. [Google Scholar]
  8. Xu, H.Q. A new index for delineating built-up land features in satellite imagery. Int. J. Remote Sens. 2008, 29, 4269–4276. [Google Scholar] [CrossRef]
  9. Xu, H.Q. Analysis of impervious surface and its impact on urban heat environment using the normalized difference impervious surface index (ndisi). Photogramm. Eng. Remote Sens. 2010, 76, 557–565. [Google Scholar] [CrossRef]
  10. Wang, Z.; Gang, C.; Li, X.; Chen, Y.; Li, J. Application of a normalized difference impervious index (ndii) to extract urban impervious surface features based on landsat tm images. Int. J. Remote Sens. 2015, 36, 1055–1069. [Google Scholar] [CrossRef]
  11. Sun, G.Y.; Chen, X.L.; Jia, X.P.; Yao, Y.J.; Wang, Z.J. Combinational build-up index (cbi) for effective impervious surface mapping in urban areas. IEEE J. Sel. Top. Appl. Earth Obs. Remote Sens. 2017, 9, 2081–2092. [Google Scholar] [CrossRef]
  12. Voorde, T.V.D.; Roeck, T.D.; Canters, F. A comparison of two spectral mixture modelling approaches for impervious surface mapping in urban areas. Int. J. Remote Sens. 2009, 30, 4785–4806. [Google Scholar] [CrossRef]
  13. Zhao, Y.; Xu, J. Impervious surface extraction with linear spectral mixture analysis integrating principal components analysis and normalized difference building index. In Proceedings of the International Workshop on Earth Observation and Remote Sensing Applications, Guangzhou, China, 4–6 July 2016. [Google Scholar]
  14. Roberts, D.A.; Gardner, M.; Church, R.; Ustin, S.; Scheer, G.; Green, R.O. Mapping chaparral in the santa monica mountains using multiple endmember spectral mixture models. Remote Sens. Environ. 1998, 65, 267–279. [Google Scholar] [CrossRef]
  15. Fan, F.; Deng, Y. Enhancing endmember selection in multiple endmember spectral mixture analysis (mesma) for urban impervious surface area mapping using spectral angle and spectral distance parameters. Int. J. Appl. Earth Obs. Geoinf. 2014, 33, 290–301. [Google Scholar] [CrossRef]
  16. Cortes, C.; Vapnik, V. Support-vector networks. Mach. Learn. 1995, 20, 273–297. [Google Scholar] [CrossRef]
  17. Dreiseitl, S.; Ohno-Machado, L. Logistic regression and artificial neural network classification models: A methodology review. J. Biomed. Inform. 2002, 35, 352–359. [Google Scholar] [CrossRef]
  18. Breiman, L. Random forests. Mach. Learn. 2001, 45, 5–32. [Google Scholar] [CrossRef]
  19. Tehrany, M.S.; Pradhan, B.; Jebuv, M.N. A comparative assessment between object and pixel-based classification approaches for land use/land cover mapping using spot 5 imagery. Geocarto Int. 2014, 29, 351–369. [Google Scholar] [CrossRef]
  20. Patel, N.; Mukherjee, R. Extraction of impervious features from spectral indices using artificial neural network. Arab. J. Geosci. 2015, 8, 3729–3741. [Google Scholar] [CrossRef]
  21. Pelletier, C.; Valero, S.; Inglada, J.; Champion, N.; Dedieu, G. Assessing the robustness of random forests to map land cover with high resolution satellite image time series over large areas. Remote Sens. Environ. 2016, 187, 156–168. [Google Scholar] [CrossRef]
  22. Bhatti, S.S.; Tripathi, N.K. Built-up area extraction using landsat 8 oli imagery. Gisci. Remote Sens. 2014, 51, 445–467. [Google Scholar] [CrossRef]
  23. Geospatial Data Cloud. Available online: http://www.gscloud.cn (accessed on 10 January 2019).
  24. Ridd, M.K. Exploring a v-i-s (vegetation-impervious surface-soil) model for urban ecosystem analysis through remote sensing: Comparative anatomy for cities. Int. J. Remote Sens. 1995, 16, 2165–2185. [Google Scholar] [CrossRef]
  25. Thanapura, P.; Helder, D.L.; Burckhard, S.; Warmath, E.; O’Neill, M.; Galster, D. Mapping urban land cover using quickbird ndvi and gis spatial modeling for runoff coefficient determination. Photogramm. Eng. Remote Sens. 2015, 73, 57–65. [Google Scholar] [CrossRef]
  26. Mu, Y.C.; Jie, Y.W.; Zhang, L.L. An enhanced normalized difference impervious surface index. Sci. Surv. Mapp. 2018, 43, 83–87. [Google Scholar]
  27. Chen, Q.; Li, X.T. Effects of New Characteristics of Landsat 8 Operational Land Imager (OLI) Data on Land-cover Remote Sensing Classification. J. Subtrop. Resour. Environ. 2015, 10, 79–86. [Google Scholar]
  28. Ohtsu, N. A threshold selection method from gray-level histograms. IEEE Trans. Syst. Man Cybern. 1979, 9, 62–66. [Google Scholar] [CrossRef]
  29. Mapper, E. Er Mapper 6.0 User Guide; 922 oldal; Earth Resource Mapping Pty Ltd.: West Perth, Australia, 1998. [Google Scholar]
  30. Rouse, J.W.J.; Haas, R.H.; Schell, J.A.; Deering, D.W. Monitoring vegetation systems in the great plains with erts. Nasa Spec. Publ. 1973, 351, 309–317. [Google Scholar]
  31. Huete, A.R. A soil-adjusted vegetation index (savi). Remote Sens. Environ. 1988, 25, 295–309. [Google Scholar] [CrossRef]
  32. Xu, H.Q. Modification of normalised difference water index (ndwi) to enhance open water features in remotely sensed imagery. Int. J. Remote Sens. 2006, 27, 3025–3033. [Google Scholar] [CrossRef]
  33. Mcfeeters, S.K. The use of the normalized difference water index (ndwi) in the delineation of open water features. Int. J. Remote Sens. 1996, 17, 1425–1432. [Google Scholar] [CrossRef]
  34. Zhou, Z.H. Machine Learning; Tsinghua University Press: Beijing, China, 2016. [Google Scholar]
  35. Mohajerani, A.; Bakaric, J.; Jeffrey-Bailey, T.; Mohajerani, A.; Bakaric, J. The urban heat island effect, its causes, and mitigation, with reference to the thermal properties of asphalt concrete. J. Environ. Manag. 2017, 197, 522–538. [Google Scholar] [CrossRef]
  36. Xu, H.Q.; Wang, M.Y. Remote sensing-based retrieval of ground impervious surfaces. J. Remote Sens. 2016, 20, 1270–1289. [Google Scholar]
  37. Jordan, C.F. Derivation of leaf-area index from quality of light on the forest floor. Ecology 1969, 50, 663–666. [Google Scholar] [CrossRef]
  38. Tucker, C.J. Red and photographic infrared linear combinations for monitoring vegetation. Remote Sens. Environ. 1979, 8, 127–150. [Google Scholar] [CrossRef] [Green Version]
  39. Wang, F.; Lan, X.J.; Wu, Z.G.; Chen, S.B. Monitoring analysis of heat island effects in Changshu city based on Landsat8. J. Jiangxi Univ. Sci. Technol. 2016, 37, 14–19. [Google Scholar]
  40. Li, W.; Li, Q.X.; Jiang, Z.H. Analysis of the Influence of Urban Heat Island Effect on Temperature Warming in Southeastern China. In Proceedings of the Annual Meeting of the Chinese Meteorological Society, Hangzhou, China, 13–16 October 2009. [Google Scholar]
  41. Song, C.; Woodcock, C.E.; Seto, K.C.; Lenney, M.P.; Macomber, S.A. Classification and change detection using landsat tm data: When and how to correct atmospheric effects. Remote Sens. Environ. 2001, 75, 230–244. [Google Scholar] [CrossRef]
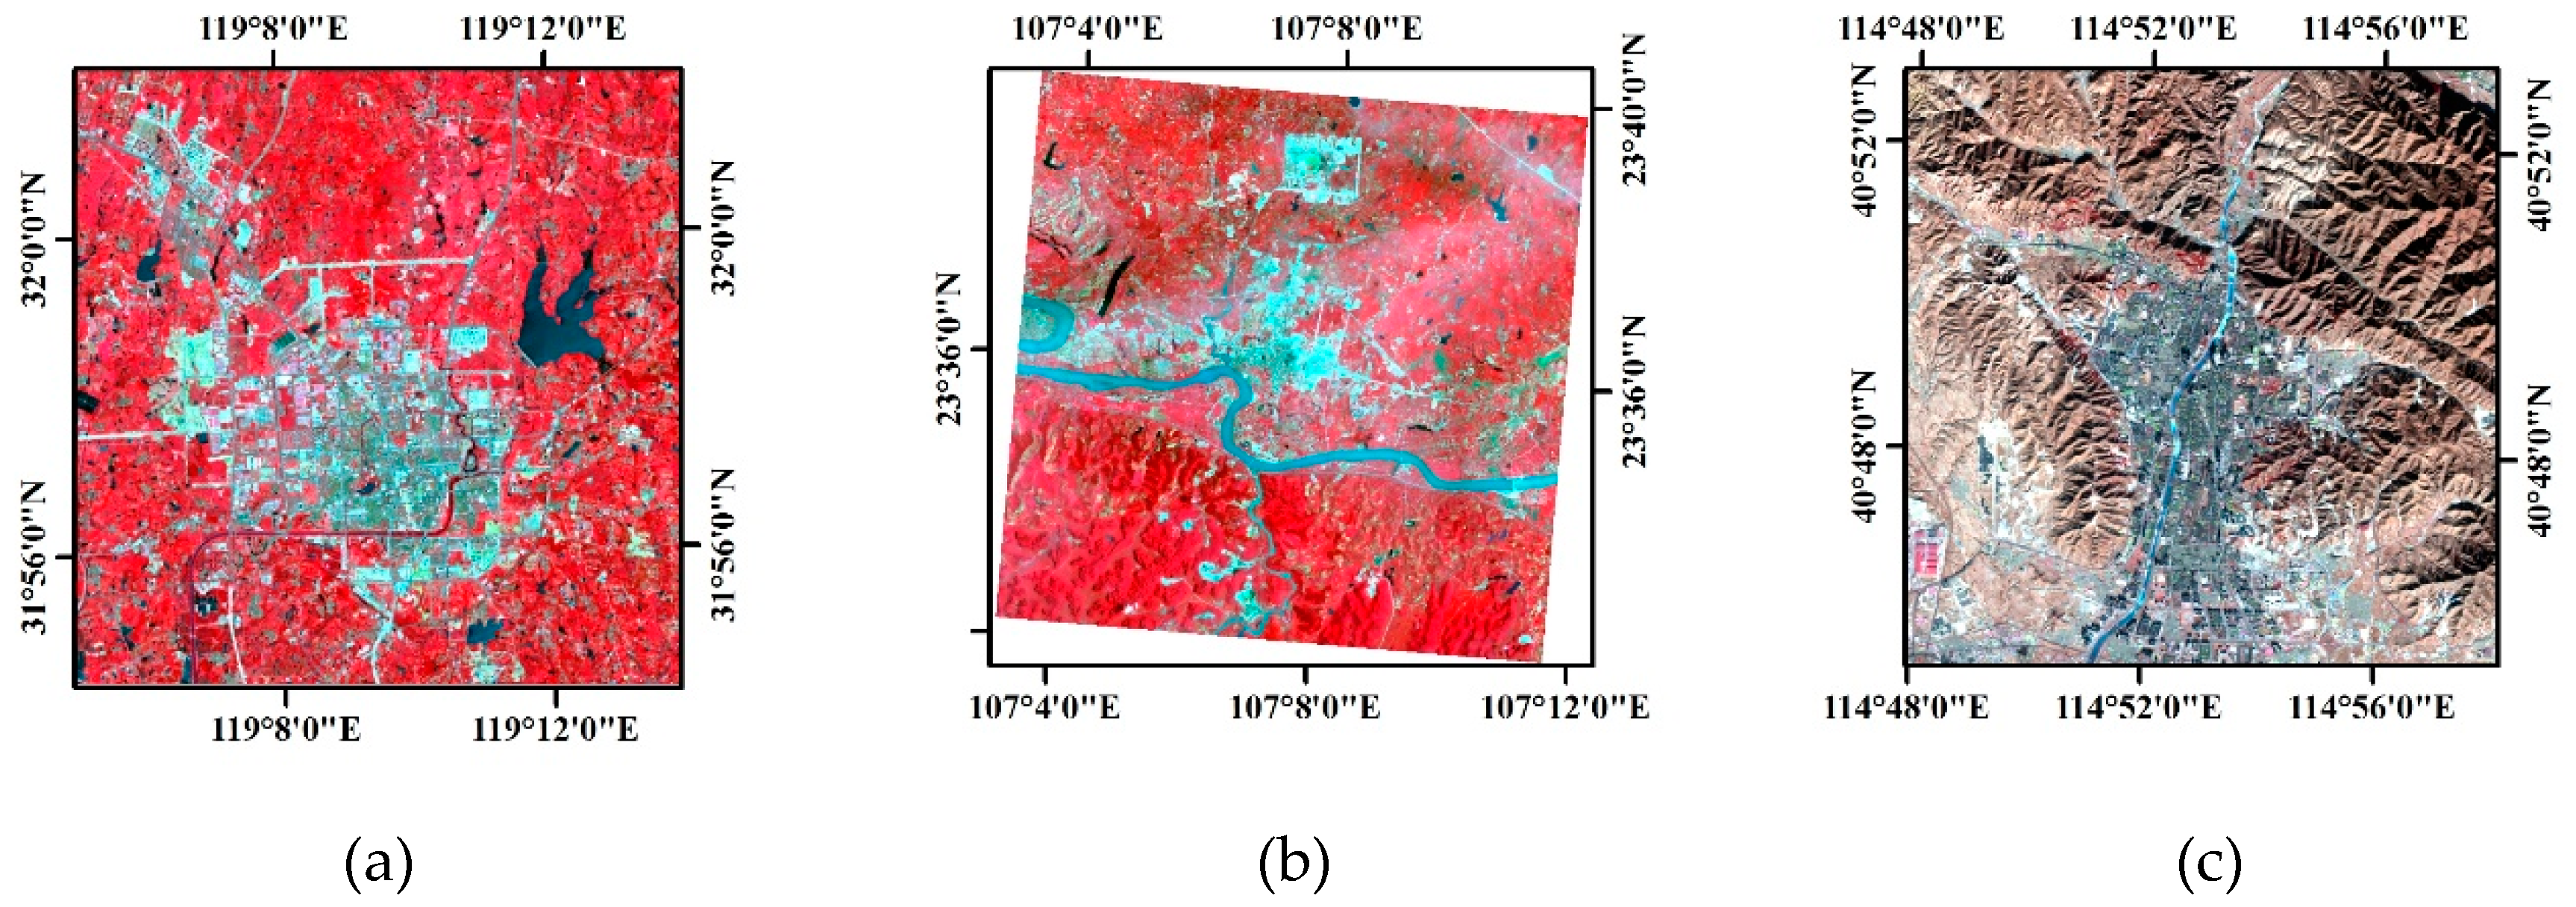
Figure 1. (5, 4, 3) false colour composite images with a linear stretch of 2%: (a) Case 1, 2017/7/21; (b) Case 2, 2014/7/23; (c) Case 3, 2013/12/13.
Applsci 09 02631 g001
Figure 2. Spectral features of impervious surfaces, bare soil and vegetation in images after water bodies were masked: (a) Case 1; (b) Case 2; (c) Case 3.
Applsci 09 02631 g002
Figure 3. Ground truth for impervious surface distribution in the representative images: (a) Case 1; (b) Case 2; (c) Case 3.
Applsci 09 02631 g003
Figure 4. The impervious surface distribution in Case 1 extracted by six methods after water bodies were masked: (a) RISI; (b) NDBI; (c) IBI; (d) NDISI; (e) NDII; (f) CBI.
Applsci 09 02631 g004
Figure 5. The impervious surface distribution in Case 2 extracted by six methods after water bodies were masked: (a) RISI; (b) NDBI; (c) IBI; (d) NDISI; (e) NDII; (f) CBI.
Applsci 09 02631 g005
Figure 6. The impervious surface distribution in Case 3 extracted by six methods after water bodies were masked: (a) RISI; (b) NDBI; (c) IBI; (d) NDISI; (e) NDII; (f) CBI.
Applsci 09 02631 g006
Figure 7. Recalls and precisions of the six extractions: (a) Case 1; (b) Case 2; (c) Case 3.
Applsci 09 02631 g007
Figure 8. F1 scores of the six extractions.
Applsci 09 02631 g008
Figure 9. Ability of the proposed method to distinguish impervious surfaces from vegetation and bare soil: (a) Case 1; (b) Case 2; (c) Case 3.
Applsci 09 02631 g009
Figure 10. NDBI values for impervious surfaces and bare soil.
Applsci 09 02631 g010
Figure 11. The impervious surface distribution extracted by the proposed method after atmospheric correction: (a) Case 1; (b) Case 2; (c) Case 3.
Applsci 09 02631 g011
Figure 12. The impervious surface distribution extracted from Case 3 image before and after atmospheric correction: (a) (5, 4, 3) false colour composite with a linear stretch of 2%; (b) RGB composite of the impervious surface distribution extracted before atmospheric correction, ground truth for the impervious surface distribution and the impervious surface distribution extracted after atmospheric correction.
Applsci 09 02631 g012
Figure 13. Differences in the coastal band/NDVI and blue band/NDVI between impervious surfaces and other ground objects.
Applsci 09 02631 g013
Table 1. The impervious surface distribution extracted by the proposed index.
Case(5, 4, 3) False Colour Composite Images with a Linear Stretch of 2%Images after Water Bodies were Masked by the WIThe Impervious Surface Distribution Extracted by the RISI
1 Applsci 09 02631 i001 Applsci 09 02631 i002 Applsci 09 02631 i003
2 Applsci 09 02631 i004 Applsci 09 02631 i005 Applsci 09 02631 i006
3 Applsci 09 02631 i007 Applsci 09 02631 i008 Applsci 09 02631 i009