1. Introduction
Truss towers are multi-element, self-supporting structures, rigidly fixed to the base. Due to many factors such as large height, relatively low material consumption, and simple erection process, steel truss towers are the most obvious choice for a tower structure. With respect to their use, a number of types can be identified [
1], namely, antenna towers, architectural towers, transmission towers, chimney towers, light towers, viewing towers, or water towers.
The experience shows steel truss tower failures may be attributed to different reasons. Such issues were explored in many studies [
2,
3,
4,
5]. The truss performance in a potentially dangerous condition may result in the structural collapse of the whole tower. Examples of failures of truss towers were discussed in study [
6]. Failures and collapses of steel truss towers may be caused by various factors, which often occur simultaneously. The most common causes are related to errors in design, such as inappropriate determination of external loads or wrong loading diagram of the structure. Flaws in erection include, among others, faulty workmanship of connections, the weakening of individual bars, attachment of additional gear (unaccounted for in the design). A common cause of failures of towers with main legs made from closed sections is water freezing in them, which leads to the bursting of sections. In such cases, the indirect cause lies in careless workmanship of welded connections, which allows water penetration into the section. Another cause of failure may be the action of abnormal wind or snow loads, or both loads combined. Because of a large range of load variation, the design assumptions sometimes do not account for abnormal natural phenomena like vehement storms, whirlwinds, or hurricanes. Another important failure-contributing factor is the corrosion of steel sections and connections, which leads to their reduced capacity. The action of corrosion depends, to a large extent, on the provision of adequate anticorrosion protection and the severity of the corrosion environment. Other factors that can lead to the failure of truss towers include non-uniform settlement of the ground underneath main leg foundations, mining-induced damages, failures of connections, and vehicles crashing into the structure.
Taking into account the threats mentioned above, it is clear that computer simulations of truss towers deformations and failures represent a relevant research focus [
7,
8,
9,
10]. Full-scale investigations provide equally important findings [
8,
9]. An important issue is also proper condition evaluation of existing truss structures [
5,
11], which aims at the identification of a potentially dangerous state. In case a failure of the structure element that might result in the collapse is found, it is necessary to design proper strengthening of the structure to ensure its safe performance [
2,
4]. The subject of failure scenarios includes work on progressive failure, in which local failure of a structural component can cause failure of the whole structure [
12,
13].
The reliability analysis of truss structures has been investigated in many studies, e.g., in [
14,
15,
16,
17], where various methods of estimating the reliability index have been proposed. The evaluation of truss tower reliability when individual single elements fail also constitutes an important research area. In study [
18], the author emphasises the need for investigations into the failure of statically indeterminate structures. It may happen that a failure of a single element of the structure leads to a redistribution of internal forces that results in the exceedance of the capacity of subsequent bars, bringing about the occurrence of a mechanism, i.e., the structure failure. In this paper, the impact of the failure of individual elements on the overall reliability of the tower is analyzed.
2. Materials and Methods
There are many methods to assess the reliability of a structure. In the paper, the system approach is used for reliability analysis. In this case, structural characteristics of the truss structure are taken into account, i.e., interaction of the structural elements in the load-carrying system [
19,
20,
21,
22,
23,
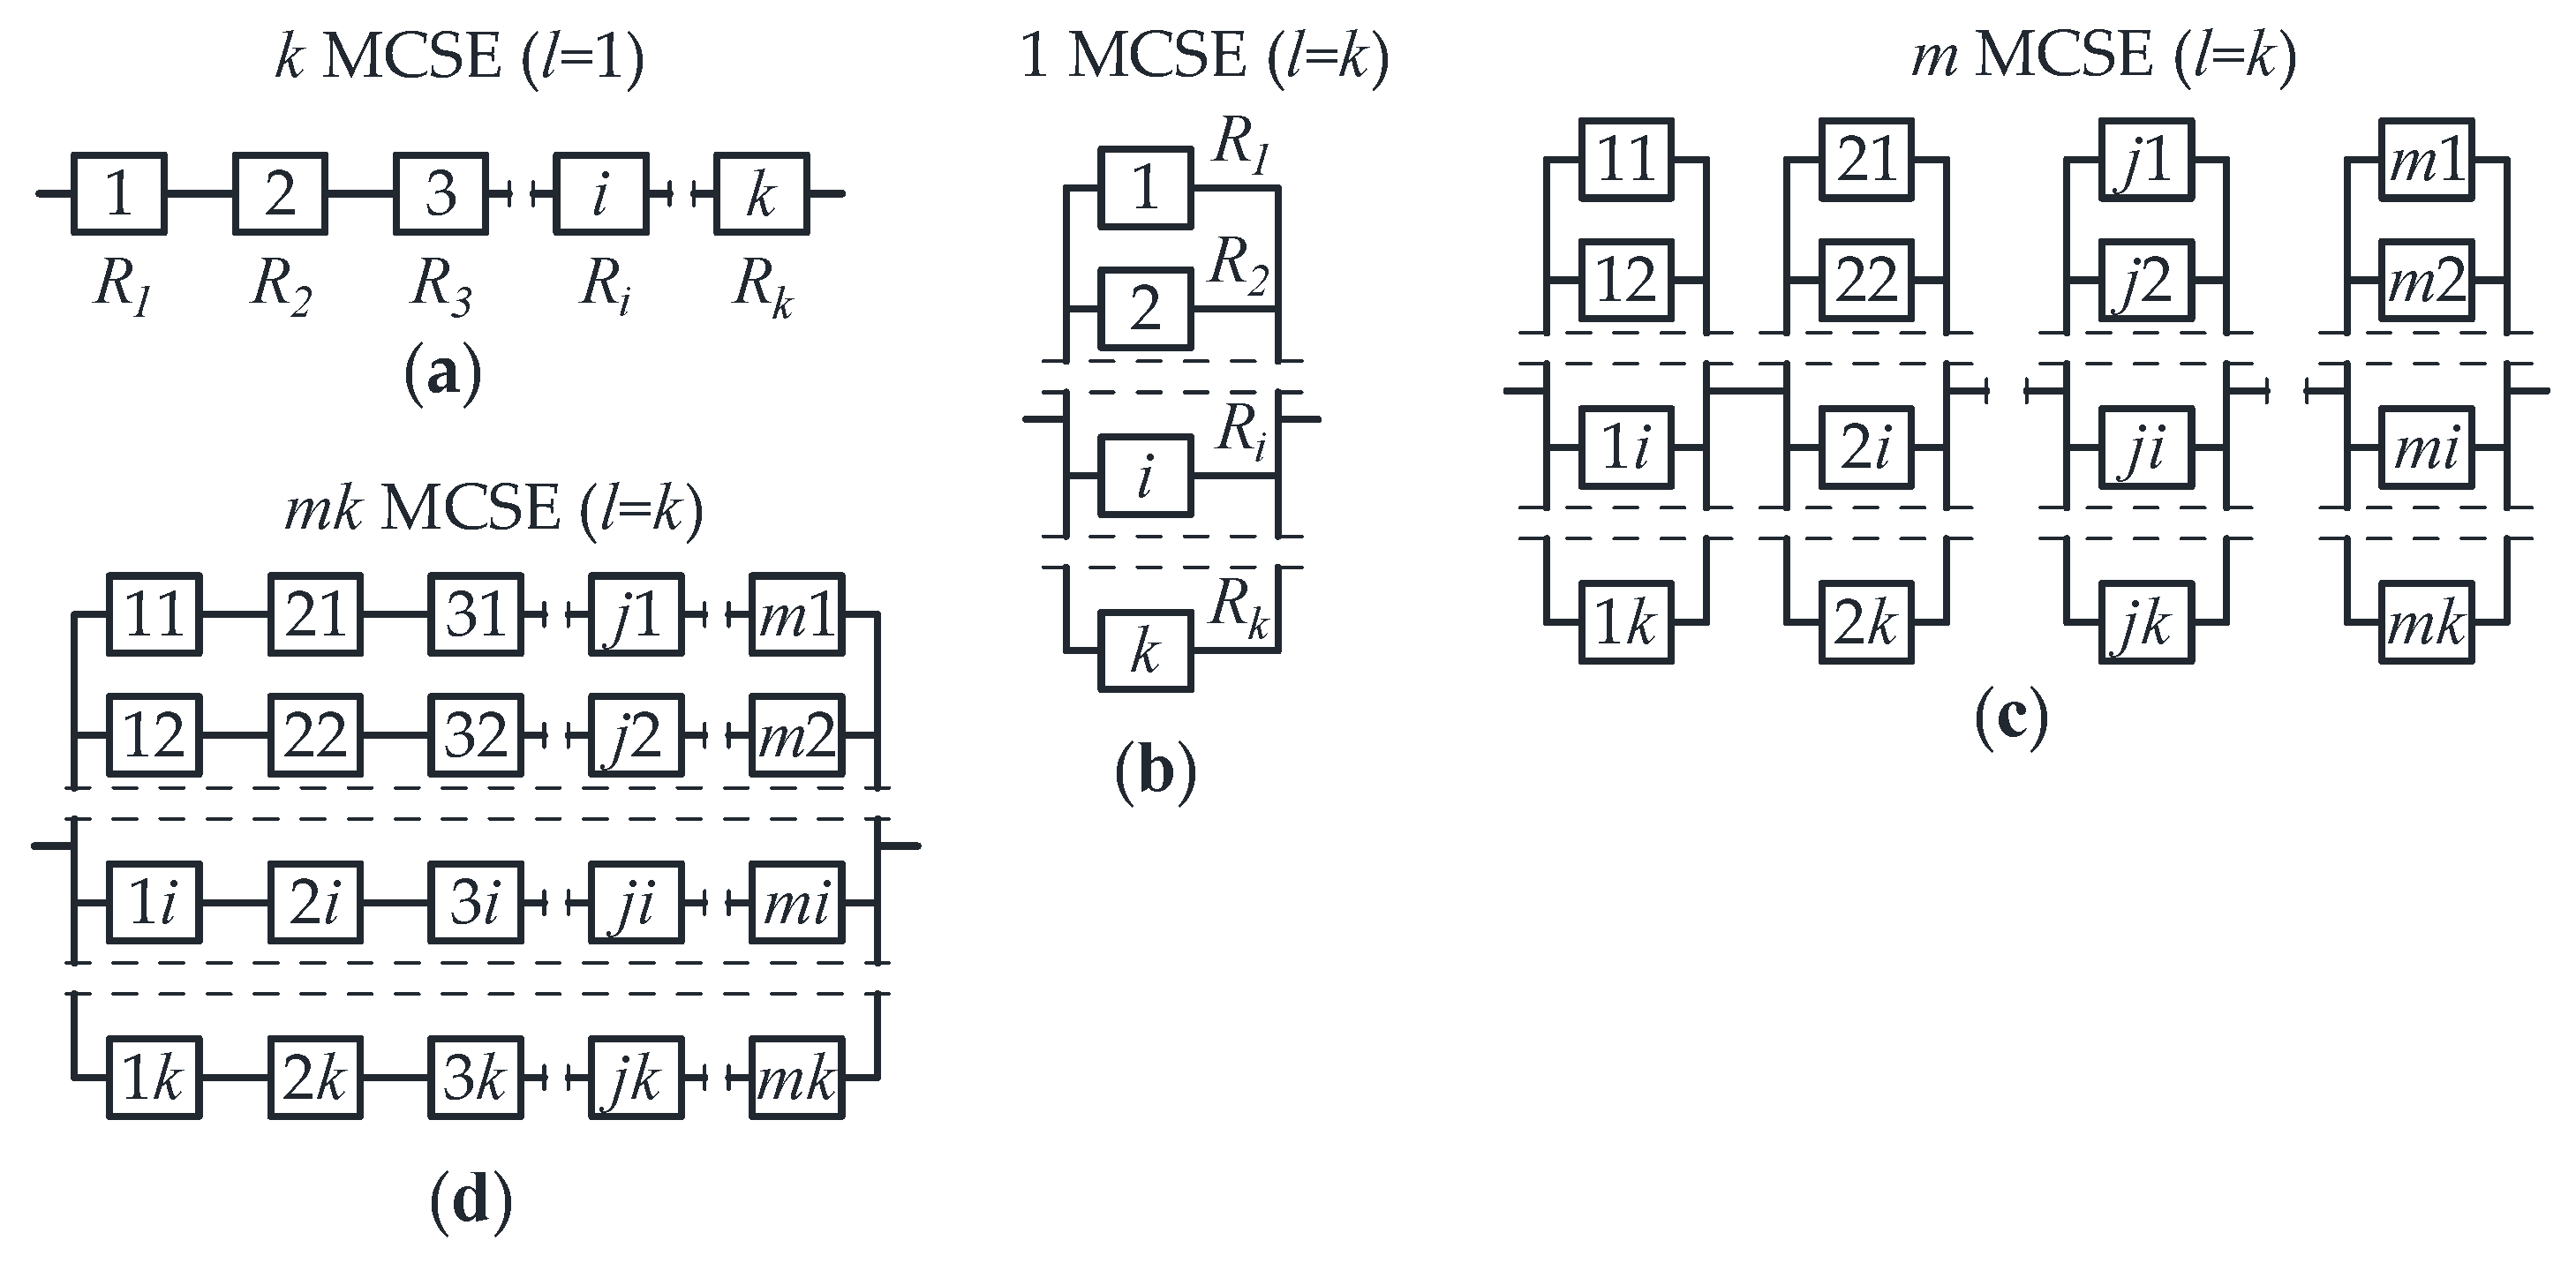
24]. In the reliability theory, there are three models: serial, parallel, and mixed (parallel-serial and serial-parallel) systems. To identify the reliability model, the kinematically admissible failure mechanisms (KAFMs) should be specified. Each KAFM contains the minimal critical sets of elements (MCSE), which have a particular number of tshe causative elements (
l).
The serial system consists of
k minimal critical sets of elements (
k MCSE), each of which has one causative element (
l = 1). The serial system (
Figure 1a) is operable if all elements are operable. Reliability
R of the serial system is calculated from the formula
where
Ri—reliability of a single element and
k—number of the system elements.
In the case of a parallel system, there is one minimal critical set of elements (1 MCSE) and it consists of
k causative elements (
l =
k). The parallel system (
Figure 1b) is operable if at least one element is operable. Reliability
R of the parallel system is calculated from the formula
For more complex truss structures forming mixed systems, the reliability is evaluated by assuming actual connections and interactions between the elements. To identify the reliability model, it is necessary to analyze how the elements are coupled, i.e., what relations hold between them. Mixed systems consist of parallel-serial and serial-parallel arrangements.
The parallel-serial system (
Figure 1c) consists of
m MCSEs, each of which includes
k causative elements (
l =
k). Reliability
R of the parallel-serial system is calculated from the formula
For the last serial-parallel system (
Figure 1d), the number of MCSEs is
m⸱k and each MCSE consists of
k causative elements (
l =
k). Reliability
R of the serial-parallel system is calculated from the formula
To carry out the spectral analysis of the linear stiffness matrix (identify the reliability model) and to calculate the reliability index, the program developed by the authors in the Mathematica environment was applied.
To determine the reliability of the system, it is necessary to calculate the reliability of a single element. The procedure that leads to the determination of the reliability of a single element
Ri was presented, for example, in [
21,
22]. The first step is to determine the effect of action
Ei, and capacity
Ni. The next step is to determine the safety margin
Zi. It is a difference between the effect of action
Ei and capacity
Ni. To compute reliability of the single element, it is necessary to determine expected value
and standard deviation
of the safety margin. A subsequent step is computing the reliability index for a single element
and probability of the element failure
, where
Φ is the Laplace function. Finally, the reliability of a single element is estimated from the formula
. To compute the reliability of the system
R, it is necessary to identify the reliability model. After that, the probability of failure of whole structure
and reliability index of whole structure
are computed.
In this paper, the algorithm described above was used to assess the reliability of a steel truss tower. The influence of randomness is taken into account in the capacity and the effect of actions. As in publication [
22], both values have a normal distribution. The coefficient of variation for the effect of actions is equal to 6%. In this paper, two cases of load capacity description are considered. In the first case, coefficient of variation for the capacity is equal to 10%. In the second case, it was taken into account that the capacity is a function of several random variables (area of cross section, yield strength, modulus of elasticity, minimum moment of inertia, and length of element). Each random variable describing the capacity of an element may have a different value of the coefficient of variation. This causes difficulties in calculating the standard deviation of the capacity, which can be solved using the following approximation [
25,
26]:
where
f—is the function of uncorrelated variables,
Xi—single random variable, and
m—number of variables.
The values of variation coefficients from
Table 1 were used in the calculation of the standard deviation of the buckling coefficient and capacity. Values of coefficients of variation are defined on the basis of the following papers [
27,
28]. Calculations of these values for each types of elements (compression and tension) were carried out in the Mathematica program.
3. Results
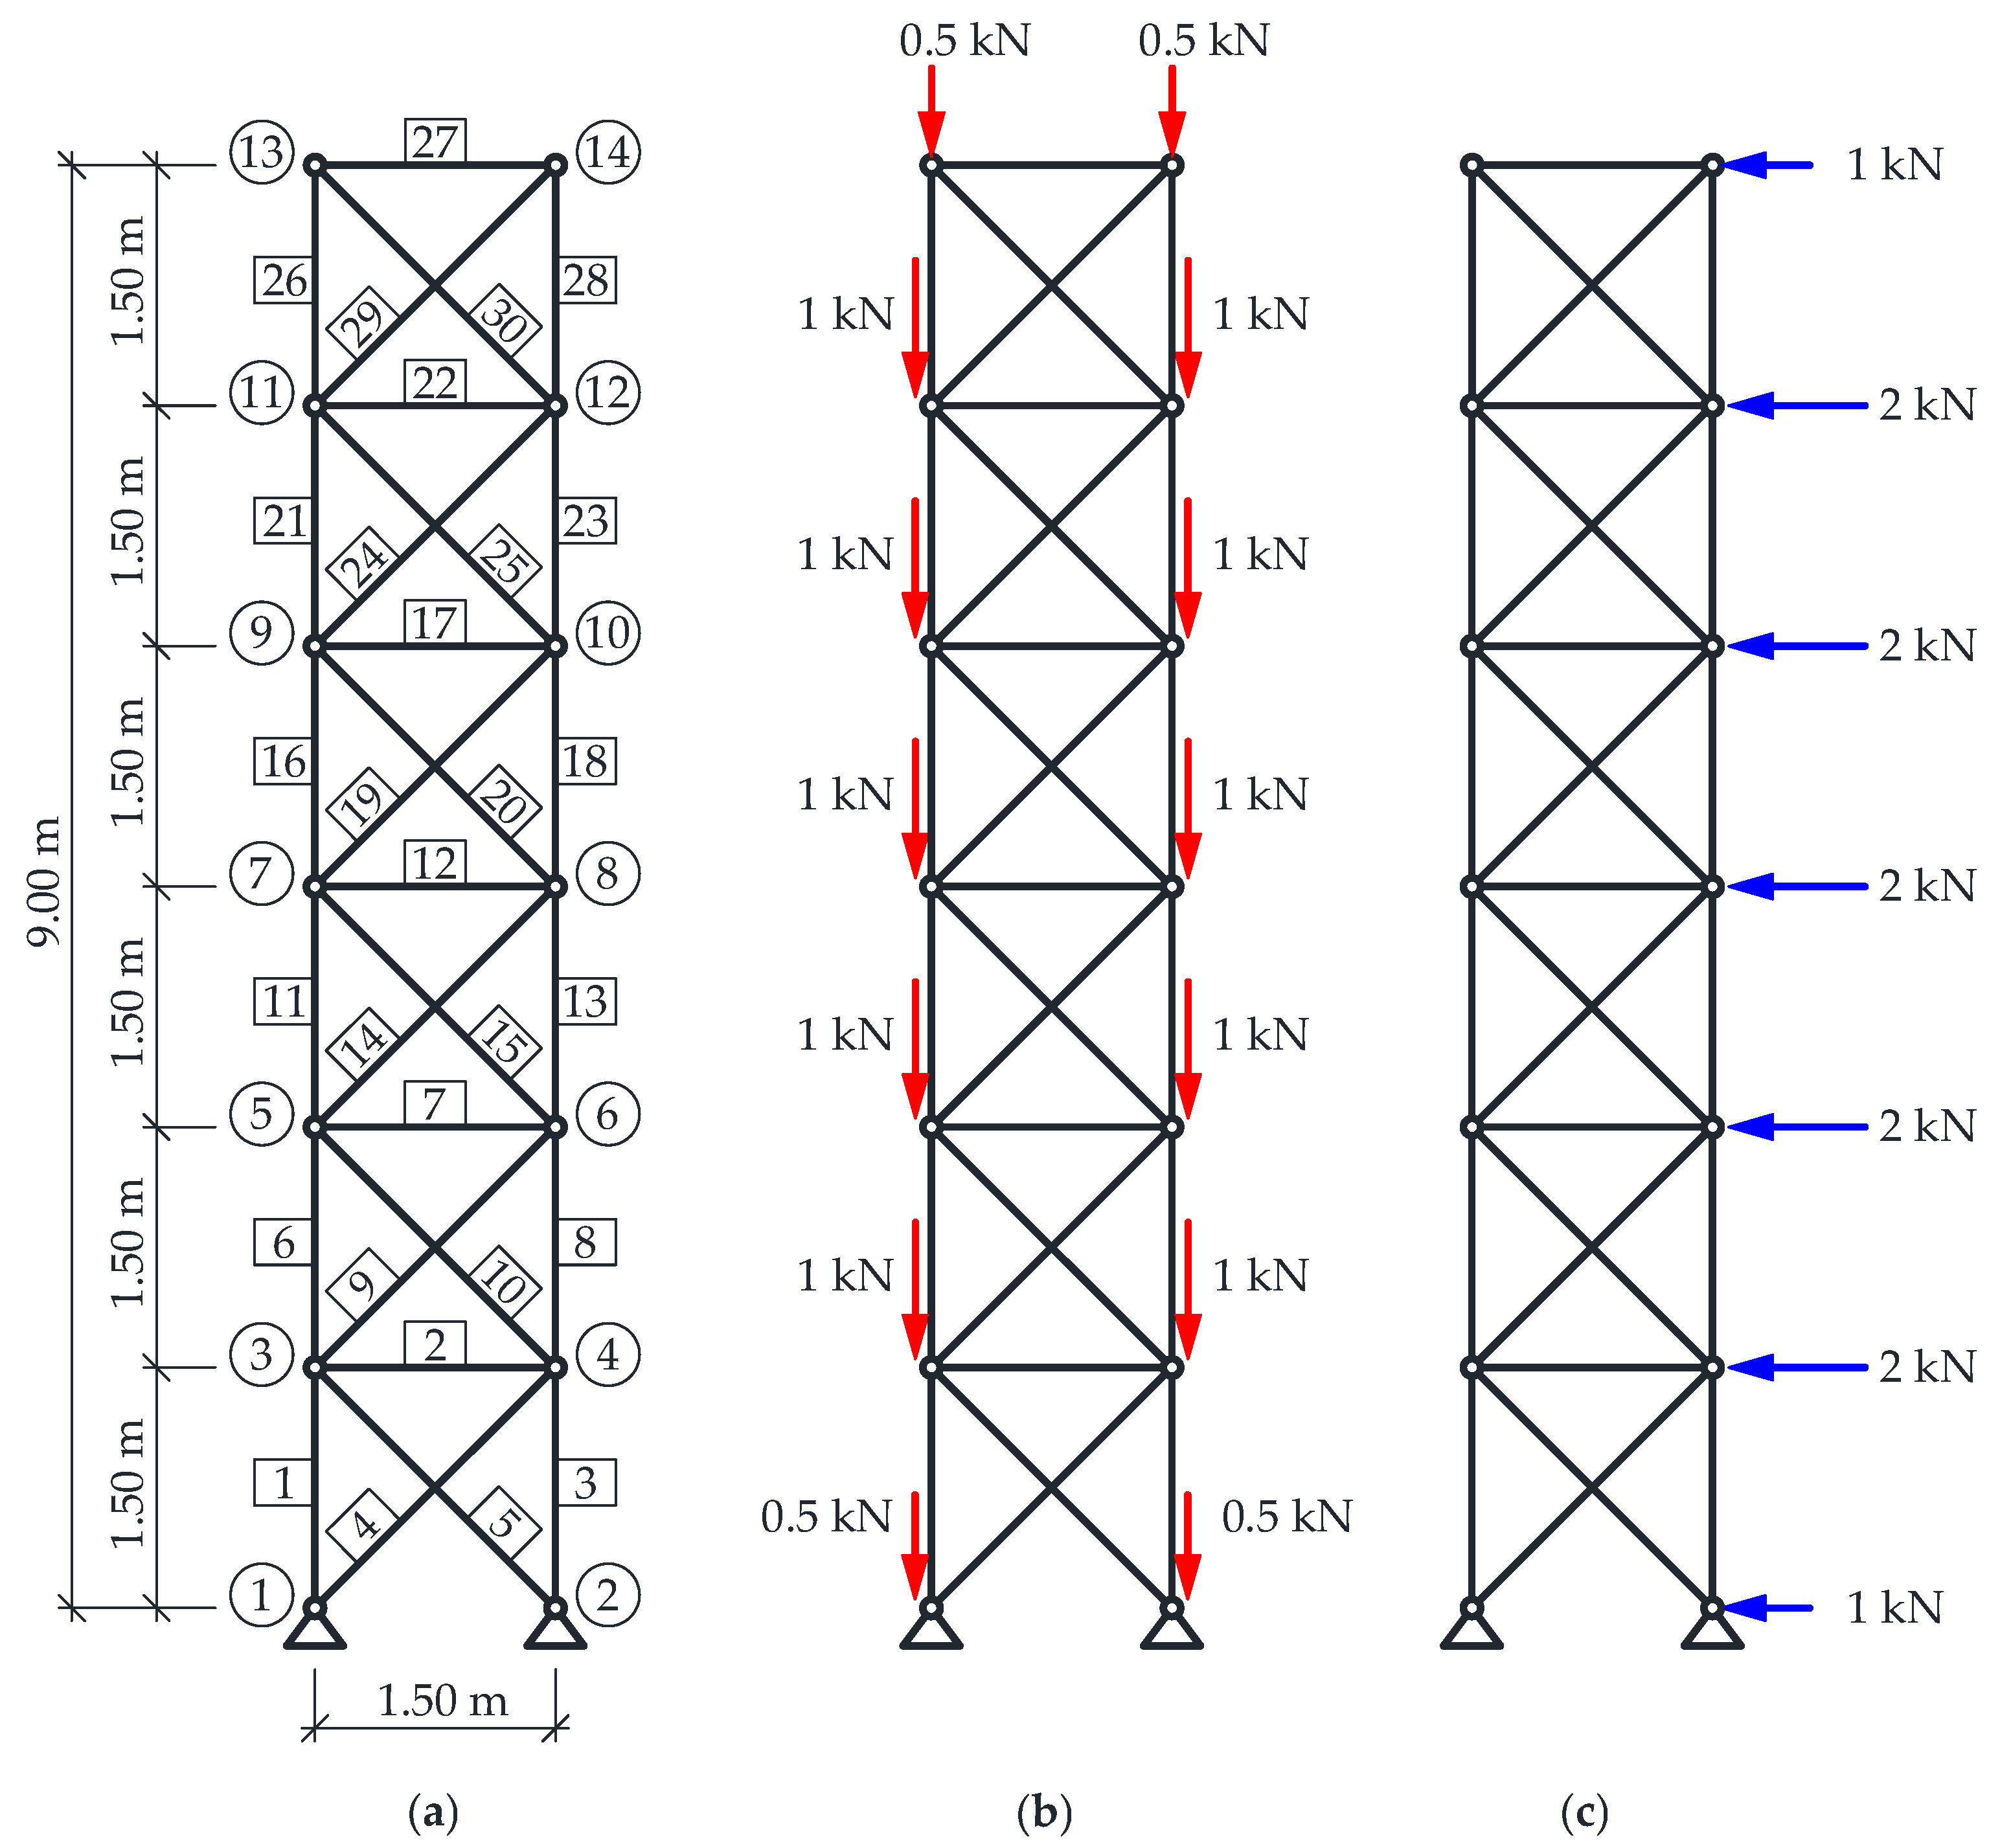
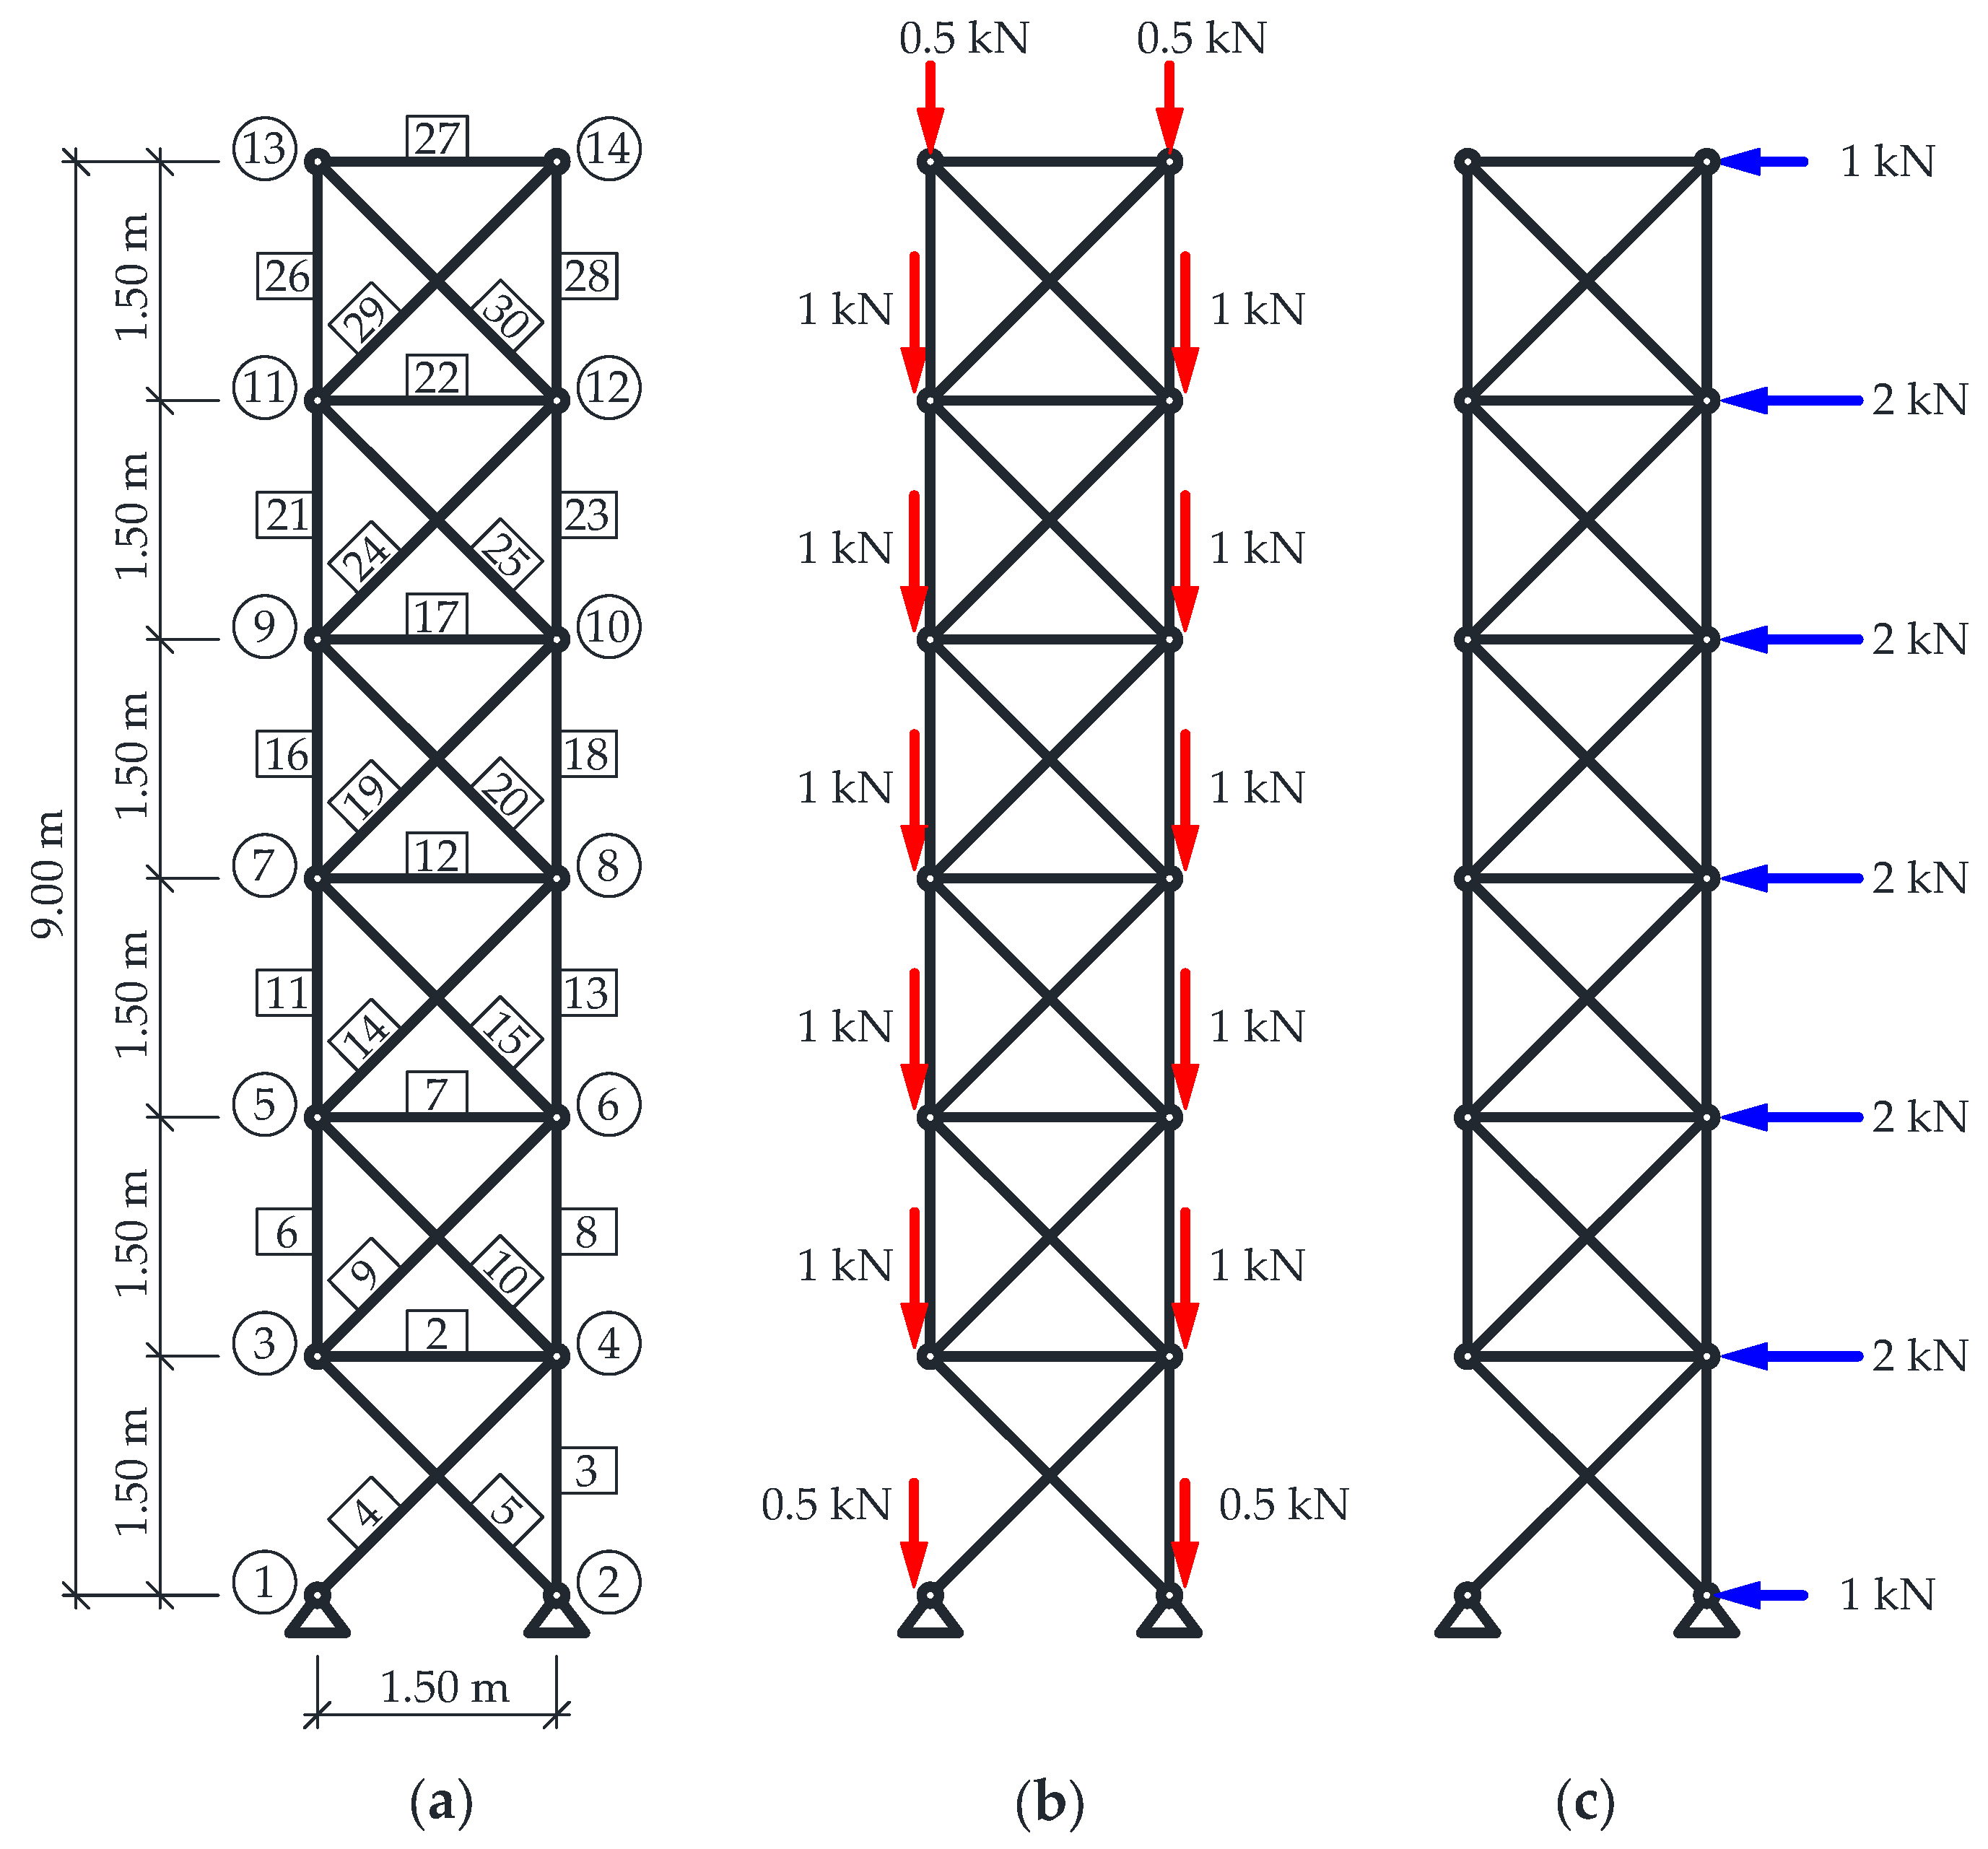
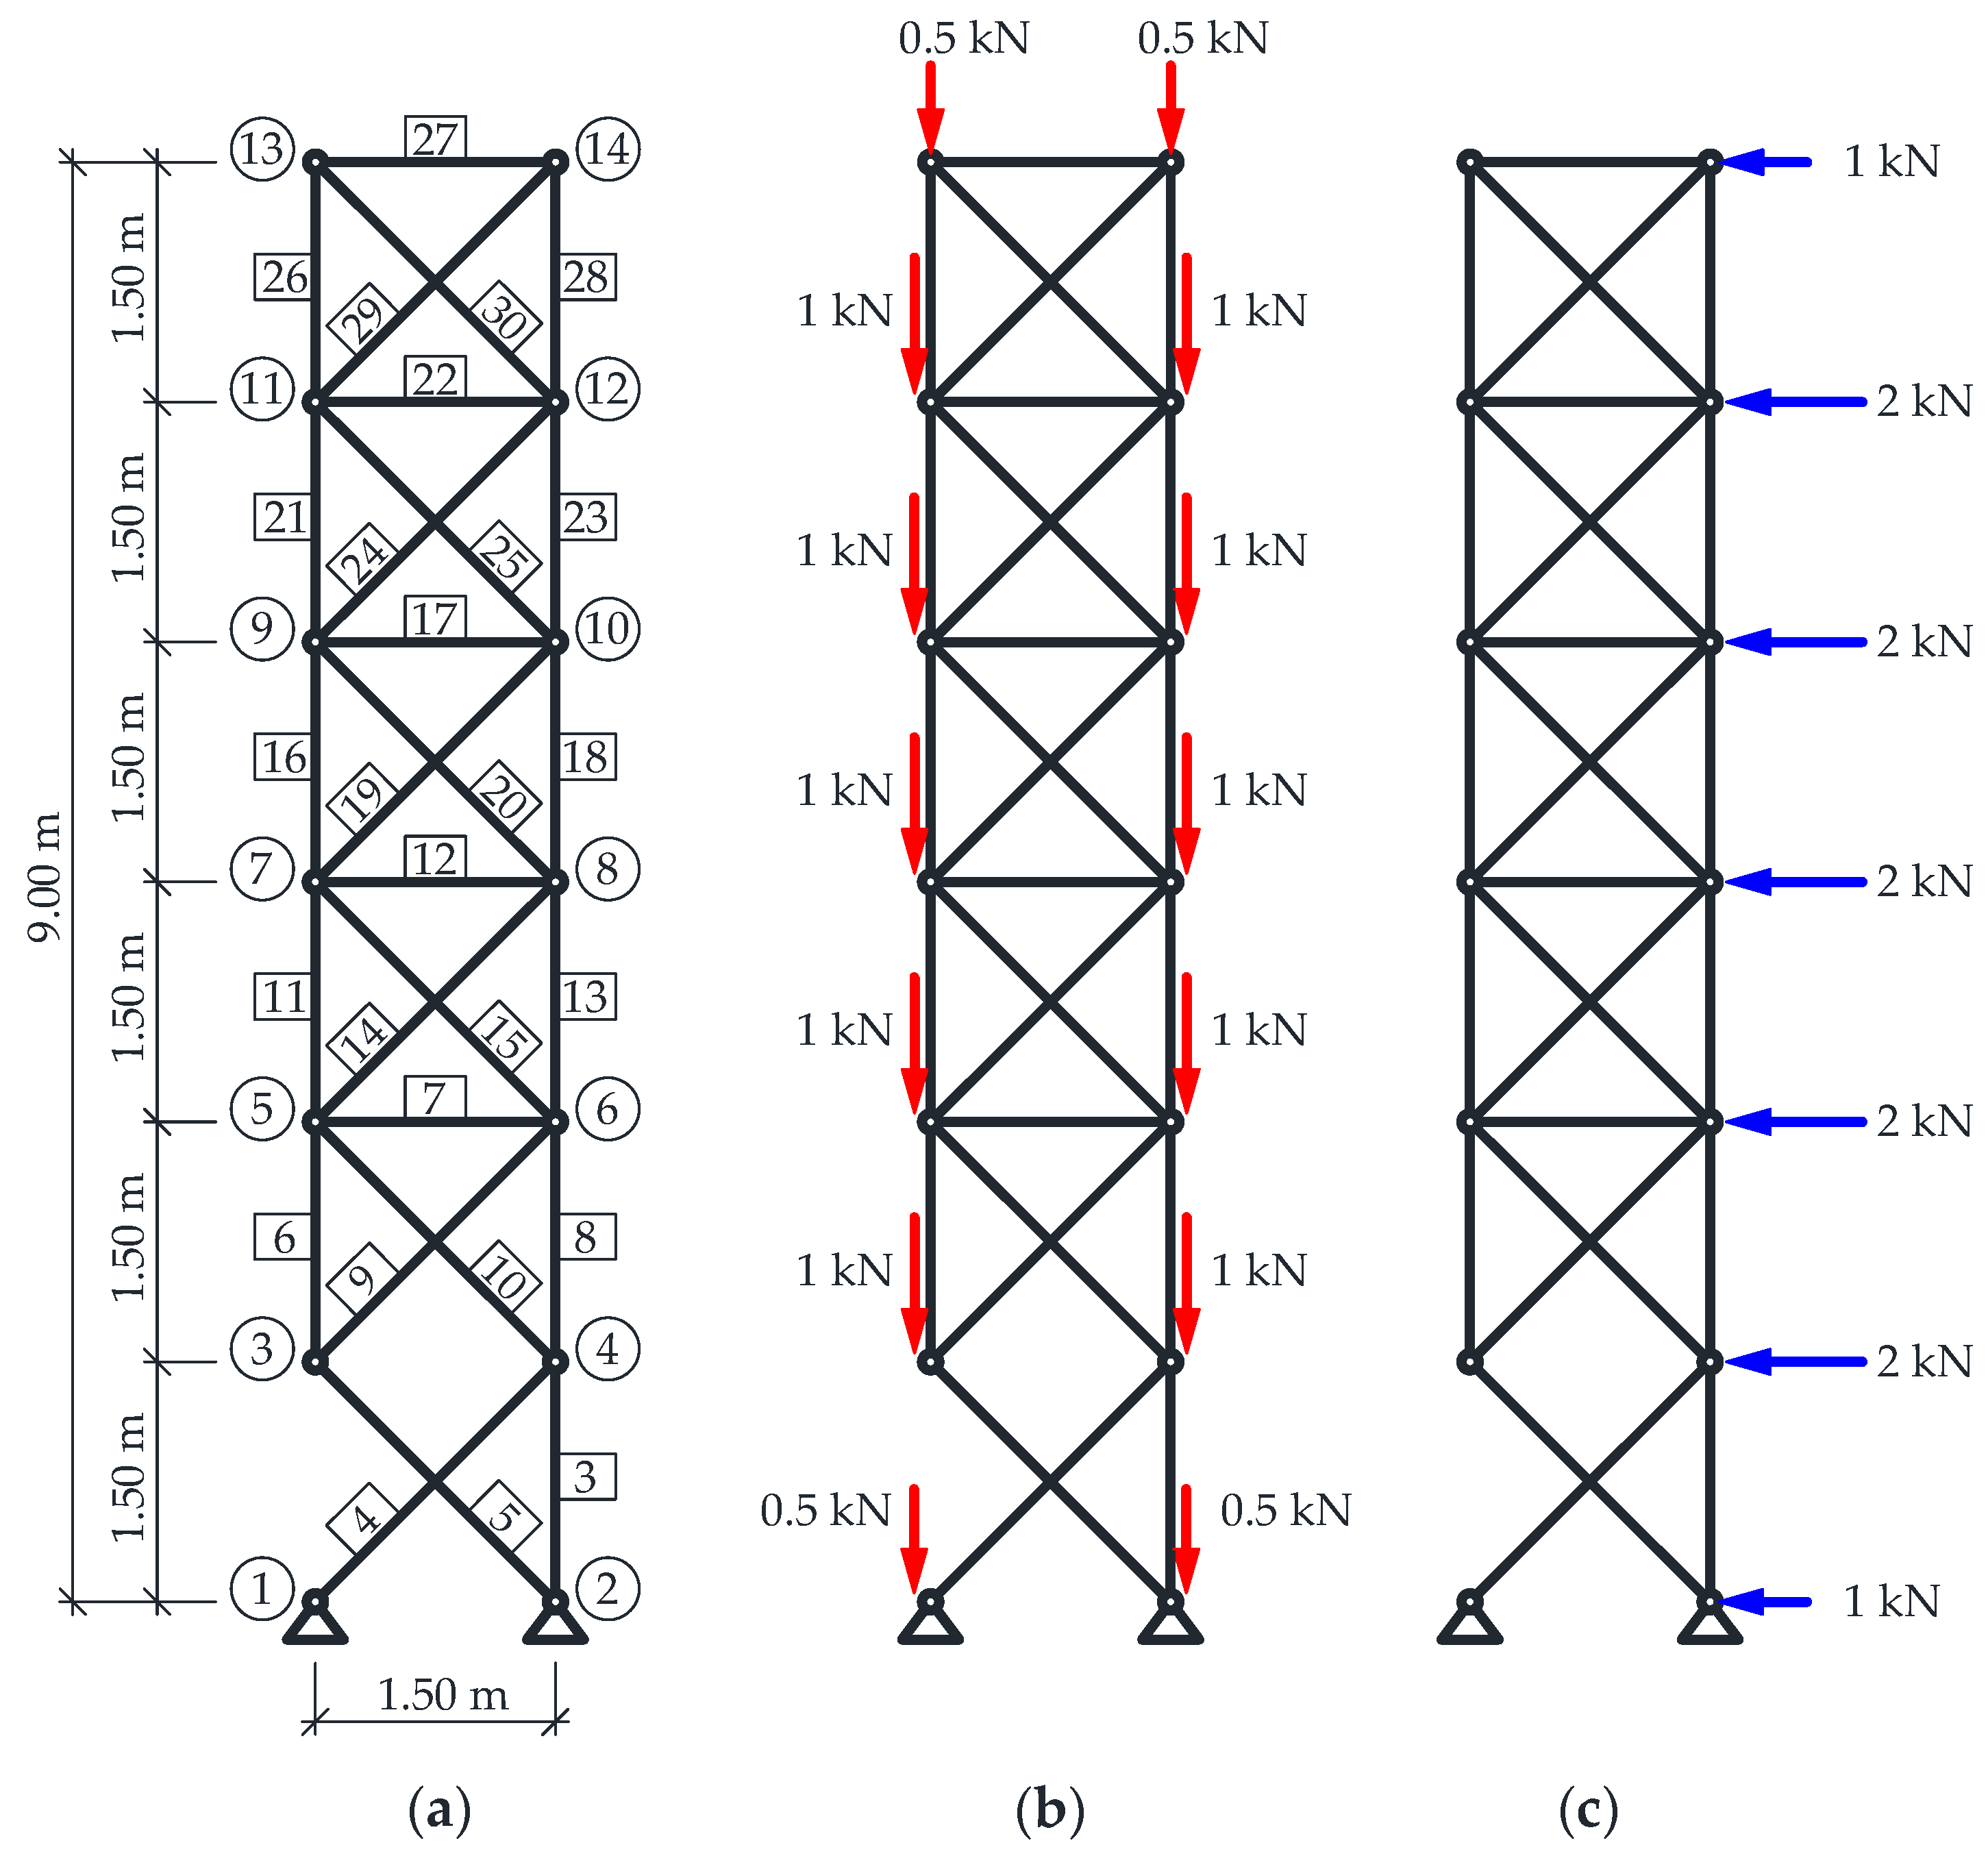
The article presents an analysis of the reliability truss tower with the number of repeating sections
lm = 6 and topology shown in
Figure 2. Towers are designed from S235 steel with the yield strength
fy = 235 MPa. The structure is designed according to the standards [
29,
30,
31]. The reliability index is calculated according to the assumption of parallel-serial connections. This assumption is more appropriate than the assumption of serial connections. It is due to taking into account the real performance of the structure. The study investigated the effect of removing each individual element on the reliability structure. The first step, however, involved the assessment of the reliability of the structure in its original state and number of elements being
le. This analysis includes the following:
In the case when there is no failure mechanism, the reliability assessment consists in comparing the reliability index of the structure with the required value of the reliability index. The required value of the reliability index was chosen for the RC2 reliability class (50 years reference period). In accordance with the standard [
29], “Three reliability classes (RC1, RC2, and RC3) may be associated with the three consequence classes CC1, CC2, and CC3”. The tower’s construction was classified as a structure with the consequence class CC2. This means that “Medium consequence for loss of human life and economic, social, or environmental consequences are considerable”. The required value for the reliability class RC2 is
βEC = 3.8. The reliability index for parallel-serial system is 4.471. The structure is sufficiently safe, because the reliability index
β is greater than 3.8.
The next step is to analyze the effect of removing each individual element of the truss tower. The algorithm for the reliability analysis of truss structure with number of elements le − 1 is shown together with an example of the effect of element No. 1 removal, as follows:
The removal of element No.1 from the structure results in exceeding the capacity of element No. 2. However, it does not cause a failure mechanism. Therefore, it is necessary to check the reliability of the system after removing elements No. 1 and No. 2:
It turns out that the consequence of the removal of the elements No. 1 and No. 2 is exceeding the capacity in elements No. 9 and No. 10. This is the cause of the failure mechanism of the structure. The same analysis was carried out for all thirty cases when single elements were removed from the tower. The results are shown in
Table 5 and
Table 6.
Based on the results presented in
Table 5 and
Table 6, it can be concluded that the description of the buckling coefficient has a large influence on the reliability. When the buckling coefficient is treated as a probabilistic variable, the results are lower. Therefore, these results are treated as representative and compared in the form of graphs (
Figure 6,
Figure 7,
Figure 8,
Figure 9 and
Figure 10). The results refer to the required value of the reliability index for the reliability class RC2 (
βEC = 3.8). The graphs in
Figure 6,
Figure 7,
Figure 8,
Figure 9 and
Figure 10 show the data from
Table 6. For each of the figures on the left, the removed elements are underlined.
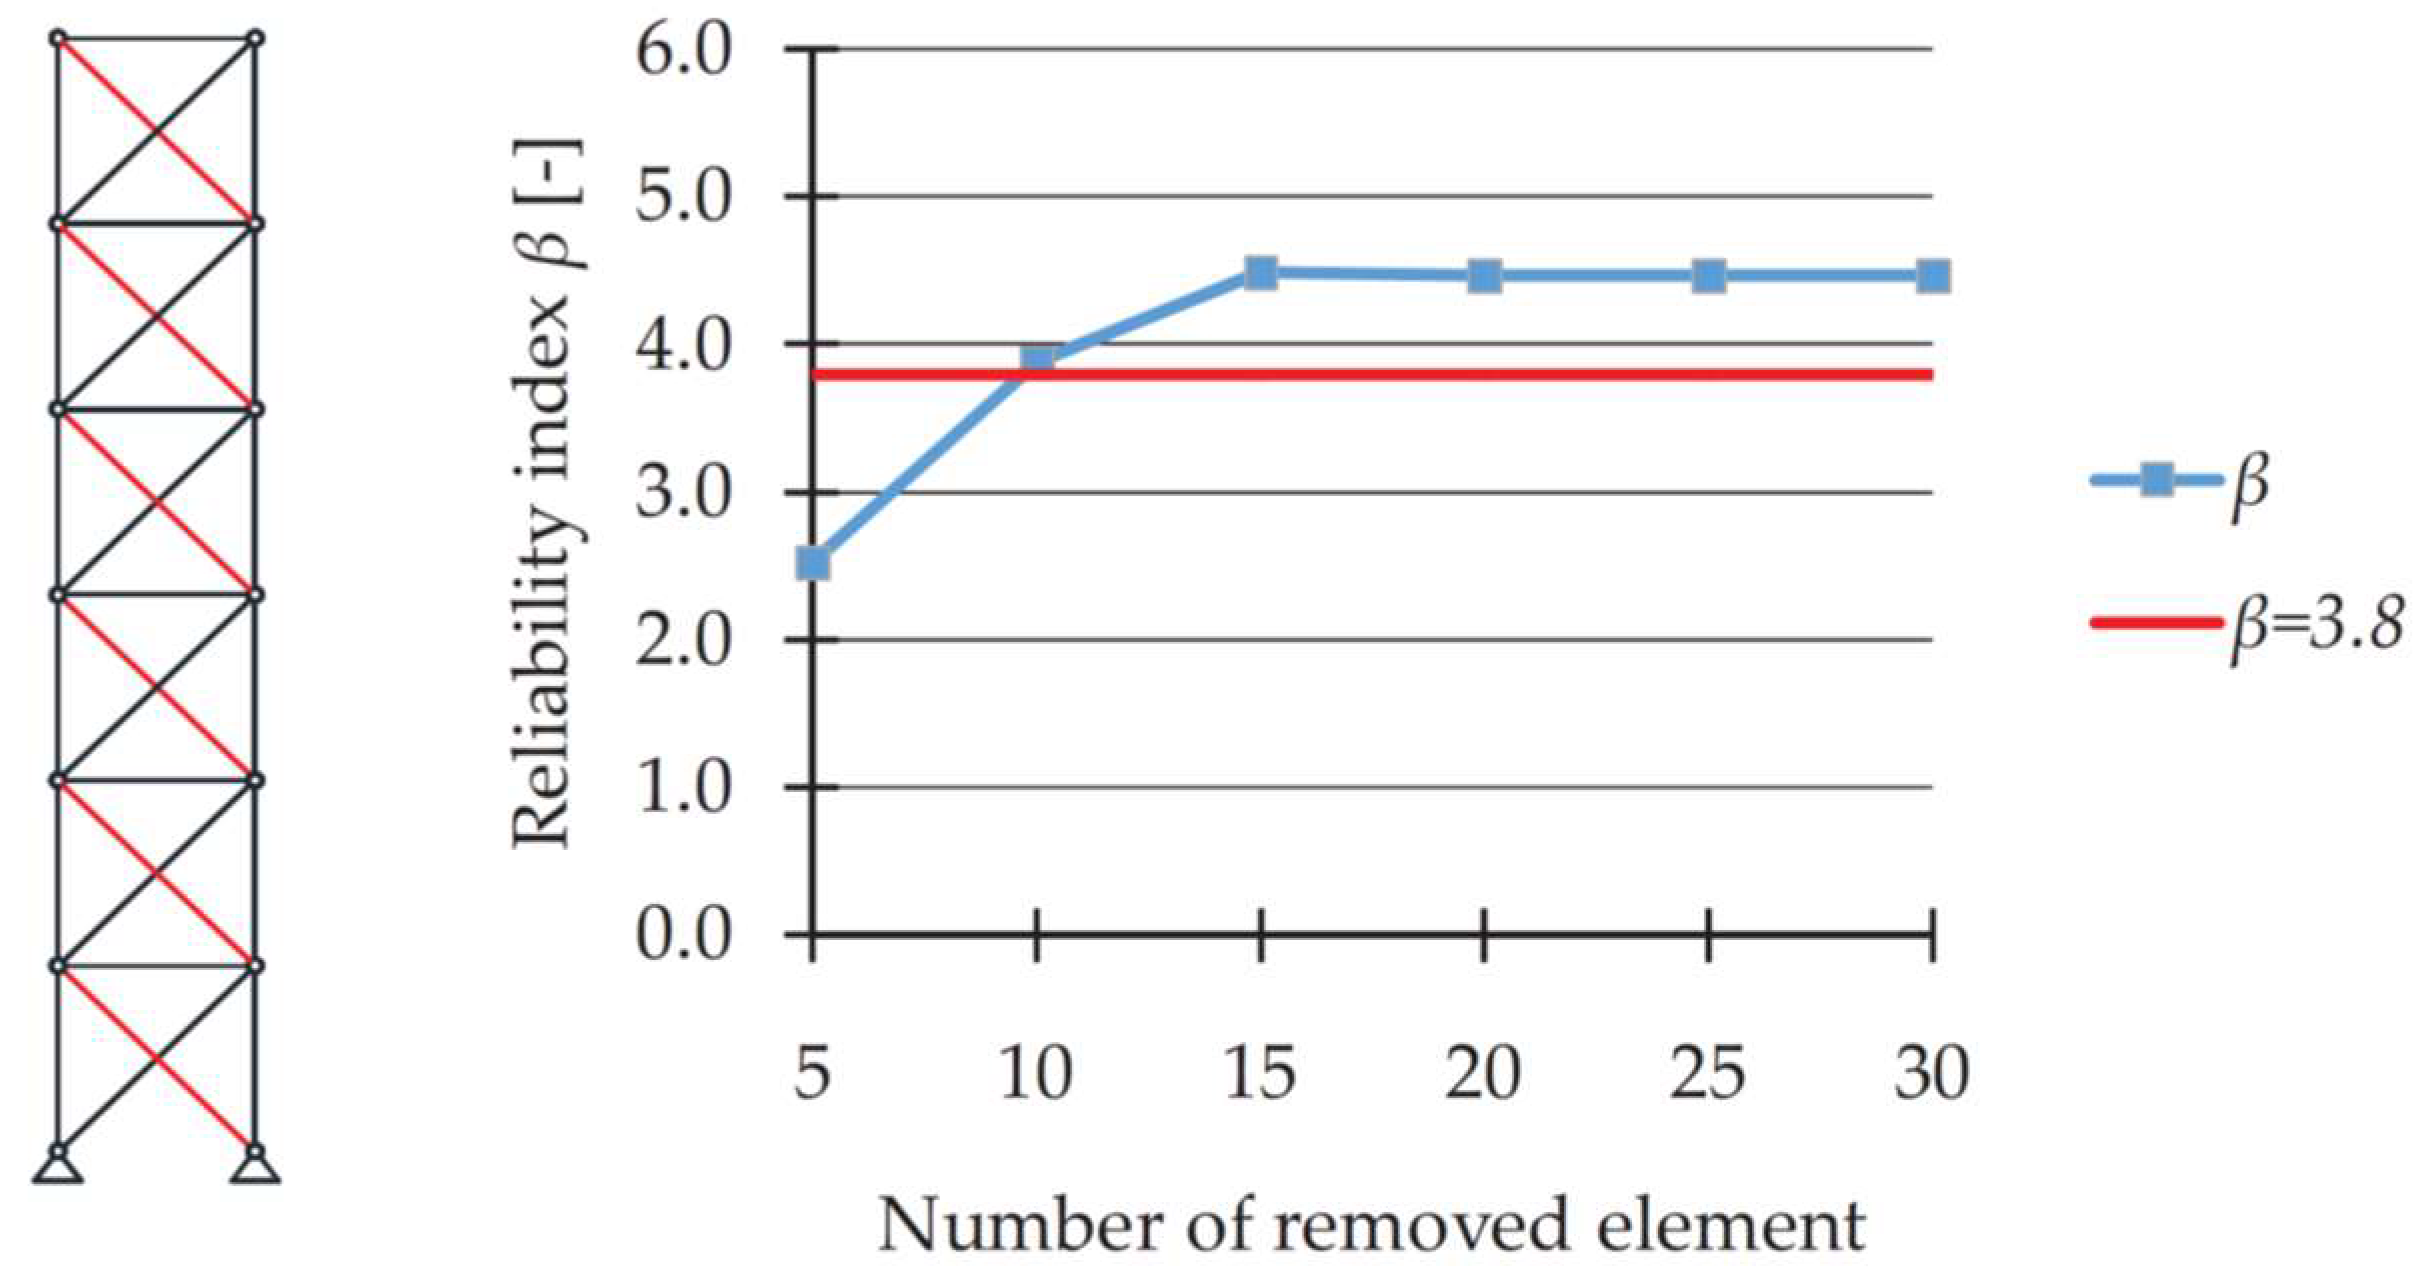
Figure 6 shows the results for removed left main legs (elements no. 1, 6, 11, 16, 21, and 26). Removal of item no. 1 causes failure of the whole structure. Removal of item no. 6 causes failure of the whole structure. Removal of element number 6 causes the reliability index is insufficient (
β = 1.484 <
βEC = 3.8). Removal of elements no. 11, 16, 21, and 26 does not cause the reliability index to drop below the required level. The graphs on the following figures (
Figure 7,
Figure 8,
Figure 9 and
Figure 10) should be interpreted as shown in
Figure 6.
4. Discussion
The aim of the paper was to analyze the reliability of the steel truss tower after the failure of individual elements. The analyses carried out for the study led to some valid conclusions.
An important issue is the impact of the description of the buckling coefficient (probabilistic or deterministic) on the results of the reliability index. The difference in the results of the reliability index β is up to approximately 37%. Coefficients of variation of random variables, on which the buckling coefficient depends, play a key role. Therefore, determining the appropriate values of variability coefficients is an important issue in future studies.
The failure of individual elements of a truss tower can bring about different effects. In the case of the analyzed tower, the removal of six individual elements leads to the failure of the whole structure. For a buckling coefficient being a probabilistic value, six cases of a single element removal result in the insufficient value of the reliability index β (below 3.8).
The analysis of the impact of removing individual elements of the truss tower makes it possible to determine elements that can be additionally strengthened due to their major significance for safety. For the analyzed case, they are all elements whose removal causes the failure of the whole structure. It should be emphasized that the results obtained cannot be treated as a reference, because the reliability analysis should be carried out individually for each structure.
Analysis of failure scenarios of truss structures is a highly time-consuming task. In order to study more complex cases, it is necessary to develop an additional program that would allow automation of calculations.


