Article

Development of High-Fidelity Numerical Methodology Based on Wavenumber-Frequency Transform for Quantifying Internal Aerodynamic Noise in Critical Nozzle

1
School of Mechanical Engineering, Pusan National University, Busan 46241, Korea
2
Division of Physical Metrology, Korea Research Institute of Standards and Science, 267 Gajeong-ro, Yuseong-Gu, Daejeon 34113, Korea
3
Daewoo Shipbuilding and Marine Engineering, Geoje 53302, Korea
*
Author to whom correspondence should be addressed.
Appl. Sci. 2019, 9(14), 2885; https://doi.org/10.3390/app9142885
Submission received: 9 May 2019 / Revised: 10 July 2019 / Accepted: 16 July 2019 / Published: 19 July 2019
(This article belongs to the Section Acoustics and Vibrations)

Abstract

:
In industrial fields dealing with high-temperature and high-pressure gas such as chemical, petrochemical, and offshore oil production plants, piping systems with valves are frequently used to protect the relevant system and equipment from being damaged by such gases. However, excessive noise is sometimes generated by the valve flow in the piping system, causing so-called acoustic induced vibration in the pipe wall. Therefore, it is of great importance to design the related system to avoid this phenomenon. In this study, a high-fidelity numerical procedure is proposed to assess the acoustic power generated by pressure relief devices in a pipe. The method consists of three sequential steps: high accuracy large eddy simulation, wavenumber-frequency transform, and duct acoustic theory. The critical nozzle is selected as a target system since it is commonly used as a flowmeter and thus there are a lot of relevant data for comparison. First, the steady Reynold-Averaged Navier–Stokes (RANS) solver is used to predict the flow rate of the two-dimensional axisymmetric critical nozzles, and its validity is confirmed by comparing the predicted results with the measured ones. There is good agreement between the two results. Then, a high accuracy Large Eddy Simulation (LES) technique is performed on the three-dimensional critical nozzle, and the steady-state RANS result is used as the initial condition to accelerate the convergence of the unsteady simulation. The validity of the unsteady LES results is also confirmed by comparing them with measured surface pressure data. The wavenumber-frequency transform is taken on the LES results, and the compressible surface pressure components matching the acoustical duct modes are identified in the wavenumber-frequency pressure diagram. The inverse wavenumber-frequency transform taken on the compressible pressure components leads to the acoustic power spectrum. These results reveal that the current numerical procedure can be used to more accurately predict the acoustic power generated by pressure relief device in the piping system.

1. Introduction

In general, a complex pipe system is used to transport high-temperature and high-pressure gas in industries such as chemical, petrochemical, and offshore oil production plants. When the piping system is over-pressurized, the pressure relief valve is installed to prevent pipe failure due to high-pressure. When the fluid passes through the pressure relief valve, high acoustic energy is generated and radiated in the downstream direction due to the sudden pressure drop through the valve. Acoustic pressure waves induce the vibration of the pipe wall. This phenomenon is called “Acoustic Induced Vibration” (AIV). AIV in a piping system is known to be involved in the structural and acoustic fluctuations in a range of frequencies between 500 and 2000 Hz [1]. Carucci and Mueller [2] collected the failure cases until 1980 to separate the failures due to AIV and suggested the simple procedure of a pipe design to prevent AIV. Esinger [3,4] collected more pipe failure cases and modified the criteria of Carucci and Mueller. NORSOK standard [5] adopted the method proposed by Carucci and Mueller to assess the acoustic power level in a design stage of pipe. Bruce et al. [6] summarized the history of empirical research about AIV in a piping system and suggested the modified empirical method newly adopting the thickness of pipe wall as an additional parameter to the diameter of the pipe. Because most of preceding studies on the AIV problems in piping systems depend on empirical approaches, the fundamental mechanism of AIV does not come out into the open, and thus it is difficult to devise effective measures for AIV even if the AIV problem is expected. To find the precise mechanism of AIV and to devise its effective measure, the first-principle-based method is essential. Agar and Ancian [7] used a fluid-structure one-way coupling method using ACTRAN software based on the finite element method and suggested a methodology for AIV risk assessment. However, the method is still based on an empirical formula of Carucci and Mueller for the prediction of acoustic power. Kim et al. [8] estimated the internal aerodynamic noise due to valve flow in a simple constriction-expansion pipe, by combining the large eddy simulation technique with a wavenumber-frequency analysis. However, the results were not confirmed by using any measured data. The main goal of this study is to propose the first-principle-based methodology to determine the acoustic power due to valve flow in a pipe. The method consists of three sequential steps: accurate internal flow simulation using Large Eddy Simulation (LES) techniques, the separation of compressible and incompressible pressure waves using the wavenumber-frequency analysis and the assessment of acoustic power using the duct acoustic theory. The critical nozzle is selected as a target system since it is commonly used as a flowmeter and thus there are a lot of relevant data for comparison. First, the steady RANS solver is used to predict the flow rate of the two-dimensional axisymmetric critical nozzles, and its validity is confirmed by comparing the predicted results with the measured ones. There is good agreement between the two results. Then, a high accuracy LES technique is performed on the three-dimensional critical nozzle, and the steady-state Reynold-Averaged Navier–Stokes (RANS) result is used as the initial condition to accelerate the convergence of the unsteady simulation. The validity of the unsteady LES results is also confirmed by comparing them with measured surface pressure data. The wavenumber-frequency transform is taken on the LES results, and the compressible surface pressure components matching the acoustical duct modes are identified in the wavenumber-frequency pressure diagram. The inverse wavenumber-frequency transform taken on the compressible pressure components leads to the acoustic power spectrum.
The structure of the paper is organized as follows. In Section 2, the governing equations and the numerical methods including the CFD techniques and the wavenumber-frequency analysis are presented. In Section 3, the experimental setup is presented. In Section 4, the numerical simulation results are presented with the accompanying experimental results for validation. Finally, the acoustic power spectrum due to the critical nozzle flow in a pipe is predicted using the wavenumber-frequency analysis.

2. Governing Equations and Numerical Methods

2.1. Target Internal Flow System: Critical Nozzle

Generally, in a nozzle, when the pressure difference between upstream and downstream is larger than a specific value, the flow cannot be accelerated higher than the sonic speed at the nozzle throat, and the mass flow rate is kept constant. This phenomenon is called a choked flow. When the choke flow occurs, the mass flow rate through the nozzle can be determined using the only inlet flow field information such as total pressure, temperature, and velocity upstream of the nozzle and the nozzle area, regardless of the downstream flow conditions. The ratio of the theoretical mass flow rate to the actual mass flow rate is defined as the efficient coefficient, which is closer to one as the Reynolds number increases. The critical flow Venturi nozzle (CFVN) is widely used as a flowmeter by using the characteristics of the nozzle. According to ISO 9300, the CFVNs can be classified into cylindrical-throat Venturi nozzle and toroidal-throat Venturi nozzle depending on their throat shape [9]. In this study, the toroidal-throat Venturi nozzles, which are commonly used in flowmeters, were investigated. Figure 1 shows the shape of the toroidal-throat Venturi nozzle with its geometric parameter, d.

2.2. Governing Equations

For the numerical simulations of the flow through the critical nozzle, the Navier–Stokes equations are used as the governing equations. However, there are many physical and numerical issues to deal with in solving the Navier–Stokes equations numerically. The most difficult is due to the strong nonlinearity of the equations. Numerical approaches to nonlinear problems suffer from not only poor accuracy and convergence but also high numerical cost. To solve these difficulties and to apply the Navier–Stokes equations to a broader range of fields by using a numerical method, the Navier–Stokes equations are generally averaged. The most widely used averaged Navier–Stokes equations in computational fluid dynamics are the Reynold-Averaged Navier–Stokes (RANS) equations. The behavior of fluids present in nature can be thought of as the sum of deterministic and random quantities. The RANS equations average over time, which eliminates the random behavior of fluids. The compressible RANS equation is written as follows.
ρ t + x i ( ρ u i )   =   0
t ( ρ u i ) + x j ( ρ u i u j )   =   p x i + x j [ μ ( u i x j + u j x i 2 3 δ i j u k x k ) ] + x j ( ρ u i u j ¯ )
t ( ρ E ) + · ( u ( ρ E + p ) )   =   · (   h j   J j )
where ρ, u, p, and μ are the density of the fluid, velocity, pressure, and dynamic viscosity. δ is the Kronecker delta function. E means energy per unit mass, h means enthalpy and J diffusion flux of species j. Subscripts i and j mean x-, y-, and z-direction. ρ u i u j ¯ is a Reynolds stress tensor, which can be obtained from turbulent modeling based on the assumption of Boussinesq.
However, the RANS equations tend to over-predict the viscosity and are known to weaken the unsteady behavior of fluids such as vortex phenomena [10,11]. As another method for solving the Navier–Stokes equation numerically, a spatial averaging operation is performed on the basic equation. Large Eddy Simulation (LES) separates the flow field into a component that can be resolved using the given grid and the smaller ones. The former is directly calculated using the governing equations, and the latter is modeled using a subgrid-scale model. The governing equations are written as follows.
f   =   f ¯ + f
ρ ¯ t + x i ( ρ ¯ u i ˜ )   =   0
t ( ρ ¯ u i ˜ ) + x j ( ρ ¯ u i ˜ u j ˜ + p + δ i j )   =   τ i j + x j + x j ( μ S ˜ i j )
t ( ρ ¯ e t ˜ ) + x i [ ( ρ ¯ e t ˜ + p + ) u i ˜ ]   =   Q i x i + x i ( k T x i ¯ ) + x i ( μ u j ˜ S ˜ i j )
T +   =   T ˜ τ k k 2 c v ρ ¯ ,    p +   =   ρ ¯ R T + + ( R 2 c v 1 3 ) τ k k ,    τ i j +   =   τ i j 1 3 τ k k δ i j   =   ρ ¯ ν t S ˜ i j
LES is represented by the physical quantity that can be resolved by a grid and the physical quantity that needs to be modeled, as expressed in Equation (4). The superscript ~ denotes the Favre- (or mass-) averaged physical quantity and is used to consider the compressibility of the turbulent structure. et is the total energy, and the physical quantity by the superscript + is given by Equation (8). cv is the static specific heat, R is the gas constant, and ν is the kinematic viscosity [12].
Unlike the RANS equation using time averaging, LES does not use time averaging, so it is suitable for solving unsteady flow with time variation. However, the computation cost is very high, and the solution can be unstable according to initial conditions. In this study, to effectively and accurately consider the influence of the unsteady flow, the steady-state flow field was calculated by solving the RANS, and the LES was performed by applying the RANS results as the initial condition for the unsteady flow field simulation.

2.3. Numerical Methods

First, the steady-state RANS simulation was performed to obtain an average flow field from which the volume flow rate through the nozzle was predicted and compared with the measured data. This comparison confirms the validity of the numerical method, and the RANS solution was used as an initial condition for the subsequent LES simulation for fast convergence. In the RANS simulation, the k-ω Shear Stress Transport (SST) turbulence model was used as a closure model. The second order upwind scheme was used for the spatial discretization in both the equation for turbulent kinetic energy and dissipation rate.
High-order numerical simulation techniques in time and space are required to accurately compute the acoustic waves as well as the turbulent flow simultaneously. Therefore, the unsteady LES was performed with the steady-state RANS results as an initial condition. The bounded second-order implicit method and second-order upwind scheme were used for time and space discretizations, respectively. The pressure and velocity coupled method was used. The Smagorinsky–Lilly model, which is relatively simple and widely used, was employed as the subgrid-scale model for turbulence flow. The numerical discretization scheme for time and space was the second order accuracy, and the time interval was 5 × 10⁻⁵ s for a sampling rate of 20,000 Hz.
All of the numerical methods were realized using the ANSYS Fluent program.

2.4. Acoustic Power Due to Internal Flow Noise

As described in the Introduction, to find the precise mechanism of AIV and to devise its effective measure, the first-principle-based method is essential. Agar and Ancian [7] used a fluid-structure one-way coupling method for fluid-structure interaction based on ACTRAN software which uses the finite element method and suggested a methodology for AIV risk assessment. However, the method is still based on an empirical formula of Carucci and Mueller for the prediction of acoustic power. In addition to this study, most of the previous studies for the design criteria to prevent the fatigue failure caused by the AIV depend on the simple empirical formula by Carucci and Mueller. In this section, the formula for acoustic power due to internal flow noise is presented using the wavenumber-frequency transform of pressure field in time–space domains and the duct acoustic theory.
As a starting point, the pressure fluctuation due to the flow on the pipe wall needs to be separated into the incompressible and the compressible pressure fluctuations [13]. The incompressible pressure fluctuation is not associated with the density perturbation of the fluid. It is also called the hydrodynamic pressure fluctuation or the pseudo sound and propagates at the same speed as the convection eddy velocity in the fluid. Compressible pressure fluctuation refers to acoustic waves due to perturbations of density and velocity in a fluid and propagates at the speed of sound. A wavenumber-frequency analysis can be used to separate the incompressible and compressible components from the total pressure fluctuation components on the wall. Since the target problem of this study is a circular pipe, the Fourier transform in the cylinder coordinate system is more suitable. From the previous study, the wavenumber-frequency analysis is performed in the form [8],
S ( m ,   p Δ k z , o Δ f )   =   1 N t N z N θ n   =   0 1 J m ( k r 0 , m , n   r 0 ) k   =   1 N t 1 l   =   0 N z 1 j   =   0 N θ 1 w k l j   p k l j e 2 π i ( k o N t + m θ N θ l p N z )
where S is the spectral density, m is the circumferential mode, n is the radial mode, kz is the axial direction wavenumber, and Jm is the Bessel function of mth order. N means the size of the discretized signal over time and space. The Hanning function is used as a window. The axial wavenumber, kz, from duct acoustics is defined as:
k z , m , n ±   =     M k 0   +   [ k 0 2 ( 1 M 2 ) k r , m , n 2 ] 1 / 2 1 M 2
k 0 2     ( 1     M 2 ) k r , m , n 2   >   0
The Fourier transform of the discretized pressure fluctuation signal in time and space can be used to obtain a wavenumber-frequency diagram from Equation (9). The acoustic power generated in the pipe can be obtained by defining the instantaneous sound intensity corresponding to the acoustic power per unit area and integrating it over the area. Since the empirical approach uses acoustic power as a criterion to determine the possible occurrence of AIV, the formula for the acoustic power is derived and presented combining the wavenumber-frequency spectrum with the duct acoustic theory. The sound pressure and particle velocity in the pipe can be deduced from the duct acoustic theory [14],
p ( r ,   θ ,   z ,   t )   =   m   =   0 n   =   0 J m ( k r , m , n r ) e j m θ e j ω t × ( C + , m , n e j k z , m , n +   z + C , m , n e + j k z , m , n   z )
u z ( r ,   θ ,   z ,   t )   =   m   =   0 n   =   0 k z , m , n + k 0 ρ 0 c 0 J m ( k r , m , n r ) c o s ( m θ ) C + , m , n e i ( ω t k z , m , n +   z )
The acoustic intensity can be expressed as the product of the compressible pressure fluctuation obtained previously and the particle velocity. Finally, it can be expressed as
d W   =   I z d A   =   p u z d A W   =     I ¯ d A    w h e r e    I ¯   =   1 T 0 T I z d t
W   =   m   =   0 n   =   0 k z , m , n + k 0 ρ 0 c 0 C + , m , n 2 1 2 0 2 π c o s 2 ( m θ ) d θ R 2 2 { J m ( k r , m , n R ) 2 J m 1 ( k r , m , n R ) J m + 1 ( k r , m , n R ) }

3. Experimental Setup

In order to measure the surface pressure fluctuation downstream of the critical nozzle causing the AIV, the high-pressure gas flowrate standard system of the Korea Research Institute of Standards and Science (KRISS) was used as shown in Figure 2 [15]. The high-pressure gas flow standard system is a blow-down system in which a gas is stored in a storage tank at a high pressure using a compressor, and then the stored gas is adjusted to the specified pressure and discharged to a test pipeline. To keep pressure and temperature stable during the test, the compressed air in the reservoir is adjusted in the primary pressure regulating valve up to 50 bar and stored in the temperature control loop. Compressed air passing through the temperature control loop is supplied to the test section with specific pressure regulation in the secondary pressure regulating valve.
To measure the surface pressure on the inner wall of pipe downstream of the critical nozzle, an experiment was conducted by installing a second pressure control valve and a critical nozzle to the straight pipe of length 50D after the U-band. The dynamic pressure sensor used for the pressure measurement was the 102B15 model from PCB Piezotronic with a resonance frequency of 500 kHz and a noise measurement sensitivity of 3.6 mV/kPa. The low-frequency response (−5%), which is a low-frequency characteristic, was 0.5 Hz, and the sensitivity was maintained at the same sensitivity throughout the frequency range of interest of this measurement. For accurate measurement of the AIV generated inside the pipe without any interference, the sensor was installed in the form of flush mounting as shown in Figure 3, which shows a sensor installed inside the pipe to measure the AIV of the critical nozzle. It was equipped with a pressure and temperature sensor to measure the reference flow rate in the pipe according to ISO 9300. A dynamic pressure sensor was installed at the position of 2D and 4D downstream of the critical nozzle. Each dynamic pressure sensor was first installed in the jig which was manufactured for the easy installation on the pipe. The AIV signal detected through the dynamic pressure sensor was recorded by the Digitizer (NI PXI 5922) through the PCB conditioner Model 482C05. The PXI 5922 can record up to 10 M signals per second at a resolution of 18 bits using two-channel simultaneously and was installed on the NI PXI 1033-Chassis and connected to the personal computer (PC) via an Express card, which runs through the LabVIEW program. Signal acquisition was made at the sampling rate of 50 kHz, and the acquired sample size was 500,000. The related measurement devices are shown in Figure 4.

4. Results and Discussion

In this section, the numerical simulation results together with the experimental results are presented. First, the validity of steady numerical solvers was confirmed by comparing the mass flow rate obtained from the compressible RANS simulations of the axisymmetric critical nozzle with the measured ones. Then, the compressible steady-state RANS simulation was performed on the 3D critical nozzle, and the unsteady compressible LES was performed using the RANS results as an initial condition. The validity of the LES was confirmed by comparing the predicted surface pressure fluctuations with the measured ones. Finally, the wavenumber-frequency analysis was carried out and the acoustic power due to the critical nozzle flow was assessed.

4.1. Two-Dimensional Axisymmetric Steady Simulation

The compressible RANS simulation was performed for a two-dimensional axisymmetric critical nozzle and the accuracy of the simulation was verified through the comparison of the predicted mass flow rate with measured data. The critical nozzle targeted is the toroidal-throat Venturi nozzle as specified in ISO 9300. Its geometry and the numerical mesh with the specified boundary conditions are shown in Figure 5.
The simulations were carried out for the two types of nozzle of which the throat diameter was 0.4 mm and 0.56 mm, respectively. The inlet and outlet pressure were specified on the inlet and outlet boundaries, respectively, the adiabatic and no-slip wall conditions were set on the wall, and the axisymmetric condition was applied along the centerline axis of the venturi nozzle. The grids were constructed by using a structured grid system, and y+ was set to be around five, and the total number of grids was 350 × 100. The efficiency of the critical nozzle can be determined by observing the variation of mass flow rate according to the change of pressure difference between the inlet and the outlet. In this study, the pressure of the outlet was varied to control the pressure difference between the inlet and outlet of the nozzles. The applied inlet and outlet pressure conditions are shown in Table 1 [16].
Figure 6 shows the predicted iso-contours of the Mach number inside the nozzles of d = 0.4 m at the pressure ratio of 0.666 and d = 0.56 m at the pressure ratio of 0.778. It is seen that shock waves are generated around the throat in both cases, which implies that the choked flow appears. Figure 7 compares the predicted ones with the measured data in terms of the variation of the non-dimensional mass flow rate according to the pressure ratio between the inlet and outlet. The x-axis represents the ratio of the outlet static pressure to the total inlet pressure, and the y-axis represents the ratio of the mass flow rate(qm) to the mass flow rate(qm, ref) when the outlet pressure is equal to the atmospheric pressure. In the case of the nozzle flow, as the pressure difference between the inlet and outlet becomes larger, the flow is more accelerated up to the nozzle throat and the mass flow rate increases. However, when the outlet pressure becomes equal to or less than the critical pressure at which the chocked flow starts to form, the Mach number in the throat reaches one and does not exceed one anymore, and thus the mass flow rate is kept constant. In Figure 6, because the outlet pressure in both nozzles is lower than the critical pressure, the Mach number is one in the nozzle throat. Then the flow is accelerated to supersonic in the diffusion region through the nozzle throat, and shock waves are generated. This phenomenon corresponds to a typical process for creating a supersonic flow in an internal flow. In Figure 7, it can be seen that the mass flow rate through the nozzle increases as the outlet pressure decreases to the critical pressure. As the pressure ratio is lower than the critical ratio, the choked flow occurs and the mass flow rate is kept constant. The numerical results are in excellent agreement with the experimental results [16].

4.2. Three-Dimensional Steady Simulation

In the pipe system used in the offshore plant, high-temperature and high-pressure gas is transferred, and a pressure relief valve is used to prevent damage to the pipe which may be caused by strong pressure waves. However, the sudden pressure variation in the pressure relief valve emits high acoustic energy in the downstream direction of the pipe. To simulate this sudden pressure variation, the numerical simulations using the prescribed numerical methods were performed on the three-dimensional critical nozzle as shown in Figure 8. The computation grids are shown in Figure 9, and the boundary conditions were set to be the same as those used in the preceding two-dimensional axisymmetric problem. The grids used for the flow simulation were structured grids, the number of grids was 6,470,000, and the diameter of the nozzle throat was 8.5 mm. The overall grid quality was confirmed using the commercial grid generation tool ICEM CFD and the grid quality index was greater than 0.61, which confirms the good quality of the grids. In addition, y+ based on the inflow condition was kept below 1. To construct the initial condition for the unsteady LES, three-dimensional steady-state compressible RANS simulation was performed beforehand. Figure 10 presents the numerical results of pressure and temperature distributions inside the pipe and the nozzle. It can be seen that the shock wave is formed inside the critical nozzle due to the high pressure difference in the pipe inlet and outlet, and the sudden pressure variation occurs before and after the shock wave. The shock inside the nozzle meets the boundary layer of the wall surface and the boundary layer separation occurs at this location. This complex interaction generates a strong coherent turbulent flow which in turn causes intense aerodynamic noise. The corresponding unsteady phenomena can be identified in Figure 11, which is discussed in detail in the next section. The similar phenomenon was also observed and discussed in the preceding study by Kim et al. [8].

4.3. Three-Dimensional Unsteady Simulation

LES is preferred for high accuracy unsteady simulation but requires many grids and a long simulation time. Also, it requires proper initial conditions for stable numerical simulation. Therefore, three-dimensional unsteady LES was performed with the initial condition of the preceding RANS simulation results. The total number of the grid was the same as the RANS simulation. The simulation time interval was set to be 5 × 10⁻⁵ s. Figure 11 shows the iso-contours of pressure and vorticity magnitudes in the zoomed plot as well as in the entire computational domain. It can be found that a sudden pressure drop occurs at the nozzle throat, and strong vortices are formed downstream just behind the throat, which causes a large amount of fluctuating turbulent disturbance components to be convected in the downstream direction of the pipe. This turbulent disturbance generated acoustic pressure inside the pipe.
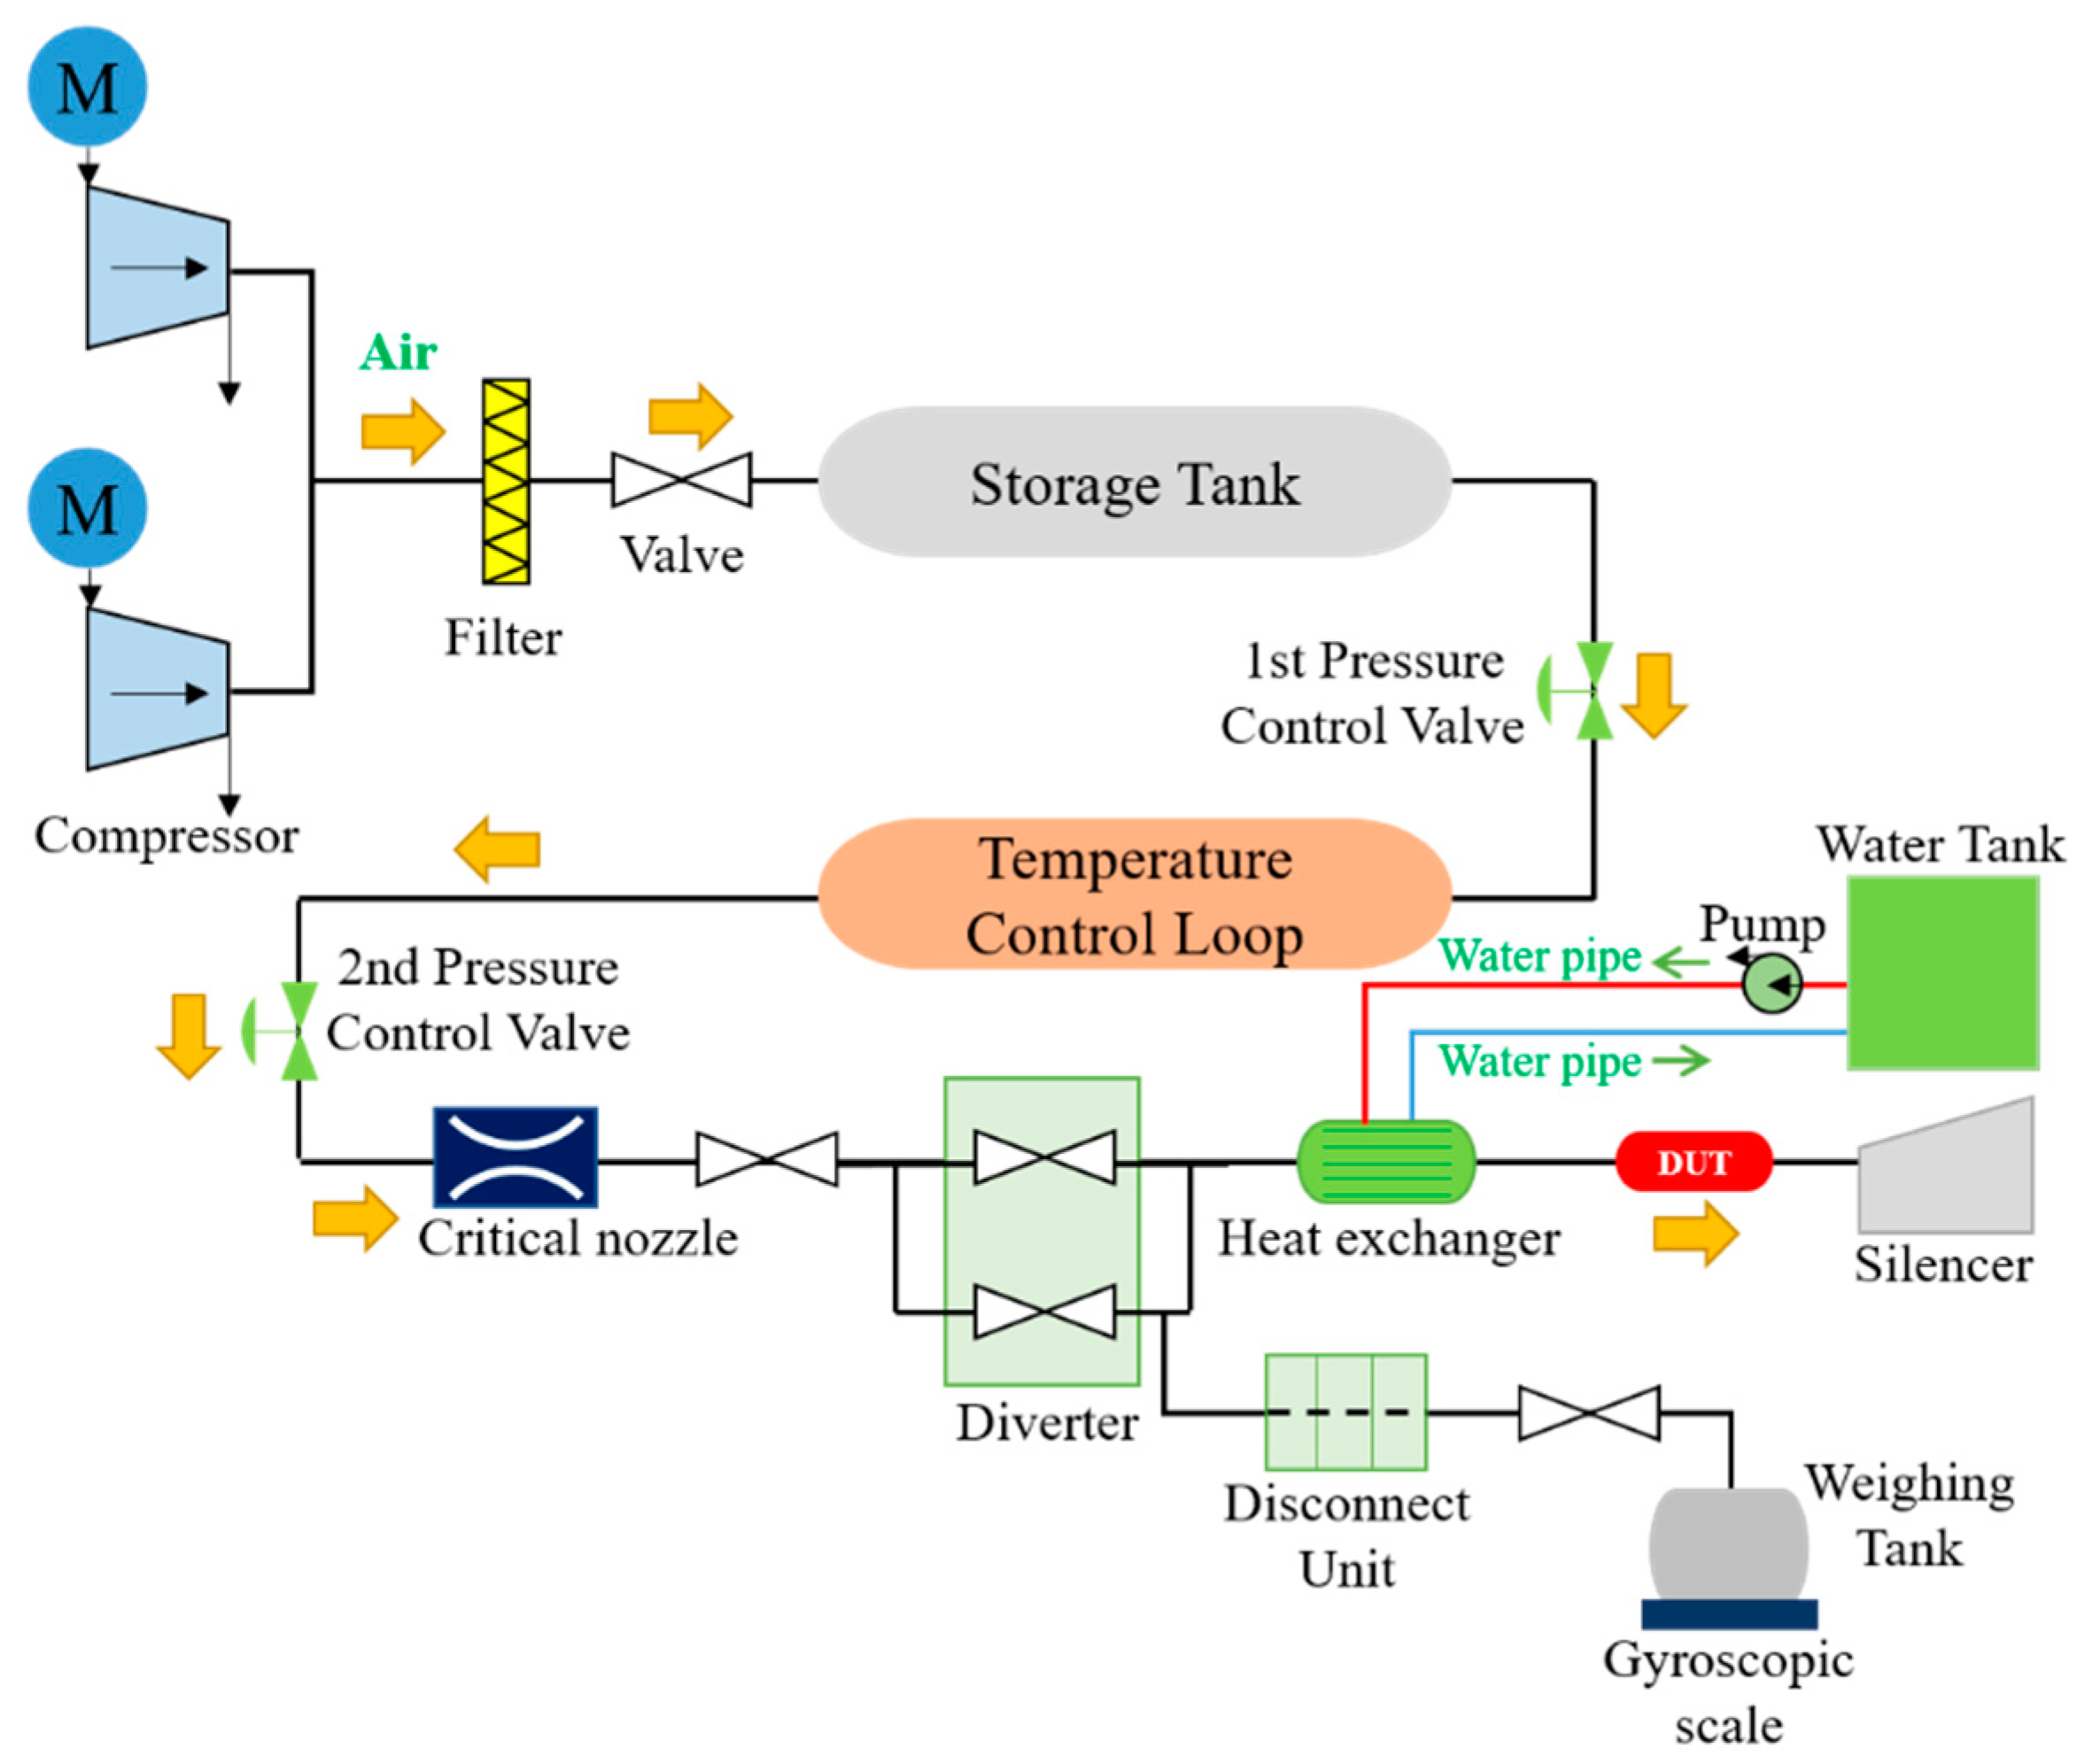
In the ISO 9300 standards, it is required to measure the pressure at the positions 2D and 4D downstream away from the end of the critical nozzle, where D is the pipe diameter. The pressure fluctuations at the same locations denoted as Sensor 1 and Sensor 2 in Figure 3 and Figure 11 are measured using the experimental setup described in Section 3. The experimental devices and methods follow the ISO 9300 and the experimental conditions are the same as the simulation conditions.
Figure 12 compares the 1/3 octave band spectrum of pressure between the measured and the predicted ones at each sensor position. There is good agreement between two results at the position of Sensor 2 while there is a relatively large discrepancy between two results at the position of Sensor 1 where the numerical results over-predict in comparison with the measured data. This seems to be due to the fact that the Sensor 1 is located in the region where the strong vortex is observed in the simulation while the location of Sensor 2 is far enough away from the strong turbulence region. However, the predicted pressure levels at both locations become much lower than the measured one in the high-frequency region above 2000 Hz, which seems to be due to poor resolution of the grids in the corresponding frequency range. More precise numerical simulations can be performed by using more resolved grids and fewer time intervals but at a much more expensive numerical cost. Since the AIV phenomenon is known to occur in the frequency range of 500 Hz to 2000 Hz, the current numerical resolution was determined to be sufficient for that purpose.

4.4. Wavenumber-Frequency Analysis

Based on the unsteady LES results, the wavenumber-frequency analysis was performed by using the Fourier transform in the cylindrical coordinate system as described in Section 2.4 with the in-house code, of which the validity was confirmed in the previous studies [8,13]. The acoustic power caused by the sudden pressure variation inside the nozzle provides the source of the AIV of the pipe wall. Therefore, for more precise assessment of AIV problems, it is necessary to extract the acoustic wave components propagating in the downstream direction from the fluctuating pressure field in the pipe. Therefore, the pressure extraction area is selected to include the prescribed monitoring position as shown in Figure 13.
The simulation time interval and the frequency interval used for the wavenumber-frequency analysis were 5 × 10⁻⁵ s and 3.23 Hz, respectively, and the grid spacing was (Δθ, Δz) = (2.5°, 0.0015 m). The average speed of sound and Mach number in each region were 343 m/s, 0.064 in Region 1 and 0.011 in Region 2. The results of the wavenumber-frequency analysis are shown in Figure 14.
In Figure 14, the black lines represent the modal cut-off lines in the pipe, and the circumferential direction mode is represented by m and the radial direction mode is represented by n. The dashed line at the right bottom represents the wave components propagating at the constant speed V = 21.91 m/s in Region 1 and V = 3.87 m/s in Region 2, which is the incompressible pressure components convected at the mean flow velocity in the downstream direction and associated with turbulence fluctuation acting as an aerodynamic noise source. Since the acoustic wave generated by the aerodynamic noise sources propagates at the speed of sound, the compressible pressure fluctuation (plane wave components in the pipe) propagates in the downstream direction at the speed of c + u 0 , which is the sum of the sound velocity and the flow velocity, and at the speed of c u 0 in the upstream direction. In the case of other non-planar waves, the phase speed is higher than c u 0 and c + u 0 in the upstream and downstream directions, respectively. Therefore, the pressure wave components located in the region between the two lines of which the phase speed is c u 0 and c + u 0 denotes those propagating at a speed higher than the speed of sound and thus are compressible acoustic components. The cut-off line for each duct mode can be defined as Equation (10) and is depicted as a curve in Figure 14. In the case of the incompressible pressure fluctuation, the components propagating at the average mean flow velocity are not clearly visible, which is different from the results shown in the study by Kim et al. [8]. The reason for this is because the vortices of various sizes are formed and propagate at various speeds due to an abrupt change in the cross-sectional area between the nozzle and the downstream pipe. In the case of the compressible pressure fluctuation component, it can be seen that the spectral density is prominently distributed in the vicinity of the cut-off line of each mode and becomes gradually weaker as the order becomes higher. As mentioned above, the predicted pressure level assures up to 2000 Hz, and high grid resolution is required for higher frequency range. Therefore, the high-frequency components above 2000 Hz are rapidly attenuated.
The application of inverse wavenumber-frequency transform on the region of wavenumber-frequency diagram including only the compressible pressure fluctuations leads to the acoustic power spectral density, eliminating the incompressible pressure fluctuations.
The acoustic power spectrum of the internal aerodynamic noise obtained in this way is shown in Figure 15. It shows the power spectrum of three components: the incompressible pressure fluctuation part due to turbulence fluctuation, the compressible pressure fluctuation part due to acoustic waves, and the total pressure fluctuation including the incompressible and compressible parts. From the spectrum and overall values of all parts, the power level in Region 1, which is the region more upstream, is greater than in Region 2. The influence of the incompressible part due to flow is dominant in the low frequency region below 1000 Hz, but the influence of the compressible part due to the acoustic wave is dominant in the region of 1000 Hz to 2000 Hz. However, in the higher frequency range, it is rapidly dissipated due to poor time and spatial resolution. It can be seen that the incompressible part becomes weaker from Region 1 to Region 2 because the vortex rapidly dissipates as shown in Figure 11b.
For the incompressible part related to the turbulence fluctuation, during the convection of vortical waves downstream, its energy is transferred to smaller-scale eddies oscillating with the high frequency, that is so-called energy cascade phenomena occurring in the inertial subrange. The decay rate of its spectrum is known to follow the −5/3 power law. The even smaller eddy scale, known as the Kolmogorov Scale, belongs to the dissipation range where energy is dissipated due to heat or sound, and is known to follow the −7 power law [17]. It can be found from Figure 15 that, in both Region 1 and Region 2, the inertial subrange exists in the region between 100 Hz and 1000 Hz, and a dissipation range exists in the frequency region higher than 1000 Hz. Especially in Region 1, where larger coherent turbulent fluctuations exist and are followed by its energy cascade phenomena, the inertial subrange and dissipation range are more prominent and distinct. Note that the decay rate of the spectrum in the frequency range higher than around 2000 Hz to 3000 Hz is due to numerical damping. The good agreement of the decay rate of the predicted spectrum confirm the validity of the LES simulation and the wavenumber-frequency analysis. It is noteworthy that the magnitude of compressible components is higher than that of incompressible ones in the frequency range belonging to the dissipation rage. This fact ensures that the energy of turbulent fluctuations is transferred to the compressible acoustic waves in the dissipation range. It can be also seen from the overall power level that both incompressible and compressible components are attenuated downstream, but the incompressible part is further reduced compared to the compressible part due to more rapid dissipation of the vortex.
Overall, these results show that the current numerical methods predict the acoustic power due to the valve flow in a pipe more precisely than the existing ones relying on the quasi-empirical equations by Carucci and Muller, considering more complex geometry and conditions.

5. Conclusions

In this study, a high-fidelity numerical procedure is proposed to assess the acoustic power generated by pressure relief devices in a pipe. The method consists of three sequential steps: high accuracy large eddy simulation, wavenumber-frequency transform, and duct acoustic theory. The toroidal-throat venturi nozzle specified in ISO 9300 was selected as a target pressure relief device, and the numerical simulations were performed using the computational fluid dynamics technique to predict the flow through the critical nozzle. To verify the accuracy of the numerical method, the mass flow rates through the two types of nozzles were computed by varying the outlet pressure. It was confirmed that the numerical results were in excellent agreement with the experiment. Then, a high accuracy LES technique was performed on the three-dimensional critical nozzle, and the steady-state RANS result was used as the initial condition to obtain more stable and faster convergence. The validity of the unsteady LES results was also confirmed by comparing them with measured surface pressure data. The wavenumber-frequency transform was taken on the LES results, and the compressible surface pressure components matching the acoustical duct modes were identified in the wavenumber-frequency pressure diagram. The inverse wavenumber-frequency transform taken on the compressible pressure components leads to the acoustic power spectrum. The estimated total acoustic powers are 128.3 dB and 125.1 dB for two regions, respectively. However, the incompressible part is further reduced compared to the compressible part due to the rapid dissipation of vortex. These results reveal that the current numerical procedure can be used to more accurately predict the acoustic power generated by the pressure relief device in a piping system.

Author Contributions

C.C. provided the basic idea for this study and the overall numerical strategies. G.K. carried out the numerical simulations and worked on the analysis of numerical results. S.L. developed the code of wavenumber-frequency analysis. W.K. and K.K. constructed the experimental environment and conducted the experiments.

Funding

This research was funded by the Ministry of Education, grand number NRF-2016R1D1A1A099 18456.

Acknowledgments

This research was supported by the Basic Science Research Program through the National Research Foundation of South Korea (NRF), funded by the Ministry of Education (NRF-2016R1D1A1A099 18456).

Conflicts of Interest

The authors declare no conflict of interest.

References

  1. Cowling, J. Acoustic and Turbulence Flow Induced Vibration in Piping Systems: A Real Problem for LNG Facilities; Perth Convention and Exhibition Centre: Houston, TX, USA, 2016. [Google Scholar]
  2. Carucci, V.A.; Mueller, R.T. Acoustically Induced Piping Vibration in High Capacity Pressure Reducing Systems; ASME 82-WA/PVP-8; The American Society of Mechanical Engineerings: New York, NY, USA, 1982. [Google Scholar]
  3. Eisinger, F.L. Designing piping systems against acoustically induced structural fatigue. J. Press. Vessel Technol. 1997, 119, 379–383. [Google Scholar] [CrossRef]
  4. Eisinger, F.L.; Joseph, T.F. Acoustically induced structural fatigue of piping systems. J. Press. Vessel Technol. 1999, 121, 438–443. [Google Scholar] [CrossRef]
  5. Veritas, D.N. L-002 Piping System Layout, Design and Structural Analysis, 3rd ed.; NORSOK Standard: Lysaker, Norway, 2009. [Google Scholar]
  6. Bruce, R.D.; Bommer, A.S.; LePage, T.E. Solving acoustic-induced vibration problems in the design stage. Sound Vib. 2013, 47, 8–11. [Google Scholar]
  7. Agar, M.; Ancian, L. Acoustic-induced vibration: A new methodology for improved piping design practice. In Proceedings of the Offshore Technology Conference Asia, Kuala Lumpur, Malaysia, 22–25 March 2016. [Google Scholar]
  8. Kim, K.; Ku, G.; Lee, S.; Park, S.; Cheong, C. Wavenumber-Frequency Analysis of Internal Aerodynamic Noise in Constriction-Expansion Pipe. Appl. Sci. 2017, 7, 1137. [Google Scholar] [CrossRef]
  9. American National Standards Institute. Measurement of Gas Flow by Means of Critical Flow Venturi Nozzles; Dansk standard DS/EN ISO 9300; American National Standards Institute: New York, NY, USA, 1987. [Google Scholar]
  10. Johansen, S.T.; Wu, J.; Shyy, W. Filter-based unsteady RANS computations. Int. J. Heat Fluid Flow 2004, 25, 10–21. [Google Scholar] [CrossRef]
  11. Myong, H.K. Chapter 6: Turbulence and Turbulence model. In Computational Thermo-Fluid Dynamics; Munundang: Seoul, Korea, 2002; pp. 338–373. [Google Scholar]
  12. Hoffmann, K.A.; Chiang, S.T. Computational Fluid Dynamics Volume III, 4th ed.; Engineering Education System: Wichita, KS, USA, 1993. [Google Scholar]
  13. Lee, S.; Cheong, C. Decomposition of surface pressure fluctuations on vehicle side window into incompressible/compressible ones using wavenumber-frequency analysis. Korean Soc. Noise Vib. Eng. 2016, 26, 765–773. [Google Scholar] [CrossRef]
  14. Munjal, M.L. Chapter 1: Propagation of waves in ducts. In Acoustic of Ducts and Mufflers, 2nd ed.; John Wiley & Sons: Chichester, UK, 2014; pp. 2–20. [Google Scholar]
  15. Kang, W.; Lee, S.H.; Lee, S.J.; Ha, Y.C.; Jung, S.S. Effect of ultrasonic noise generated by pressure control valves on ultrasonic gas flowmeters. Flow Meas. Instrum. 2018, 60, 95–104. [Google Scholar] [CrossRef]
  16. Park, K.A.; Choi, Y.M.; Choi, H.M.; Cha, T.S.; Yoon, B.H. The evaluation of critical pressure ratios of sonic nozzles at low Reynolds numbers. Flow Meas. Instrum. 2001, 12, 37–41. [Google Scholar] [CrossRef]
  17. Bonelli, F.; Viggiano, A.; Magi, V. How does a high density ratio affect the near- and intermediate-field of high-Re hydrogen jets? Int. J. Hydrog. Energy 2016, 41, 15007–15025. [Google Scholar] [CrossRef]
Figure 1. Toroidal-throat Venturi nozzle specified by ISO 9300.
Applsci 09 02885 g001
Figure 2. High pressure gas flowrate standard system at Korea Research Institute of Standards and Science (KRISS).
Applsci 09 02885 g002
Figure 3. Experimental setup for acoustic induced vibration (AIV) measurement.
Applsci 09 02885 g003
Figure 4. AIV measurement system at KRISS.
Applsci 09 02885 g004
Figure 5. The geometry of the toroidal-throat Venturi nozzle and the computational grids with boundary conditions applied for axisymmetric Reynold-Averaged Navier–Stokes (RANS) simulation.
Applsci 09 02885 g005
Figure 6. Mach number contours; (a) d = 0.4 mm, nozzle pressure ratio (NPR) = 0.666; (b) d = 0.56 mm, nozzle pressure ratio (NPR) = 0.778.
Applsci 09 02885 g006
Figure 7. Mass flow rate according to variation of exit pressure; left: d = 0.4 mm; right: d = 0.56 mm.
Applsci 09 02885 g007
Figure 8. Three-dimensional geometry of pipe with critical nozzle.
Applsci 09 02885 g008
Figure 9. Entire computational domain, numerical meshes, and boundary conditions.
Applsci 09 02885 g009
Figure 10. Steady RANS results: (top) static pressure (Pa) and (bottom) temperature (K).
Applsci 09 02885 g010
Figure 11. Unsteady Large Eddy Simulation (LES) results; (a) static pressure (Pa); (b) vorticity magnitude.
Applsci 09 02885 g011
Figure 12. Total pressure level; (a) Sensor 1, (b) Sensor 2.
Applsci 09 02885 g012
Figure 13. Acoustic pressure region.
Applsci 09 02885 g013
Figure 14. Wavenumber-frequency analysis result; (a) Region 1, (b) Region 2. n = the radial direction mode; m = the circumferential direction mode.
Applsci 09 02885 g014
Figure 15. Overall acoustic power level (OAPWL); (left) Region 1, (right) Region 2.
Applsci 09 02885 g015
Table 1. Pressure ratio of outlet pressure ( P b ) to inlet pressure ( P 0 ).
Pressure Ratio (Pb/P0)Pb (Pa)Pressure Ratio (Pb/P0)Pb (Pa)
0.954429,3000.954429,300
0.931418,9500.934420,300
0.887399,1500.911409,950
0.843379,3500.888399,600
0.798359,1000.844379,800
0.666299,7000.778350,100
(a) d = 0.4 mm(b) d = 0.56 mm

