Elevator Fault Detection Using Profile Extraction and Deep Autoencoder Feature Extraction for Acceleration and Magnetic Signals


Abstract
:1. Introduction
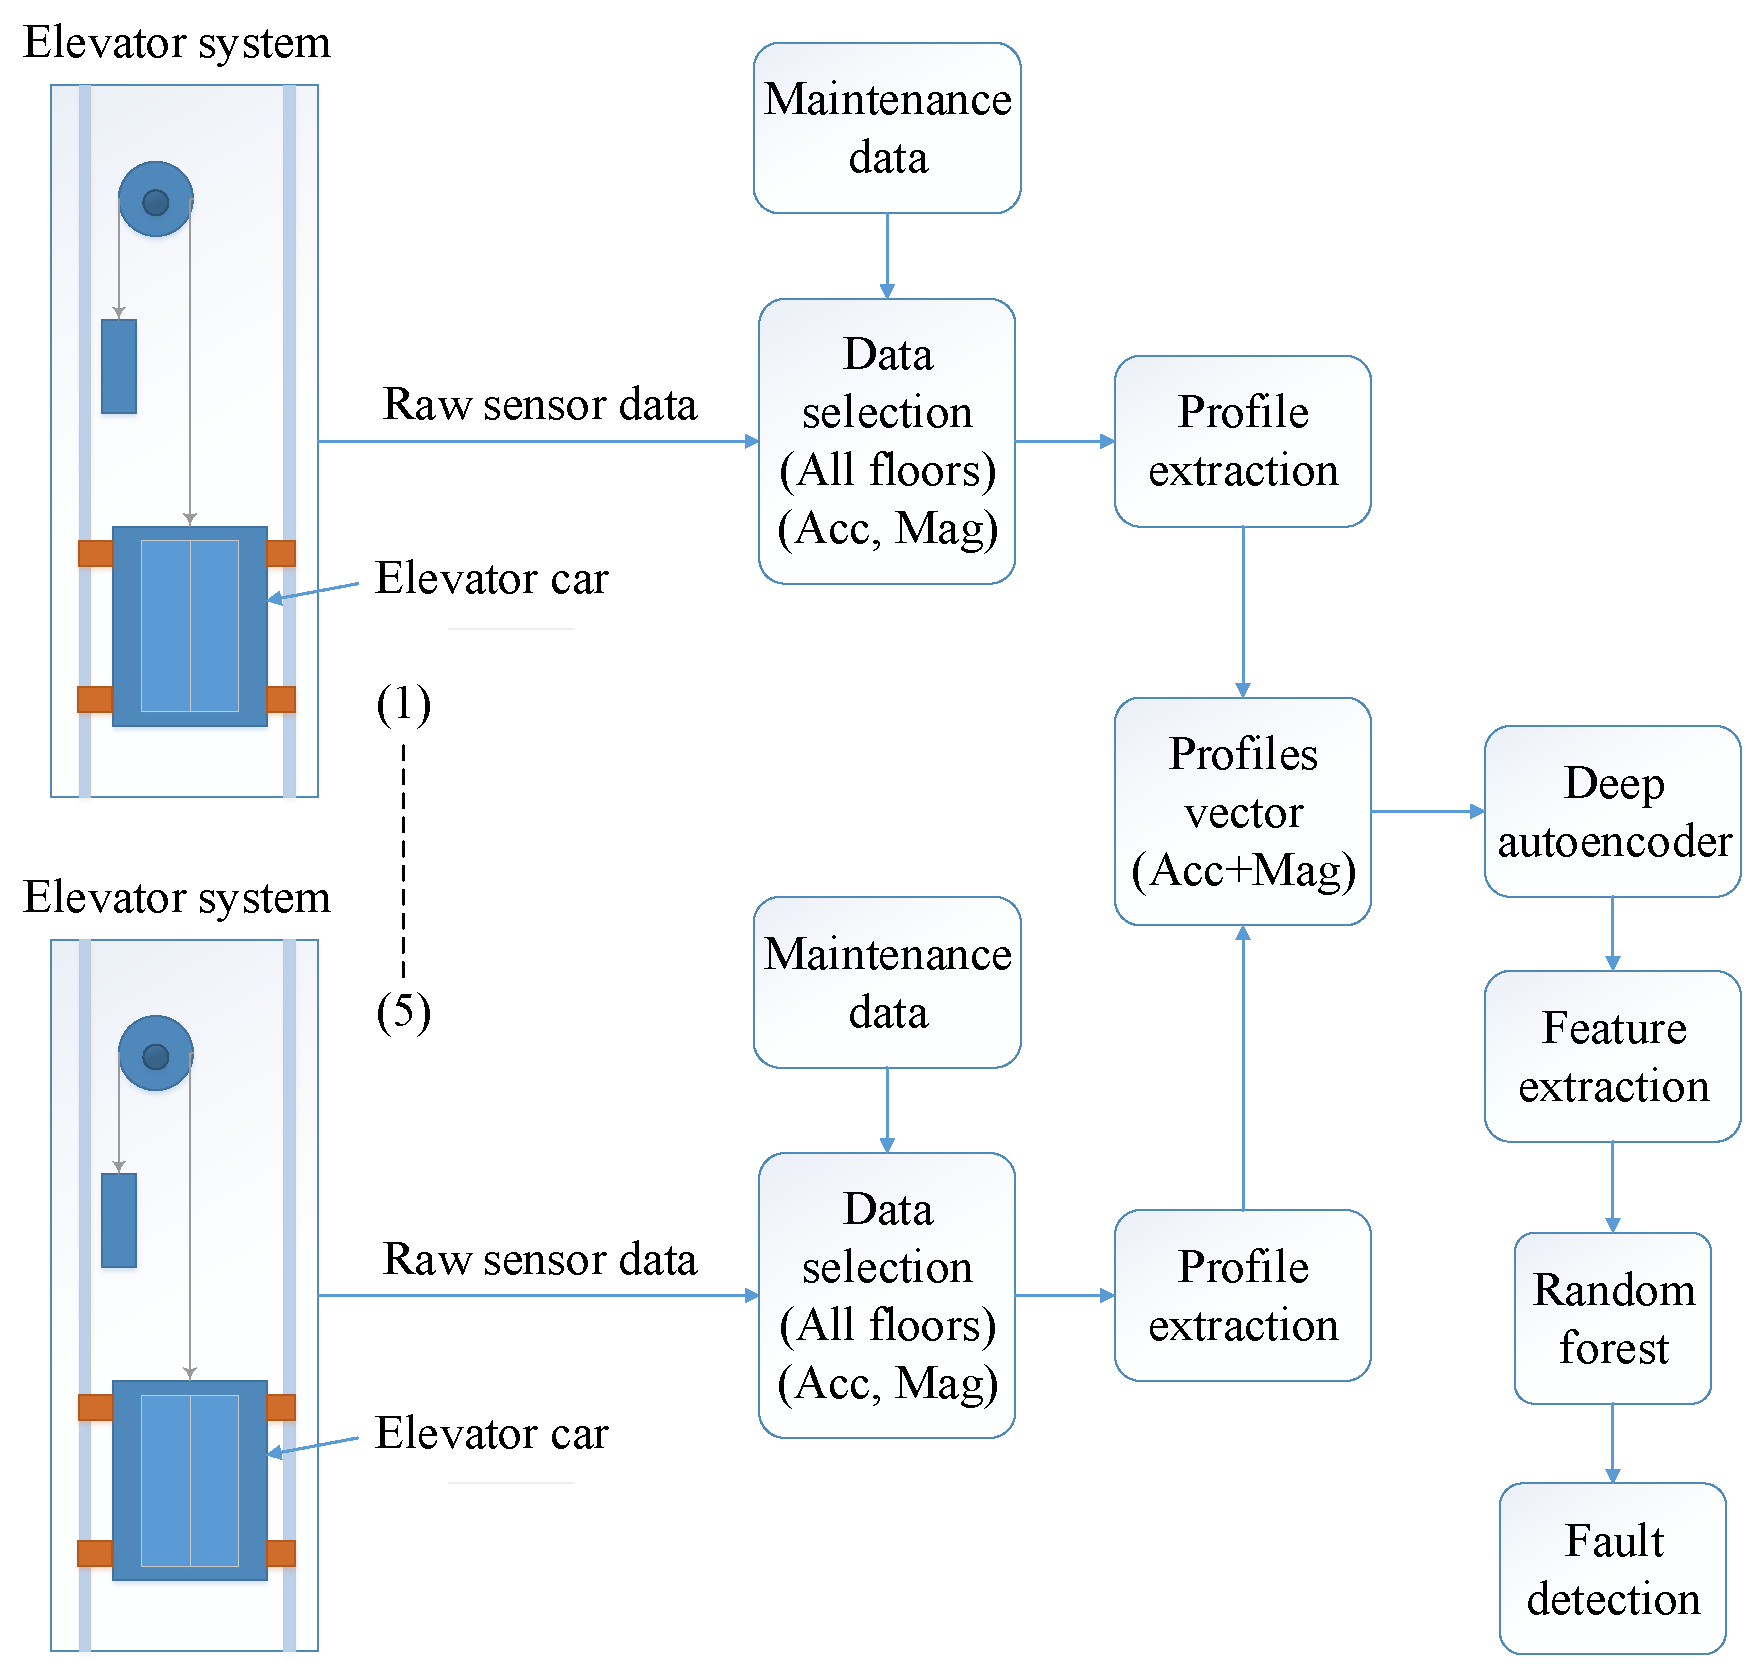
2. Methodology
2.1. Profile Extraction Algorithm
2.2. Deep Autoencoder
2.3. Random Forest
2.4. Evaluation Parameters
3. Results and Discussion
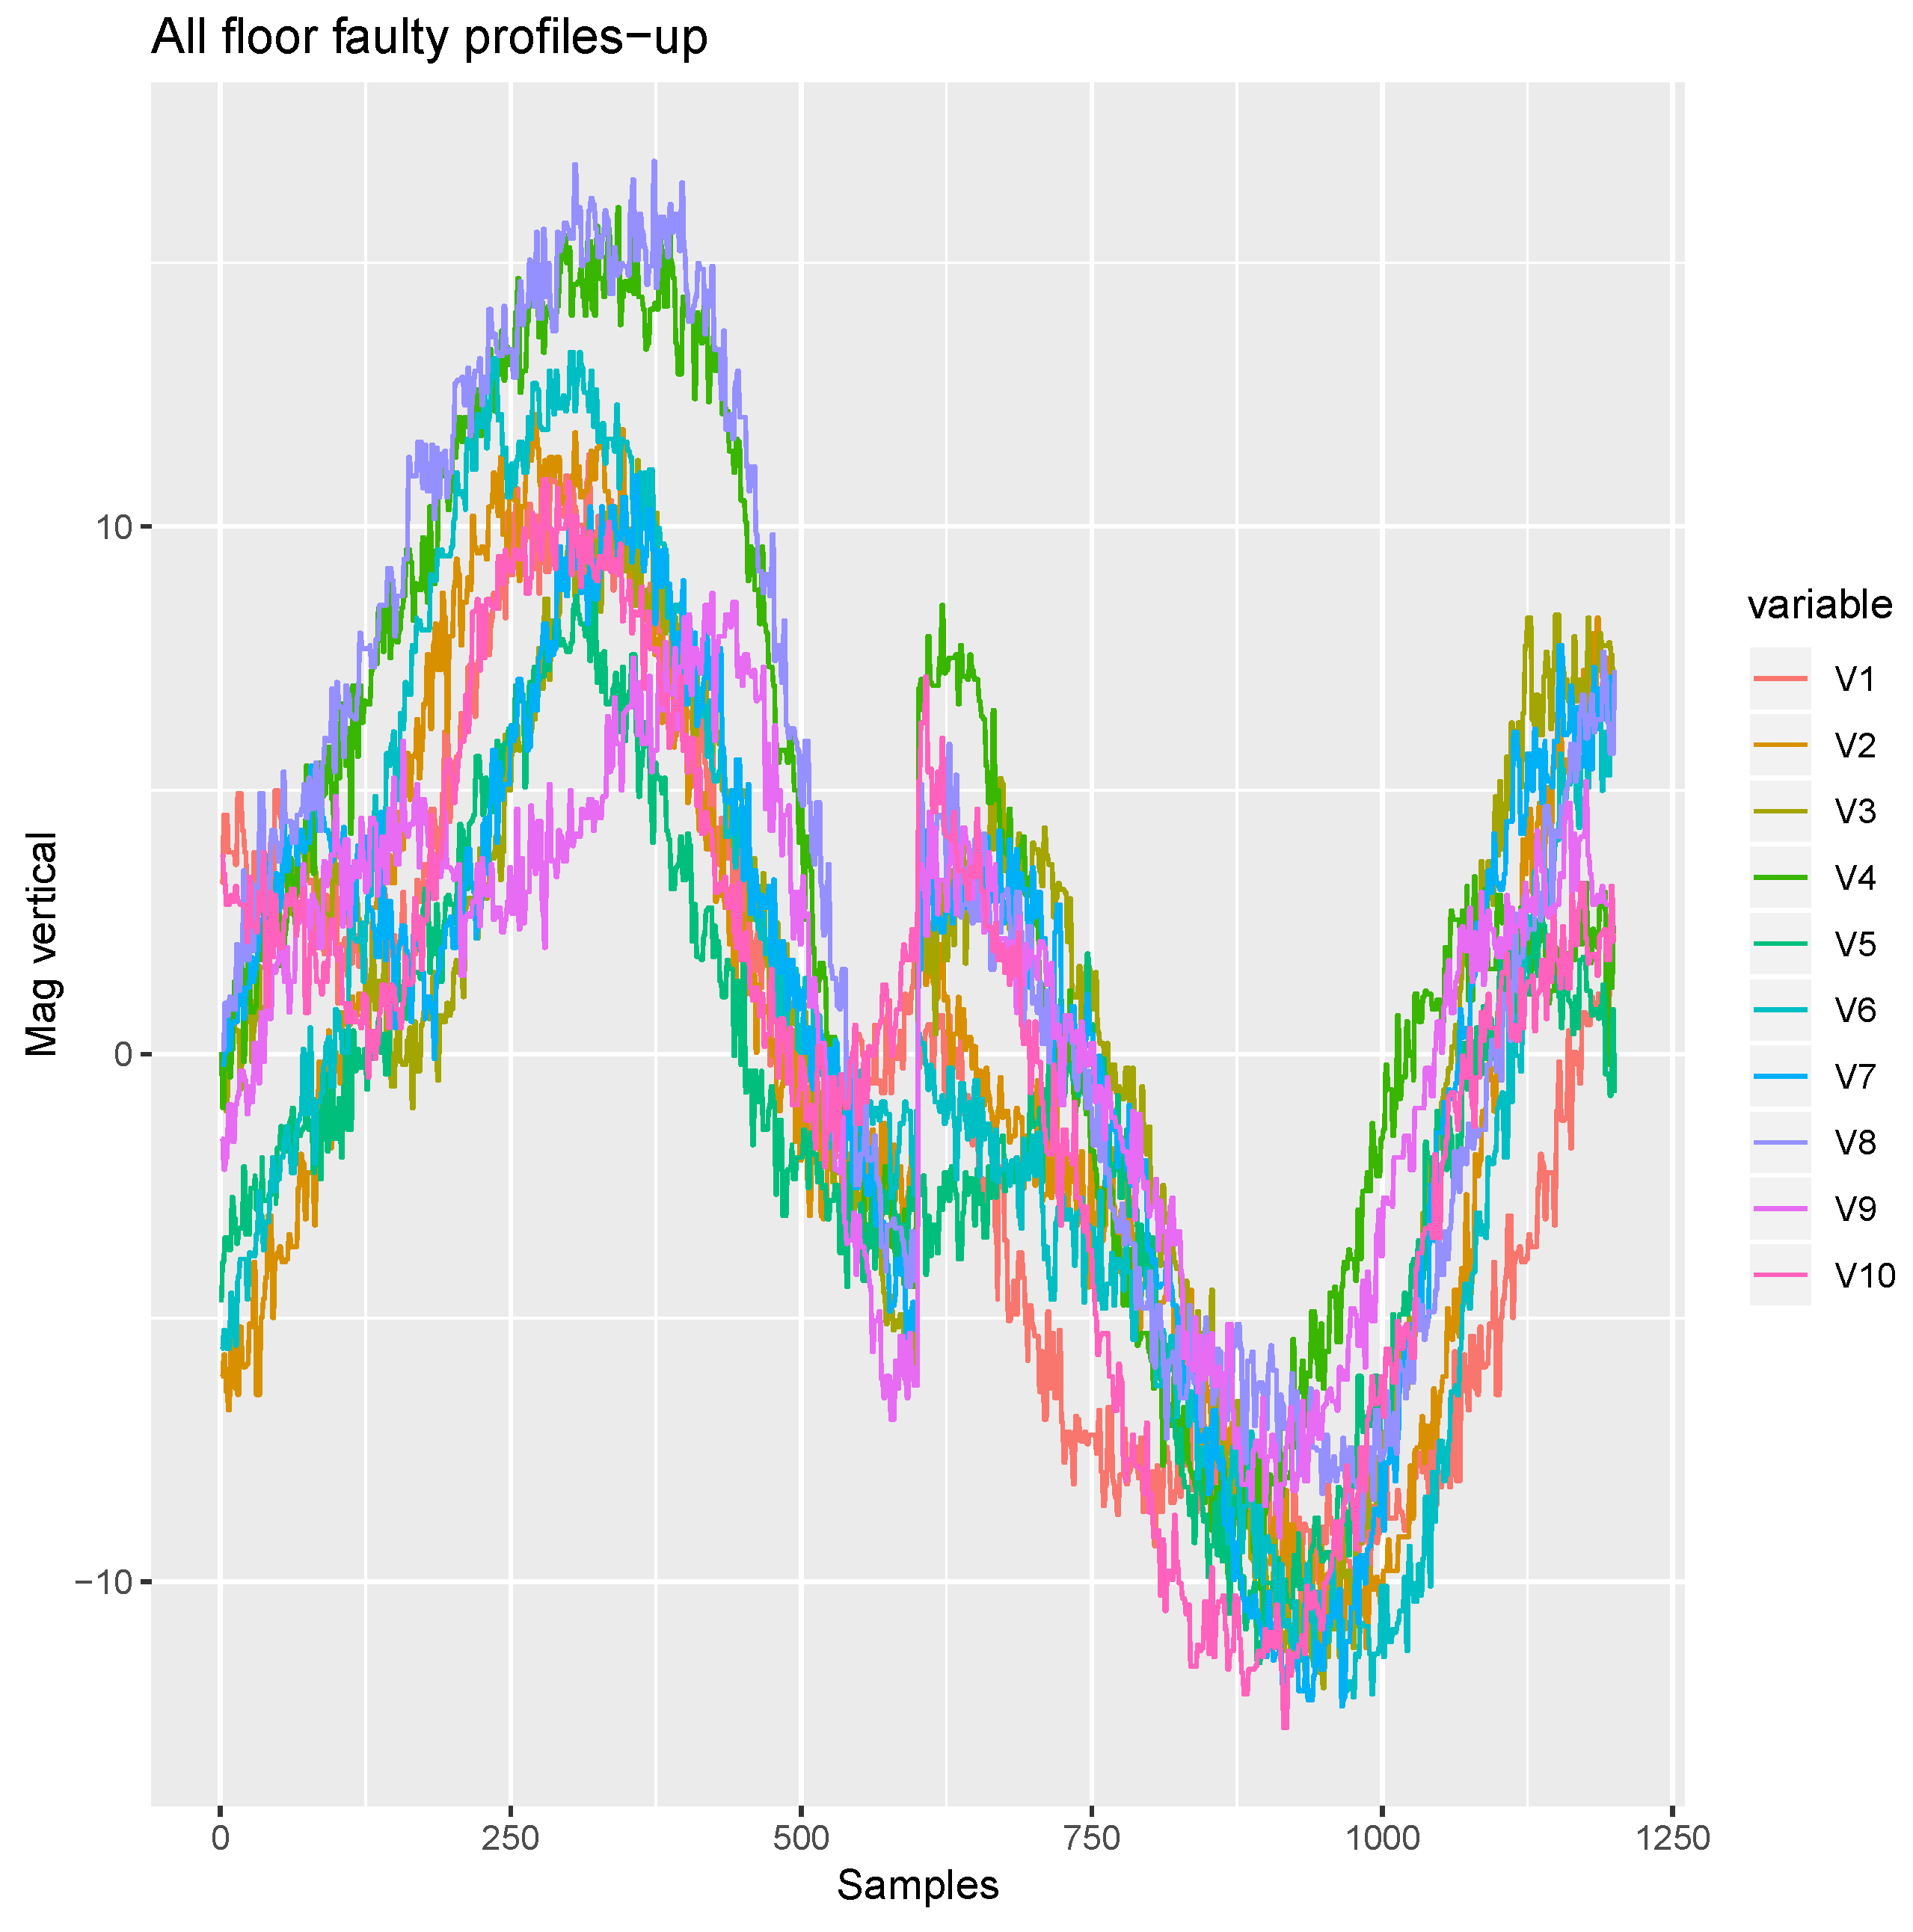
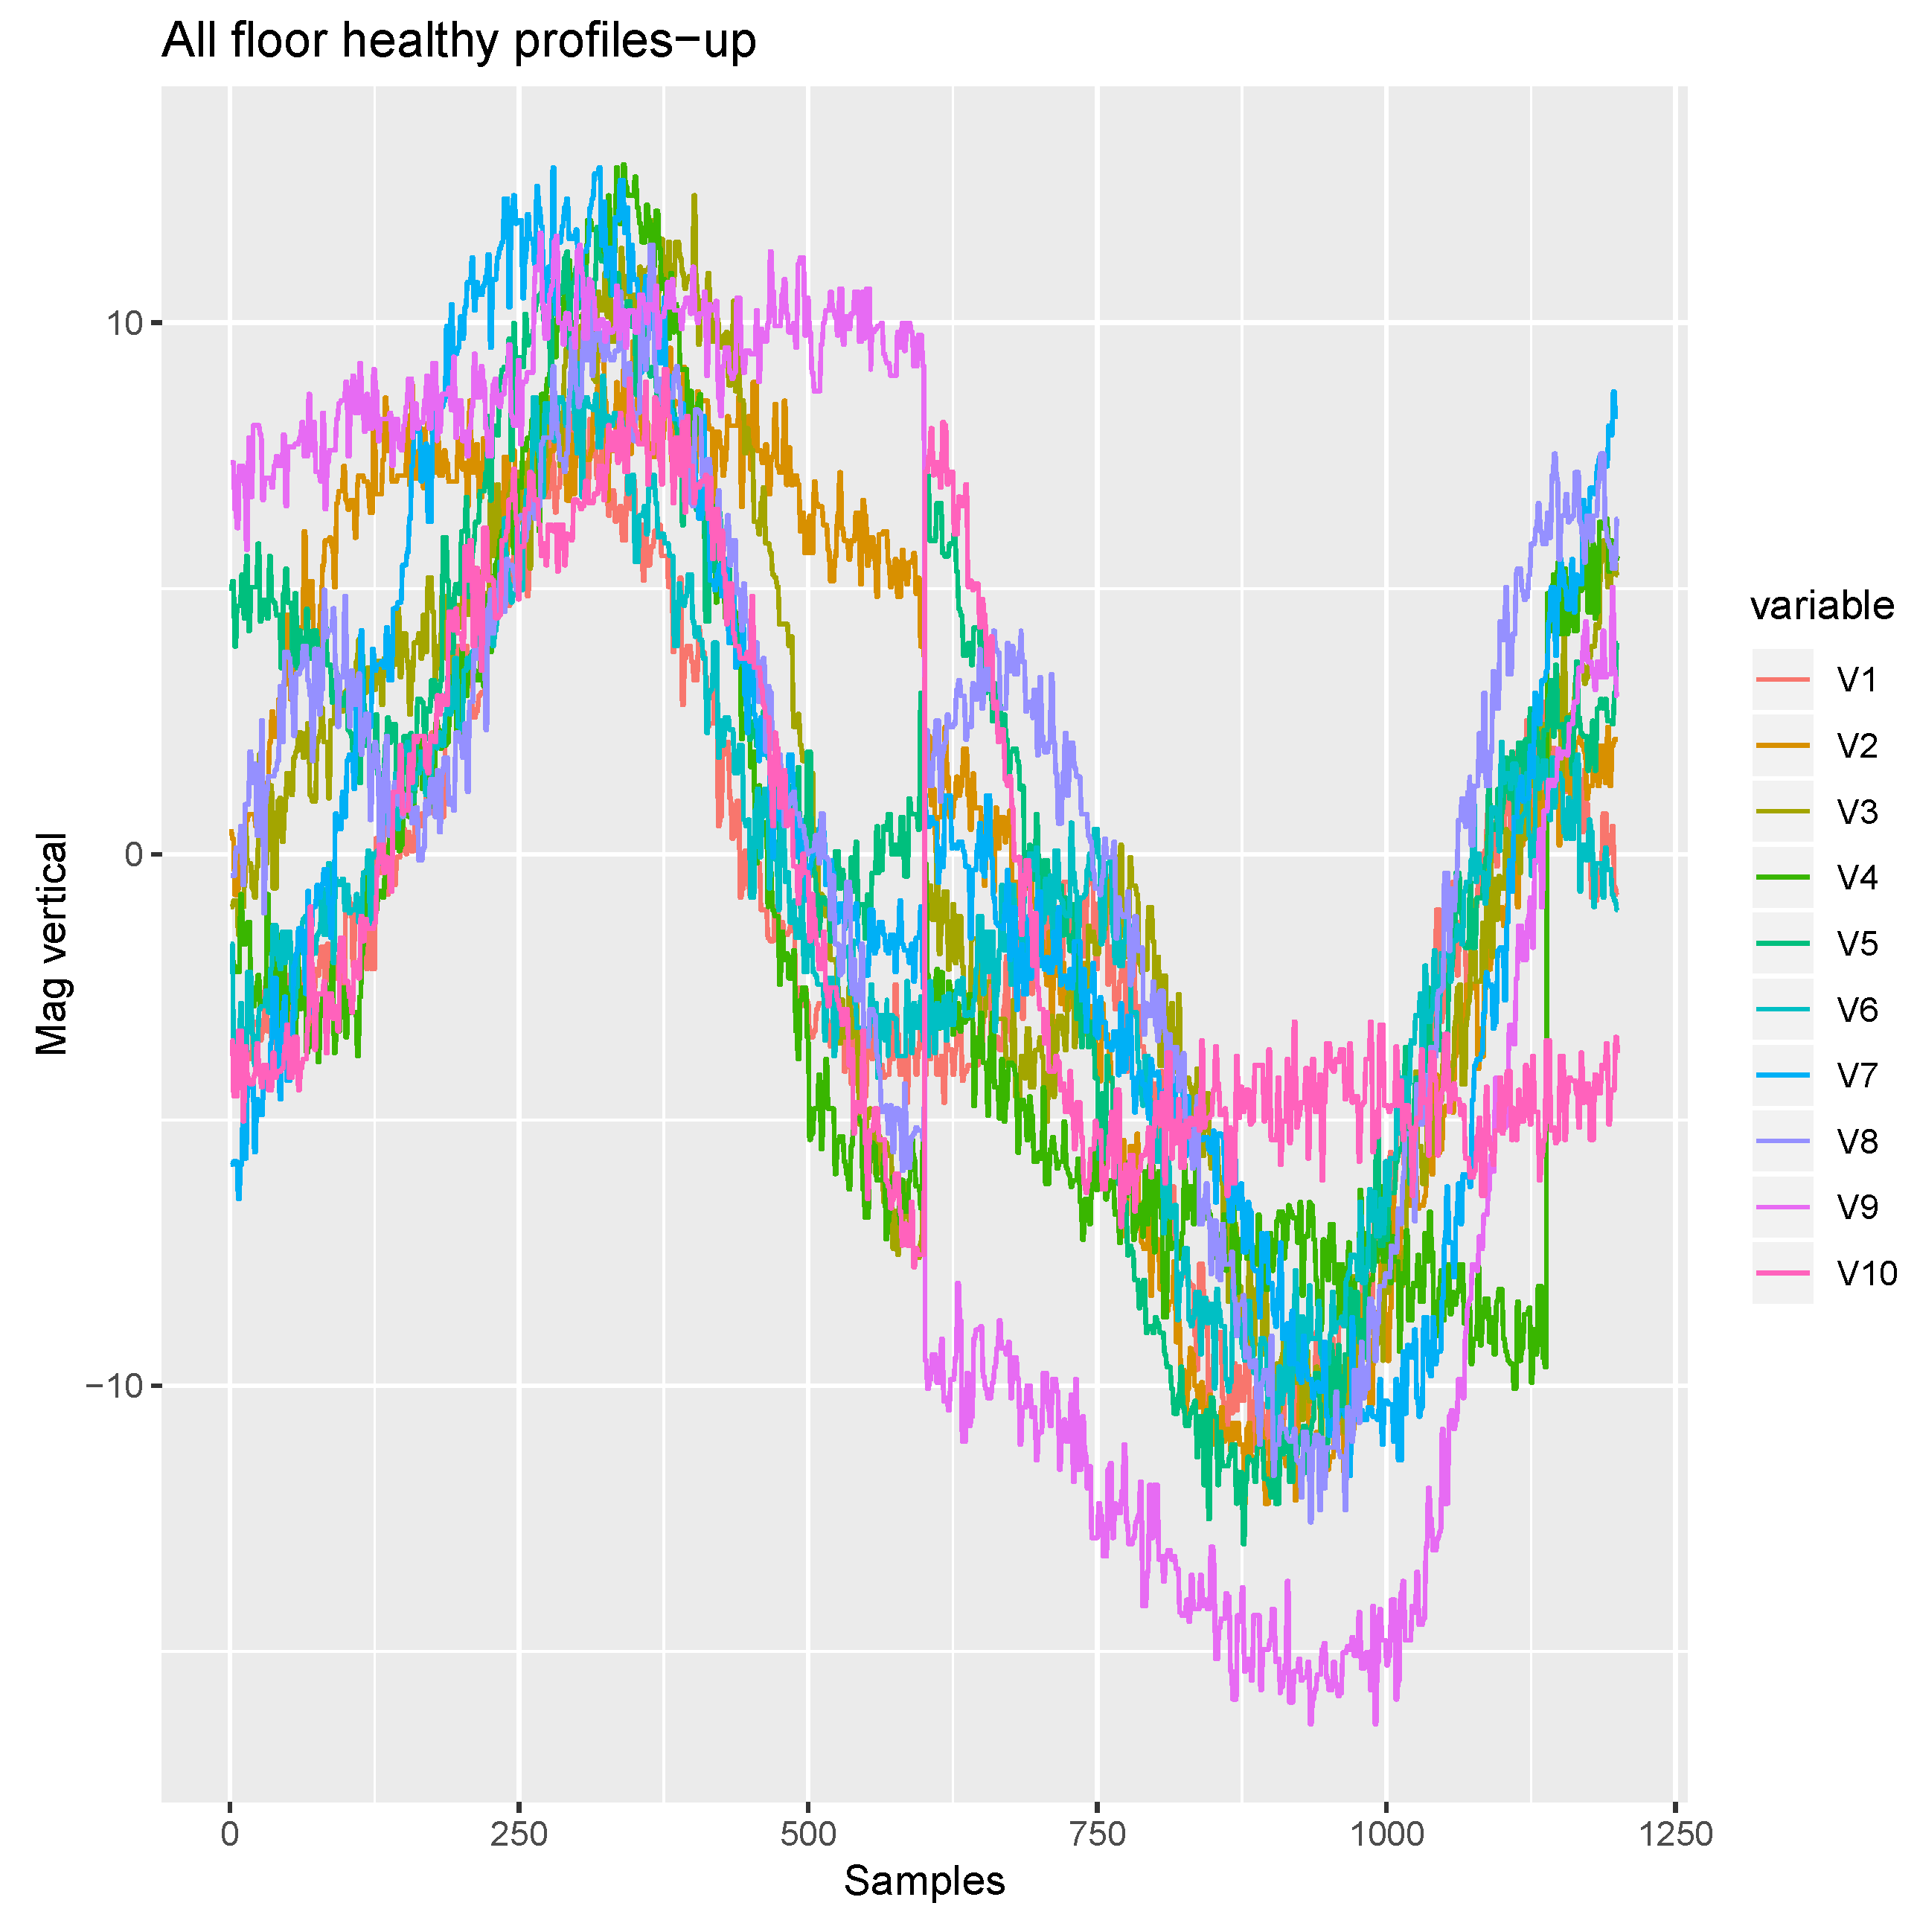
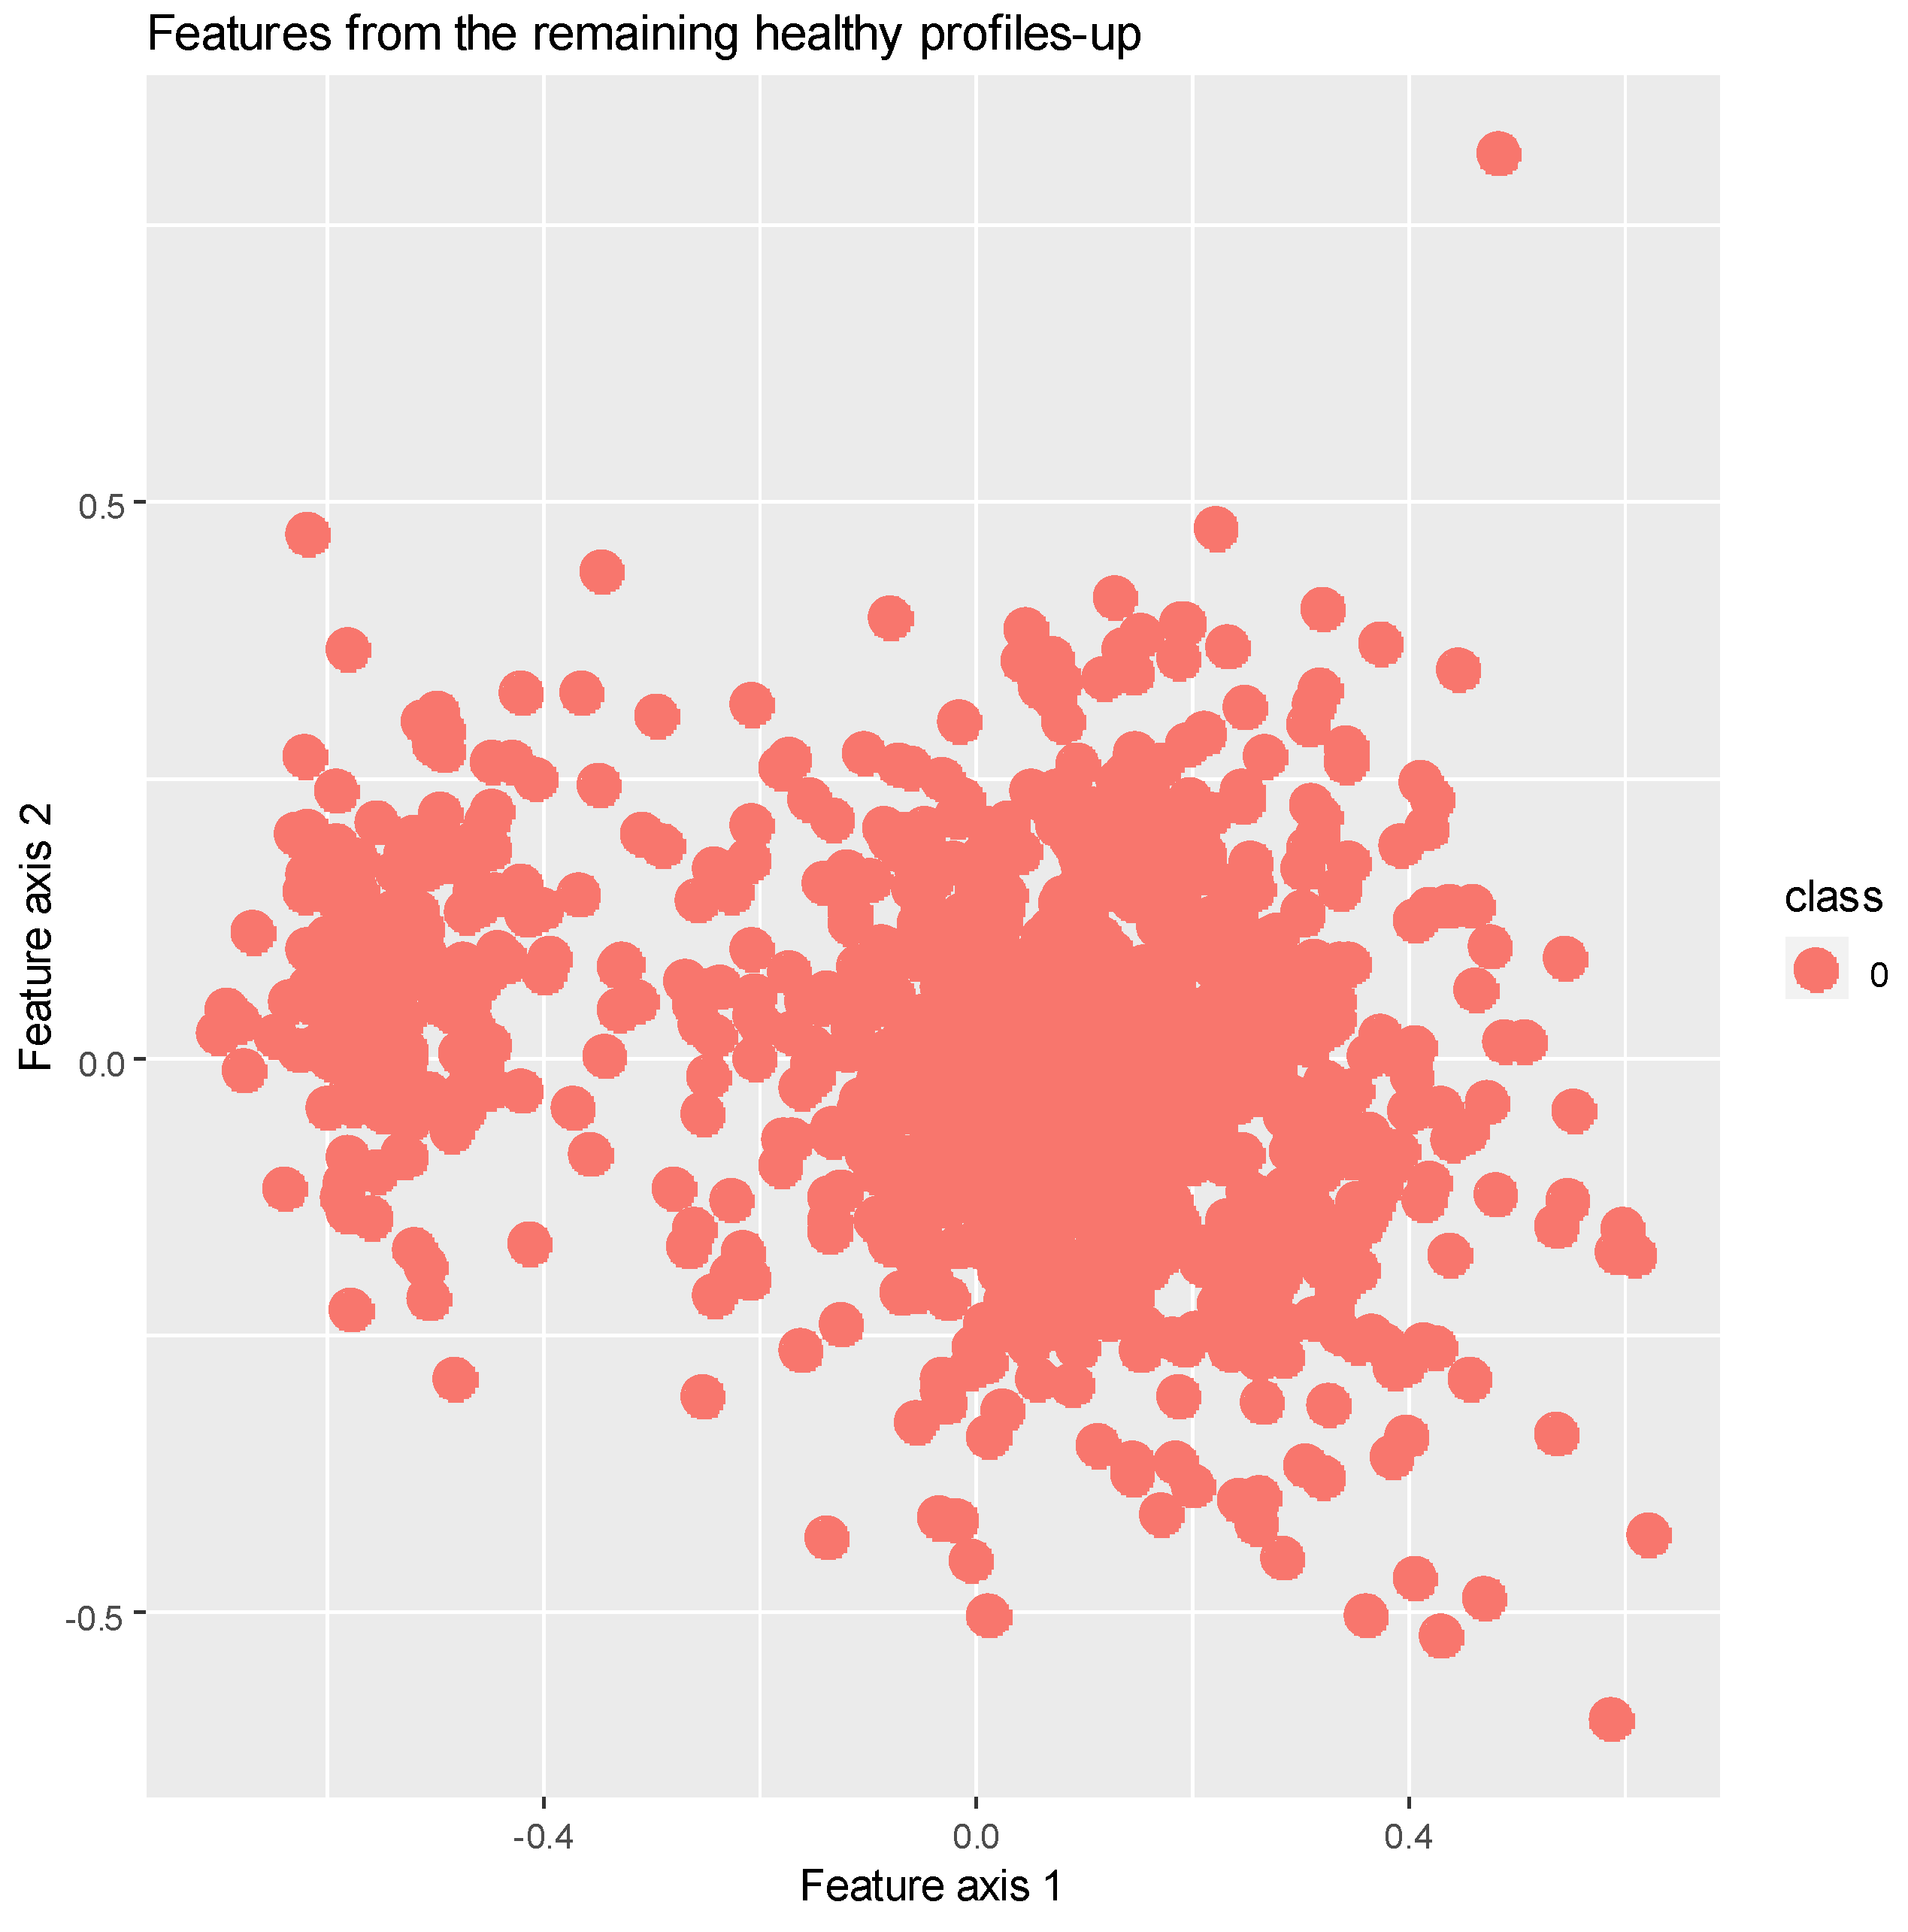
3.1. Up Movement
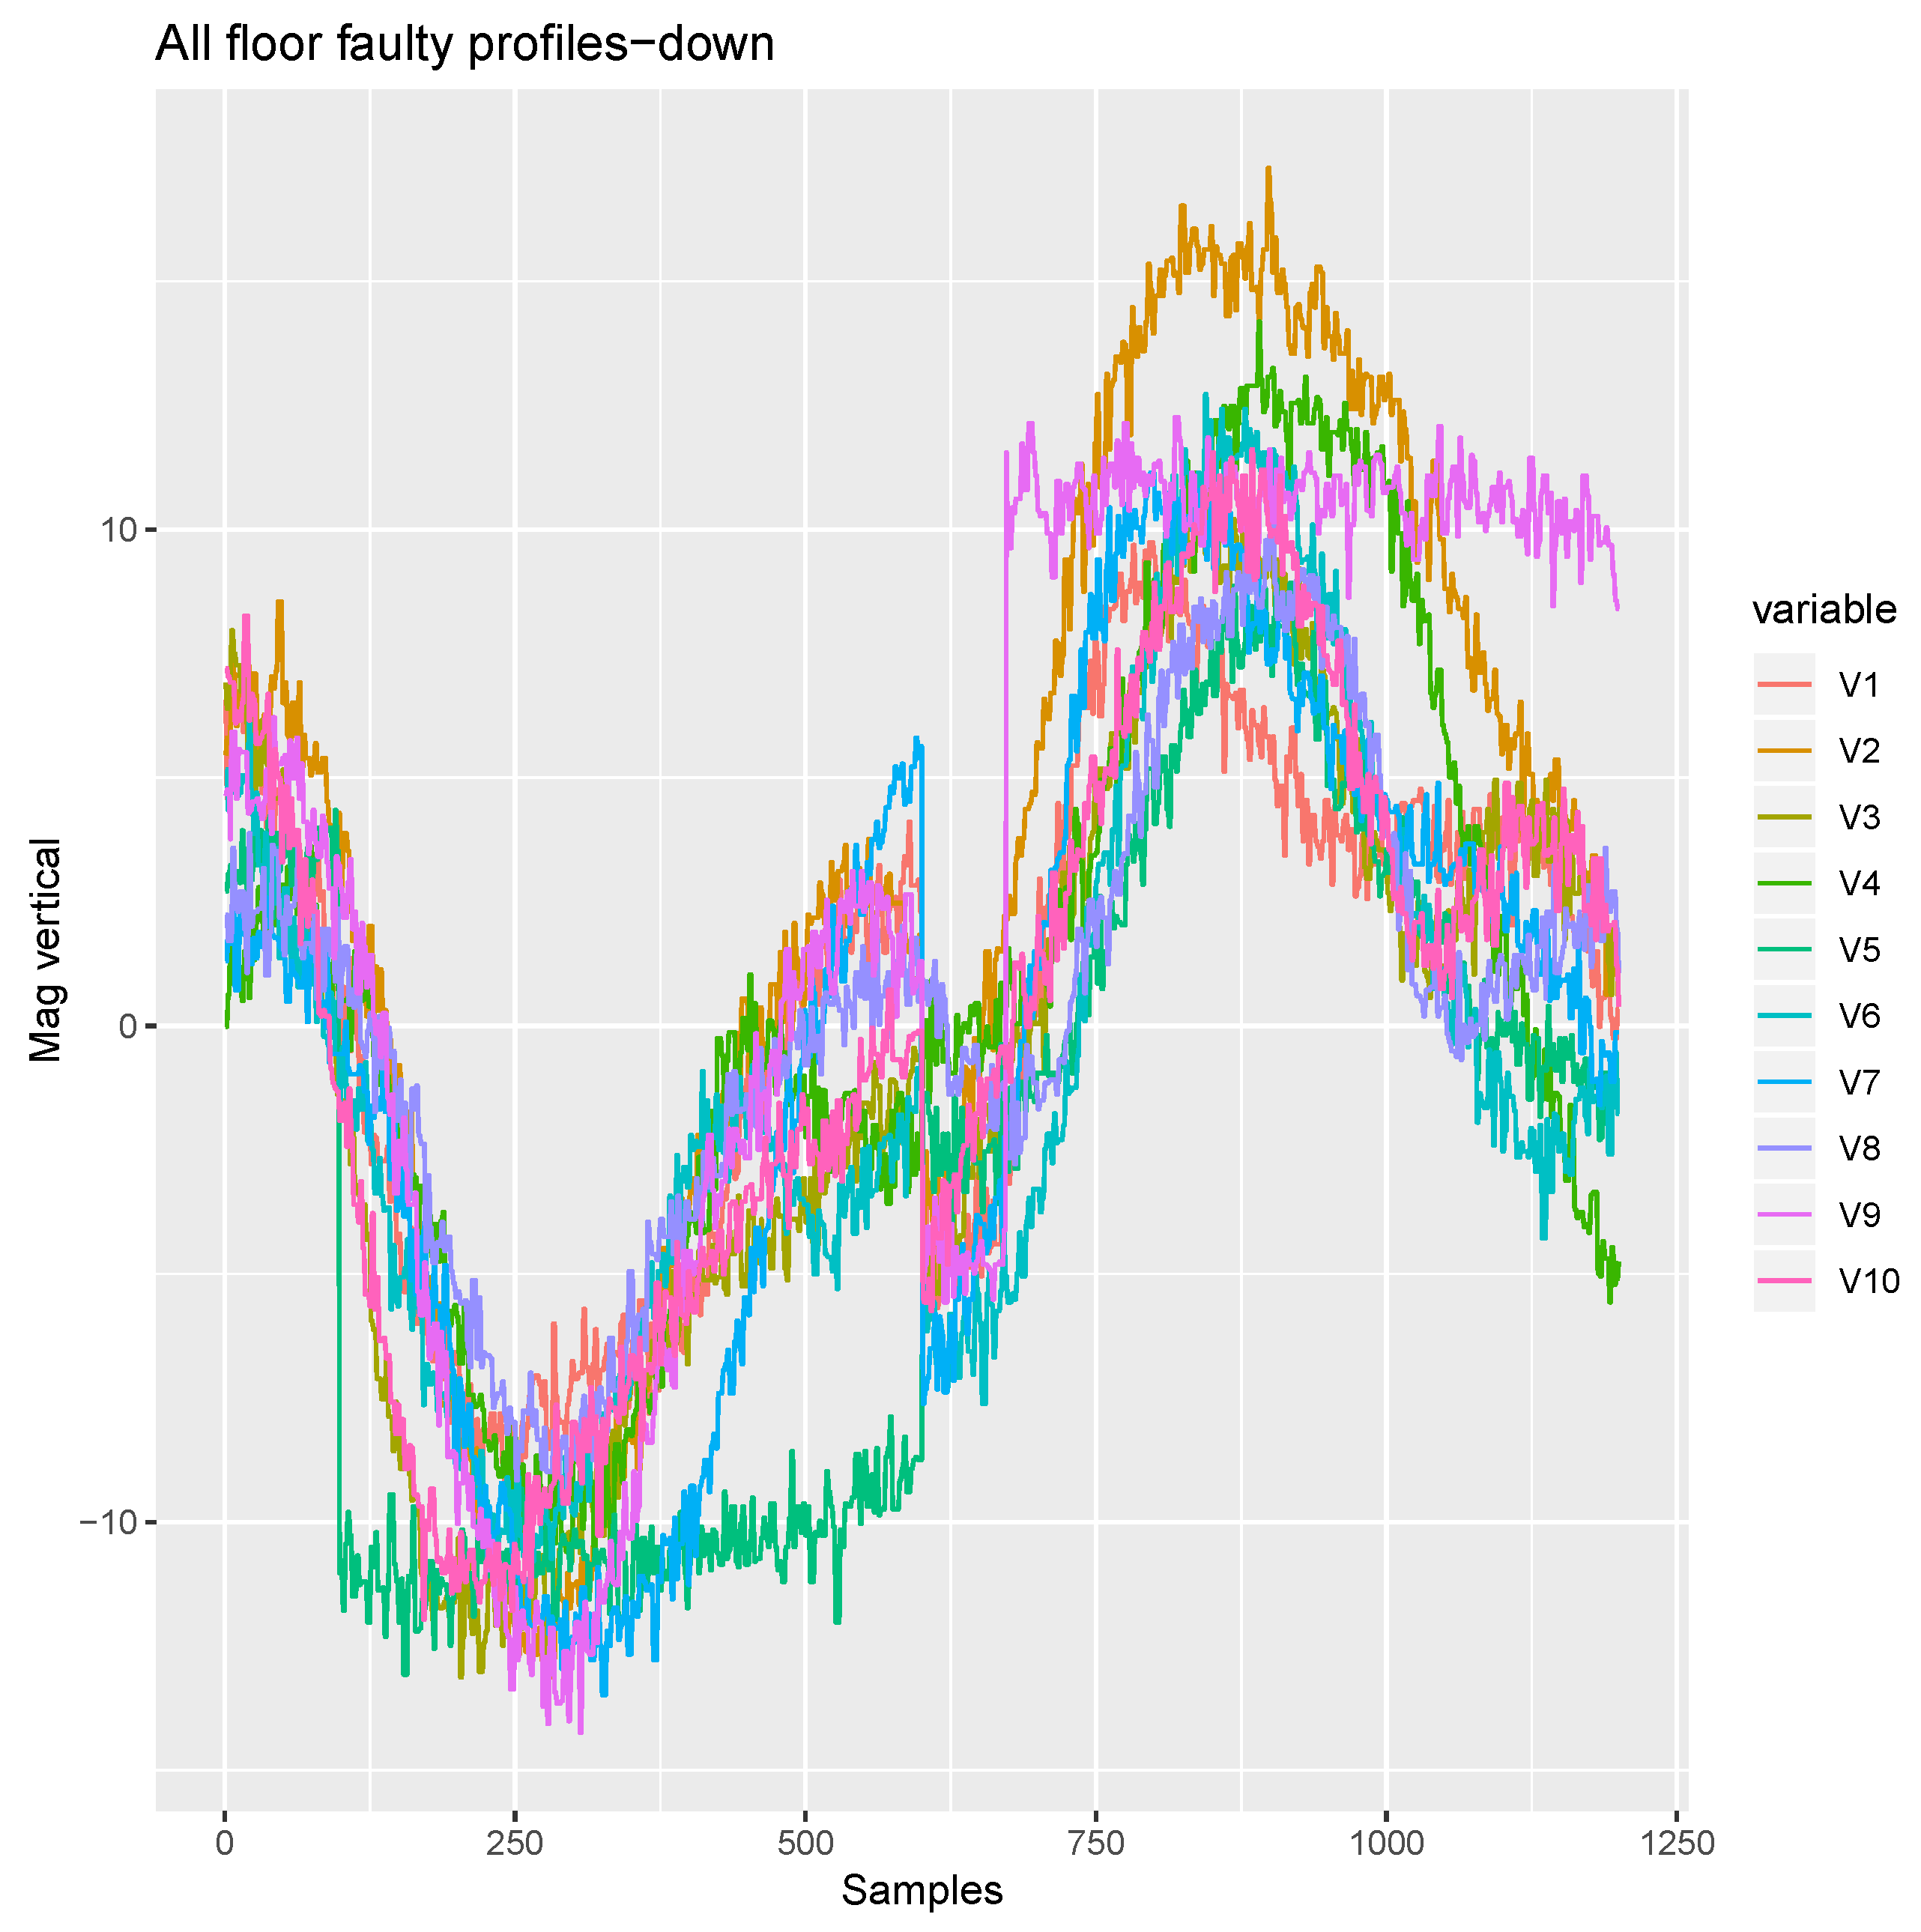
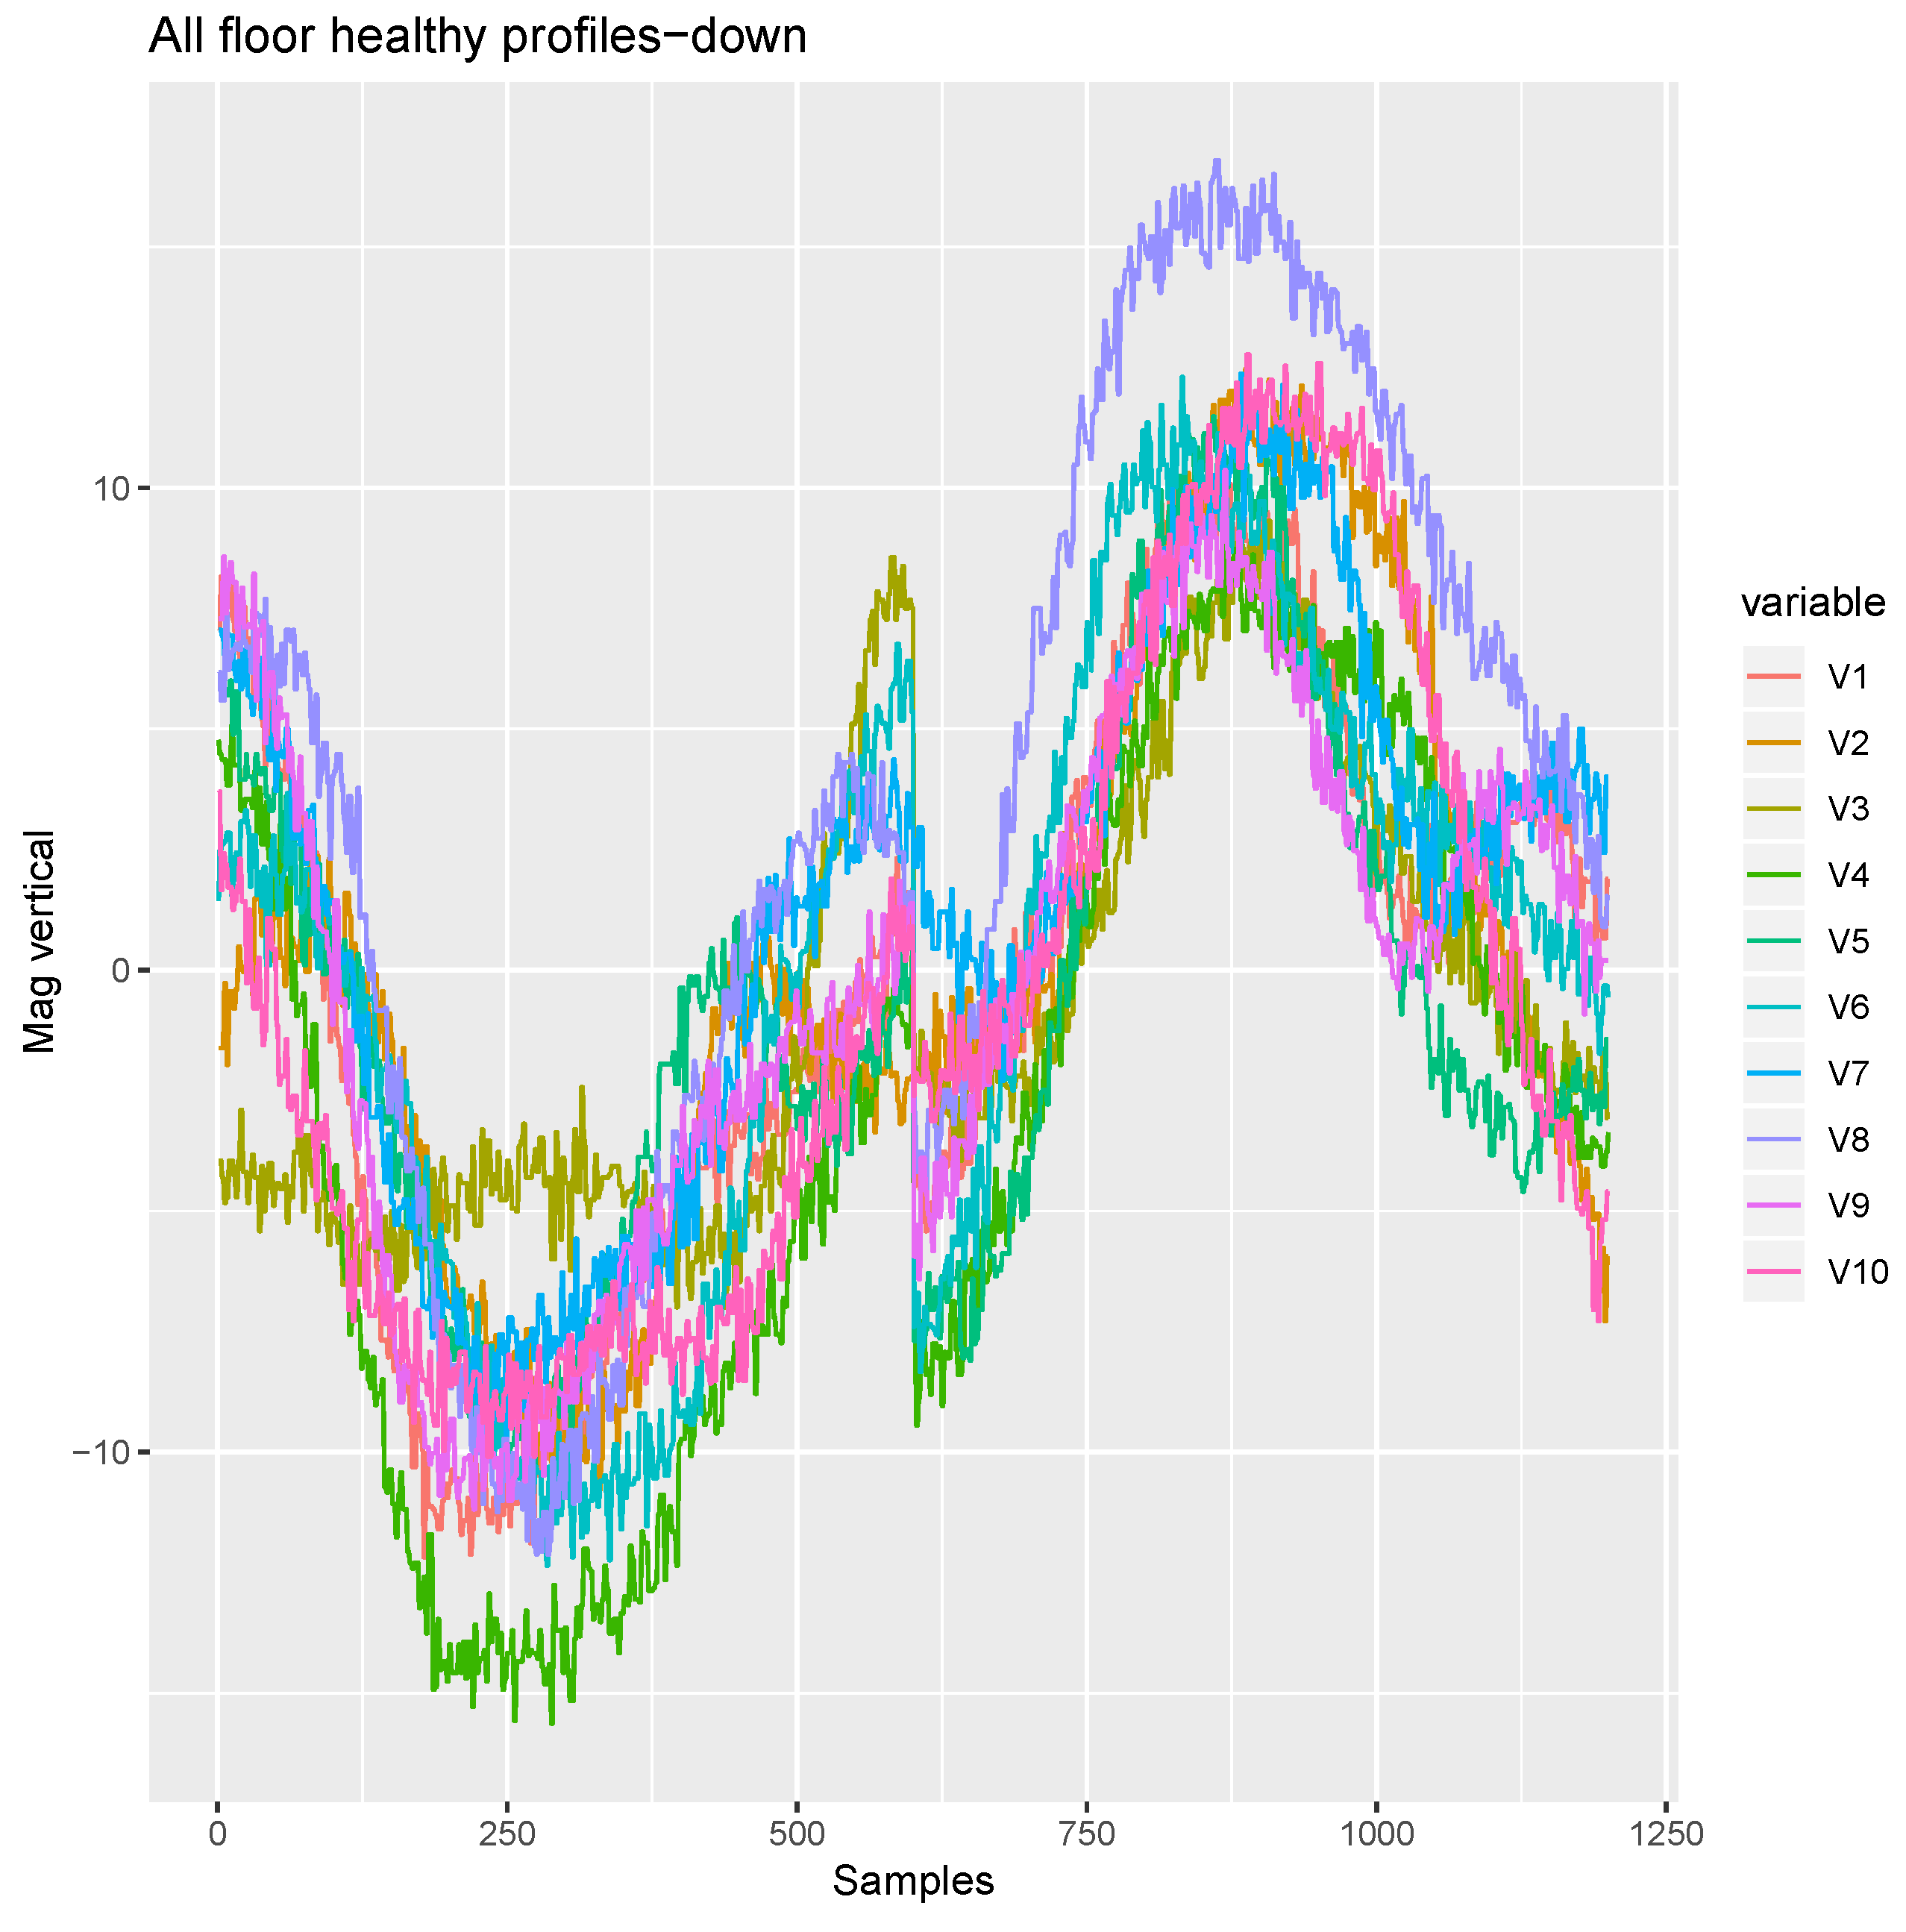
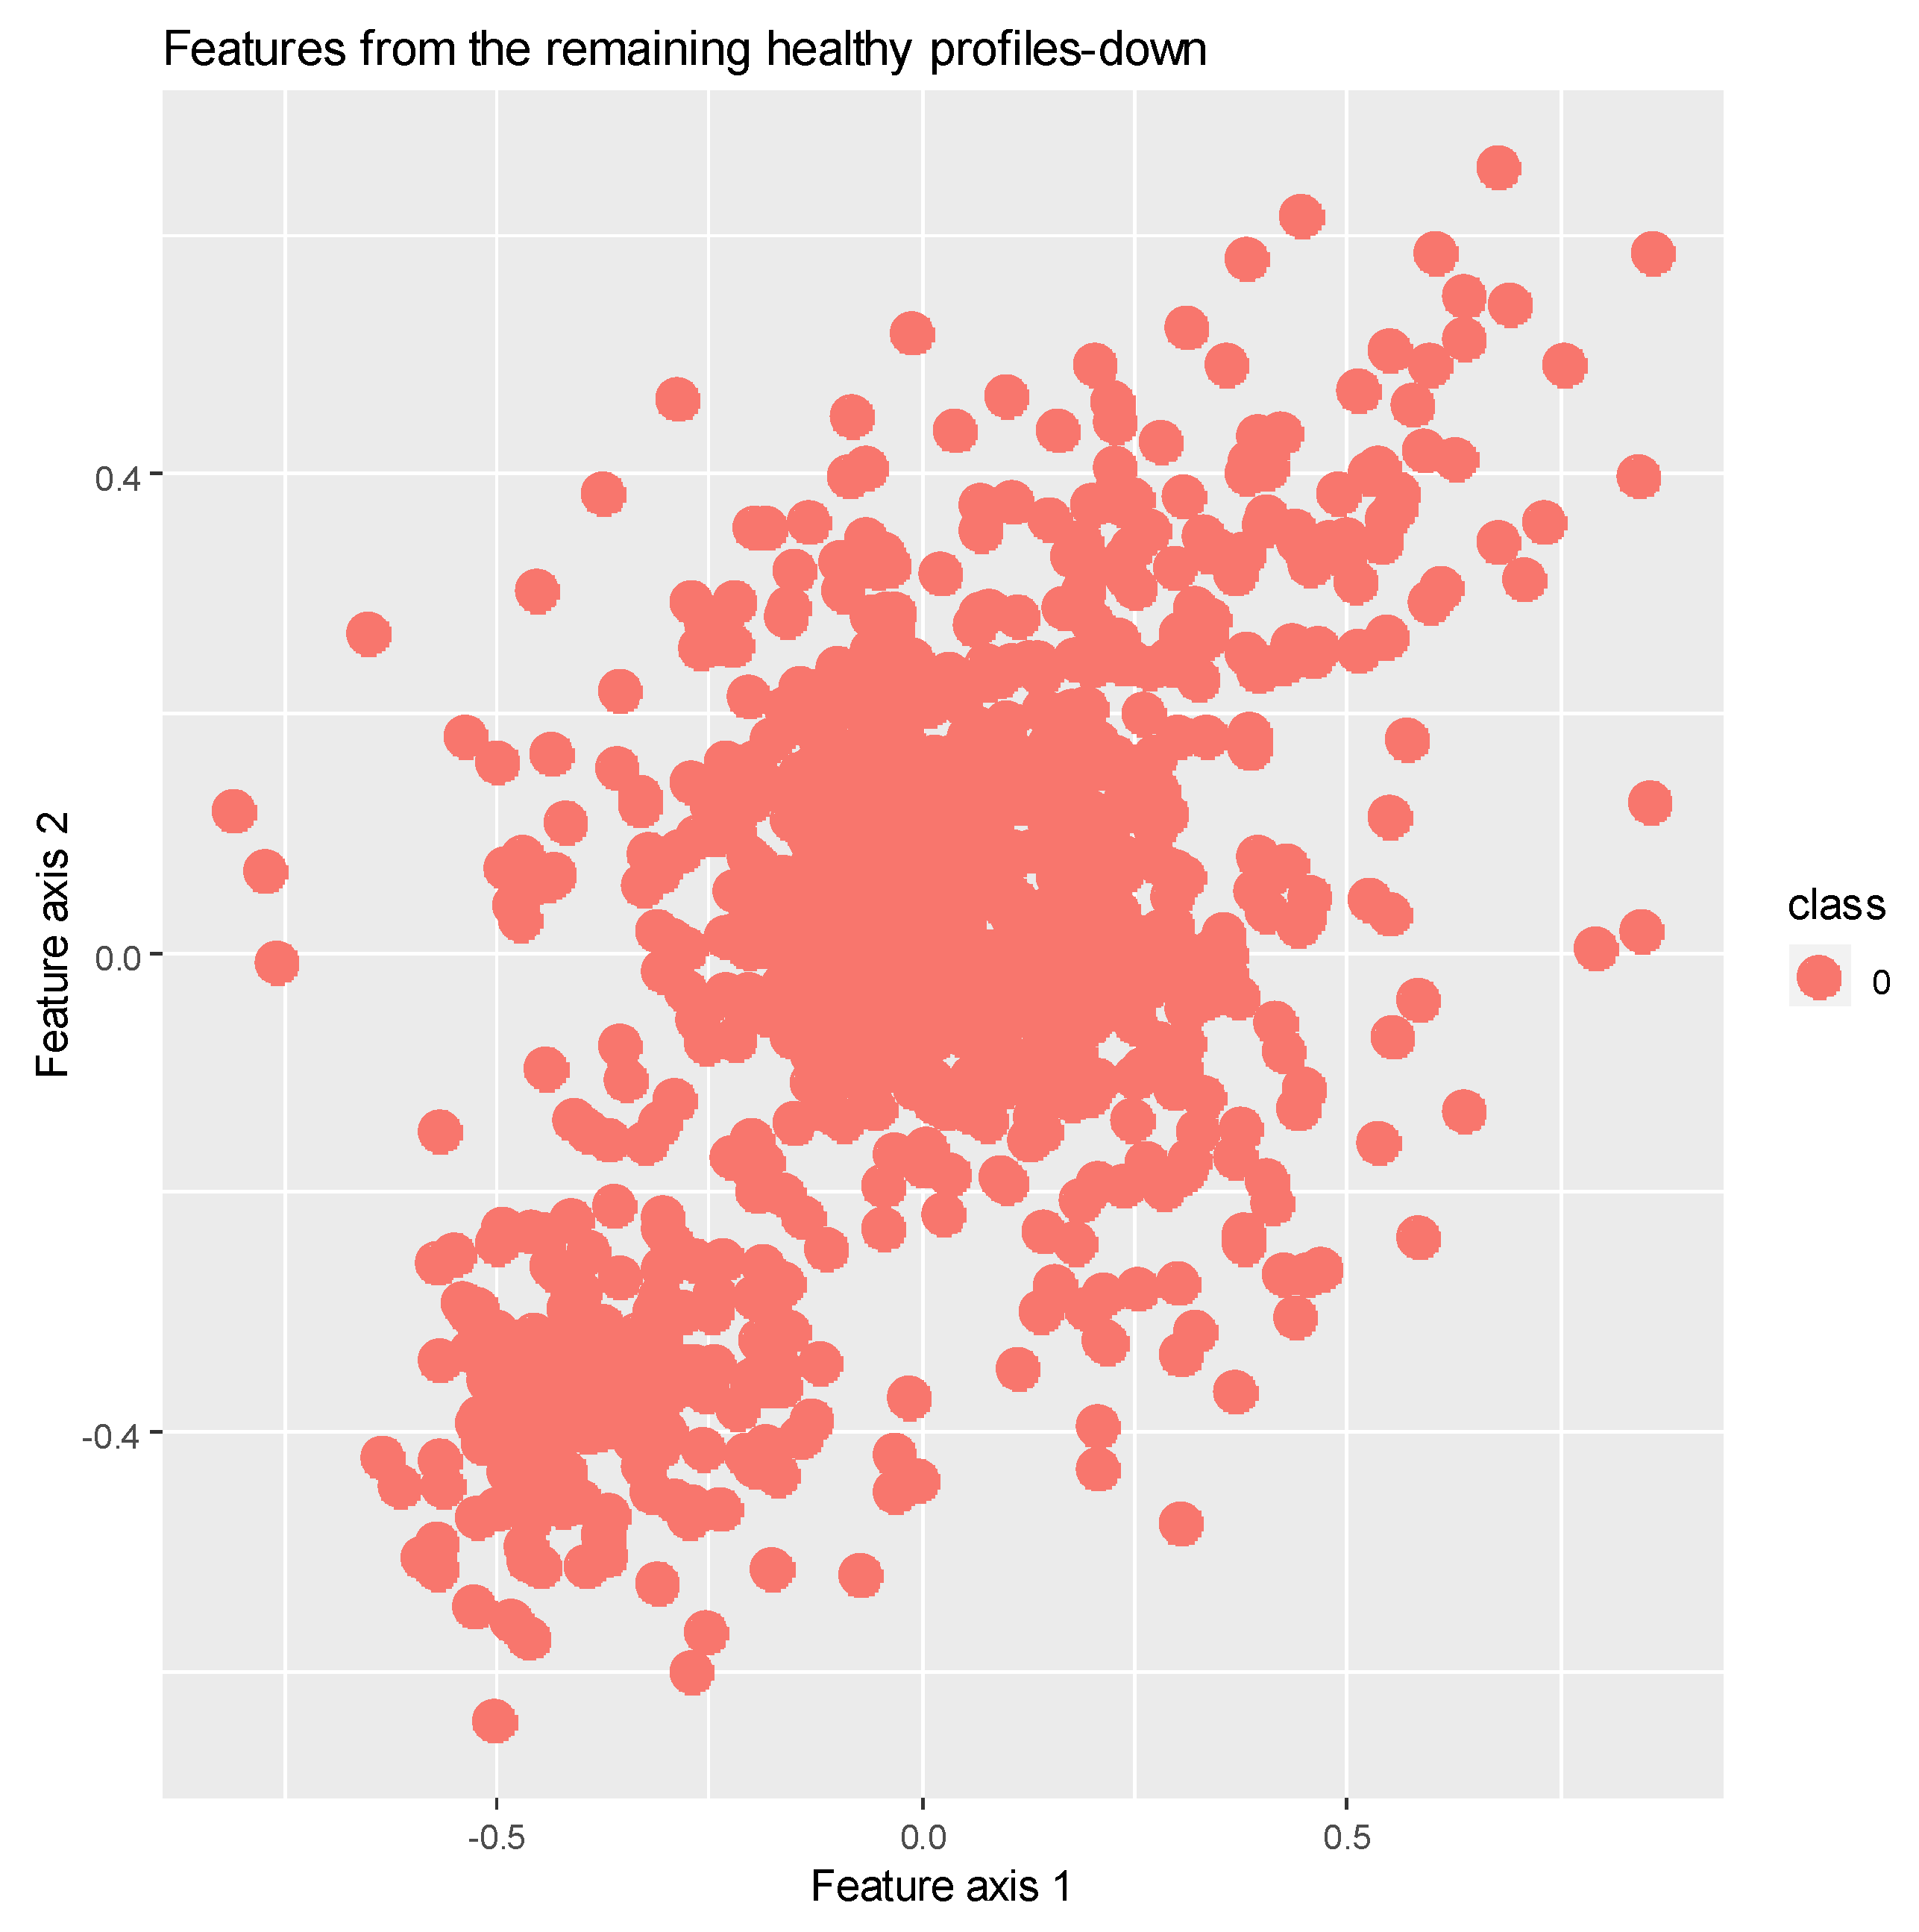
3.2. Down Movement
4. Conclusions and Future Work
Author Contributions
Funding
Conflicts of Interest
References
- Desa, U. World Urbanization Prospects; the 2011 Revision; Population Division, Department of Economic and Social Affairs, United Nations Secretariat: New York, NY, USA, 2014. [Google Scholar]
- Ebeling, T. Condition monitoring for elevators—An overview. Lift Rep. 2011, 6, 25–26. [Google Scholar]
- Ebeling, T.; Haul, M. Results of a field trial aiming at demonstrating the permanent detection of elevator wear using intelligent sensors. Proc. ELEVCON 2016, 20, 101–109. [Google Scholar]
- Wang, P.; He, W.; Yan, W. Fault diagnosis of elevator braking system based on wavelet packet algorithm and fuzzy neural network. In Proceedings of the 2009 9th International Conference on Electronic Measurement & Instruments, Beijing, China, 16–19 August 2009; pp. 4–1028. [Google Scholar]
- Zhang, R.; Peng, Z.; Wu, L.; Yao, B.; Guan, Y. Fault diagnosis from raw sensor data using deep neural networks considering temporal coherence. Sensors 2017, 17, 549. [Google Scholar] [CrossRef] [PubMed]
- Jia, F.; Lei, Y.; Lin, J.; Zhou, X.; Lu, N. Deep neural networks: A promising tool for fault characteristic mining and intelligent diagnosis of rotating machinery with massive data. Mech. Syst. Signal Process. 2016, 72, 303–315. [Google Scholar] [CrossRef]
- Bulla, J.; Orjuela-Cañón, A.D.; Flórez, O.D. Feature extraction analysis using filter banks for faults classification in induction motors. In Proceedings of the 2018 International Joint Conference on Neural Networks (IJCNN), Rio de Janeiro, Brazi, 8–13 July 2018; pp. 1–6. [Google Scholar]
- Xia, M.; Li, T.; Xu, L.; Liu, L.; de Silva, C.W. Fault Diagnosis for Rotating Machinery Using Multiple Sensors and Convolutional Neural Networks. In Proceedings of the 2018 IEEE International Joint Conference on Neural Networks (IJCNN), Rio de Janeiro, Brazi, 8–13 July 2018; pp. 101–110. [Google Scholar]
- Jing, L.; Wang, T.; Zhao, M.; Wang, P. An adaptive multi-sensor data fusion method based on deep convolutional neural networks for fault diagnosis of planetary gearbox. Sensors 2017, 17, 414. [Google Scholar] [CrossRef] [PubMed]
- Martínez-Rego, D.; Fontenla-Romero, O.; Alonso-Betanzos, A. Power wind mill fault detection via one-class v-SVM vibration signal analysis. In Proceedings of the 2011 IEEE International Joint Conference on Neural Networks, San Jose, CA, USA, 31 July–5 August 2011; pp. 511–518. [Google Scholar]
- Yang, Z.; Zhang, P. ELM Meets RAE-ELM: A hybrid intelligent model for multiple fault diagnosis and remaining useful life predication of rotating machinery. In Proceedings of the 2016 IEEE International Joint Conference on Neural Networks (IJCNN), Vancouver, BC, Canada, 24–29 July 2016; pp. 2321–2328. [Google Scholar]
- Osornio-Rios, R.A.; de Jesús Romero-Troncoso, R.; Herrera-Ruiz, G.; Castañeda-Miranda, R. FPGA implementation of higher degree polynomial acceleration profiles for peak jerk reduction in servomotors. Robot. Comput. Integr. Manuf. 2009, 25, 379–392. [Google Scholar] [CrossRef]
- Carr, C.E.; Bryan, N.C.; Saboda, K.N.; Bhattaru, S.A.; Ruvkun, G.; Zuber, M.T. Acceleration profiles and processing methods for parabolic flight. NPJ Microgravity 2018, 4, 14. [Google Scholar] [CrossRef] [PubMed]
- Bingham, C.; Walsh, C.; Carroll, S. Impact of driving characteristics on electric vehicle energy consumption and range. IET Intell. Transp. Syst. 2012, 6, 29–35. [Google Scholar] [CrossRef]
- Nam, S.; Yang, M. A study on a generalized parametric interpolator with real-time jerk-limited acceleration. Comput. -Aided Des. 2004, 36, 27–36. [Google Scholar] [CrossRef]
- Soyka, F.; Giordano, P.R.; Beykirch, K.; Bülthoff, H.H. Predicting direction detection thresholds for arbitrary translational acceleration profiles in the horizontal plane. Exp. Brain Res. 2011, 209, 95–107. [Google Scholar] [CrossRef] [PubMed] [Green Version]
- Wang, X.; Wu, S.; Wang, K. A run-to-run profile control algorithm for improving the flatness of nano-scale products. IEEE Trans. Autom. Sci. Eng. 2013, 12, 192–203. [Google Scholar] [CrossRef]
- Calimeri, F.; Marzullo, A.; Stamile, C.; Terracina, G. Graph Based Neural Networks for Automatic Classification of Multiple Sclerosis Clinical Courses. In Proceedings of the ESANN, Bruges, Belgium, 25–27 April 2018. [Google Scholar]
- Seppala, J.; Koivisto, H.; Koivo, H. Modeling elevator dynamics using neural networks. In Proceedings of the 1998 IEEE International Joint Conference on Neural Networks Proceedings, IEEE World Congress on Computational Intelligence (Cat. No. 98CH36227), Anchorage, AK, USA, 4–9 May 1998; pp. 2419–2424. [Google Scholar]
- Lee, C. Gender classification using M-estimator based radial basis function neural network. In Proceedings of the 2014 International Conference on Signal Processing and Multimedia Applications (SIGMAP), Vienna, Austria, 28–30 August 2014; pp. 302–306. [Google Scholar]
- Fernández-Varela, I.; Athanasakis, D.; Parsons, S.; Hernández-Pereira, E.; Moret-Bonillo, V. Sleep Staging with Deep Learning: A Convolutional Model. In Proceedings of the ESANN, Bruges, Belgium, 25–27 April 2018. [Google Scholar]
- Zhuang, Z.; Lv, H.; Xu, J.; Huang, Z.; Qin, W. A Deep Learning Method for Bearing Fault Diagnosis through Stacked Residual Dilated Convolutions. Appl. Sci. 2019, 9, 1823. [Google Scholar] [CrossRef]
- Wang, J.; Sanchez, J.; Iturrioz, J.; Ayesta, I. Geometrical Defect Detection in the Wire Electrical Discharge Machining of Fir-Tree Slots Using Deep Learning Techniques. Appl. Sci. 2019, 9, 90. [Google Scholar] [CrossRef]
- Lin, W.; Lo, S.; Young, H.; Hung, C. Evaluation of Deep Learning Neural Networks for Surface Roughness Prediction Using Vibration Signal Analysis. Appl. Sci. 2019, 9, 1462. [Google Scholar] [CrossRef]
- Donati, L.; Iotti, E.; Mordonini, G.; Prati, A. Fashion Product Classification through Deep Learning and Computer Vision. Appl. Sci. 2019, 9, 1385. [Google Scholar] [CrossRef]
- Gu, Y.; Wang, Y.; Li, Y. A Survey on Deep Learning-Driven Remote Sensing Image Scene Understanding: Scene Classification, Scene Retrieval and Scene-Guided Object Detection. Appl. Sci. 2019, 9, 2110. [Google Scholar] [CrossRef]
- Hänninen, J.; Kärkkäinen, T. Comparison of Four-and Six-Layered Configurations for Deep Network Pretraining. In Proceedings of the ESANN, Bruges, Belgium, 27–29 April 2016. [Google Scholar]
- Albuquerque, A.; Amador, T.; Ferreira, R.; Veloso, A.; Ziviani, N. Learning to rank with deep autoencoder features. In Proceedings of the 2018 International Joint Conference on Neural Networks (IJCNN), Rio de Janeiro, Brazi, 8–13 July 2018; pp. 1–8. [Google Scholar]
- Huet, R.; Courty, N.; Lefèvre, S. A New Penalisation Term for Image Retrieval in Clique Neural Networks. In Proceedings of the ESANN, Bruges, Belgium, 27–29 April 2016. [Google Scholar]
- Fogelman-Soulie, F.; Robert, Y.; Tchuente, M. Automata Networks in Computer Science: Theory and Applications; Manchester University Press: Manchester, UK; Princeton University Press: Princeton, NJ, USA, 1987. [Google Scholar]
- Madani, P.; Vlajic, N. Robustness of deep autoencoder in intrusion detection under adversarial contamination. In Proceedings of the 5th Annual Symposium and Bootcamp on Hot Topics in the Science of Security, Raleigh, NC, USA, 10–11 April 2018; p. 1. [Google Scholar]
- Sun, W.; Shao, S.; Zhao, R.; Yan, R.; Zhang, X.; Chen, X. A sparse auto-encoder-based deep neural network approach for induction motor faults classification. Measurement 2016, 89, 171–178. [Google Scholar] [CrossRef]
- Jiang, G.; Xie, P.; He, H.; Yan, J. Wind turbine fault detection using a denoising autoencoder with temporal information. IEEE/ASME Trans. Mech. 2017, 23, 89–100. [Google Scholar] [CrossRef]
- Mishra, K.M.; Krogerus, T.; Huhtala, K. Profile extraction and deep autoencoder feature extraction for elevator fault detection. In Proceedings of the 16th International Conference on Signal Processing and Multimedia Applications (SIGMAP), Prague, Czech Republic, 26–28 July 2019; pp. 319–326. [Google Scholar]
- Di Martino, J. Dynamic time warping algorithms for isolated and connected word recognition. In New Systems and Architectures for Automatic Speech Recognition and Synthesis; Springer: Berlin/Heidelberg, Germany, 1985; pp. 405–418. [Google Scholar]
- Rhudy, M. Time alignment techniques for experimental sensor data. Int. J. Comput. Sci. Eng. Surv. 2014, 5, 1–14. [Google Scholar] [CrossRef]
- Vincent, P.; Larochelle, H.; Bengio, Y.; Manzagol, P. Extracting and composing robust features with denoising autoencoders. In Proceedings of the 25th International Conference on Machine Learning, Helsinki, Finland, 5–9 July 2008; pp. 1096–1103. [Google Scholar]
- Japkowicz, N.; Hanson, S.J.; Gluck, M.A. Nonlinear autoassociation is not equivalent to PCA. Neural Comput. 2000, 12, 531–545. [Google Scholar] [CrossRef]
- Breiman, L. Random forests. Mach. Learn. 2001, 45, 5–32. [Google Scholar] [CrossRef]
- Huynh, T.; Gao, Y.; Kang, J.; Wang, L.; Zhang, P.; Lian, J.; Shen, D. Estimating CT image from MRI data using structured random forest and auto-context model. IEEE Trans. Med. Imaging 2015, 35, 174–183. [Google Scholar] [CrossRef] [PubMed]
- Liaw, A.; Wiener, M. Classification and regression by randomForest. R News 2002, 2, 18–22. [Google Scholar]
- Liu, Z.; Tang, B.; He, X.; Qiu, Q.; Liu, F. Class-specific random forest with cross-correlation constraints for spectral–spatial hyperspectral image classification. IEEE Geosci. Remote Sens. Lett. 2017, 14, 257–261. [Google Scholar] [CrossRef]


| Predicted (P) | (N) | |
|---|---|---|
| Actual (P) | True positive (TP) | False negative (FN) |
| (N) | False positive (FP) | True negative (TN) |
| Start Floor | Stop Floor |
|---|---|
| 0 | 1 |
| 2 | 5 |
| 3 | 8 |
| 4 | 6 |
| Deep Features | Existing Features | |
|---|---|---|
| Accuracy | 0.90 | 0.54 |
| Sensitivity | 0.92 | 0.50 |
| Specificity | 0.88 | 0.58 |
| False positives | 0.86 | 0.31 |
| Deep Features | Existing Features | |
|---|---|---|
| Accuracy | 0.95 | 0.59 |
| Sensitivity | 0.92 | 0.67 |
| Specificity | 0.97 | 0.50 |
| False positives | 1 | 0.61 |
© 2019 by the authors. Licensee MDPI, Basel, Switzerland. This article is an open access article distributed under the terms and conditions of the Creative Commons Attribution (CC BY) license (http://creativecommons.org/licenses/by/4.0/).
Share and Cite
Mishra, K.M.; Huhtala, K. Elevator Fault Detection Using Profile Extraction and Deep Autoencoder Feature Extraction for Acceleration and Magnetic Signals. Appl. Sci. 2019, 9, 2990. https://doi.org/10.3390/app9152990
Mishra KM, Huhtala K. Elevator Fault Detection Using Profile Extraction and Deep Autoencoder Feature Extraction for Acceleration and Magnetic Signals. Applied Sciences. 2019; 9(15):2990. https://doi.org/10.3390/app9152990
Chicago/Turabian StyleMishra, Krishna Mohan, and Kalevi Huhtala. 2019. "Elevator Fault Detection Using Profile Extraction and Deep Autoencoder Feature Extraction for Acceleration and Magnetic Signals" Applied Sciences 9, no. 15: 2990. https://doi.org/10.3390/app9152990
APA StyleMishra, K. M., & Huhtala, K. (2019). Elevator Fault Detection Using Profile Extraction and Deep Autoencoder Feature Extraction for Acceleration and Magnetic Signals. Applied Sciences, 9(15), 2990. https://doi.org/10.3390/app9152990