Abstract
The shadow effect caused by nearby objects or the lack of cleaning significantly affects the performance of photovoltaics (PV) installations. This article analyses the bypass diode electrical behaviour and the thermal response of a PV crystalline module under shading or soiling conditions. PV cells of different substrings were covered progressively to simulate the effect of shading or soiling while a programmable electronic DC load was connected to a PV module to set an operating voltage. Three different tests were made to different PV crystalline technology. The paper characterizes in real conditions the I–V curve, bypass diode current, and front and back side PV cell temperature with contact sensor and infrared (IR) thermography, respectively. The results showed that the operation voltage established in the PV module defines the electrical bypass diode current and thermal response under normal operating conditions, shading or soiling. To show the bypass diode behaviour in such conditions, I–V curves were obtained, pointing out the value of the current that flows through bypass diodes in the whole voltage range.
1. Introduction
Photovoltaic (PV) installations can significantly affect their normal operation in shading conditions caused by vegetation or nearby architectural elements [1]. In addition, the accumulation of dirt on the front surface of the module can cause a situation of shading with equivalent effects [2]. This shading situation is common for urban environments in building integrated photovoltaics (BIPV) [3], but also for rural environments in photovoltaic greenhouses [4]. The effect of non-optimal operation by shading can occur in PV systems integrated with greenhouses, according to the orientation of the installation and the way of sharing the solar radiation with the crop [5]. The shading can be complete or partial depending on the location of the PV installation and on the elements that stand in relation to the solar position.
Some references do not consider the shading conditions as failures although they may lead to power loss or safety issues [6]. PV modules affected by shadow or soiling conditions are subjected to non-homogeneous values of irradiance and temperature, making it work in non-optimal operation conditions, which can lead to hot spots or even burned cells [7].
In order to protect the PV modules from shading and soiling, bypass diodes are installed. A group of PV cells protected by one by-pass diode is normally known as a substring or sub-module. Normally, a PV module is split into several substrings. Therefore, in the presence of shading or soiling, the use of bypass diodes makes a distinctive I–V and P–V curve where different local maximum power points (LMPP) and one global maximum power point (GMPP) are obtained [8]. The operational values of current and voltage in a PV system depend on the maximum power point (MPP) tracked by the algorithm, which may be one of the local power peaks rather than the global one. Operating the PV systems at the MPP, the algorithm will fix the operating voltage of the group of PV modules or array [9] and, depending of it, some of the bypass diodes can be turned on. The manufacturers of photovoltaic modules apply to their products tests of resistance to the formation of hot spots to determine their capacity to resist hot spots. This test is defined in the design and approval qualification standard: IEC-61215-2 [10].
It is broadly known that the output current of a PV system is directly related to the solar irradiation, while the output voltage is reduced slightly with an increase of temperature [1]. Furthermore, when a substring is covered by dirt or shadow, the temperature of PV cells increases considerably because it converts the solar energy into thermal instead of electric energy [11]. In some cases, electrical and thermal mathematical models of PV systems have been studied and coupled in [12], to determine the module temperature based on experimental data of weather conditions and the electrical operation point. Such a fact means that the correlation between temperature and performance of PV modules has been widely studied by different authors in the last decade, such as [11,13]. To determine such a correlation, IR thermography has been used to determine thermal behaviour, while conventional electrical measure equipment has been employed to obtain the electric characteristics, such as the I–V curve tracer.
IR thermography is a fast and contactless way to measure the back or front side temperature of the PV module, being useful to detect failures in PV modules or even in the junction box [14]. An explanation of some PV faults with their corresponding infrared (IR) image was proposed in [15,16], proposing in some cases acceptance or rejection criteria of modules, depending on the measured hot spot temperatures [17]. The PV module degradation under operating conditions was also analysed through IR thermography [18]. Since IR thermography is gaining importance in such cases, some methods have been proposed to make an accurate temperature measurement through a predefined configuration of the thermographic equipment [19]. The modular and easily scalable nature of PV systems makes it necessary to adopt different maintenance strategies according to each case [20]. In large PV Plants, IR evaluation at ground level can be a waste of time and inefficient, due to the great number of PV modules installed. In order to solve this problem, the use of aerial IR thermography performed by a drone was recently proposed in [14,15].
The objective of this study is to know in detail the driving process of each substring of a PV module under different conditions of shading of cells and the performance of the corresponding bypass diode. The study was carried out both in the monocrystalline type PV module and in the polycrystalline type.
2. Materials and Methods
To study the electrical and thermal behaviour of crystalline PV modules under shading or soiling, three tests were made. The first test was focused to measure the electrical current through bypass diodes of the whole I–V characteristic curve. The second and third test was focused on studying the electrical and thermal behaviour in different operational voltage points under different shading and the electrical current of the corresponding bypass diode. The first and second tests were carried out on a monocrystalline PV module LUXOR LX195M/125-72 +, and the third test was carried out on a polycrystalline PV module AXITEC AC-250 P/60S. Monocrystalline and polycrystalline PV modules are composed of 72 and 60 PV cells, respectively, which are grouped in 3 substrings, each protected by a bypass diode. The tests were carried out in the absence of cloudiness.
In the first test, the monocrystalline PV module was connected to a group of variable resistors. By varying the value of the resistances it was possible to characterize the I–V curve for each of the shadow sequences proposed. The proposed shadows, which are detailed below, are based on covering a single cell of each substring chosen at random. The resistance of the group gradually decreased from values of open circuit to short circuit. As the value of the resistance varied, voltage and current data were recorded. Electrical current values were obtained for each of the bypass diodes, as well as the total of the PV module. For the measure of the 3 bypass diode currents, the output PV module current, and the output PV module voltage, 4 DC ammeters and a Fluke 177 voltmeter were connected. The irradiance values were measured with a power analyser HT-SOLAR 300N for PV applications.
In the second and third test, the respective PV modules, separately, were exposed to external environmental conditions and connected to a programmable electronic load, which allowed us to set an output voltage for all possible values of the I–V curve. The effect of the partial shading was done by covering different PV cells through an adhesive tape with a known emissivity value. The front temperature of the PV module was measured by infrared thermography.
The voltage value of the programmable electronic load was modified depending on the experimental behaviour of bypass diodes. A total of 3 cells belonging to the 3 different substrings were covered to evaluate the performance of the 3 bypass diodes. The PV cells were covered one by one progressively every 30 min to reach a thermal stabilization. Then, the covered PV cells were uncovered until the PV module came back to the initial operating condition. PV cells were covered randomly without considering those close to the frame, to avoid its thermal effect. The sequence of covering and uncovering PV cells were carried out according to the following sequence, whose identification of the covered PV cell was done as indicated in the specification IEC-62446-3 [21].
- Step 1. Covering E3 cell of 1st substring;
- Step 2. Covering C4 cell of 2nd substring;
- Step 3. Covering B6 cell of 3rd substring;
- Step 4. Uncovering C4 cell of 2nd substring;
- Step 5. Uncovering E3 cell of 1st substring;
- Step 6. Uncovering B6 cell of 3rd substring.
The electrical behaviour of the second and third tests was studied by measuring the current of each diode as indicated in Figure 1. A total of four HAMEG HM8012 digital DC ammeters were connected, measuring the current through each bypass diode, as well as the total output current of the PV solar module.
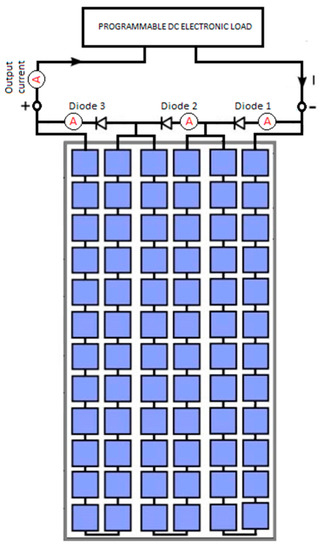
Figure 1.
Electronic load and digital DC ammeters diagram connection in the photovoltaics (PV) module.
The thermal behaviour of the PV module was studied by measuring the temperature. Contact sensors and an IR thermography camera measured the back and front side PV module temperature, respectively. The environmental parameters (horizontal irradiance, ambient temperature, and wind speed) were recorded by a weather station located on the site. The equipment was connected as shown in Figure 2.
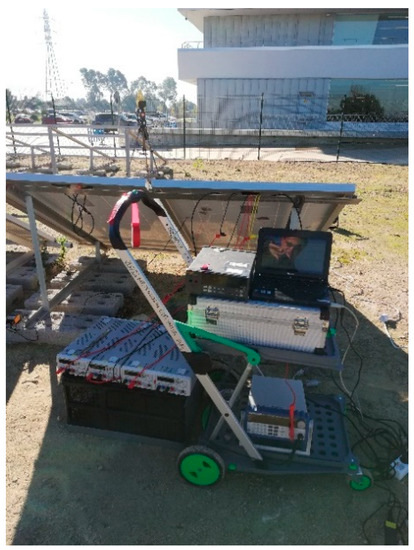
Figure 2.
Disposition of the equipment used during the first and second tests.
The evaluation of the back side PV module temperature was carried out by thermocouples, adhered with high thermal conductivity tape, in each of the three covered PV cells. An additional thermocouple was connected to an uncovered PV cell, F4, to obtain a normal PV cell temperature operation.
To evaluate the front side temperature of the PV module, a FLIR ThermaCAM S60 was used. As shown in Figure 3, it was placed on an angle that avoided the solar reflection during the test. According to the IEC 62446-3 [21], the thermographic inspection was carried out under an irradiance higher than 700 W/m2, low wind speeds, and an absence of cloudiness. Furthermore, in order to set an accurate camera configuration to reduce measurement errors, the emissivity and the apparent reflected temperature were evaluated as shown in [13]. In accordance with this, the IR camera was placed at an angle slightly greater than 0° in order to avoid self-reflection and less than 40° from the perpendicular line so that the emissivity could be considered constant.
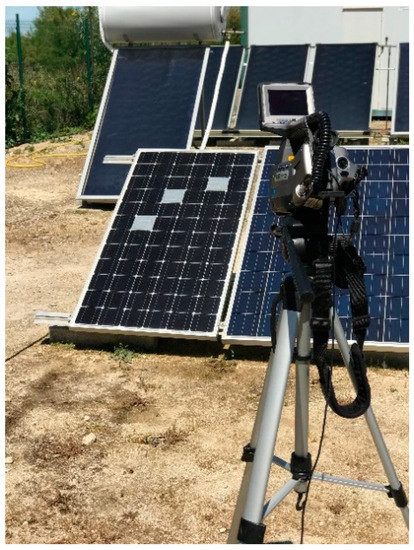
Figure 3.
Position of the thermal camera in front of the covered PV cells E-3, C-4, and B-6.
The temperature and thermographic equipment were configured with a recording interval of 1 min, while the weather station was set with a recording interval of 1 s. The values measured in the different DC ammeters, as well as the electronic load voltage, were recorded every 5 min.
All the thermal and electrical equipment used in the tests have metrological traceability.
3. Results and Discussion
In order to explain the dependence of the electric output current, the bypass diode current, and the output voltage established in a PV module, the results obtained in test 1 are discussed. In test 1, I–V curves plotting the total output and the bypass diode current were obtained in each of these conditions:
- Condition 1: Operation without any covered PV cell.
- Condition 2: Operation with a covered PV cell, E3, in substring 1.
- Condition 3: Operation with two covered PV cells, E3 and C4, in substring 1 and 2, respectively.
- Condition 4: Operation with three covered PV cells, E3, C4, and B6, in substring 1, 2, and 3, respectively.
Figure 4 shows the solar PV module I–V characteristic curve in condition 1 with an average irradiance of 839 W/m2. A normal response of the PV module is shown, with no current flowing through any bypass diode.
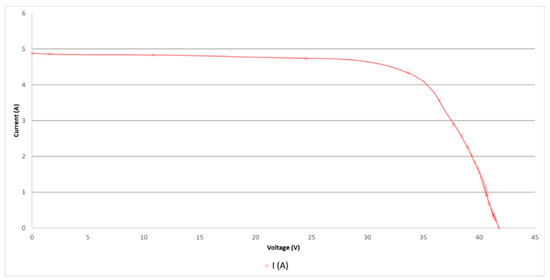
Figure 4.
Experimental monocrystalline solar module I–V characteristic curve in condition 1.
Figure 5 shows the solar PV module I–V characteristic curve in condition 2 with an average irradiance of 946 W/m2. No bypass diode was turned on when the systems worked in a voltage range between 26 and 41 V, while the total output current was considerably reduced in comparison with the current in MPP in Figure 4. To lower voltage operating values than 26 V the current increased to short circuit values, and the substring bypass diode with the covered PV cell started to lead the current, which can be obtained applying the next expression:
where:
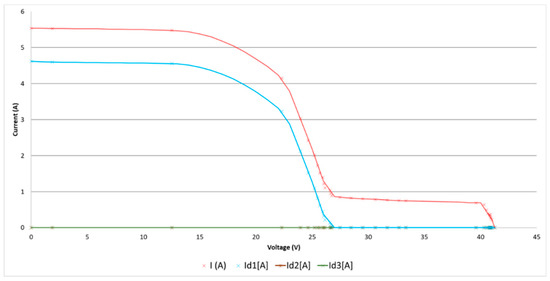
Figure 5.
Experimental monocrystalline solar module I–V characteristic curve in condition 2.
- : Bypass diode current, , in the sub-module with the covered PV cell.
- : Total PV module current when
where:
- : Operating voltage of the solar PV module.
- : Open circuit PV module voltage.
- : Open circuit PV module voltage of the sub-module with the covered PV cell, , which can be obtained as:
where:
- : Number of PV cells in a sub-module protected by a bypass diode, .
- : Crystalline silicon cell forward voltage.
- : Total PV module current when
Figure 6 shows the solar PV module I–V characteristic curve in condition 3 with an average irradiance of 1008 W/m2. Firstly, in this condition, there existed two sub-modules with a covered PV cell, so when the voltage operation value was , each sub-module bypass diode carried an electrical current, which could be calculable as it is shown in (1). The total output PV module current was close to the short circuit PV module current in STC (Standard Tests Conditions).
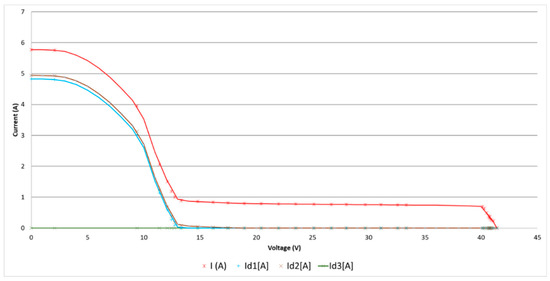
Figure 6.
Experimental monocrystalline solar module I–V characteristic curve in condition 3.
Secondly, to an operating voltage level of , no bypass diode was turned on, but the total output PV module current suffered a considerable reduction.
Figure 7 shows the solar PV module I–V characteristic curve in condition 4 with an average irradiance of 1047 W/m2. In this condition, the short circuit PV module measured current is far lower than in Figure 4. Furthermore, in a big part of the characteristic I–V curve, no bypass diode was turned on since all the failures made in each PV cell of different sub-modules were similar. However, there were two bypass diodes turned on when the operation voltage value was below 15 V. This could have been produced due to the sensibility of the different PV cells exposed to failure or mismatching between the photovoltaic current produced by each one of them.
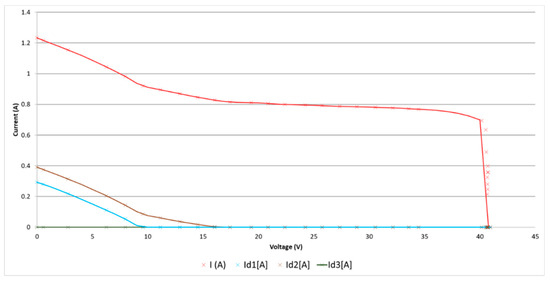
Figure 7.
Experimental monocrystalline solar module I–V characteristic curve in condition 4.
Once the dependence of the electric output current, the bypass diode current, and the output voltage in a PV module were studied, the electrical and thermal results of tests 1 and 2 were presented.
Figure 8 shows the electrical results obtained in test 2. On top of Figure 8, the covered cell in each step has been represented, showing the results below each one. Depending on the covered PV cell and the voltage output of the PV module established, the bypass diode currents and total output current are shown. The test is carried out in the absence of cloudiness and with an irradiance interval between 798 W/m2 and 970 W/m2. Figure 9 shows the output voltage point set by the programmable electric DC load in each step of test 2. If any cell is covered and if the output voltage is close to the MPP of the module, the output current will be much lower than the MPP current, and no bypass diode will carry an electrical current. However, when the output voltage point set is changed to certain lower levels, the total output current increases, while the bypass diode starts to carry an electrical current. In this case, the number of bypass diodes turned on will depend on sub-modules with an affected PV cell. Something different happened when all sub-modules were affected by a covered PV cell since the total output current was lower than the MPP one and no bypass diode was turned on.
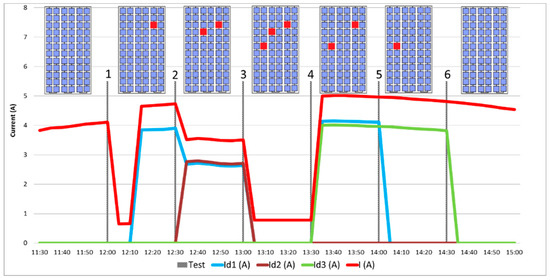
Figure 8.
Total output PV module and bypass diode currents measured in test 2.
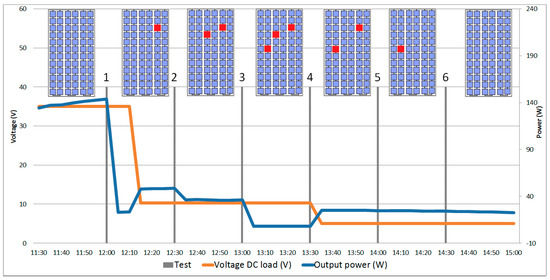
Figure 9.
Programmable DC electronic load voltage imposed and output power in test 2.
As Figure 8 and Figure 9 show, in step 1, a PV cell was covered, while the programmable DC electronic load was set at 35 V, giving place to a decrement of the current from 4 A to 0.7 A without turning any bypass diode on. Once the imposed voltage was changed to a lower value, 10.3 V, the behaviour of the system changed completely, since the total output current increased up to 4.5 A and the bypass diodes of the sub-modules affected started to carry an electrical current of 3.9 A. The imposed voltage in step 3 was decreased up to 5 V without turning any bypass diode on, because all sub-modules had one PV cell covered. In steps 4, 5, and 6 the imposed voltage was kept constant at 5 V and the behaviour of the PV module was the same as shown in steps 3, 2, and 1, respectively.
Figure 9 also shows the output power in each step according to the output voltage imposed by the programmable DC electronic load. As the PV module was working with a low voltage value, the output power kept a constant low value between 40 and 50 W, depending on the number of PV cells covered in each step.
Figure 10 and Figure 11 show the results obtained in test 3. In this case, the programmable DC electronic load was set to a voltage point of 10.3 V in steps 1, 2, and 3 while in steps 4, 5, and 6, it was set to 5 V. The test was carried out in the absence of cloudiness and with an irradiance interval between 770 W/m2 and 915 W/m2. The electric system behaviour was similar to what was shown in test 2.
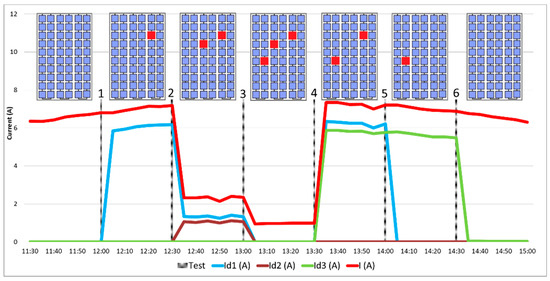
Figure 10.
Total output PV module and bypass diode currents measured in test 3.
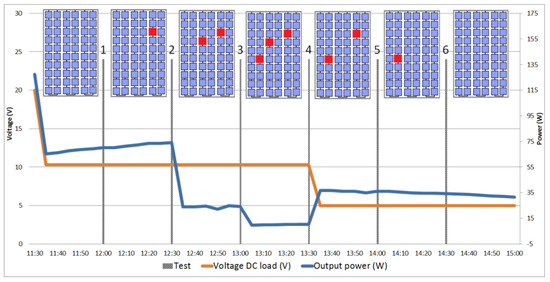
Figure 11.
Programmable DC electronic load voltage imposed and output power in test 3.
Figure 12 and Figure 13 show the thermal results obtained in test 2. Figure 12 shows the measurements obtained by an IR thermographic camera from the front side of the PV module, while Figure 13 shows the measurements obtained by the thermocouples connected on the back side of the PV module. The evolution of both temperatures through the six steps is similar in both measurements. However, it was noticed that the temperature on the back side is about 10 °C higher than the temperature on the front side. It was possible due to the thermal conductivity of the materials and the different ventilation produced by the wind on each side of the PV module. In steps 1 and 2, the temperature measured in the covered PV cells was higher than the healthy cell, F4, which was not covered. Those temperatures are limited by the bypass diode when turned on. However, the temperature in step 3 was lower than previous steps 1 and 2 and approached that of F4, since each sub-module shared a covered PV cell. Due to having one cell of each sub-module covered, the total output current is low at any voltage, so covered cells convert less energy into heat and become cooler than before.
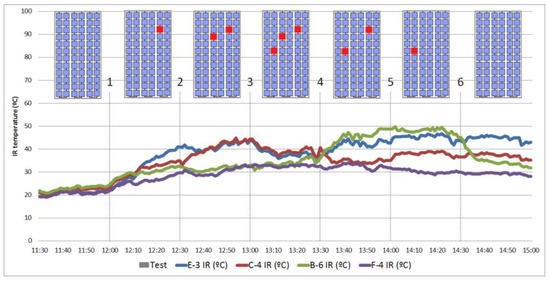
Figure 12.
Infrared (IR) thermographic camera temperatures on the front side of the PV module in test 2.
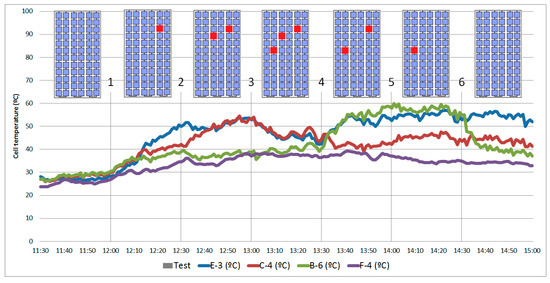
Figure 13.
Thermocouple temperatures on the backside of the PV module in test 2.
Figure 14 shows PV module IR images on the first three steps in test 2. IR images show that PV cells kept higher temperatures when they were covered. Furthermore, an overheating of the junction box is noticeable when bypass diodes were turned on.
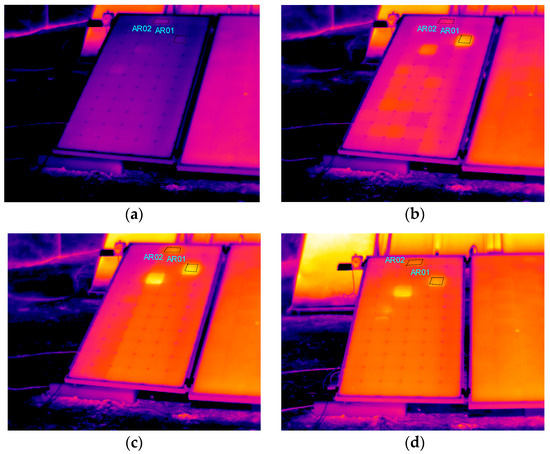
Figure 14.
Monocrystalline PV module IR images; (a) normal operation mode, (b) cell E3 covered, (c) cells E3 and C4 covered, and (d) cells E3, C4, and B6 covered.
Figure 15 and Figure 16 show the thermal results obtained in test 3. Figure 15 shows the measurements obtained by an IR thermographic camera from the front side of the PV module, while Figure 16 shows the measurements obtained by the thermocouples connected on the back side of the PV module. The thermal system behaviour was the same as that shown before in test 2.
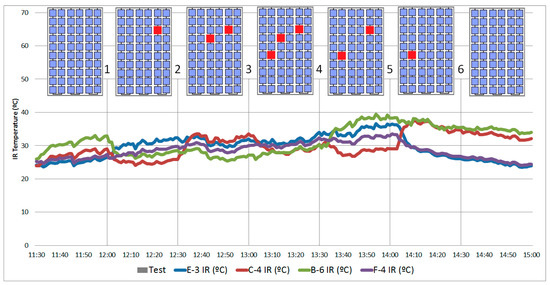
Figure 15.
IR thermographic camera temperatures on the front side of the PV module in test 3.
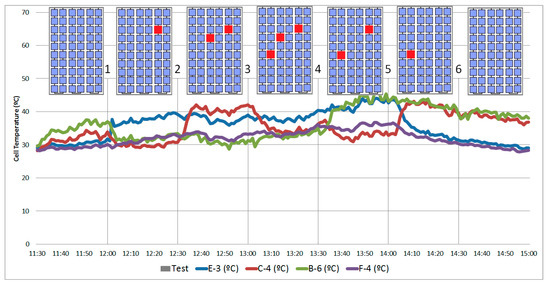
Figure 16.
Thermocouple temperatures on the back side of the PV module in test 3.
4. Conclusions
This article analyses the output current of the PV module, the bypass diode electrical behaviour, and the thermal response of a PV polycrystalline and monocrystalline module under conditions of shading or soiling. These conditions can occur in greenhouses with the possibility of dirt and shading of modules.
Both electrical and thermal PV module behaviour in shading or soiling depends strongly on the operation voltage point imposed by the system, turning on the bypass diode or not. If the PV module is operating under voltage values below the knee of the I–V curve, which means that the output current is still high, the covered PV cell limits the current through the sub-module. Therefore, the remaining current that can produce the uncovered cells belonging to other sub-modules is derived by the bypass diode of the covered cell sub-module. In this case, the covered PV cell will increase its temperature with regards to uncovered ones. This electrical behaviour is maintained until at least one cell of every sub-module is covered. Then, the total output current decays at very low values, and the bypass diodes don’t conduct any current or a very low value of it (mainly due to differences between the shading of different cells).
When the bypass diode is turned on, the temperature of it increases as a result of the circulation of the current. The temperature of the covered cell increases quickly, while the temperature of the rest of the cell belonging to the sub-module affected increases more slowly. It was noticed that a relationship exists between the bypass diode temperature and the current that flows through it.
Author Contributions
Conceptualization, G.Á.-T., C.G.-L., J.A.C.-B., and Á.G.-G.; methodology, G.Á.-T. and C.G.-L.; validation, R.J.-C.; formal analysis, G.Á.-T., C.G.-L., J.A.C.-B., and Á.G.-G; investigation, G.Á.-T., Á.G.-G., and J.A.C.-B.; data curation, G.Á.-T., C.G.-L., J.A.C.-B., and Á.G.-G.; writing—original draft preparation, C.G.-L., G.Á.-T., and J.A.C.-B.; writing—review and editing, C.G.-L., G.Á.-T., J.A.C.-B., and R.J.-C.; visualization, R.J.-C.; supervision, R.J.-C.; project administration, C.G.-L., G.Á.-T., and J.A.C.-B.
Funding
This research received no external funding.
Conflicts of Interest
The authors declare no conflict of interest.
Abbreviations
| Acronyms: | |
| PV | Photovoltaic |
| MPPT | Maximum power point tracking |
| IR | Infrared |
| MPP | Maximum power point |
| LMMP | Local maximum power point |
| GMPP | Global maximum power point |
| Nomenclature: | |
| Bypass diode current in the substring with the covered PV cell | |
| Total PV module current when | |
| Operating voltage of the solar PV module | |
| Open circuit PV module voltage | |
| Open circuit PV module voltage of the substring with the covered PV cell | |
| Number of PV cells in a substring protected by a bypass diode | |
| Crystalline silicon cell forward voltage | |
| Total PV module current when | |
References
- Al-Smadi, M.K.; Mahmoud, Y. Analysis of photovoltaic systems power losses in partial shading conditions. In Proceedings of the IECON 2018 44th Annual Conference of the IEEE Industrial Electronics Society, Washington, DC, USA, 21–23 October 2018; Volume 1, pp. 1699–1704. [Google Scholar]
- Meyer, E.L.; Van Dyk, E.E. Assessing the reliability and degradation of photovoltaic module performance parameters. IEEE Trans. Reliab. 2004, 53, 83–92. [Google Scholar] [CrossRef]
- Bazilian, M.D.; Kamalanathan, H.; Prasad, D.K. Thermographic analysis of a building integrated photovoltaic system. Renew. Energy 2002, 26, 449–461. [Google Scholar] [CrossRef]
- Joshi, A.S.; Dincer, I.; Reddy, B.V. Performance analysis of photovoltaic systems: A review. Renew. Sustain. Energy Rev. 2009, 13, 1884–1897. [Google Scholar] [CrossRef]
- Zhi, L.I.; Yano, A.; Cossu, M.; Yoshioka, H.; Kita, I.; Ibaraki, Y. Shading and electric performance of a prototype greenhouse blind system based on semi-transparent photovoltaic technology. J. Agric. Meteorol. 2018, 74, 114–122. [Google Scholar] [CrossRef]
- IEA-PVPS Task 13. Review of Failures of Photovoltaic Modules. Report IEA-PVPS T13-01. 2014. [Google Scholar]
- Munoz, M.A.; Alonso-García, M.C.; Vela, N.; Chenlo, F. Early degradation of silicon PV modules and guaranty conditions. Sol. Energy 2011, 85, 2264–2274. [Google Scholar] [CrossRef]
- Ishaque, K.; Salam, Z.; Syafaruddin. A comprehensive MATLAB Simulink PV system simulator with partial shading capability based on two-diode model. Sol. Energy 2011, 85, 2217–2227. [Google Scholar] [CrossRef]
- Mermoud, A.; Lejeune, T. Partial shadings on PV arrays: By-pass diode benefits analysis. In Proceedings of the 25th European Photovoltaic Solar Energy Conference, Valencia, Spain, 6–10 September 2010; pp. 6–10. [Google Scholar]
- IEC-61215-2. Part 2: Test Procedures. Terrestrial Photovoltaic (PV) Modules. Design Qualification and Type a Approval; International Electrotechnical Commission: Geneva, Switzerland, 2016. [Google Scholar]
- Tina, G.M.; Abate, R. Experimental Verification of Thermal Behaviour of Photovoltaic Modules. In Proceedings of the Mediterranean Electrotechnical Conference—MELECON, Ajaccio, France, 5–7 May 2008; pp. 579–584. [Google Scholar]
- Tina, G.M.; Scrofani, S. Electrical and thermal model for PV module temperature evaluation. In Proceedings of the Mediterranean Electrotechnical Conference—MELECON, Ajaccio, France, 5–7 May 2008; pp. 585–590. [Google Scholar]
- Rossa, C.; Martinez-Moreno, F.; Lorenzo, E. Reducing uncertainty in outdoors PV module characterisation. In Proceedings of the 35th European Photovoltaic Solar Energy Conference, Brussels, Belgium, 24–28 September 2018. [Google Scholar]
- Hu, Y.; Cao, W.; Ma, J.; Finney, S.J.; Li, D. Identifying PV module mismatch faults by a thermography-based temperature distribution analysis. IEEE Trans. Device Mater. Reliab. 2014, 14, 951–960. [Google Scholar] [CrossRef]
- Tsanakas, J.A.; Ha, L.; Buerhop, C. Faults and infrared thermographic diagnosis in operating c-Si photovoltaic modules: A review of research and future challenges. Renew. Sustain. Energy Rev. 2016, 62, 695–709. [Google Scholar] [CrossRef]
- King, D.L.; Kratochvil, J.A.; Quintana, M.A.; McMahon, T.J. Applications for infrared imaging equipment in photovoltaic cell, module, and system testing. In Proceedings of the Conference Record of 28th IEEE Photovoltaic Specialists Conference, Anchorage, AK, USA, 15–22 September 2000; Volume 2000, pp. 1487–1490. [Google Scholar]
- Moretón, R.; Lorenzo, E.; Narvarte, L. Experimental observations on hot-spots and derived acceptance/rejection criteria. Sol. Energy 2015, 118, 28–40. [Google Scholar] [CrossRef]
- Kaplani, E. Detection of Degradation Effects in Field-Aged c-Si Solar Cells through IR Thermography and Digital Image Processing. Int. J. Photoenergy 2012, 2012, 1–11. [Google Scholar] [CrossRef]
- Álvarez-Tey, G.; Jiménez-Castañeda, R.; Carpio, J. Analysis of the configuration and the location of thermographic equipment for the inspection in photovoltaic systems. Infrared Phys. Technol. 2017, 87, 40–46. [Google Scholar] [CrossRef]
- Toledo, C.; Serrano-Lujan, L.; Abad, J.; Lampitelli, A.; Urbina, A. Measurement of thermal and electrical parameters in photovoltaic systems for predictive and cross-correlated monitorization. Energies 2019, 12, 668. [Google Scholar] [CrossRef]
- IEC TS 62446-3. Part 3: Outdoor infrared thermography of photovoltaic modules and plants. In Photovoltaic (PV) Systems—Requirements for Testing, Documentation and Maintenance; International Electrotechnical Commission: Geneva, Switzerland, 2017. [Google Scholar]


© 2019 by the authors. Licensee MDPI, Basel, Switzerland. This article is an open access article distributed under the terms and conditions of the Creative Commons Attribution (CC BY) license (http://creativecommons.org/licenses/by/4.0/).