Abstract
Laser peen texturing (LPT) is a novelty way of surface texturing based on laser shock processing. One of the most important benefits of LPT is that it can not only fabricate surface textures but also induce residual compressive stress for the target material. However, the residual stress loss leads to partial loss of residual compressive stress and even causes residual tensile stress at the laser spot center. This phenomenon is not conducive to improving the mechanical properties of materials. In this study, a numerical simulation model of LPT was developed and validated by comparison of surface deformation with experiments. In order to investigate the phenomenon of residual stress loss quantitatively, an evaluation method of residual stress field was proposed. The effects of laser power density and laser spot radius on the residual stress, especially the residual stress loss, were systematically investigated. It is found that with the increase of laser power density or laser spot radius, the thickness of residual compressive layer in depth direction becomes larger. However, both the magnitude and the affecting zone size of residual stress loss will be increased, which implies a more severe residual stress loss phenomenon.
1. Introduction
Surface texturing is an effective way to reduce friction coefficient, improve bearing capacity, and wear resistance of friction systems [1,2,3,4]. As a typical pattern of texturing, dimple array plays an important role in improving friction and wear performances. On the one hand, dimples can reserve lubricant [5] and store wear debris [1]. On the other hand, dimples can act as micro-hydrodynamic bearings and improve bearing capacity of friction pair [6].
Many methods were proposed to create dimple array on different types of friction pairs. Ito et al. [7] produced dimples on a metal femoral head based on electrical etching. Zhang et al. [8] used a low frequency vibration machine to fabricate micro dimples, utilizing the vibration and impact effects of a pressure head. Roy et al. [9] fabricated micro dimples on ceramic-on-ceramic hip prostheses by using a drilling machine. Etsion et al. [10,11,12] systematically studied the texturing method of laser surface texturing (LST), which is based on the thermal effect of laser ablation. Reactive ion etching (RIE) was used to fabricate dimples on SiC material by Wang et al. [13,14]. All of these methods fabricated micro dimples successfully on material surface. Unfortunately, the above methods can cause local deformation of materials, but cannot achieve material reinforcement.
Laser peen texturing (LPT) is a new method for dimple fabrication based on laser shock processing (LSP). This process utilizes mechanical, rather than thermal, effects induced by laser shock, which effectively avoids the introduction of thermal-induced residual tensile stresses [15,16]. More importantly, LPT can produce deep residual compressive stress in target materials, which can significantly improve the fatigue life of materials [17]. Therefore, LPT can change both local deformation and mechanical properties.
However, one of the notable drawbacks of laser-shock-induced residual stress field is the relatively low residual compressive stress or even residual tensile stress at the laser spot center when laser shock pressure is greater than a threshold value. It looks as if the residual compressive stress is lost at the center of laser spot shocked zone. So, this phenomenon is called residual stress loss in this study. The residual stress loss is not conducive to improving the wear resistance, fatigue, and corrosion resistance, meanwhile, it is not conducive to making full use of laser energy [18]. So, it is necessary to study the distribution rule of residual stress and restrain the residual stress loss.
In the past two decades, as numerical simulation can capture local variations of transient stress much easier than experiments, many researches have been reported on the numerical simulation of residual stress field during and after LSP. For example, Zhang et al. [19] and Wu et al. [20] investigated the residual stress distribution on copper surface irradiated by micro-LSP and femtosecond LSP, respectively. Vasu et al. [21,22] developed 2D and 3D FEM models to analyze the residual stress values obtained from LSP on the curved geometries. Ding et al. [23] described a finite element method for simulating the residual stress distribution in multiple LSP. Brockman et al. [24] and Luo et al. [25] predicted residual stress fields by simulation after overlapping LSP. Zhang et al. [26] simulated the residual stress field in two sided LSP. Peyre et al. [18] found that the residual stress loss may be induced by release waves caused by rapid laser impact in longitudinal directions. Hu et al. [27] numerically investigated the reason for residual stress loss by analyzing the dynamic response of target material and found that square laser spot is more beneficial in restraining the residual stress loss than round laser spots.
At present, investigations on the residual stress field after LSP are numerous, however, the studies which are focused on residual stress loss are very limited. The aim of this study is to quantitatively evaluate the residual stress loss after LSP and investigate the effect of laser power density, as well as laser spot radius, on residual stress distribution, especially on residual stress loss, which might provide a basis for restraining the residual stress loss and optimizing the process of LPT.
2. Methods and Materials
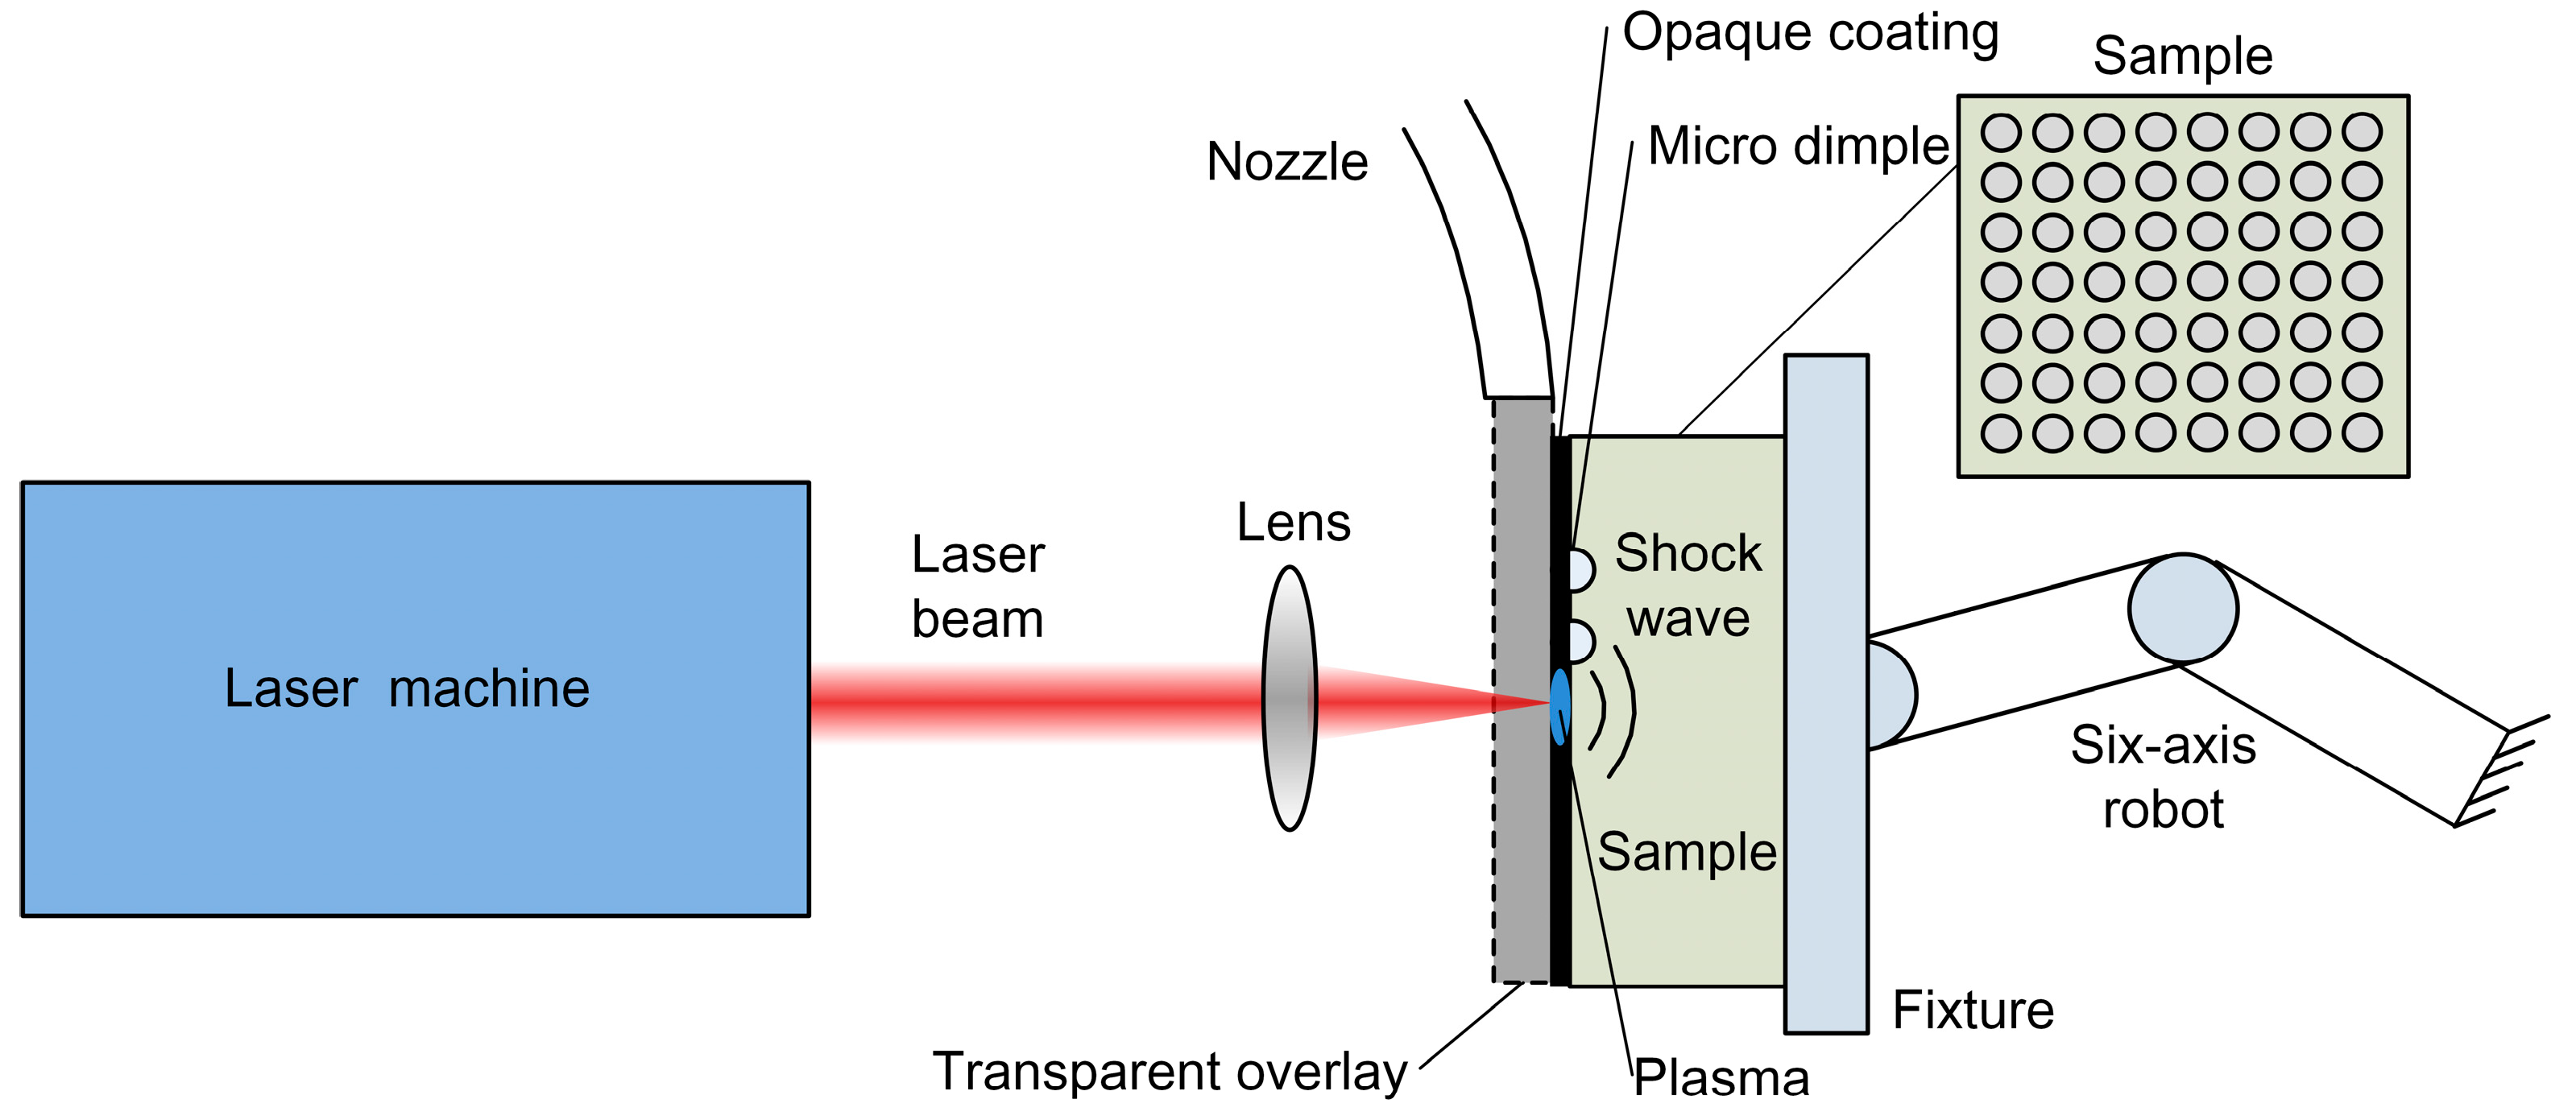
The schematic of laser peen texturing is shown in Figure 1 and the detailed processing method is as follows. The surface of the target material is first coated with an opaque coating and then covered by a transparent overlay (such as water, glass). The opaque coating is used to avoid the thermal effect and transparent overlay can confine the expanding plasma against the material surface. The generation process of the micro dimple are as follows: (1) opaque coating melts and vaporizes by absorbing energy of the laser, and then steam particles are generated; (2) steam particles ionize to plasma with high density and temperature; (3) the plasma expands rapidly away from the target material; (4) expansion of the plasma is constrained because of the confining effect of transparent overlay, and then a shock wave with high peak pressure (on the order of GPa) is generated [28]; (5) local plastic deformation occurs if the pressure is greater than the dynamic yield strength of the target material, and then a dimple is formed. Furthermore, through the movement of the six-axis robot, micro-dimple arrays can be fabricated. From the whole process, it is seen that LPT can avoid laser-induced thermal effect and can be regarded as a mechanical process.
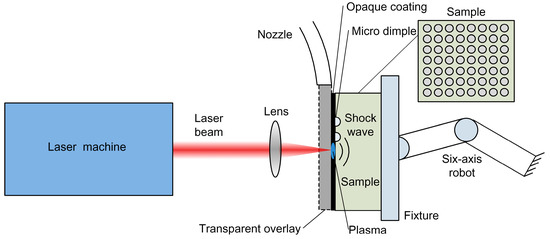
Figure 1.
Schematic of laser peen texturing.
The material of 316 L stainless steel, which are usually used as friction pairs, was adopted as the peened specimen. In the experimental study, the specimen was peened by a Q-switched Nd: YAG laser with pulse duration of 20 ns, laser spot radius of 400 μm, and four different laser power densities of 2.21 GW/cm2, 4.97 GW/cm2, 8.83 GW/cm2, and 13.80 GW/cm2. After LPT, the surface topography of the specimen was measured using a 3D optical surface profilometer (Keyence KS-1100).
3. Simulation Procedure
The finite element model was established by using the software of ABAQUS, which is good at solving complex nonlinear dynamic problems and quasi-static problems [29]. The simulation mainly includes four steps, which are specimen modeling, material definition, derivation of laser shock pressure, and calculation.
3.1. Specimen Modeling
Because the distribution of laser shock pressure is axisymmetric, the specimen is simulated by the axisymmetric elements, CAX4R, which is a type of reduced axisymmetric element with four nodes. Furthermore, infinite elements were used to simulate the non-reflecting boundary.
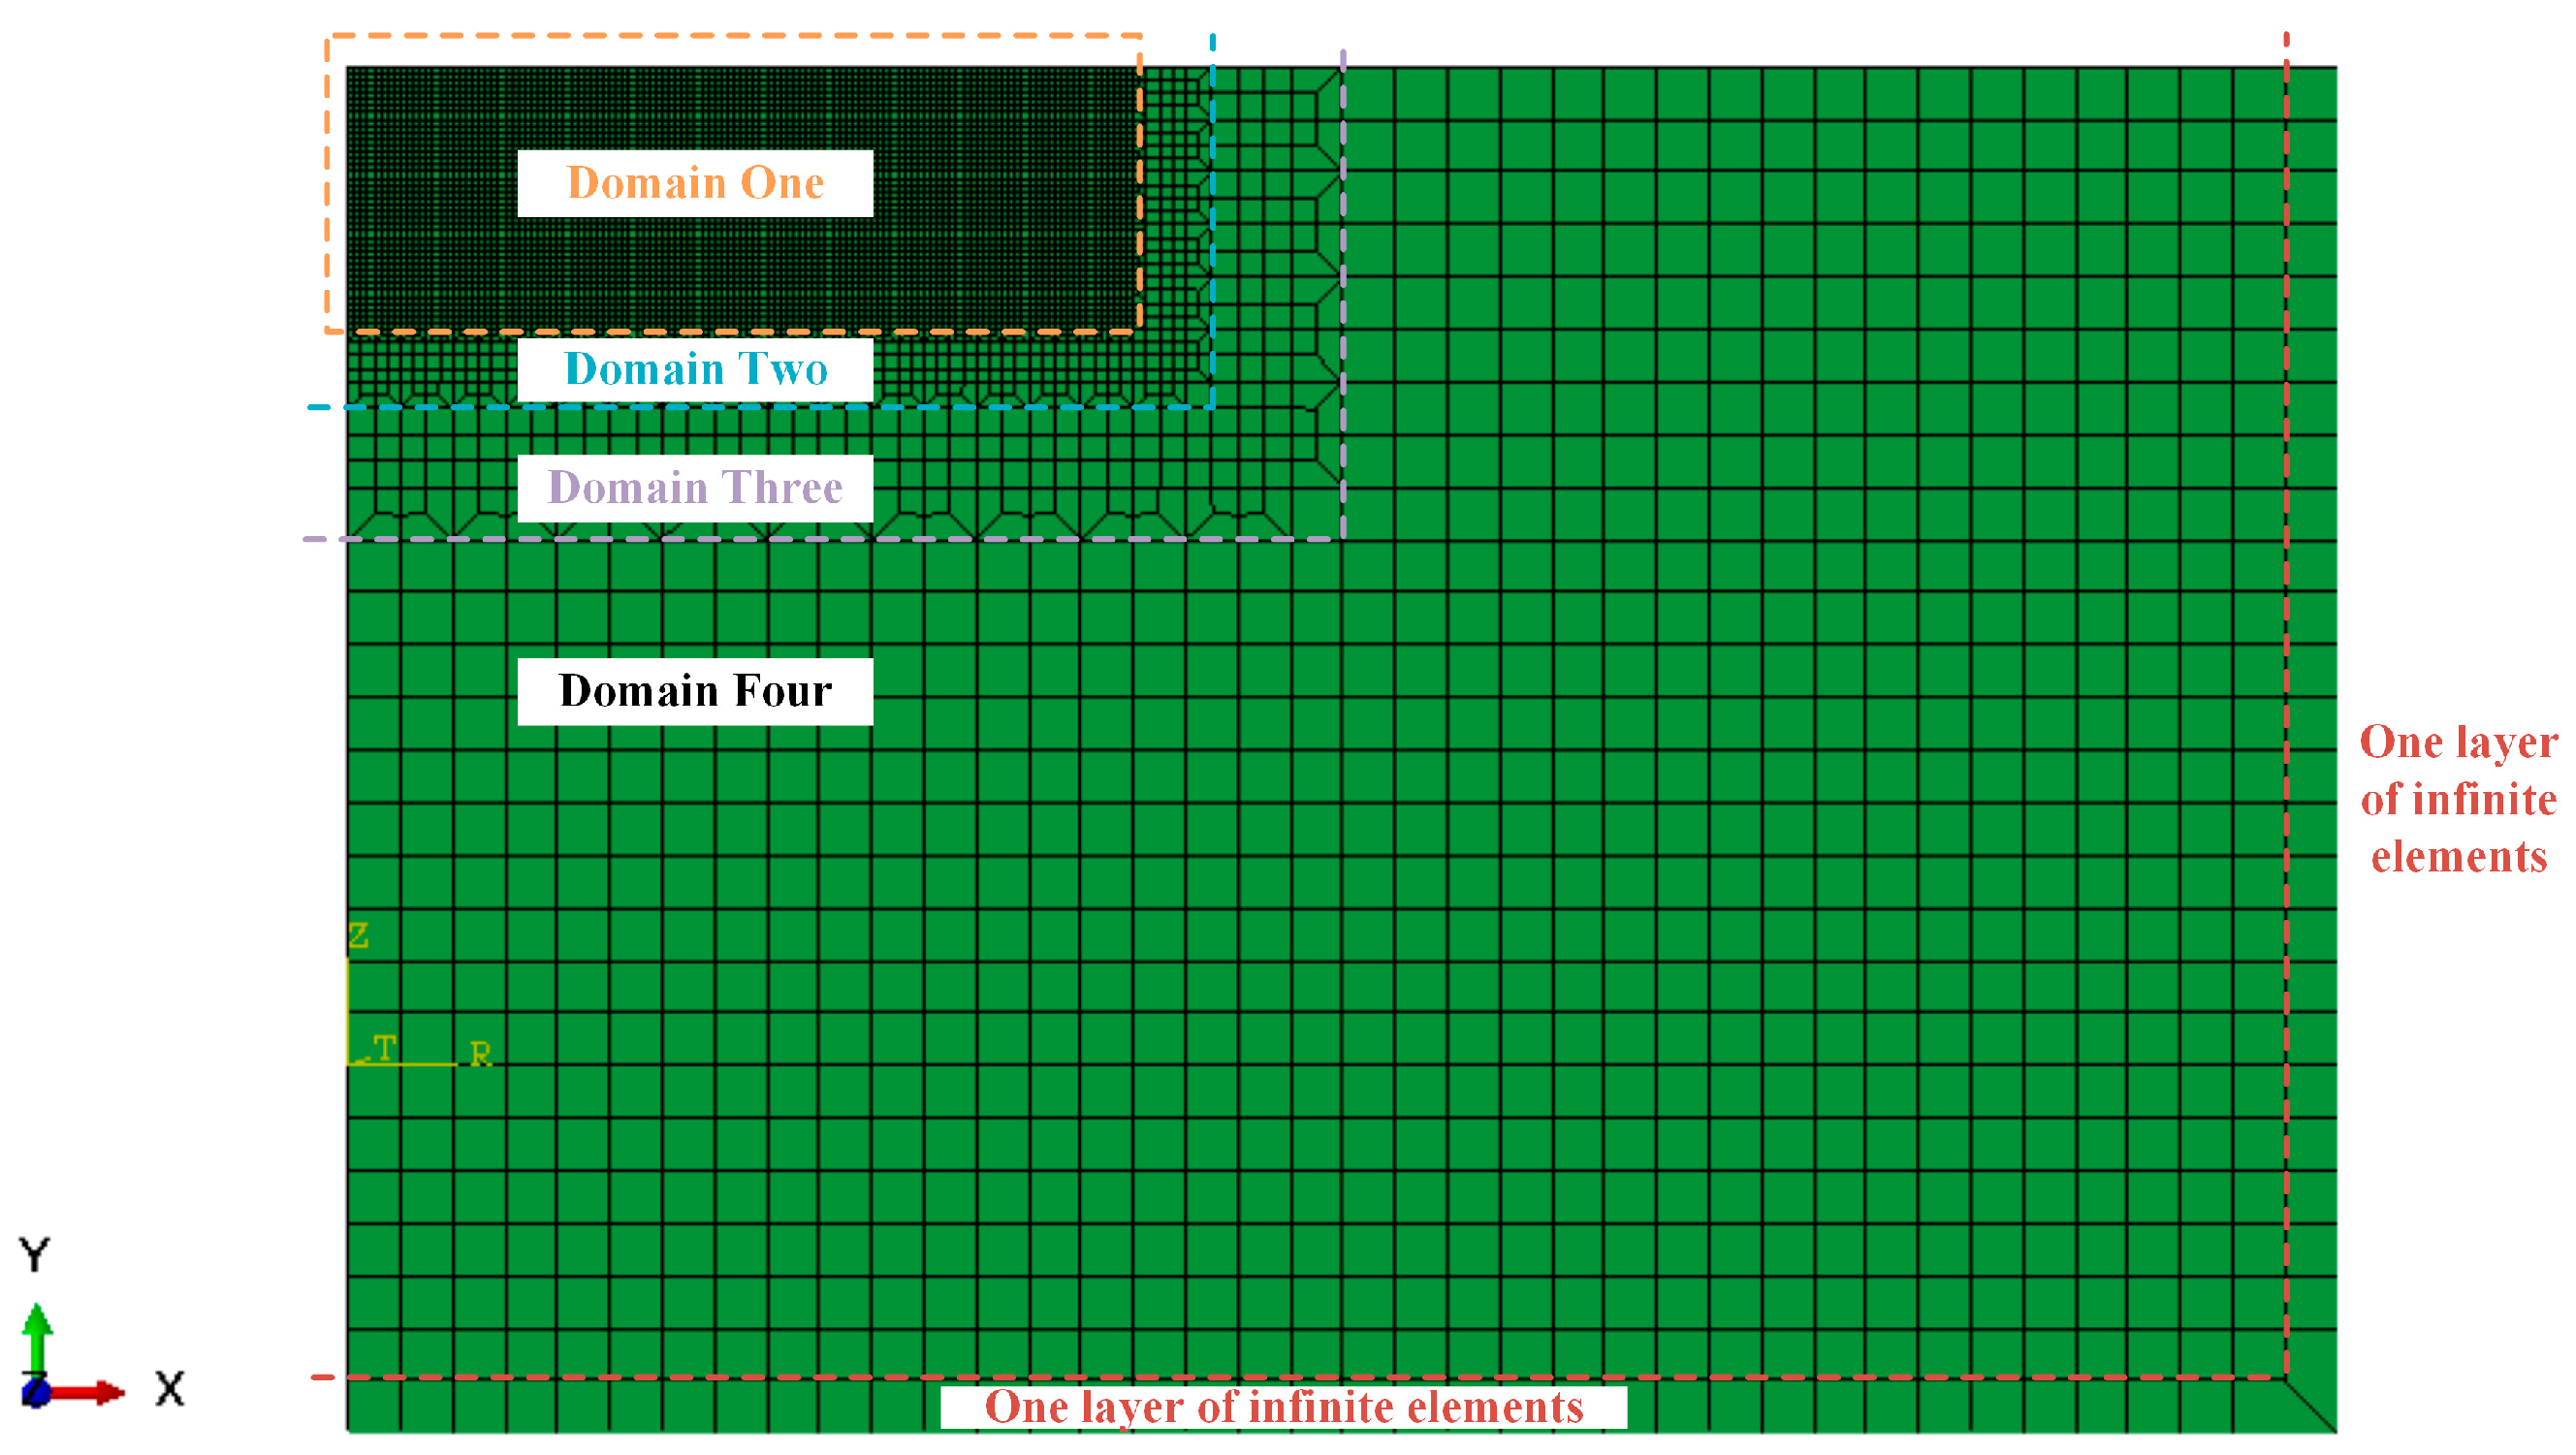
As shown in Figure 2, the simulation model includes four domains with different mesh sizes. Grid meshing strategy was obtained through grid independence analysis. Because the calculation precision of micro dimple depth is directly affected by mesh size, the depth of the dimple was regarded as the index of grid independence. The details of grid independence analysis are shown in Table 1. It is found that the micro dimple depth decreased with the decrease of mesh size. Moreover, small mesh size which means a large number of elements results in long calculation time. It is noted that the depth of micro dimple from case 4 to case 6 tends to be converged to a constant value within a satisfactory tolerance range of about 0.01%. Since the calculation time in case 4 is smaller than that in case 5 and case 6, the meshing strategy used in case 4 was selected for this study. Figure 2 shows the meshed specimen model.
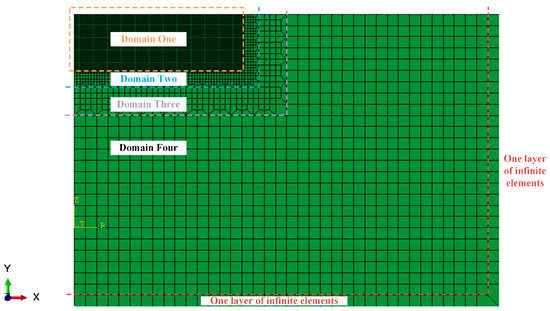
Figure 2.
The meshed specimen model.

Table 1.
Different meshing strategies.
3.2. Material Definition
In order to consider the effect of strain rate as well as the work hardening of the target material during LPT, Johnson-Cook model [30] was adopted as the constitutive model:
where σf is the Von-Mises stress, is equivalent strain, is rate of plastic strain, and is rate of reference plastic strain. The parameters T, T0, and Tm represent temperature, reference temperature, and melting point of the material, respectively. A, B, and n indicate the effect of work hardening. C reflects the strain rate effect and m represents the thermal effect.
As LPT only utilizes mechanical effect induced by lasers, Johnson-Cook model can be further simplified by omitting the parameter m which reflects thermal effect:
The properties of 316 L stainless steel used in simulation are listed in Table 2.
Table 2.
The properties of 316 L stainless steel [31].
3.3. Derivation of Laser Shock Pressure
The classic one-dimensional solution model proposed by Fabbro et al. [32] was used to calculate the laser shock pressure. According to this model, during laser shock processing, the laser intensity absorbed by the opaque coating is:
where t, AP, and I(t) represent the time, the energy absorption coefficient of the opaque coating, and the incident laser intensity, respectively.
Relationships between plasma thickness Lp(t) and plasma pressure p(t) are:
where Z1 is the shock impedance of the target material, Z2 is the shock impedance of the transparent overlay, and α is the ratio of plasma thermal energy to internal energy.
According to whether there is laser radiation or not, the interaction process of laser and material mainly include two stages: heating stage and adiabatic cooling stage.
Suppose that the initial thickness of the plasma is 0, that is Lp(0) = 0, and laser intensity is a constant value I0, then at the laser switched-off time Toff (Toff is equal to the laser pulse duration τ), the laser shock pressure and the thickness of the plasma can be obtained through Equations (4) and (6):
where p(Toff) is the laser shock peak pressure. Equation (7) describes the relationship between laser shock peak pressure and the laser intensity.
In the first stage (t < Toff), the thickness of the plasma and laser shock pressure can be expressed as:
where Lp0 is the initial plasma thickness. In the second stage (t > Toff), the thickness of the plasma and laser shock pressure could be obtained by:
where γ represents the ratio of specific heat.
The shock pressure of laser can be obtained through solving the equations from Equations (4) to (10) in MATLAB software. Figure 3 shows the typical solving result of laser shock pressure. It is seen that laser shock pressure reaches its maximum value (peak pressure) when the laser irradiation is off (at 20 ns). Table 3 shows the processing parameters of the simulation in this study.
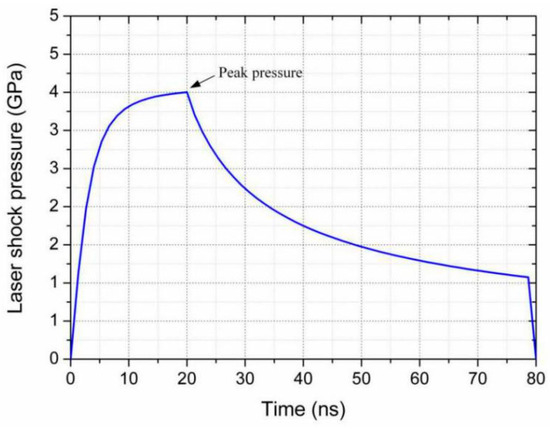
Figure 3.
Typical solving result of laser shock pressure.
Table 3.
Simulation parameters used in this study.
From Figure 3, it can be seen that laser shock pressure changes significantly with time. Actually, the shock pressure also changes with the radial distance away from the laser spot center. Because the distribution of laser energy follows the Gaussian distribution, the distribution of shock pressure is supposed to obey the Gaussian distribution [33] as well. Suppose r’ is the radial distance from the center of laser spot, laser shock pressure may be obtained by this equation:
3.4. Calculation
The explicit module ABAQUS/Explicit was used to study the dynamic response of the target material during LPT. The calculation time for transient analysis in this study was chosen based on the investigation of the time histories of plastic dissipation energy and kinetic energy (see Figure 4). It is noted that the plastic dissipation energy has been stable, and the kinetic energy has decreased to zero at 2000 ns, which indicates that the elasto-plastic deformation process has completed, so the calculation time for transient analysis was set as 2000 ns in the simulation. After transient analysis, the implicit module ABAQUS/Standard was used for spring back analysis.
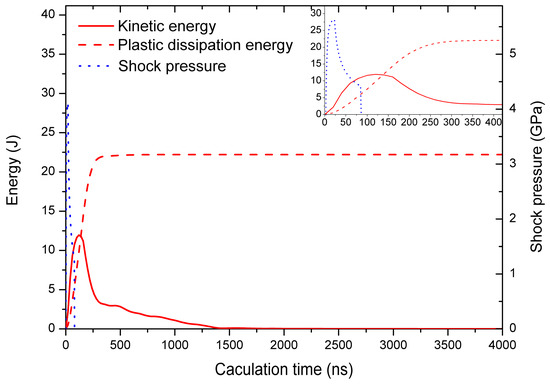
Figure 4.
Variations of kinetic energy and plastic dissipation energy in simulation.
4. Simulation Results and Discussion
4.1. Comparison of Dimple Profile and Depth between Experimental and Numerical Results
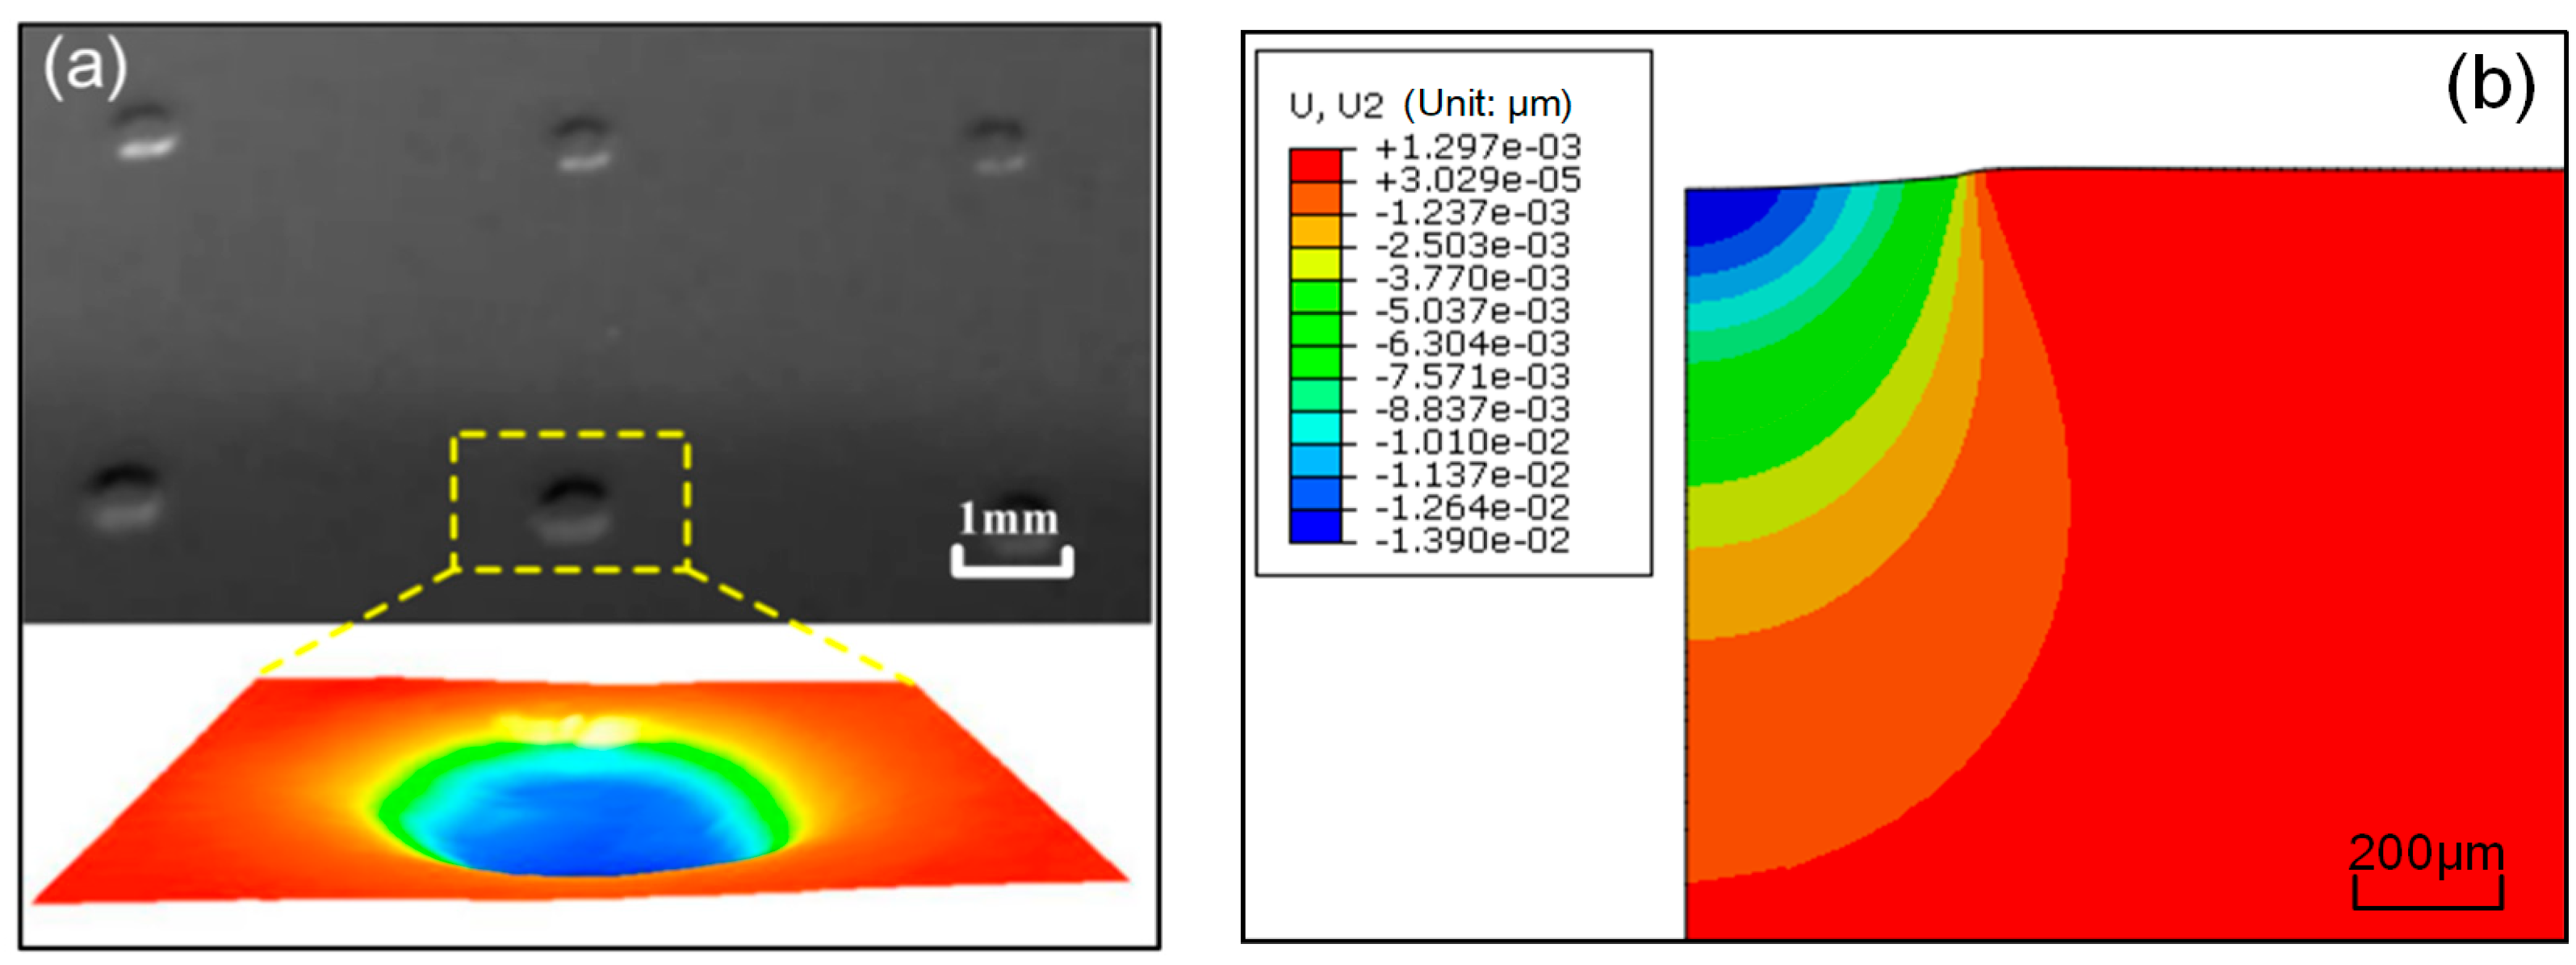
The simulation results were compared with experimentally measured ones in terms of dimple profile and dimple depth which could reflect the plastic deformation state of the specimen after LPT. The typical plastic deformation of the specimen after LPT is shown in Figure 5.
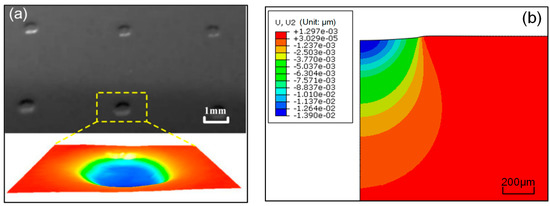
Figure 5.
The typical plastic deformation of the target material from (a) experimental result and (b) simulation result.
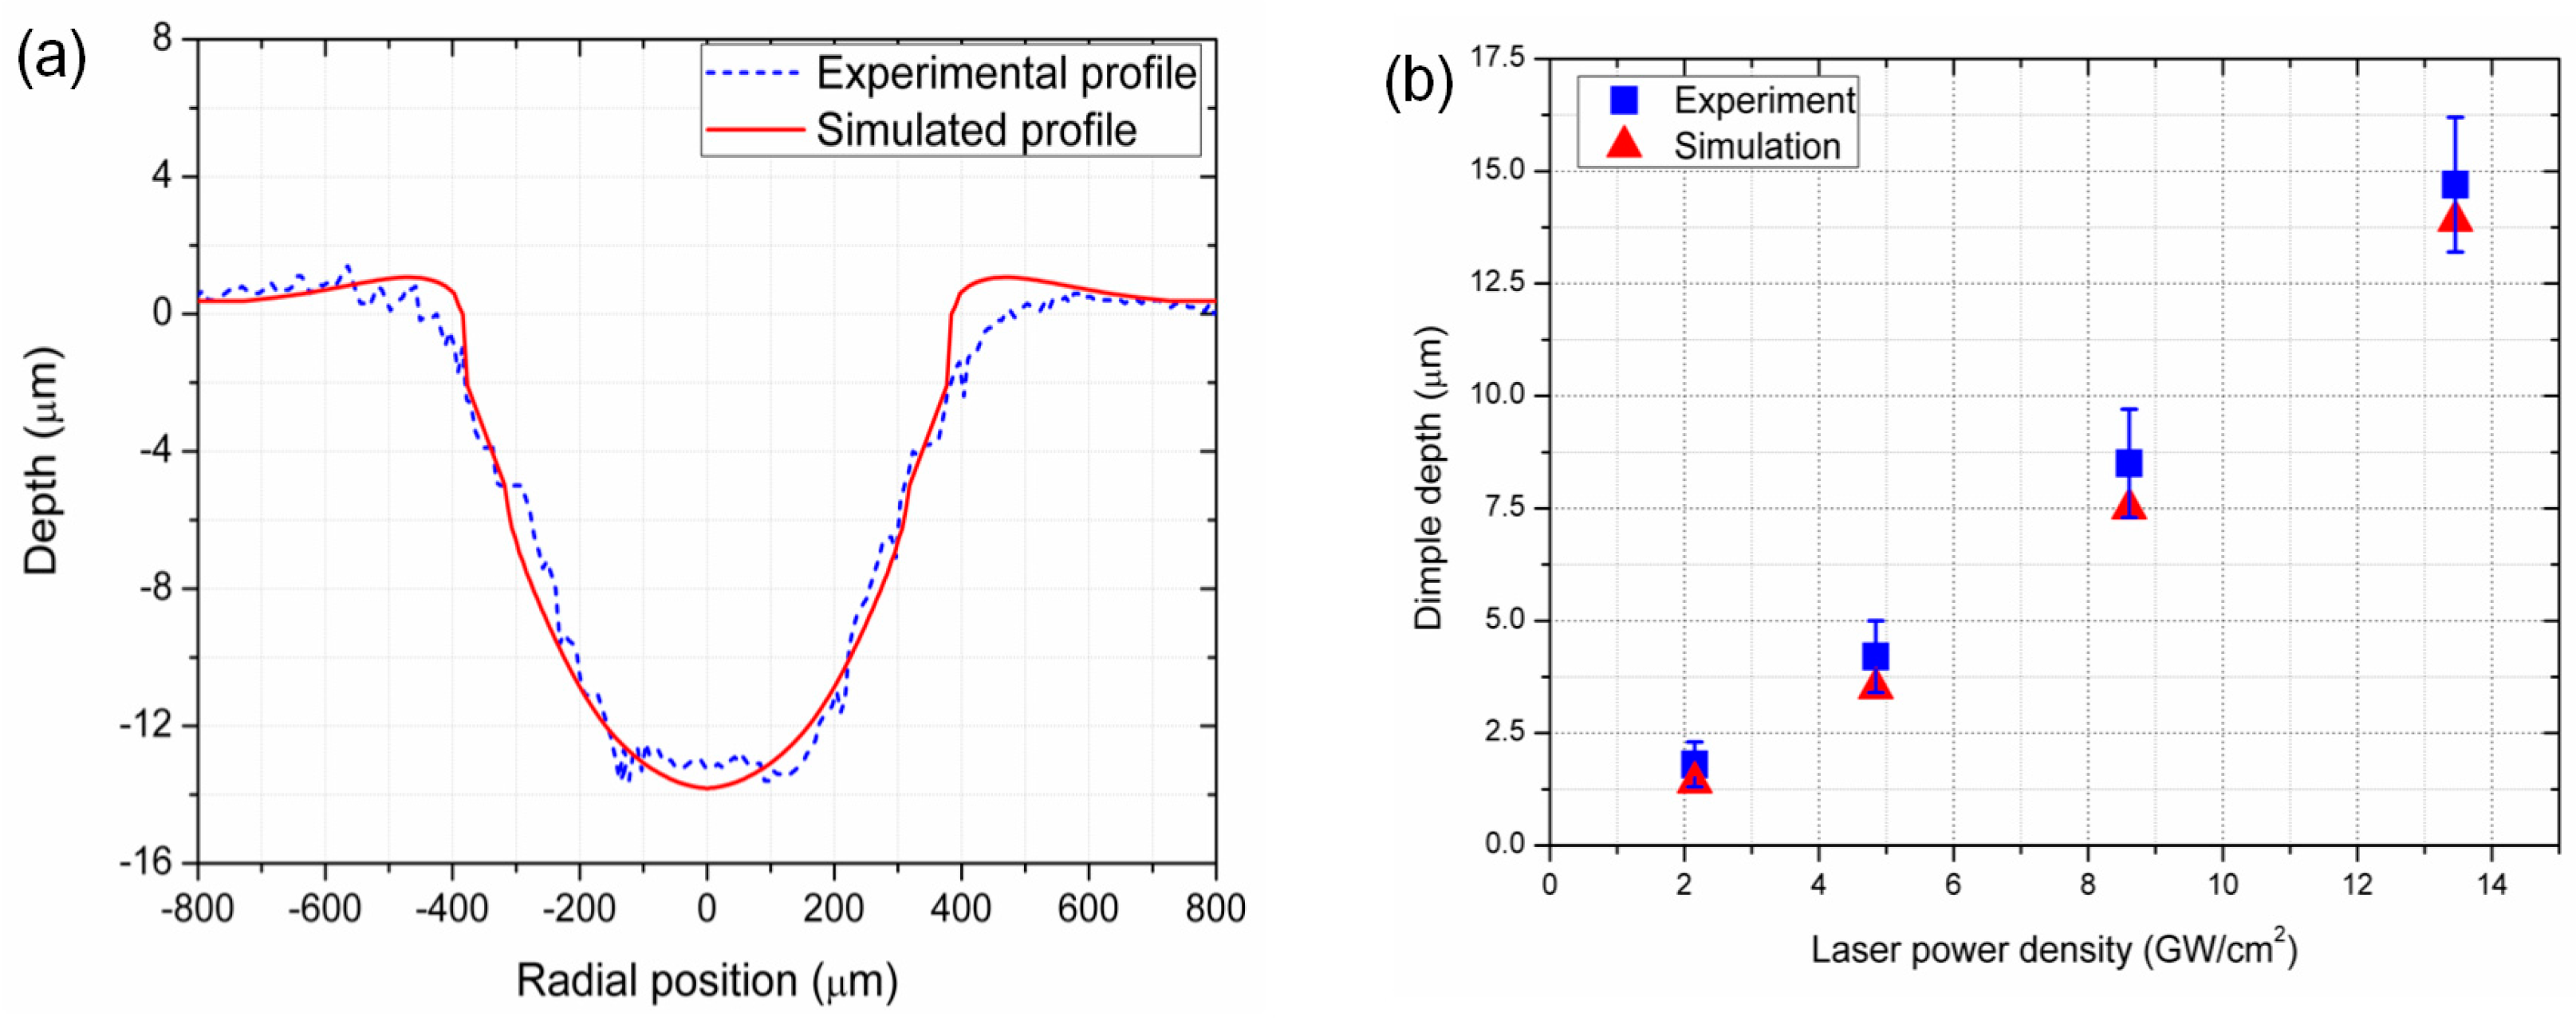
The comparison of typical dimple profile as well as dimple depth (see Figure 6) shows that the simulated results agree well with the experimental ones, which indicates the good accuracy of the simulation model.
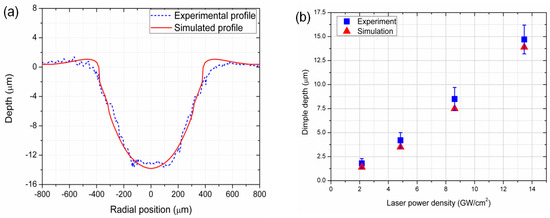
Figure 6.
Comparison between simulation and experiment (a) dimple profile (b) dimple depth.
4.2. Mechanism for the Generation of Residual Stress Loss
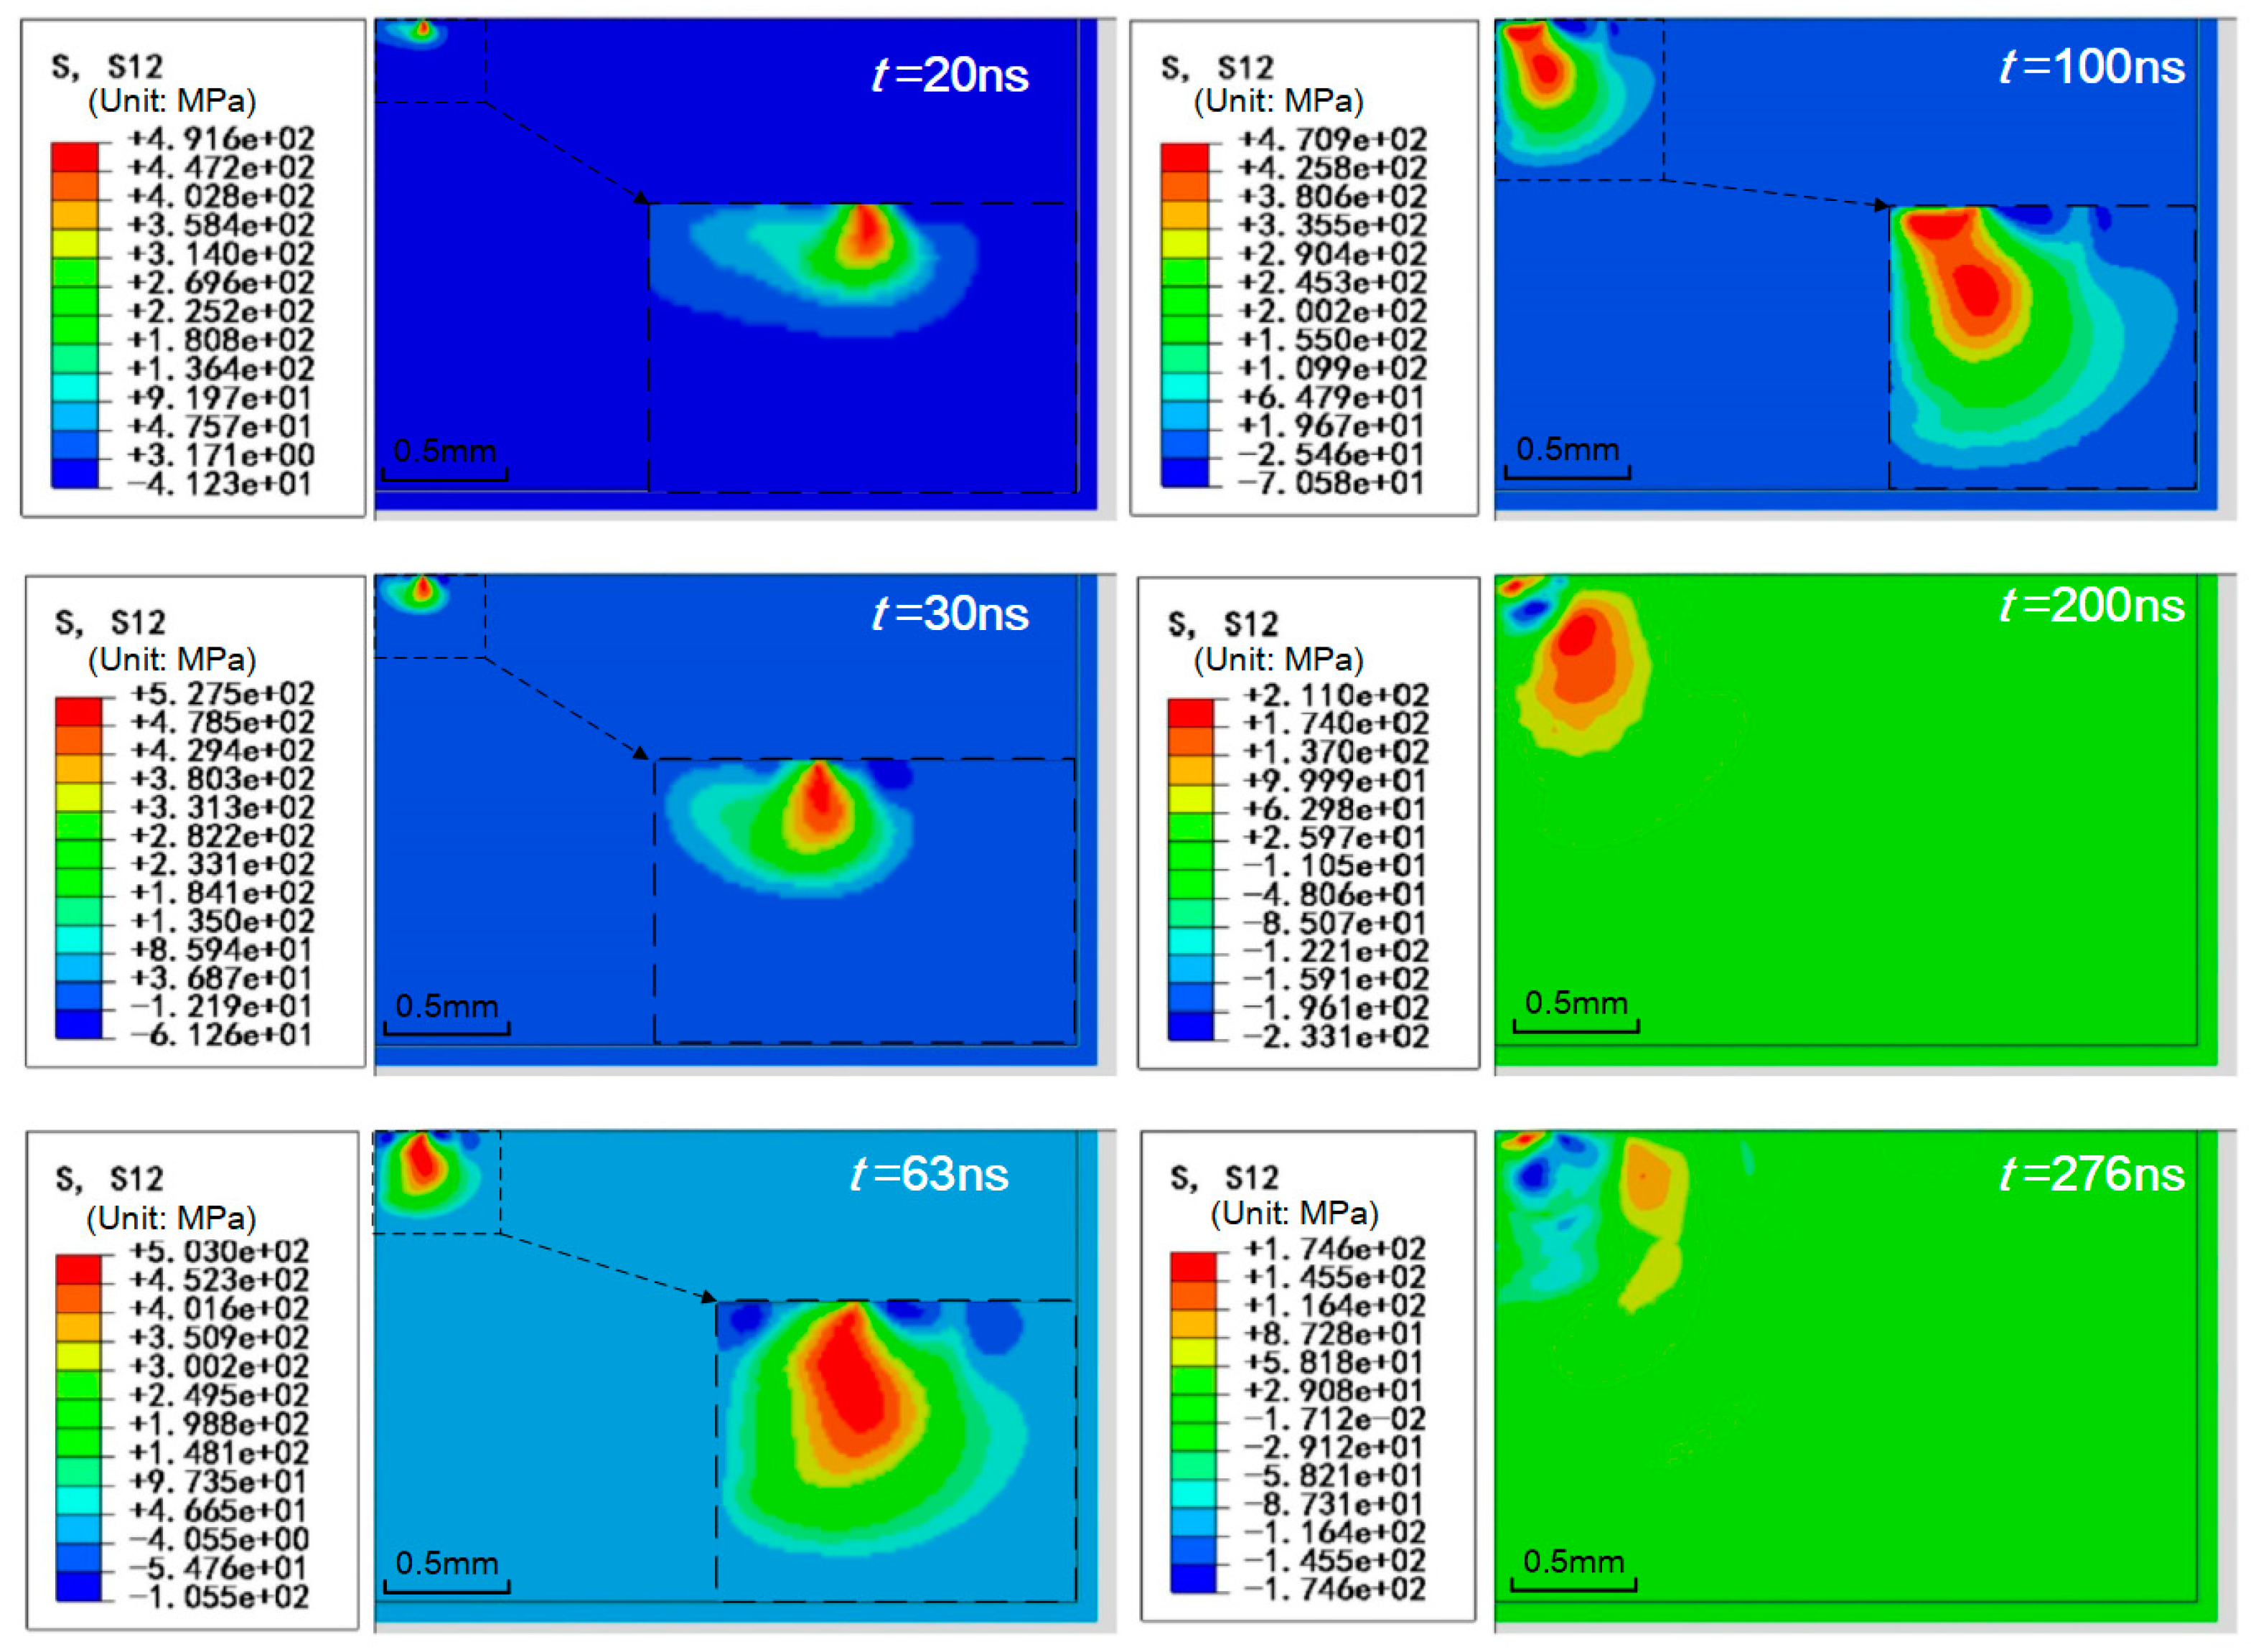
The investigation on the generation mechanism of residual stress loss will be helpful for understanding this phenomenon and explaining the effect of laser shock parameters on residual stress. In order to explore the relationship between residual stress loss and release waves, the release waves at different solution time are obtained from the simulation with a laser power density of 4.97 GW/cm2 and a laser spot radius of 200 μm (see Figure 7).
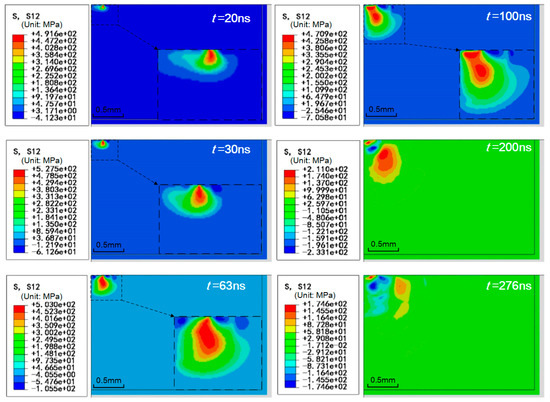
Figure 7.
Release waves at different solution time (I0 = 4.97 GW/cm2, R = 200 μm).
It is found from Figure 7 that the release wave generates at the edge of the laser spot and reaches the maximum at about 30 ns. After stopping laser radiation, the release wave continues to propagate along the spot center and longitudinal direction and arrives at the spot center at about 100 ns. Then, the release wave propagates towards the edge of the spot again, but it attenuates gradually.
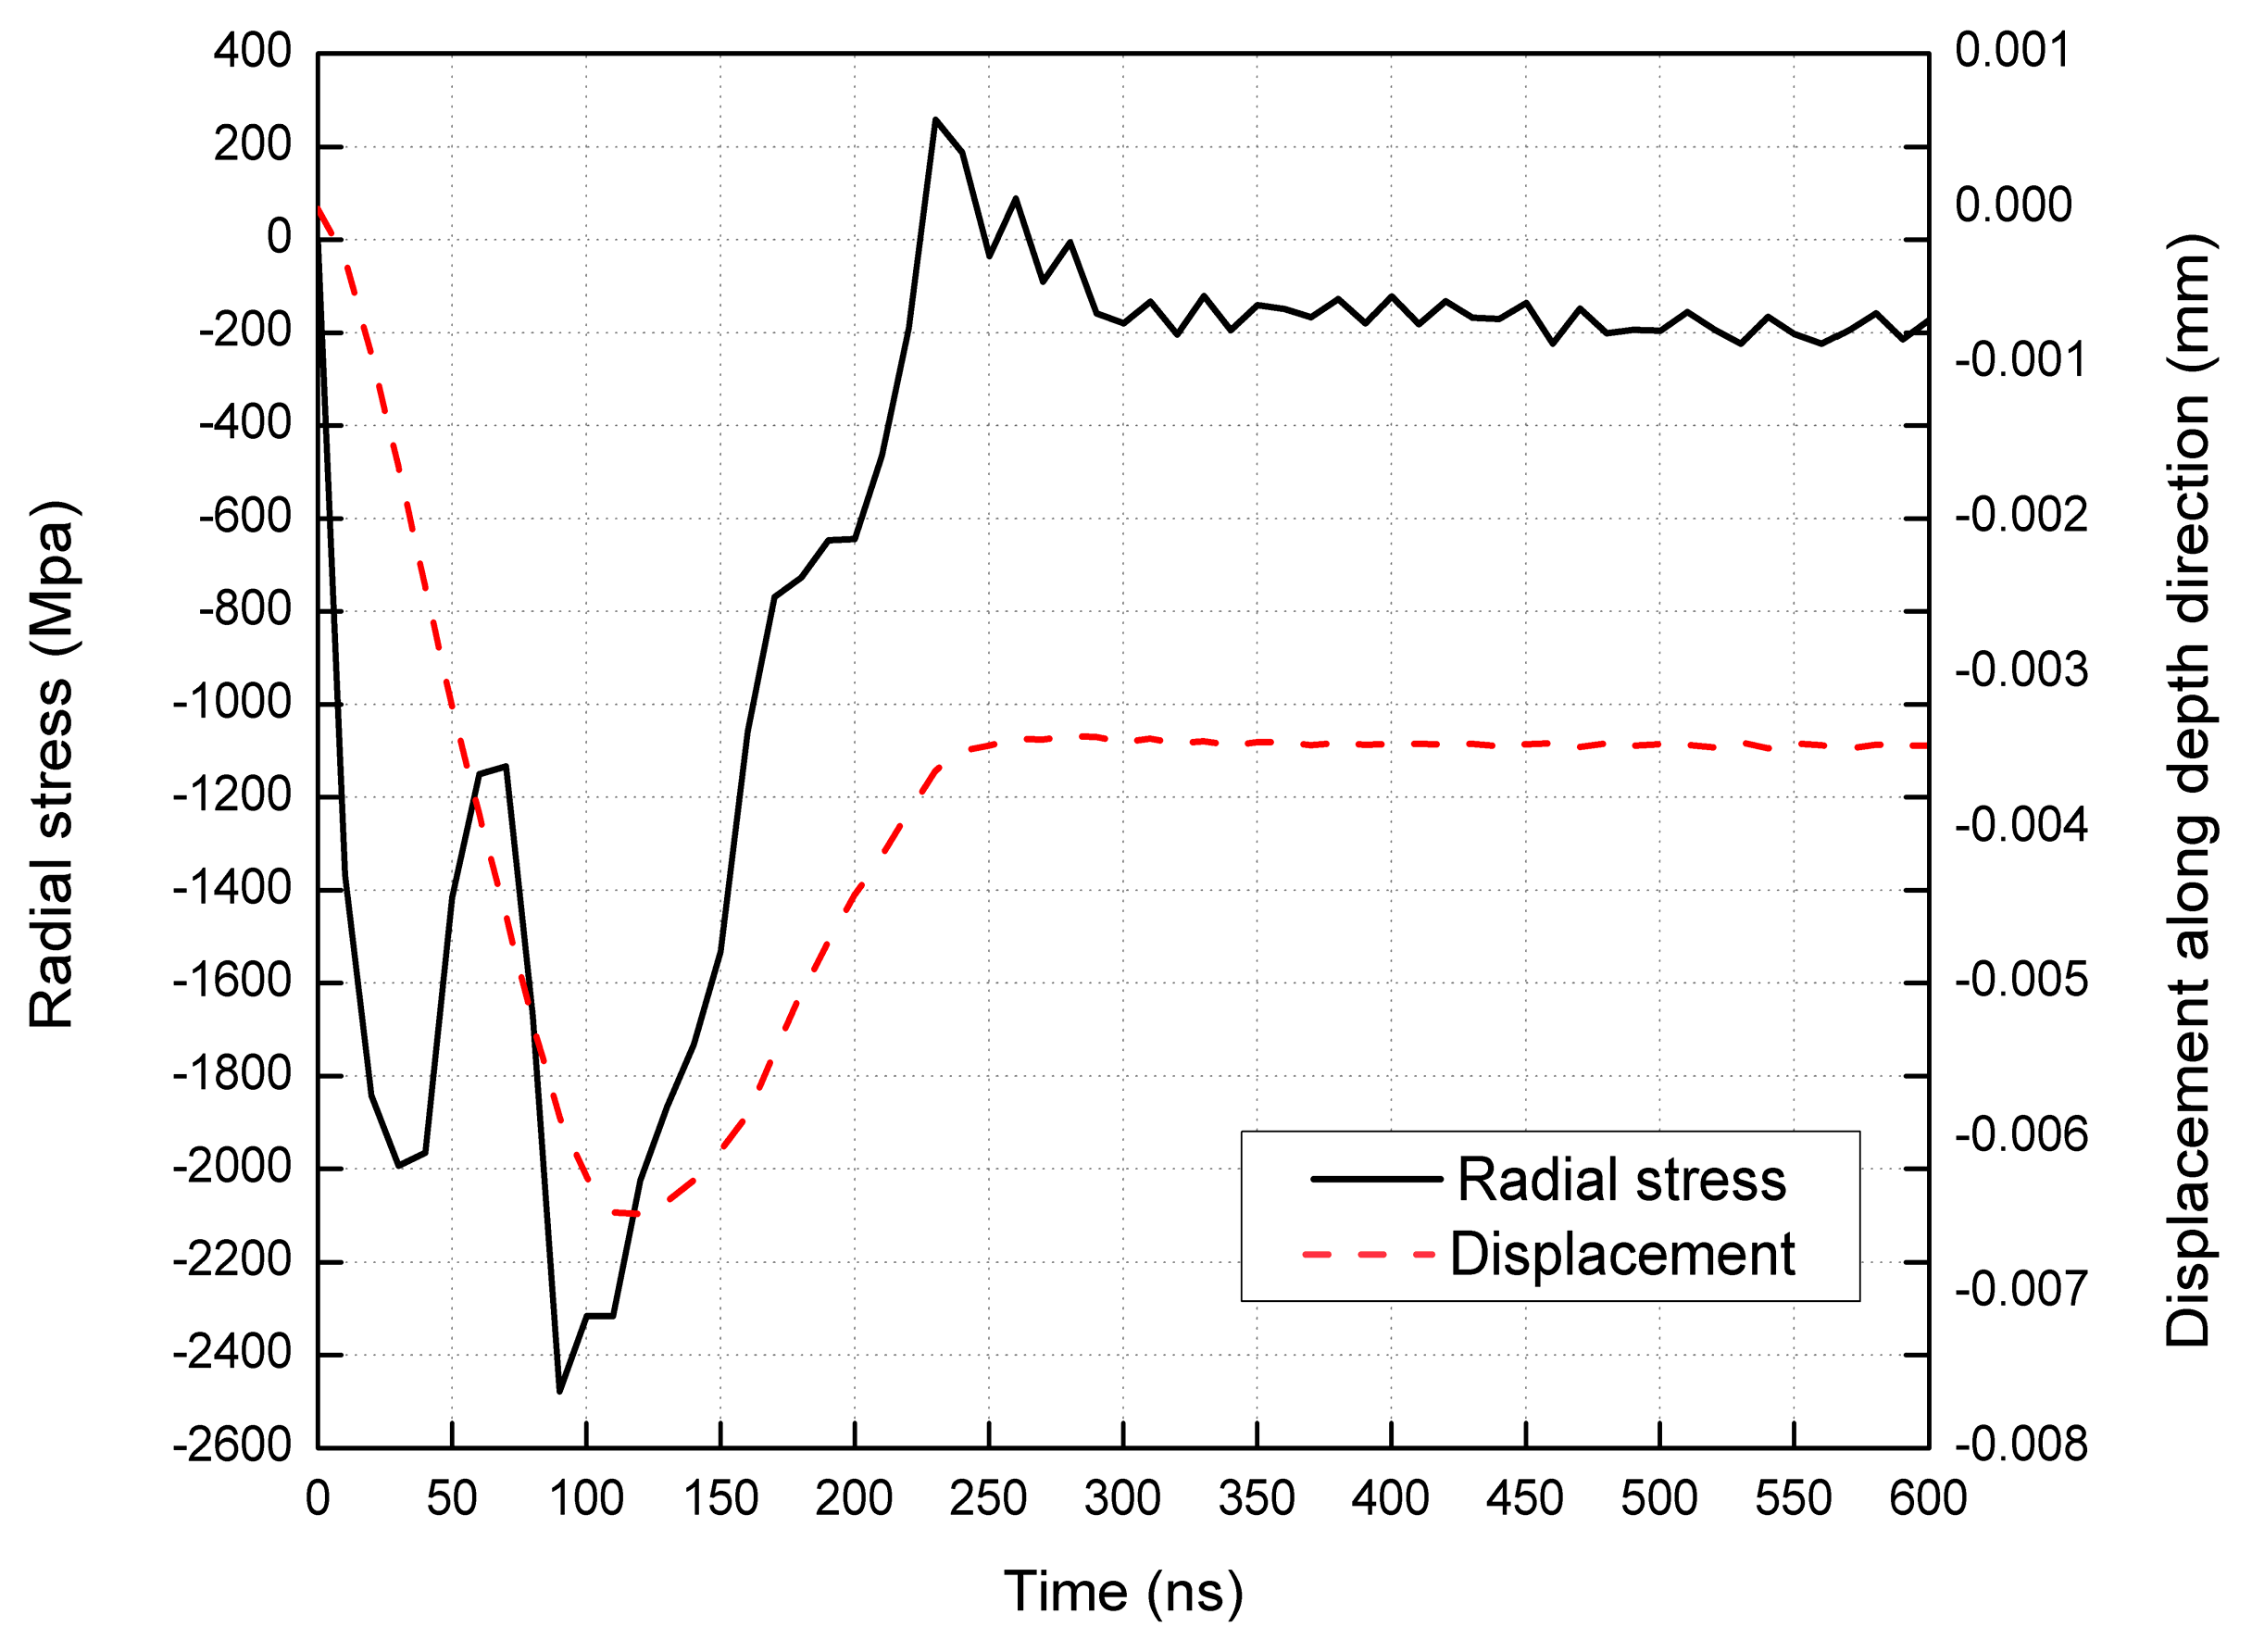
Furthermore, the time histories of the radial stress and the displacement of the laser spot center due to surface deformation are obtained, as shown in Figure 8. When the solution time increases from 100 ns to 230 ns, the radial stress changes from compressive stress −2478 MPa to tensile stress 257 MPa. After 230 ns, although the release wave attenuates to a low level and the stress state at the spot center gets back to compression, the radial stress tends to be stable at −221 MPa, which is much higher than the minimum radial stress of −2478 MPa. Generally speaking, the radial stress and the displacement have sharp changes at about 100 ns at which the release wave reaches the spot center, as shown in Figure 7. This validates that release wave has a close relationship with the residual stress loss, as Peyre et al. [18] put forward.
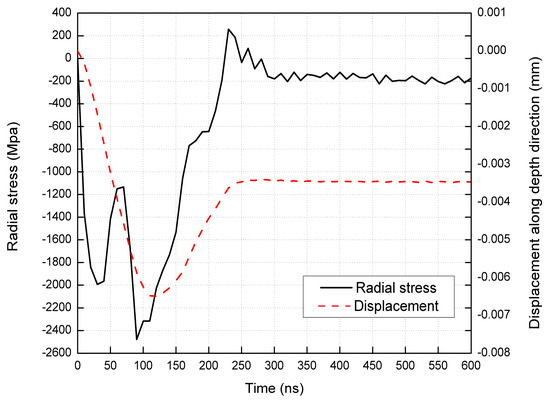
Figure 8.
Radial stress and displacement of the laser spot center along depth direction at different solution time (I0 = 4.97 GW/cm2, R = 200 μm).
Through the above analysis, the generation of the residual stress loss can be summarized as follows: Under the loading of laser shock pressure, the material inside of the laser spot is compressed in the depth direction. But in the radial direction, the material expands first and then the expansion is confined by surrounding materials. Release wave occurs at the edge of the spot and propagates towards the spot center. When it arrives at the center, the reverse loading is generated, which makes the material compressive in the radial direction and expands in the depth direction. If the shock pressure exceeds a certain value, reverse plastic deformation will be induced by the release wave, which will weaken the limitation of the surrounding material on the spot of the laser. As a result, the compressive stress at laser spot center will decrease and even become tensile stress if the reverse plastic deformation is severe enough.
4.3. Evaluation Method of Residual Stress Field
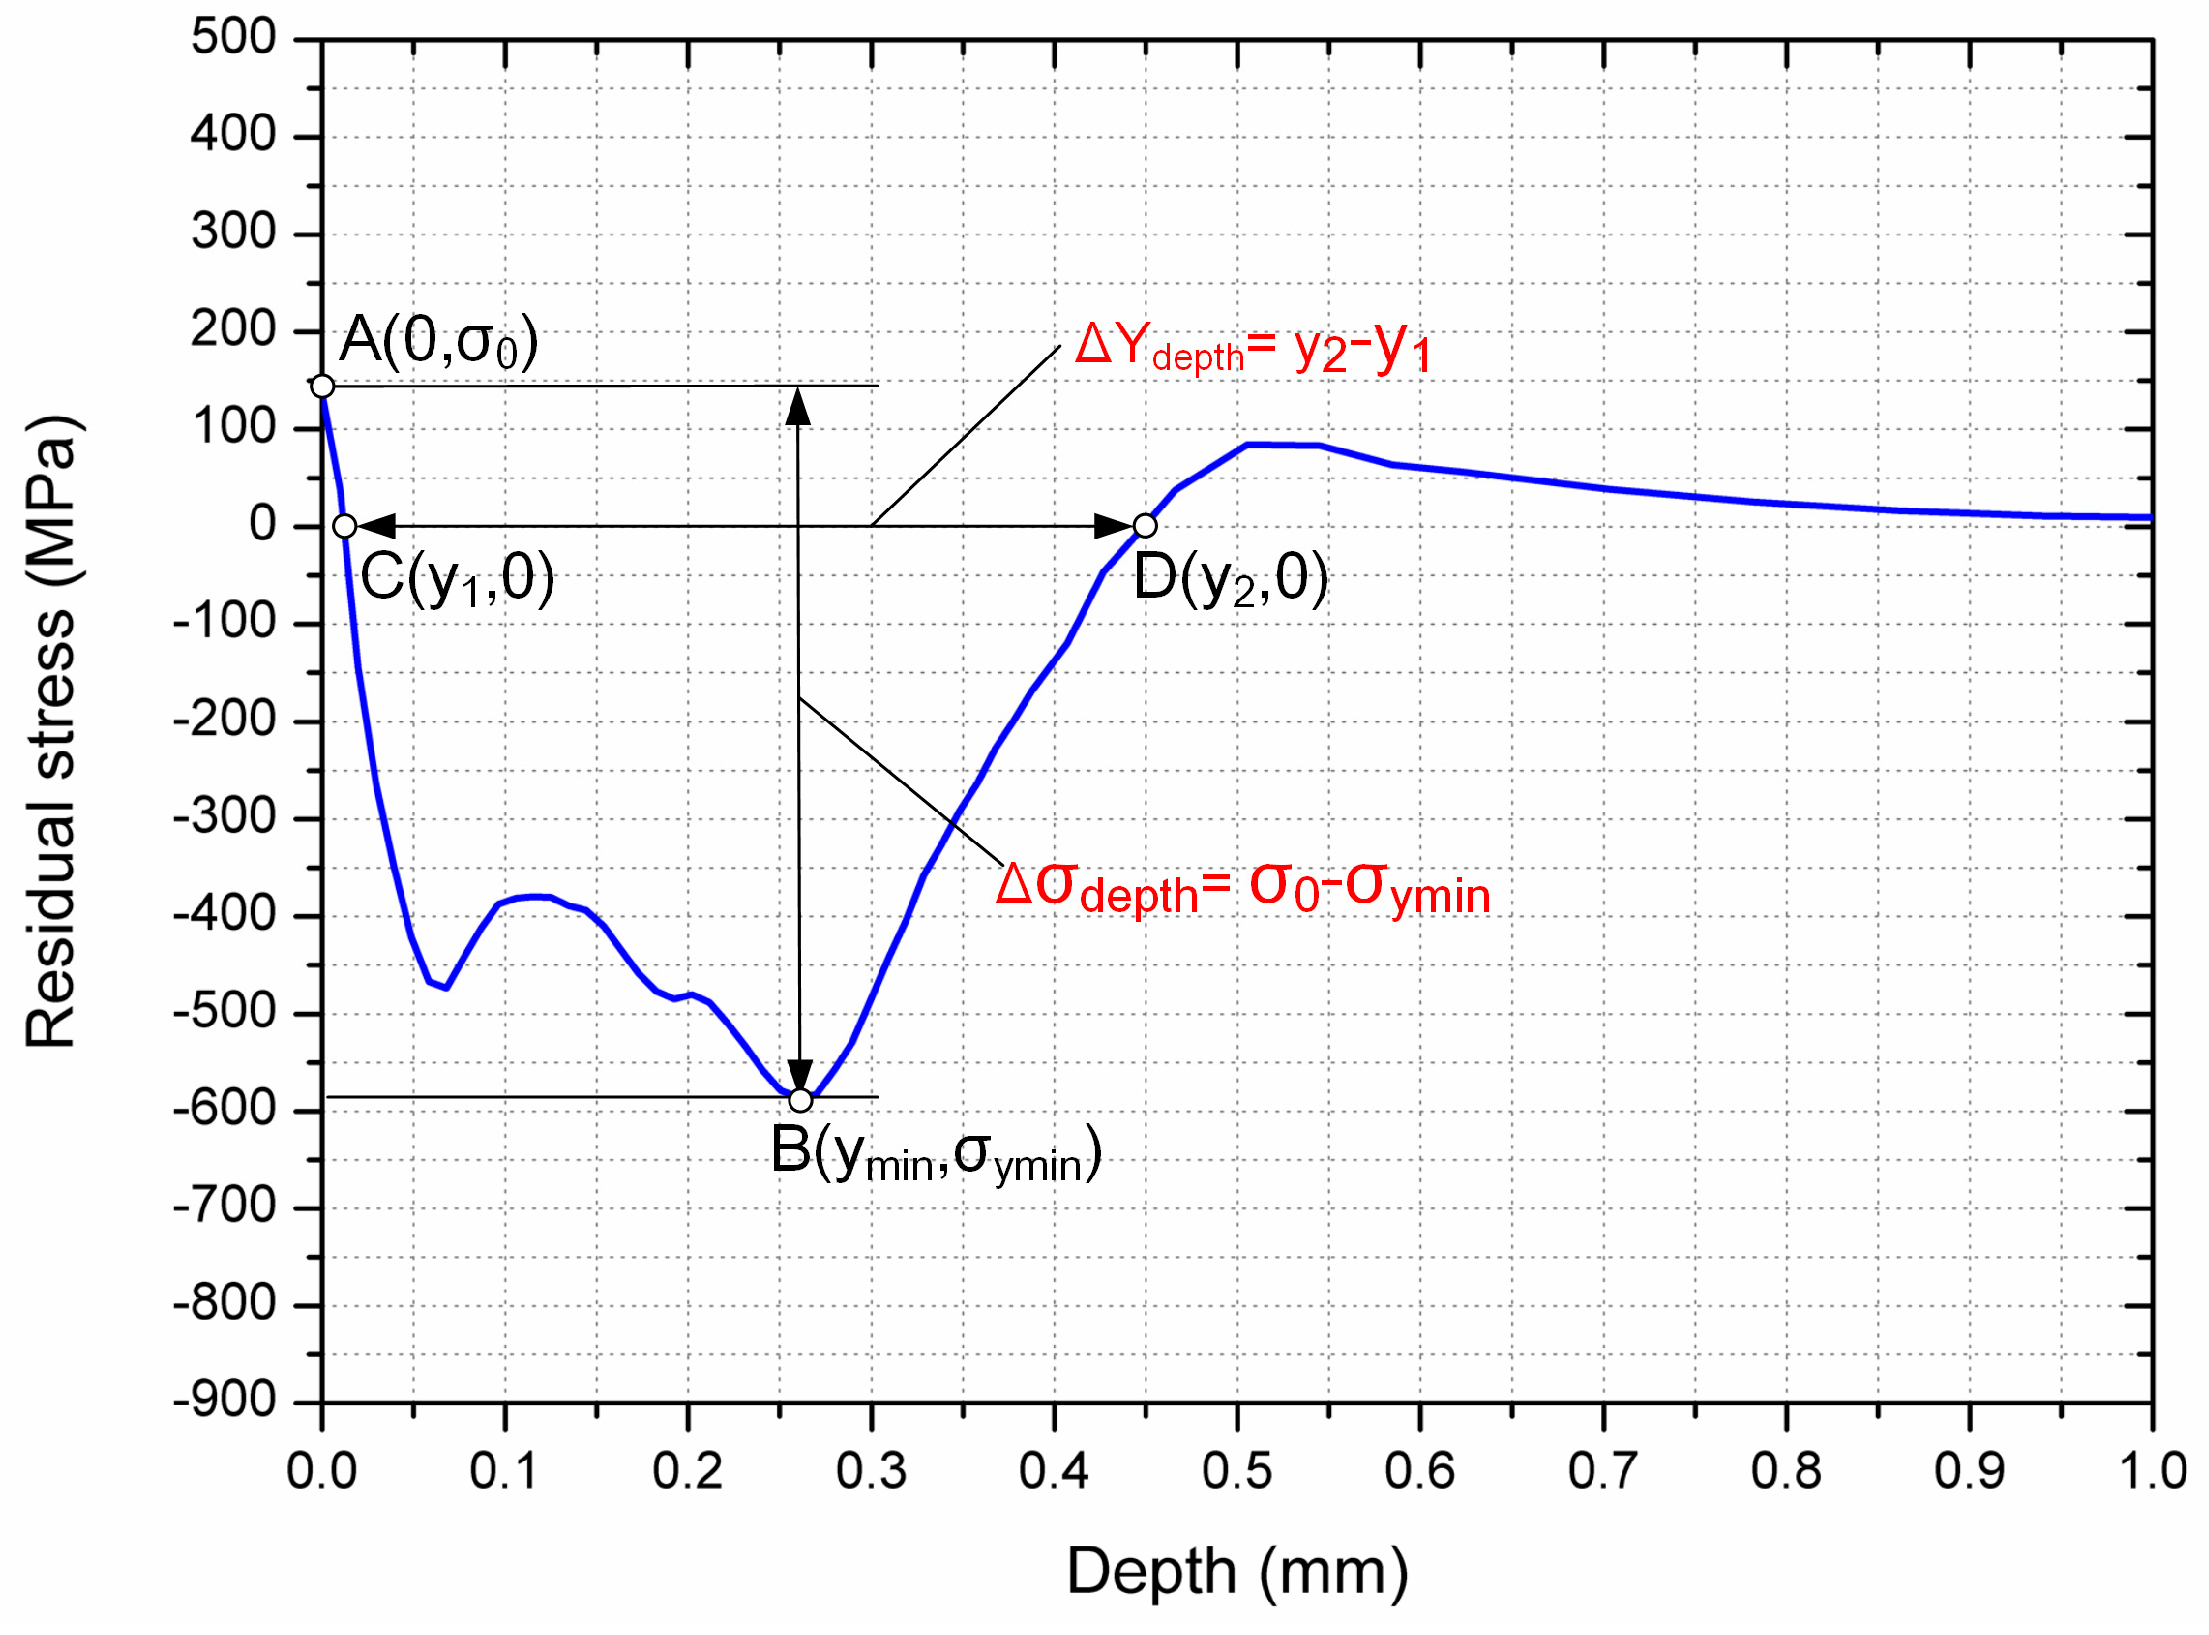
For the purpose of quantitatively evaluating the residual stress field, especially the residual stress loss, the typical residual stress curve of the laser spot center along depth direction is shown in Figure 9 and Figure 10 and shows the typical residual stress curve of the specimen surface.
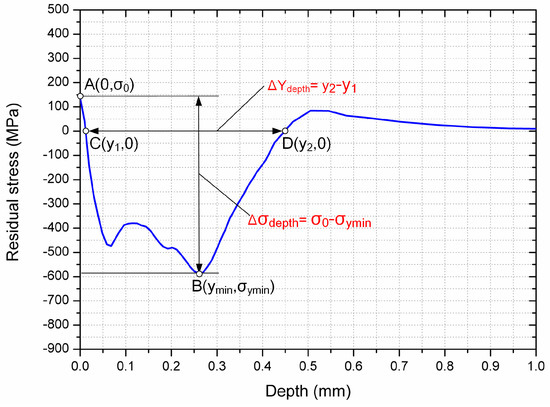
Figure 9.
Typical residual stress curve of the laser spot center along depth direction (I0 = 8.83 GW/cm2, R = 200 μm).
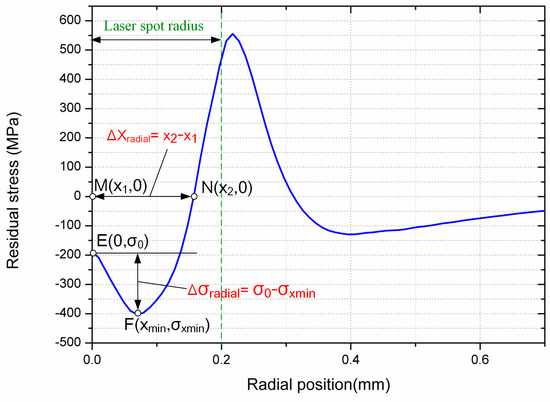
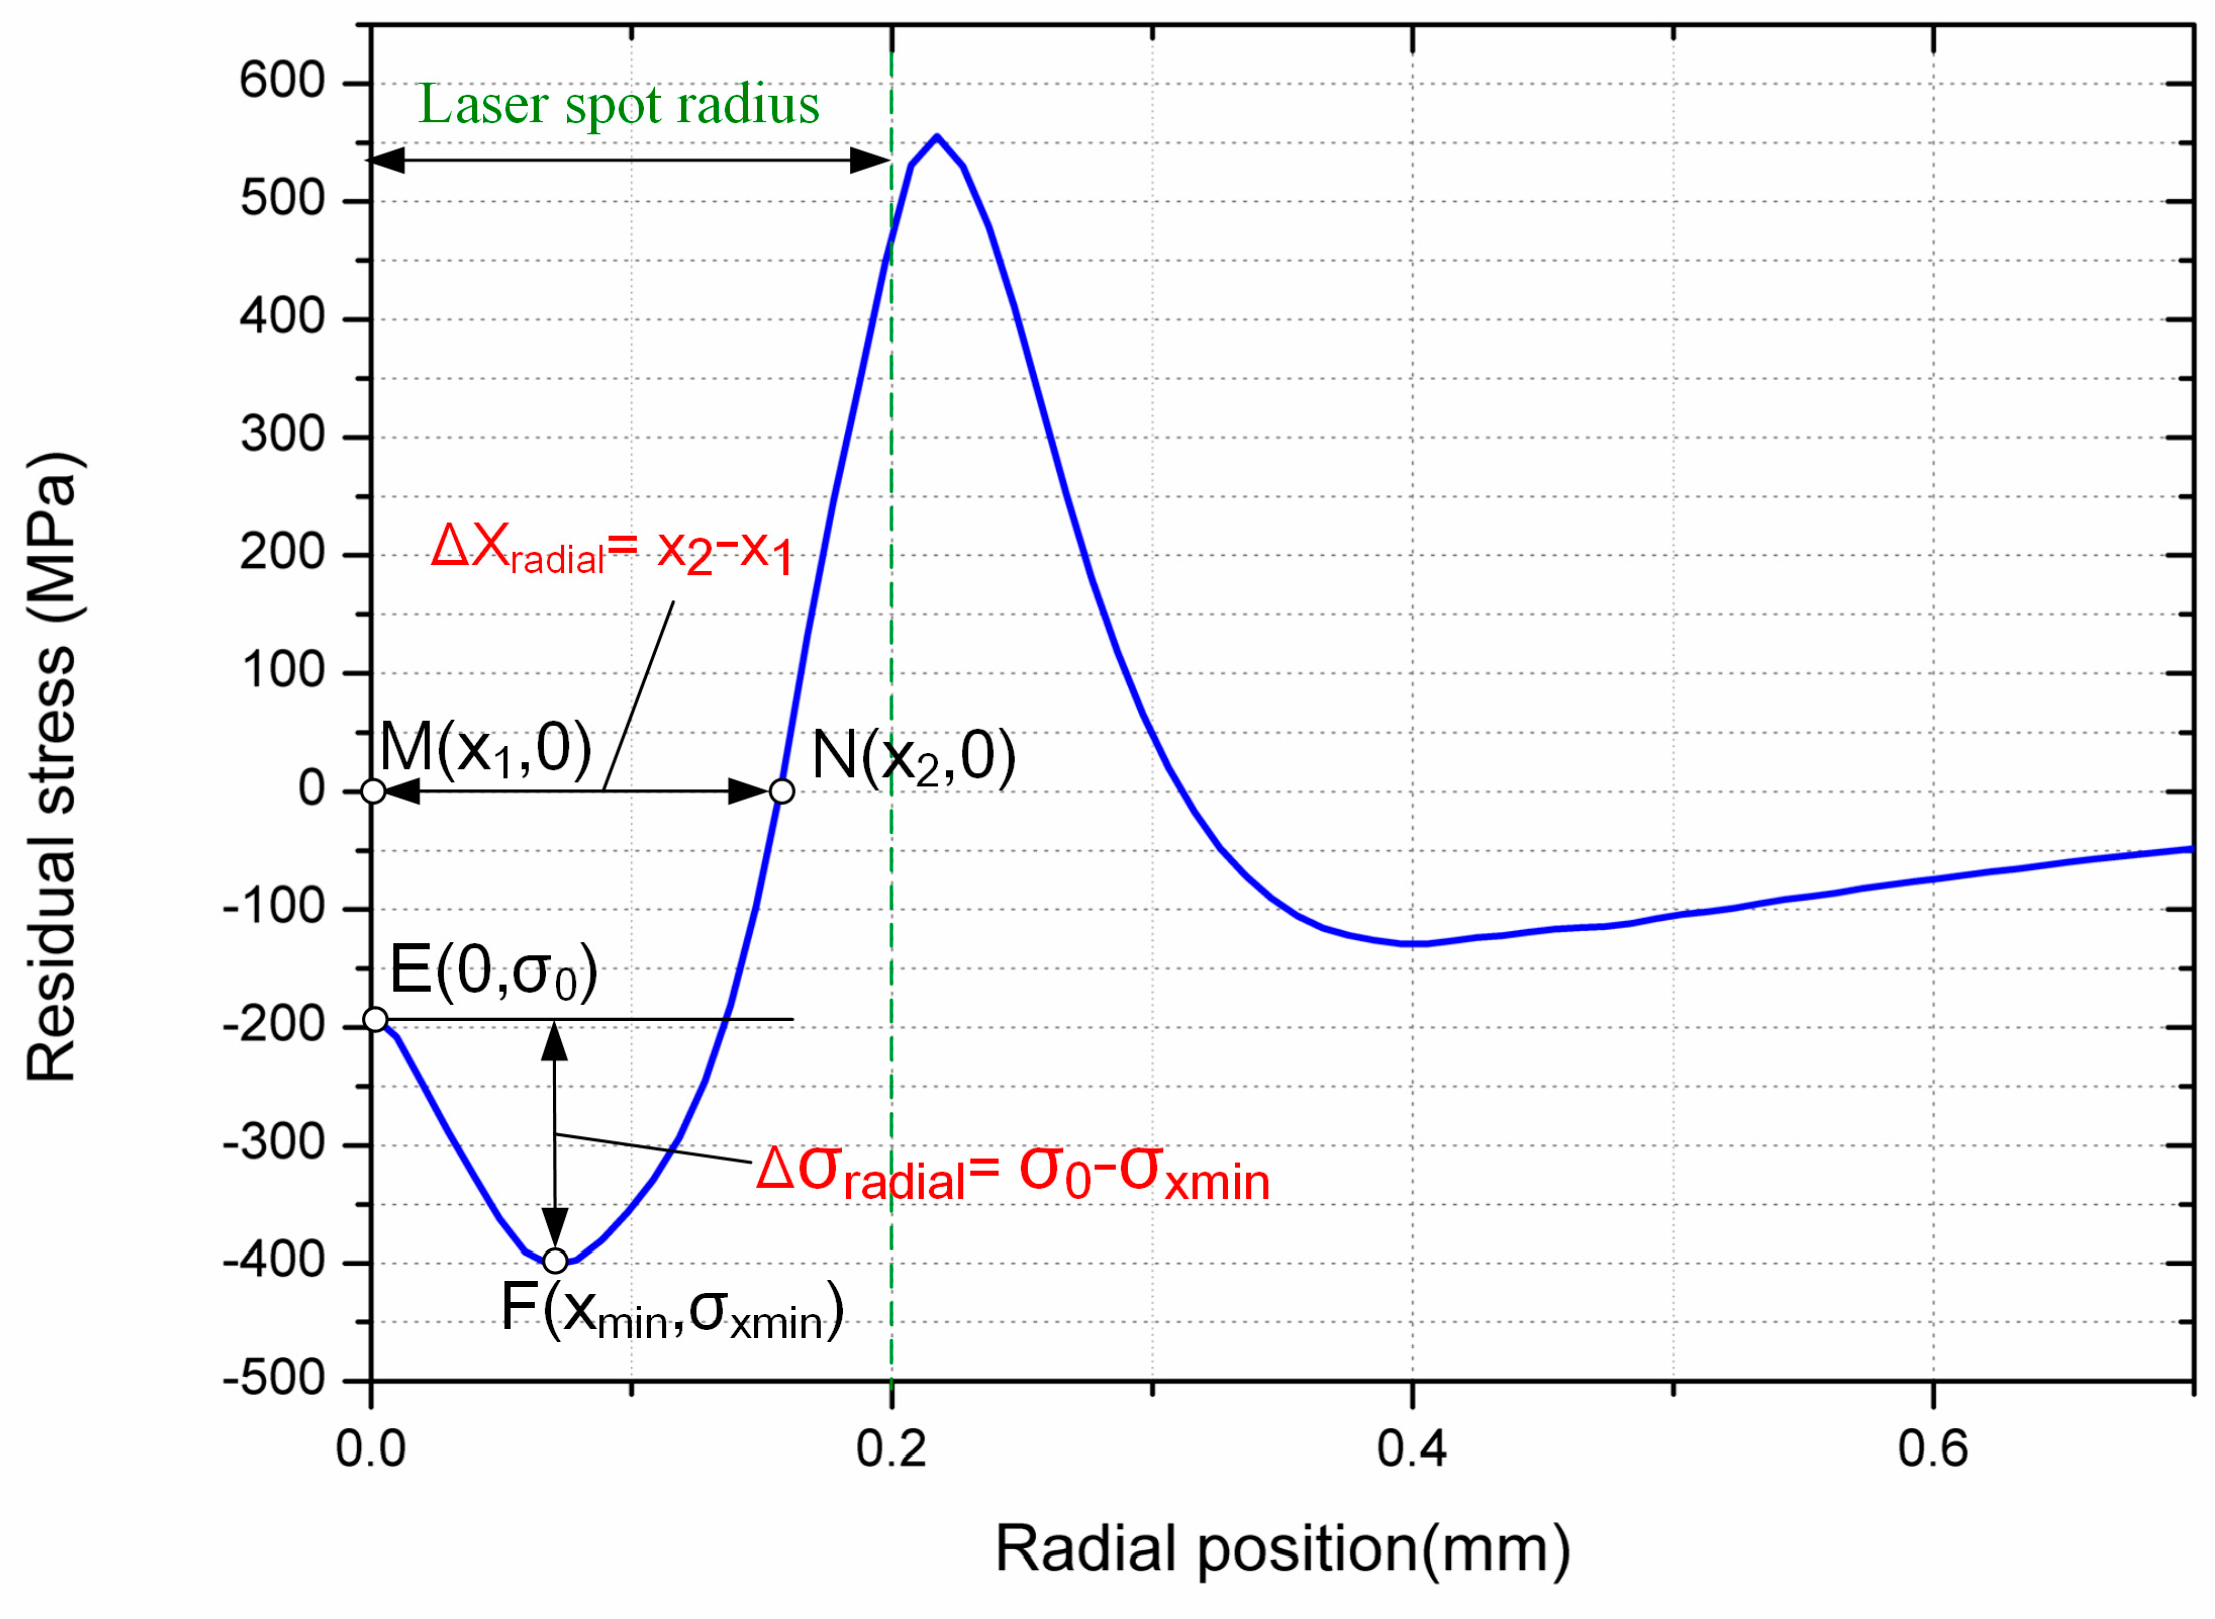
Figure 10.
Typical residual stress curve of the specimen surface (I0 = 4.97 GW/cm2, R = 200 μm).
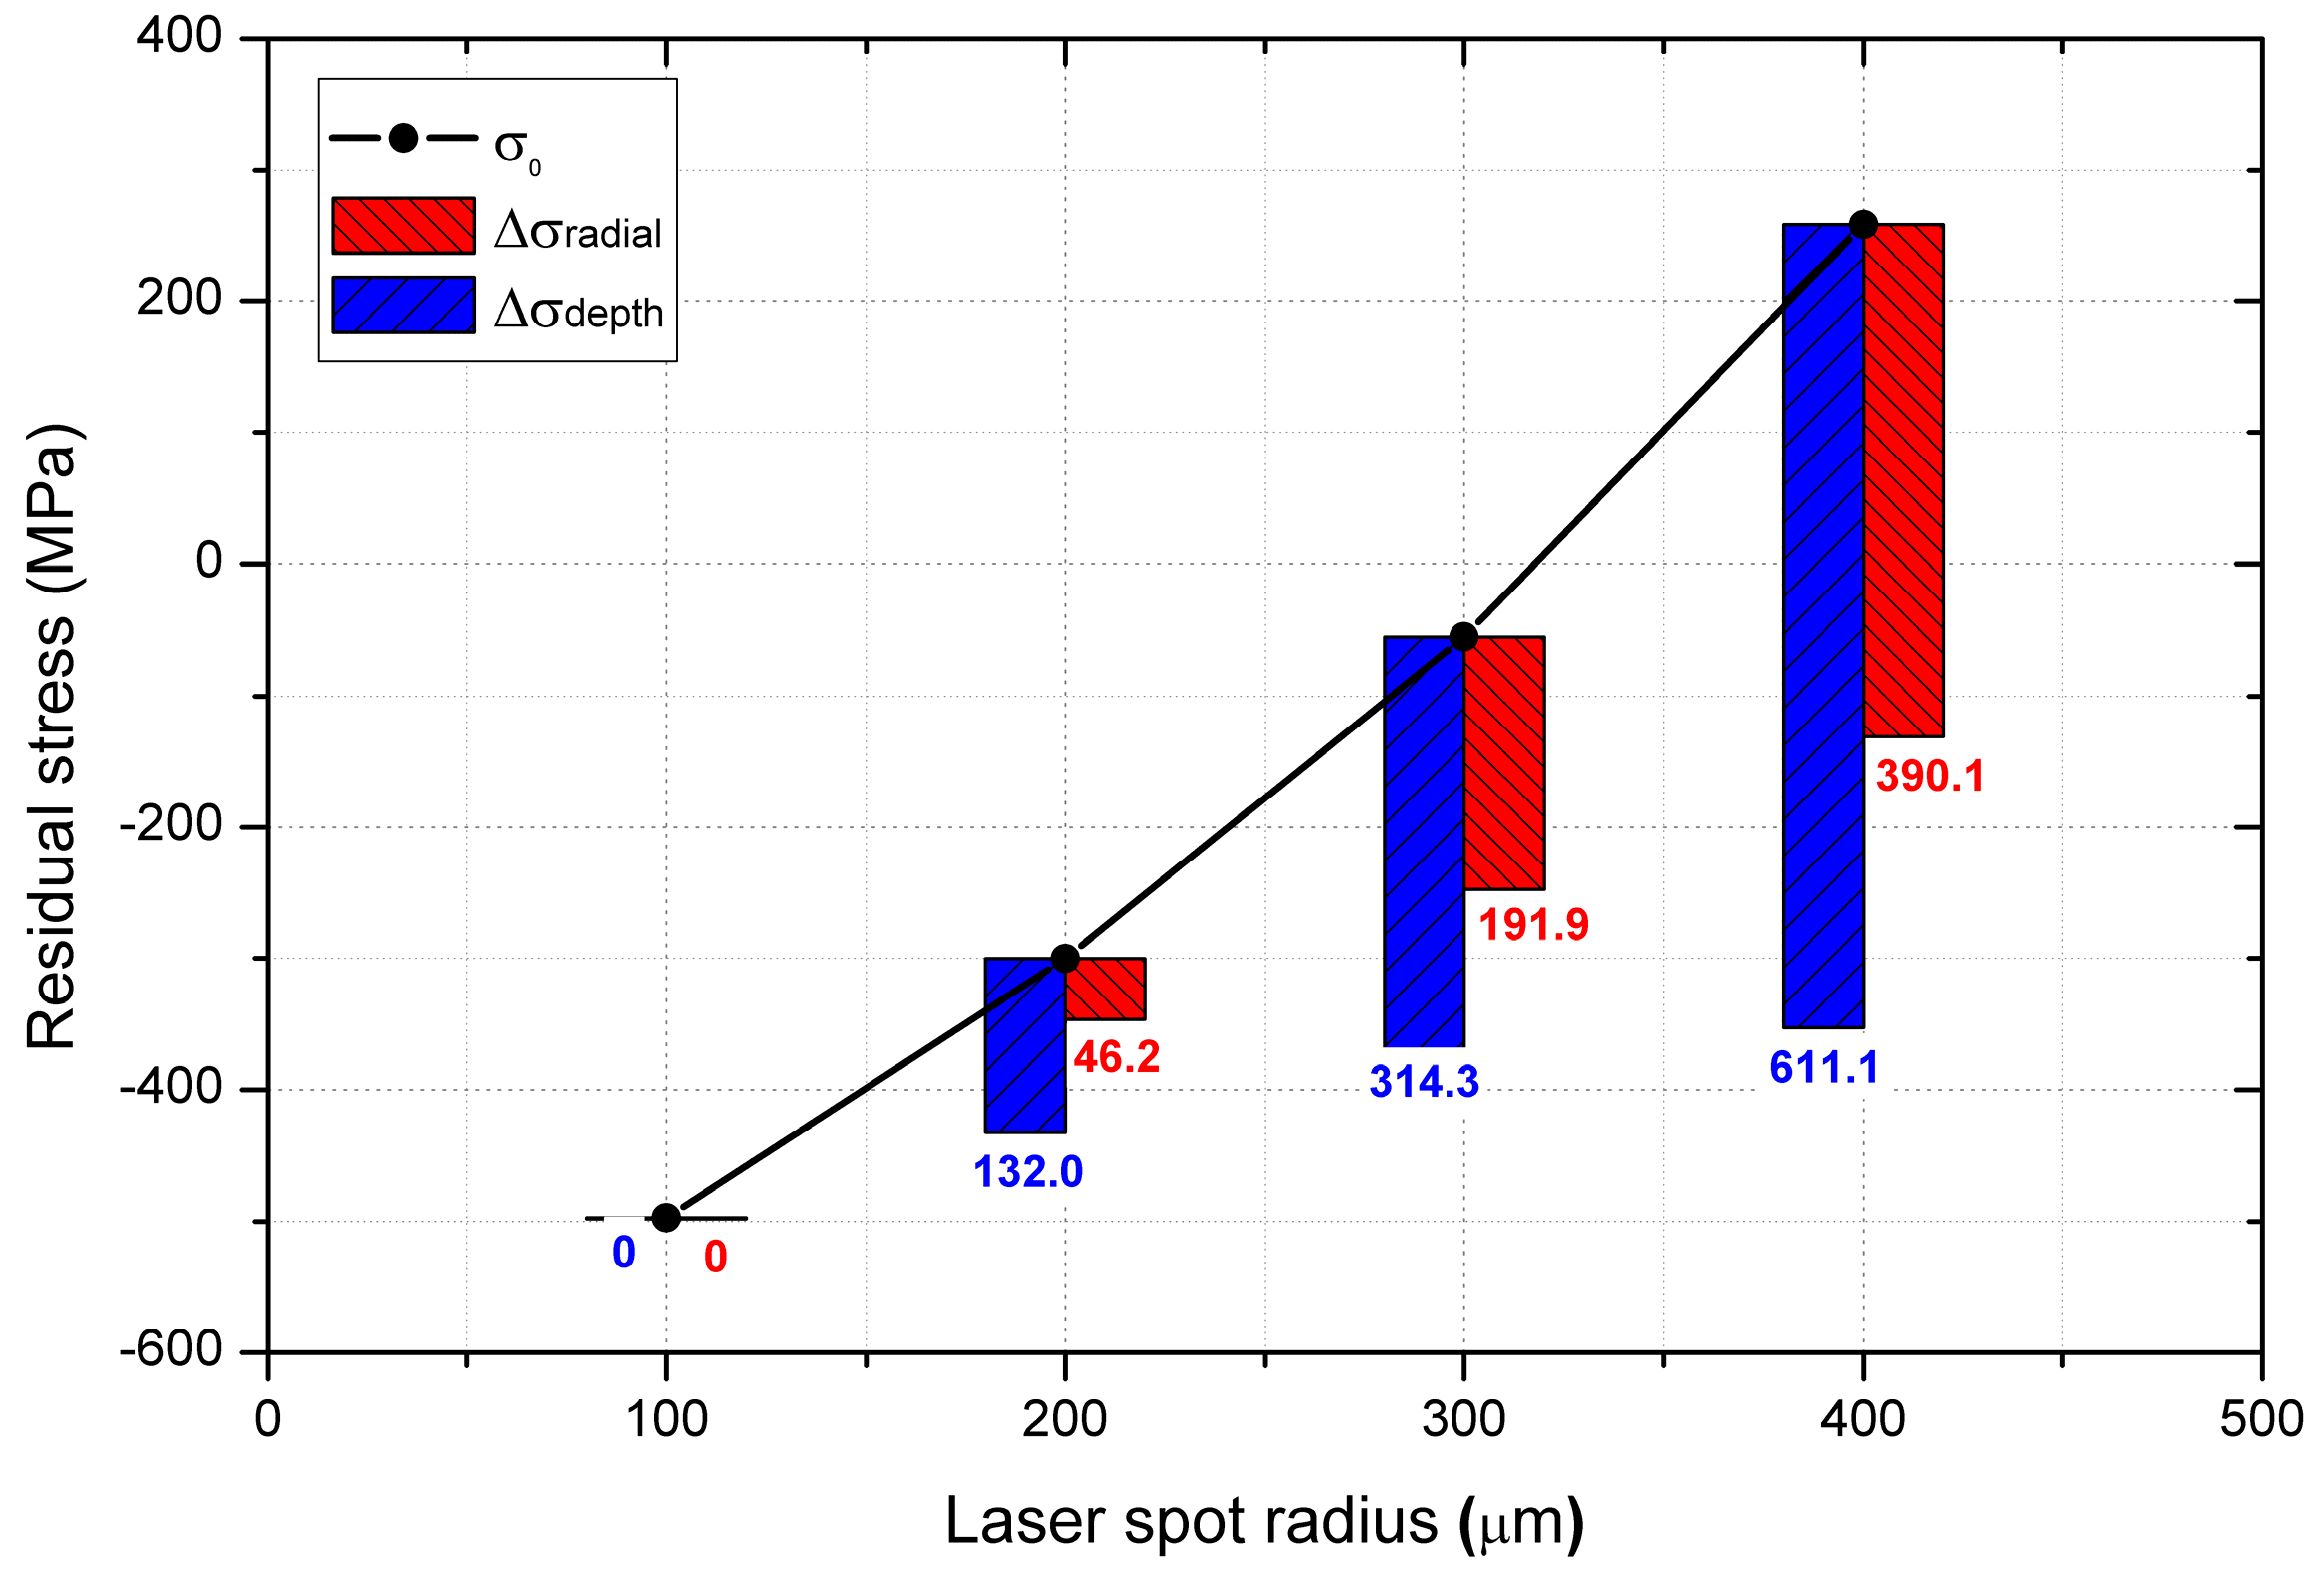
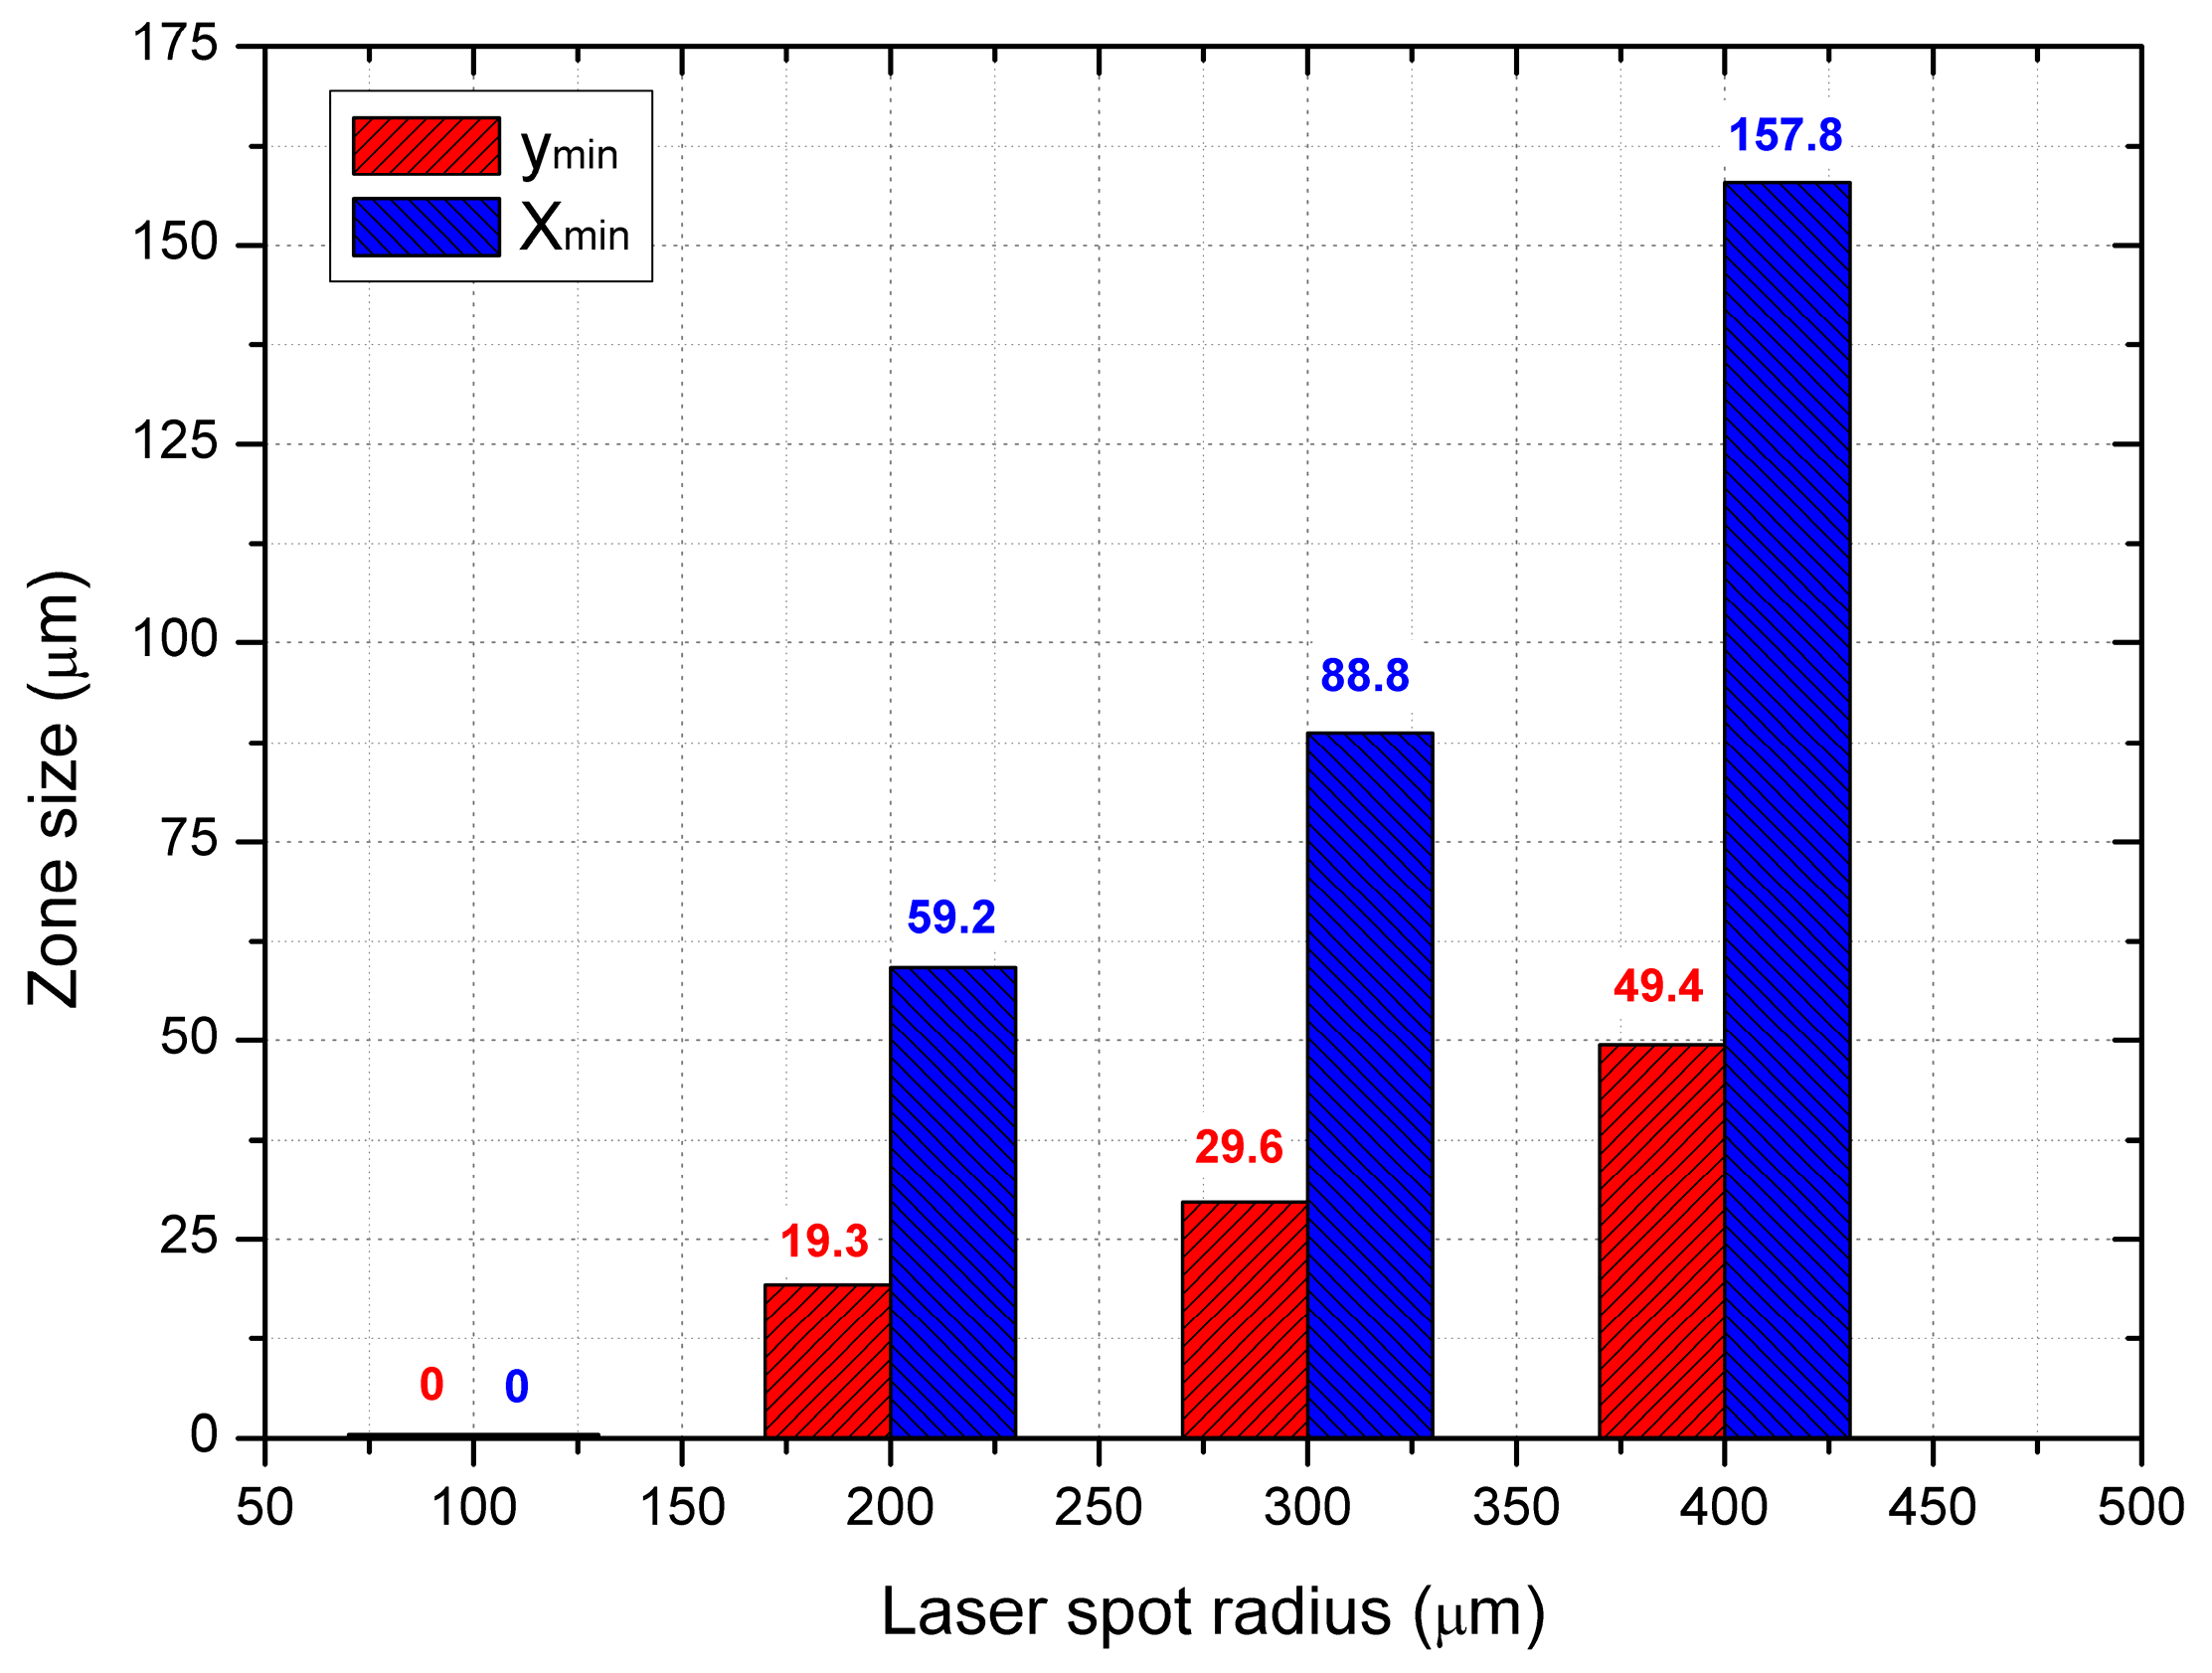
In this study, as shown in Figure 9 and Figure 10, the parameters used to characterize the residual compressive stress are the minimum residual stress (that is, the maximum residual compressive stress) in depth direction σymin and in radial direction σxmin, the thickness of residual compressive stress zone ΔYdepth, and the width of residual compressive stress zone ΔXradial. The parameters σ0, Δσdepth, and Δσradial could be used to characterize the magnitude of residual stress loss, while the parameters xmin and ymin reflect the affecting zone size of residual stress loss, respectively.
4.4. Effect of Laser Power Density
Laser power density is one of the most critical parameters in the LPT process. Figure 11a,b show the residual stress under different laser power densities along depth and radial direction, respectively.
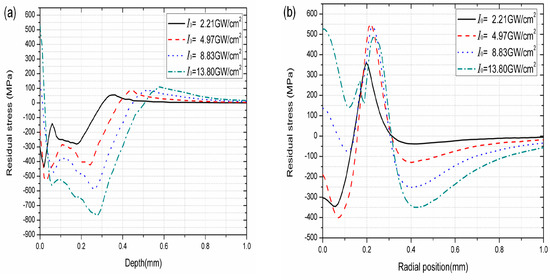
Figure 11.
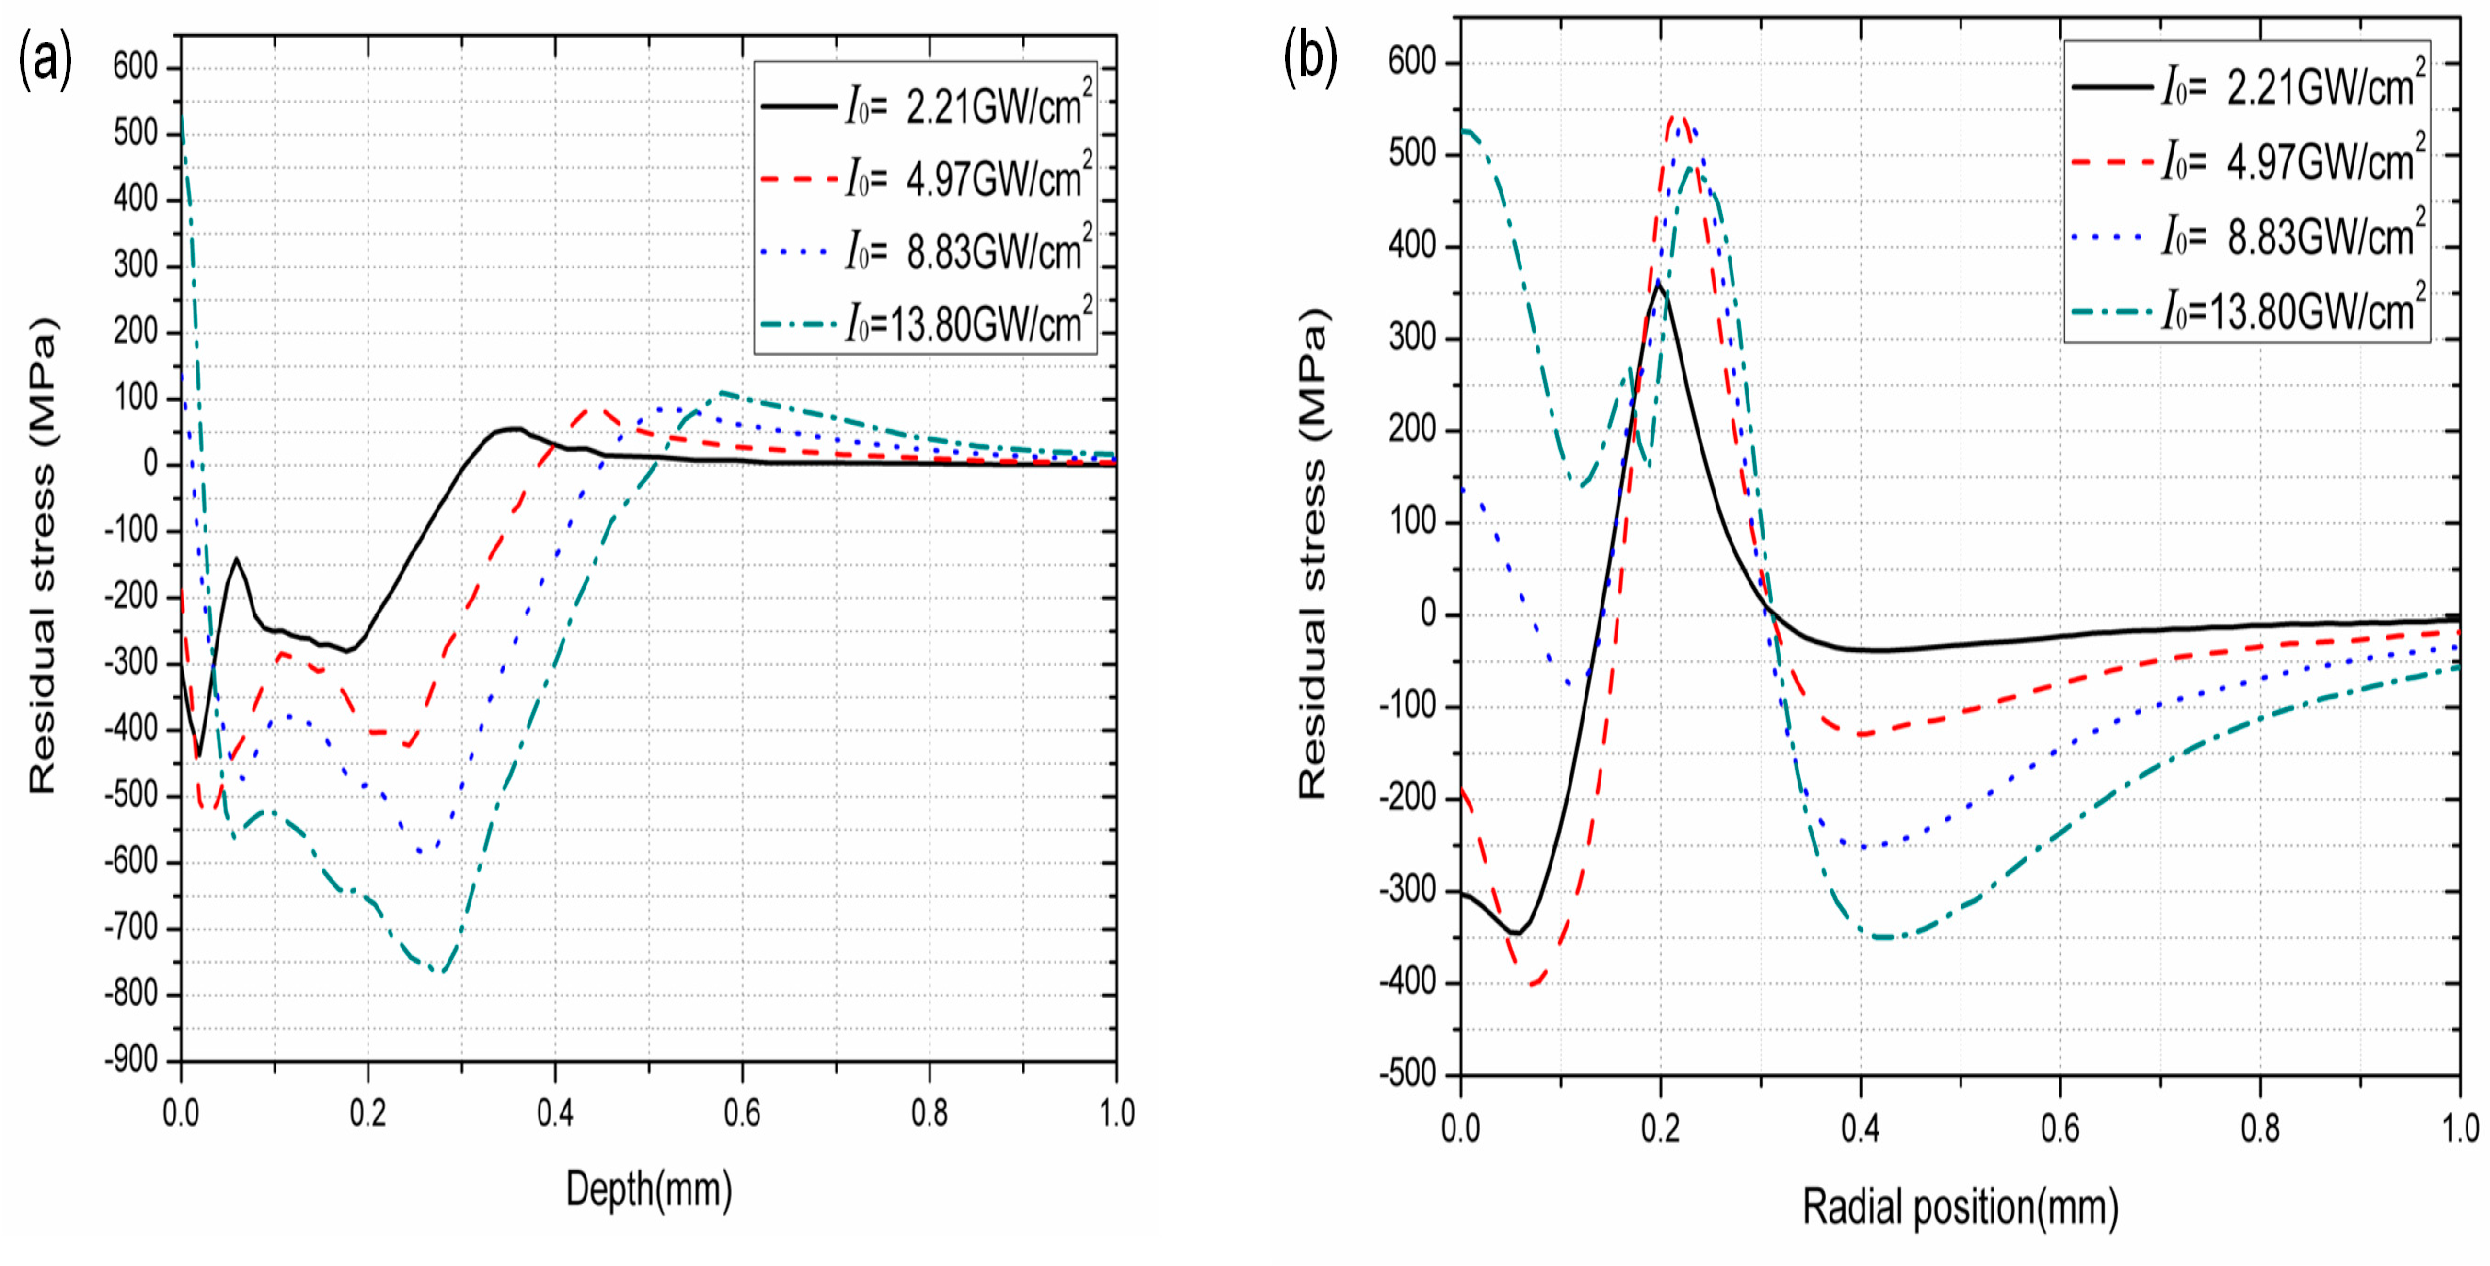
Residual stress along (a) depth direction and (b) radial direction under different laser power densities (R = 200 μm).
It is found from Figure 11a that the variation trends of residual stress along depth direction under different laser power densities are similar. The minimum residual stress is not located on the surface, but on the subsurface. With the increase of depth, the residual stress decreases to the maximum residual compressive stress σymin at a certain depth, then the residual stress increases and finally tends to be zero. The maximum residual compressive stress σymin and the thickness of the residual compressive stress zone ΔYdepth increase with laser power density. It means that larger laser power density leads to greater laser shock pressure, resulting in more obvious residual compressive stress, which is helpful for the mechanical performance of the target material.
Figure 11b shows that variations of residual stress along radial direction under different laser power densities are similar as well. The surface residual stress firstly decreases to a certain value and then increases to a maximum residual tensile stress at the edge of the dimple. When the laser power density increases from 2.21 GW/cm2 to 4.97 GW/cm2, the width of the residual compressive stress zone ΔXradial has an increasing trend. When the laser power density continues increasing, however, due to the appearance of residual stress loss, ΔXradial decreases and even drops to zero when the laser power density increases to 13.80 GW/cm2.
Figure 12 and Figure 13 show the effect of laser power density on the magnitude and the affecting zone size of the residual stress loss, respectively. It is found that σ0, Δσdepth, Δσradial, ymin, and xmin all increase with laser power density, which means that the phenomenon of residual stress loss becomes more obvious. In detail, when the laser power density is 2.21 GW/cm2 or 4.97 GW/cm2, the residual stress of the surface on laser spot center σ0 is compressive, meanwhile, Δσdepth, Δσradial, ymin, and xmin are relatively small. When the laser power density is set as 8.83 GW/cm2 or 13.80 GW/cm2, however, σ0 even becomes positive tensile stress, which is detrimental to the mechanical and physical performance of the target material. Therefore, it can be concluded the increase of the laser power density is not conducive to restrain the phenomenon of residual stress loss.
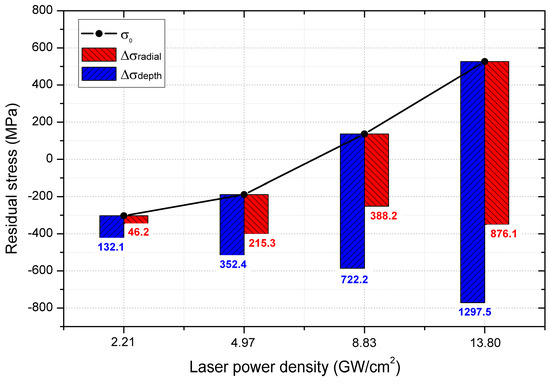
Figure 12.
The effect of laser power density on σ0, Δσdepth, and Δσradial.

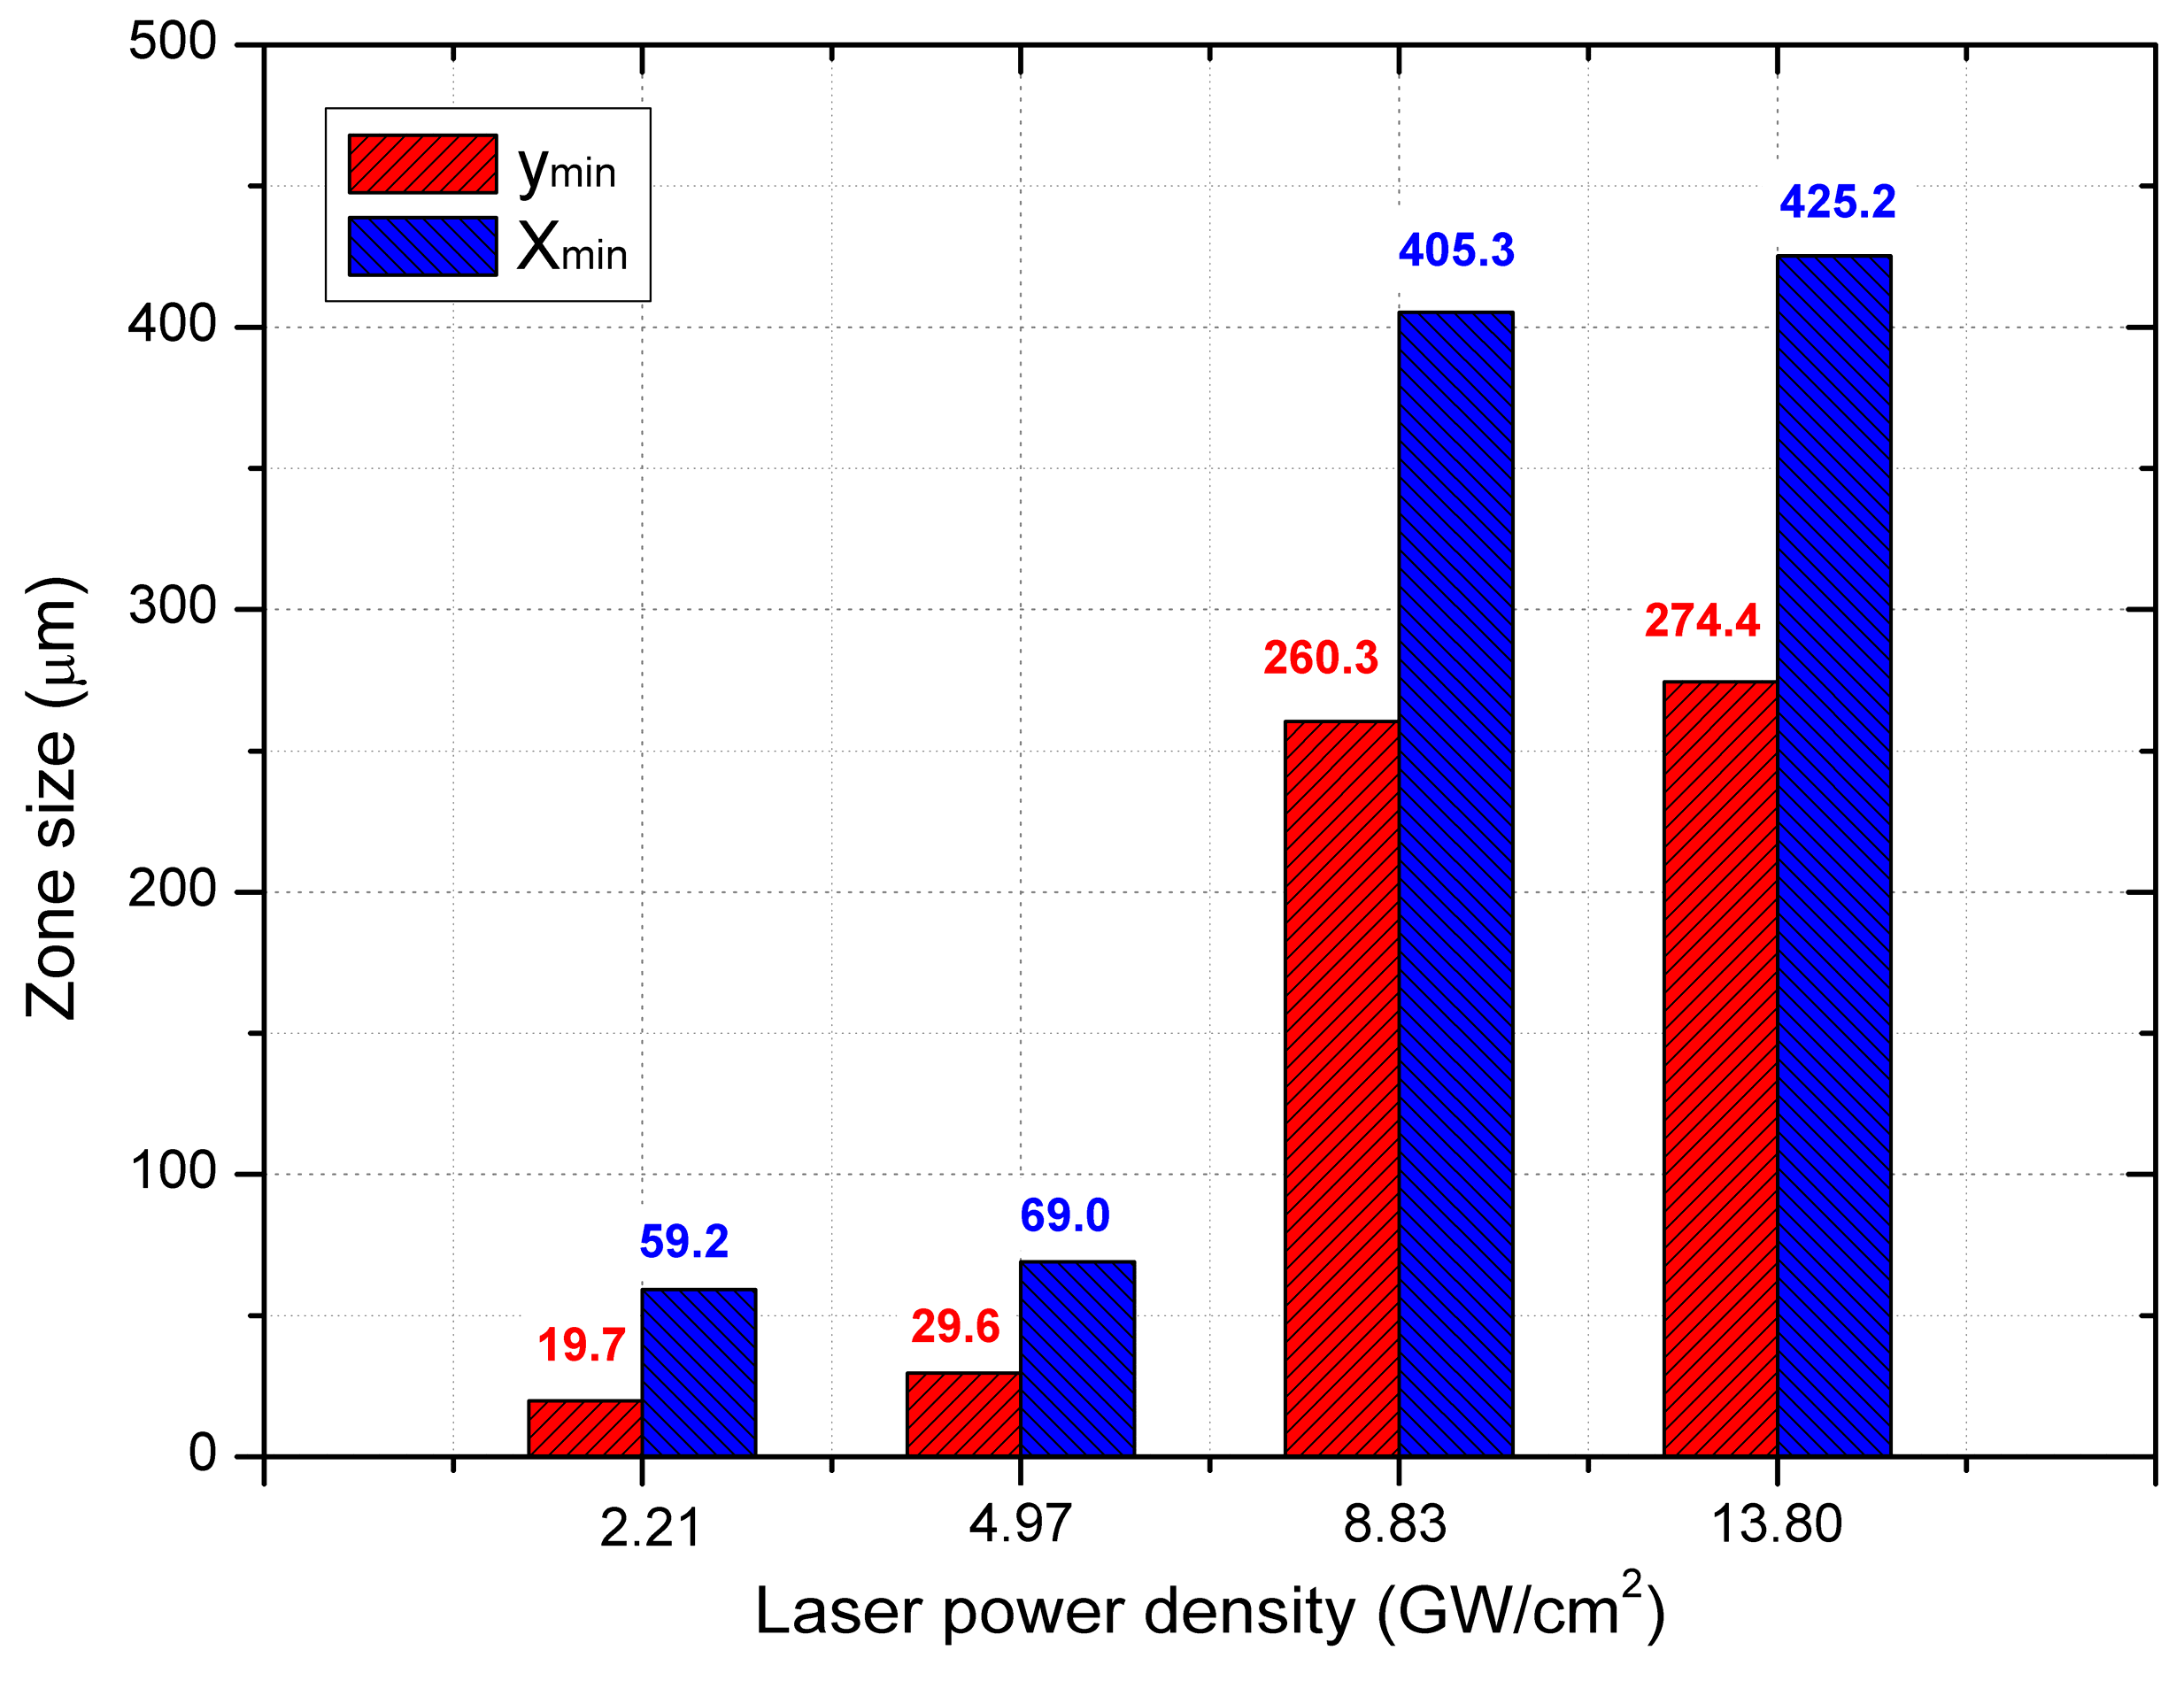
Figure 13.
The effect of laser power density on the size of the residual stress loss.
As discussed in Section 4.2, based on the generation mechanism of residual stress loss, it is known that if the laser power density is small, which means low laser shock pressure applied on the specimen, the release wave arriving at the spot center will be weak, so the reverse loading effect will not be strong enough to generate dramatic residual stress loss. With the increase of the laser power density, the laser shock pressure increases, and the release wave becomes stronger, thus the residual stress loss becomes more and more obvious. Actually, as concluded by Ballard [34], when the laser shock peak pressure is larger than 2.5 times the Hugoniot Elastic Limit (HEL) of the target material, there will be relatively serious residual stress loss phenomenon. As 2.5 times the HEL value of 316 L stainless steel is 2.75 GPa (the HEL value of 316 L stainless steel is 1.1 GPa [35]), the residual stress loss at the conditions of 8.83 GW/cm2 (laser shock peak pressure is 4 GPa) and 13.80 GW/cm2 (laser shock peak pressure is 5 GPa) are obvious.
4.5. Effect of Laser Spot Radius
Laser spot radius is also one of the most important parameters in the LPT process. The variations of residual stress along depth and radial direction under four different laser spot radii are shown in Figure 14.
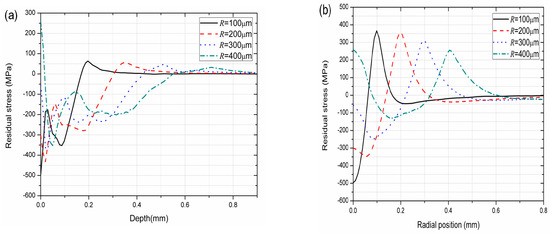
Figure 14.
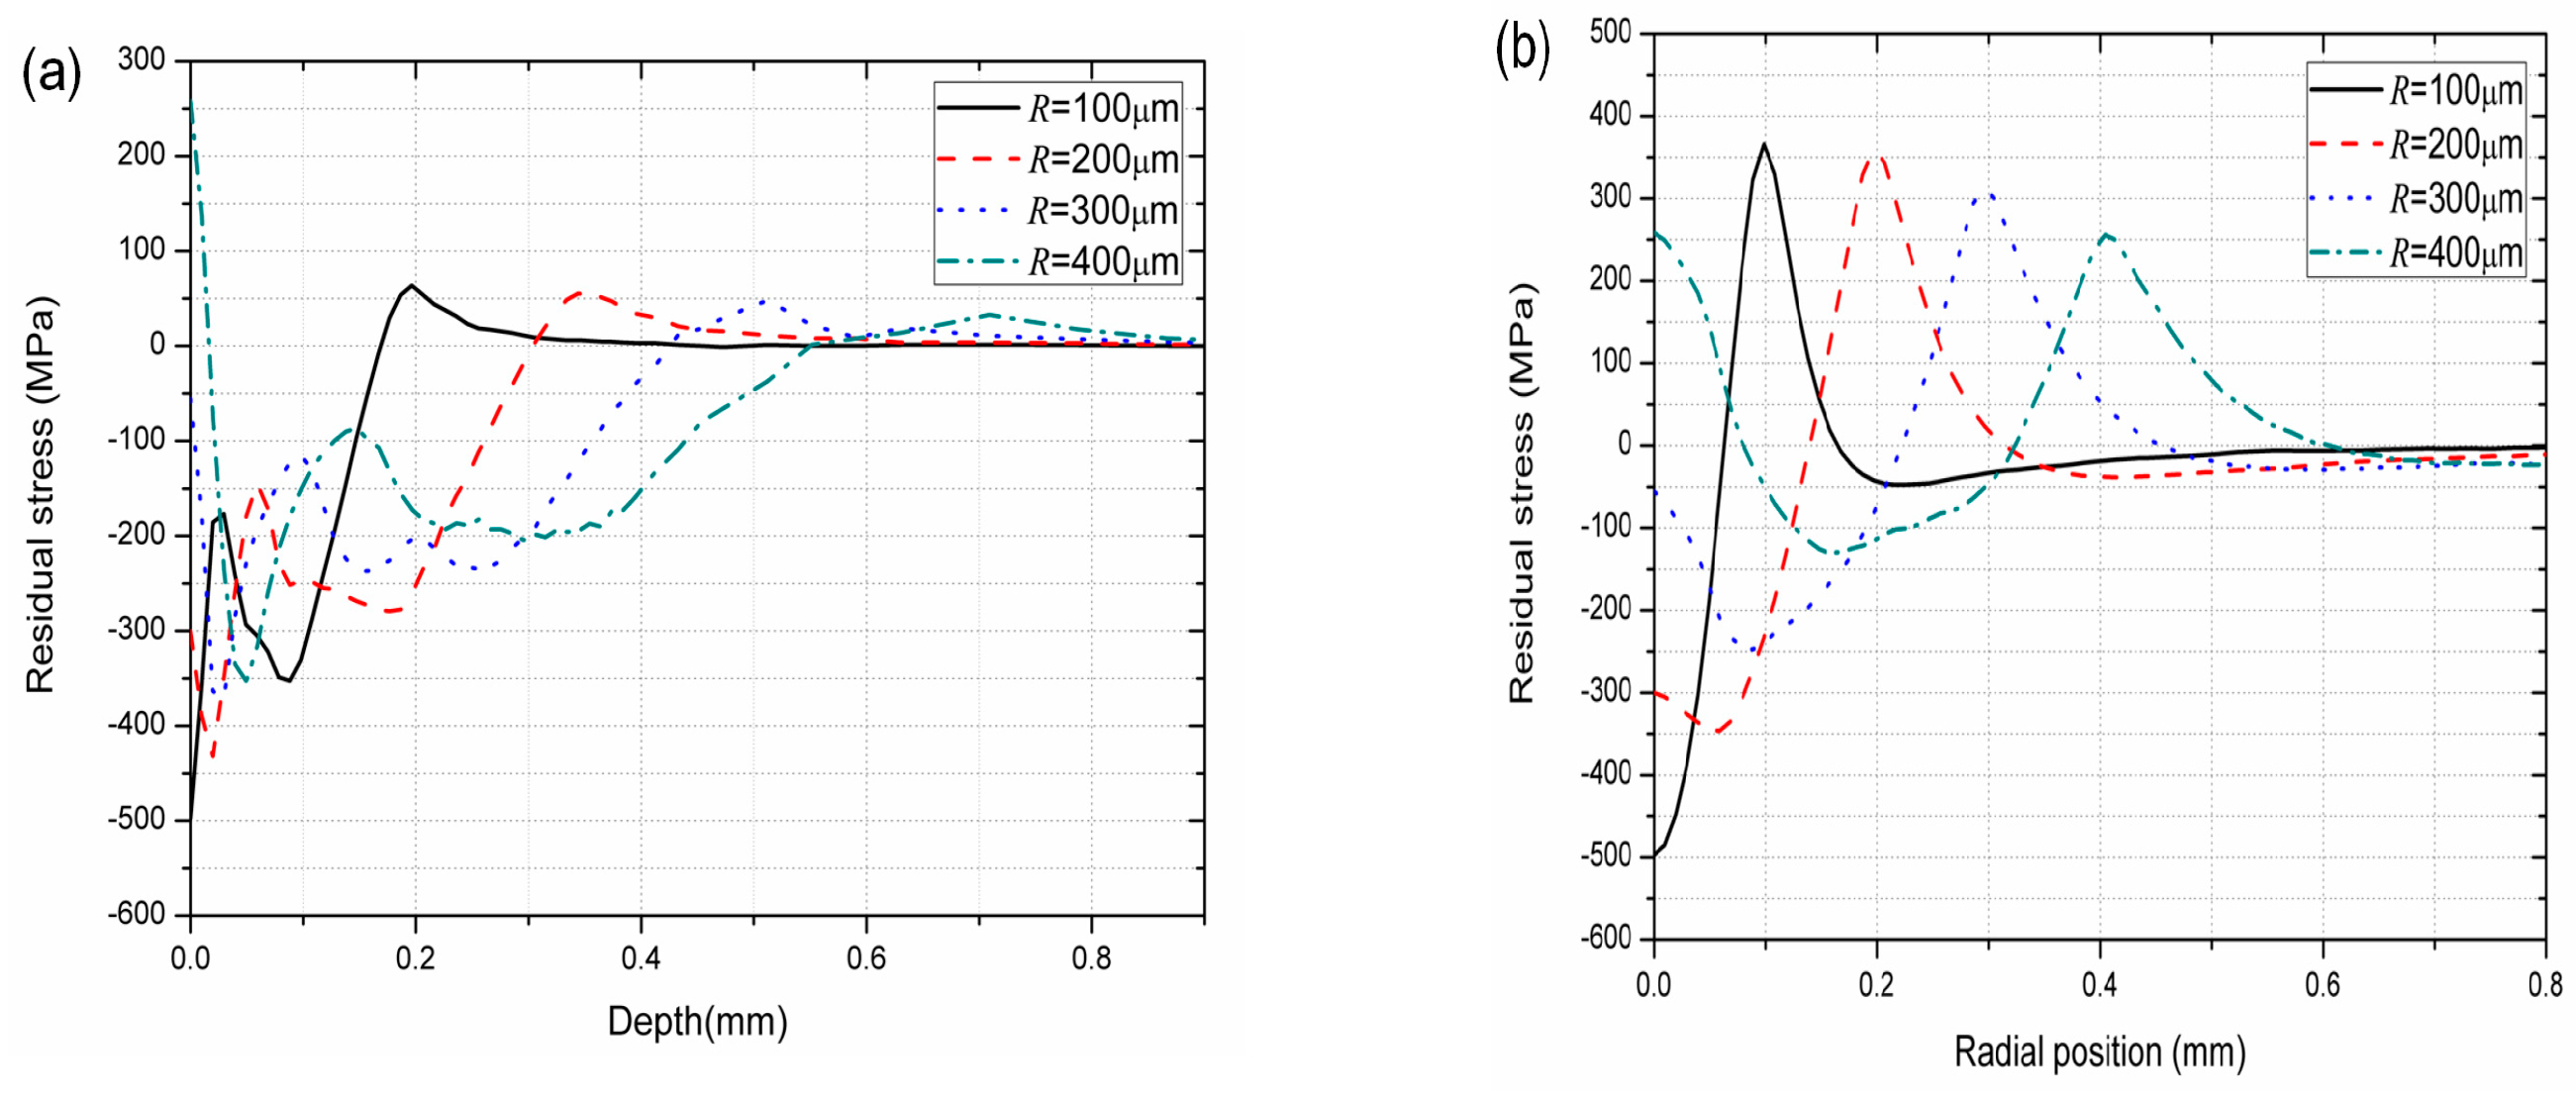
Residual stress along (a) depth direction and (b) radial direction under different laser spot radius (I0 = 2.21 GW/cm2).
From Figure 14a, it is found that under the same laser power density, large laser spot radius leads to great thickness of residual compressive stress zone ΔYdepth. The probable reason is as follows. When the spot radius is large, the shock wave could be treated as a plan wave whose attenuation speed is slow, leading to a thick residual compressive stress zone. When the spot radius is small, however, the shock wave tends to be a spherical wave whose scattering is relatively serious. Thus, its attenuation speed is fast, resulting in a relatively thin residual compressive stress zone. This conclusion agrees well with previous findings of Peyre et al. [18].
Figure 14b shows that with the increase of laser spot radius, the width of residual compressive stress ΔXradial increases, but simultaneously, the range of residual tensile stress at the edge of the spot increases too. In addition, it is interesting to see from Figure 14a,b that the magnitudes of maximum residual compressive stress along depth direction σymin and those along radial direction σxmin decrease with the increase of laser spot radius. These results might be related with the phenomenon of residual stress loss.
In order to investigate the influence of laser spot radius on residual stress loss, the variations of σ0, Δσdepth, Δσradial, ymin, and xmin with laser spot radius are shown in Figure 15 and Figure 16. From these two figures, it is seen that when laser spot radius is set as 100 μm, the values of Δσdepth, Δσradial, ymin, and xmin are all zero, indicating that the residual stress loss does not appear. As a result, both the maximum residual compressive stress along depth direction σymin and that along radial direction σxmin equal to σ0, which locates at the spot center.

Figure 15.
The effect of laser spot radius on σ0, Δσdepth, and Δσradial (I0 = 2.21 GW/cm2).

Figure 16.
The effect of laser spot radius on the size of the residual stress loss (I0 = 2.21 GW/cm2).
For the cases of 200 μm, 300 μm, and 400 μm, it is found that the values of σ0, Δσdepth, Δσradial, ymin, and xmin all increase with laser spot radius. Moreover, when the laser spot radius increases by 100% from 200 μm to 400 μm, the values of Δσdepth, Δσradial, ymin, and xmin increase by more than 360%, 740%, 150%, and 160%, respectively. The above results show that laser spot radius has a significant effect on residual stress loss and large laser spot radius leads to more obvious residual stress loss. This might be the reason why σymin and σxmin decrease with the increase of laser spot radius mentioned above.
5. Conclusions
A finite element model was developed to predict the residual stress distribution induced in 316 L stainless steel subjected to LPT. The effects of laser power density and laser spot radius on the residual stress loss were discussed, which may facilitate the optimization of the LPT procedure to obtain a more homogeneous surface refinement. The conclusions are as follows.
- (1)
- A simulation model was proposed and the deformation, as well as the stress distribution of the specimen, was investigated. The profile of micro dimple calculated by the simulation agrees well with the measured ones in experiment.
- (2)
- An evaluation method of residual stress field was established. The residual compressive stress, the magnitude of residual stress loss, and the affecting zone size of residual stress loss can be characterized quantitatively by this method.
- (3)
- When the laser power density increases from 2.21 GW/cm2 to 13.80 GW/cm2, the magnitude of the residual stress loss increases from 46.2 MPa to 876.1 MPa along the radial direction, and from 132.1 MPa to 1297.5 MPa along the depth direction, respectively. Meanwhile, the affecting zone size of the residual stress loss increases from 59.2 μm to 425.2 μm along the radial direction and from 19.7 μm to 274.4 μm along the depth direction, respectively. When the laser power density exceeds a certain threshold, the residual stress on the surface changes from compressive stress to tensile stress.
- (4)
- Laser spot radius has a significant effect on residual stress loss. Large laser spot radius leads to more obvious residual stress loss. In this study, when the laser spot radius increases from 100 μm to 400 μm, the thickness and the width of the residual compressive stress layer increases from 175 μm to 565 μm and from 70 μm to 315 μm, respectively. However, the maximum residual compressive stress decreases from −495 MPa to −125 MPa along radial direction and decreases from −495 MPa to −350 MPa along depth direction, respectively.
Author Contributions
Conceptualization, K.L.; methodology, K.L.; software, Y.W. and Y.C.; validation, K.L., Y.W.; formal analysis, K.L.; investigation, Y.W.; resources, Y.C.; writing—original draft preparation, K.L.; writing—review and editing, J.H.; visualization, K.L.; supervision, K.L. and J.H.; project administration, K.L.; funding acquisition, K.L. and J.H.
Funding
This research was funded by the National Natural Science Foundation of China, grant number 51605296 and the Fundamental Research Funds for the Central Universities, grant number 2232018D3-04, 2232018A3-08.
Conflicts of Interest
The authors declare no conflict of interest.
References
- Etsion, I. State of the art in laser surface texturing. J. Tribol-T. ASME 2005, 125, 248–300. [Google Scholar] [CrossRef]
- Wei, D.; Li, B.; Zhang, Z.; Han, F.; Zhang, X.; Zhang, M.; Li, L.; Wang, Q. Influence of surface texture characteristics on the noise in grooving concrete pavement. Appli. Sci. 2018, 8, 2141. [Google Scholar] [CrossRef]
- Yang, L.; Ding, Y.; Cheng, B.; He, J.; Wang, G.; Wang, Y. Investigations on femtosecond laser modified micro-textured surface with anti-friction property on bearing steel GCr15. Appl. Surf. Sci. 2018, 434, 831–842. [Google Scholar] [CrossRef]
- Zhou, J.; Shen, H.; Pan, Y.; Ding, X. Experimental study on laser microstructures using long pulse. Opt. Lasers Eng. 2016, 78, 113–120. [Google Scholar] [CrossRef]
- Ryk, G.; Kligerman, Y.; Etsion, I. Experimental investigation of laser surface texturing for reciprocating automotive components. Tribol. Trans. 2002, 45, 444–449. [Google Scholar] [CrossRef]
- Wang, J.; Zhang, J.; Lin, J.; Ma, L. Study on lubrication performance of journal bearing with multiple texture distributions. Appl. Sci. 2018, 8, 244. [Google Scholar] [CrossRef]
- Ito, H.; Kaneda, K.; Yuhta, T.; Nishimura, I.; Yasuda, K.; Matsuno, T. Reduction of polyethylene wear by concave dimples on the frictional surface in artificial hip joints. J. Arthroplasty 2000, 15, 332–338. [Google Scholar] [CrossRef]
- Zhang, Y.D.; Lin, J.Q.; Fu, Q.L.; Hu, H.Y. Measuring and controlling of arbor displacement in low frequency vibration machining surface for micro pits. J. ZheJiang Univ. 2008, 42, 1410–1414. [Google Scholar]
- Roy, T.; Choudhury, D.; Ghosh, S.; Mamat, A.B.; Pingguan-Murphy, B. Improved friction and wear performance of micro dimpled ceramic-on-ceramic interface for hip joint arthroplasty. Ceram. Int. 2015, 41, 681–690. [Google Scholar] [CrossRef]
- Shinkarenko, A.; Kligerman, Y.; Etsion, I. The effect of elastomer surface texturing in soft elasto-hydrodynamic lubrication. Tribol. Lett. 2009, 36, 95–103. [Google Scholar] [CrossRef]
- Jiao, L.; Chua, Z.Y.; Moon, S.K.; Song, J.; Bi, G.; Zheng, H.; Lee, B.; Koo, J. Laser-induced graphene on additive manufacturing parts. Nanomaterials 2019, 9, 90. [Google Scholar] [CrossRef] [PubMed]
- Müller, F.A.; Kunz, C.; Gräf, S. Bio-inspired functional surfaces based on laser-induced periodic surface structures. Materials 2016, 9, 476. [Google Scholar] [CrossRef] [PubMed]
- Tang, W.; Zhou, Y.; Zhu, H.; Yang, H. The effect of surface texturing on reducing the friction and wear of steel under lubricated sliding contact. Appl. Surf. Sci. 2013, 273, 199–204. [Google Scholar] [CrossRef]
- Wang, X.L.; Adachi, K.; Otsuka, K.; Kato, K. Optimization of the surface texture for silicon carbide sliding in water. Appl. Surf. Sci. 2006, 253, 1282–1286. [Google Scholar] [CrossRef]
- Liu, H.; Sun, X.; Shen, Z.; Li, L.; Sha, C.; Ma, Y.; Gau, J.; Wang, X. Experimental and numerical simulation investigation on laser flexible shock micro-bulging. Metals 2017, 7, 93. [Google Scholar] [CrossRef]
- Dai, F.; Zhang, Z.; Ren, X.; Lu, J.; Huang, S. Effects of laser shock peening with contacting foil on micro laser texturing surface of Ti6Al4V. Opt. Lasers Eng. 2018, 1, 99–105. [Google Scholar] [CrossRef]
- Zhang, W.; Lu, J.; Luo, K. Residual stress distribution and microstructure at a laser spot of AISI 304 stainless steel subjected to different laser shock peening impacts. Metals 2015, 6, 6–15. [Google Scholar] [CrossRef]
- Peyre, P.; Fabbro, R.; Merrien, P.; Lieurade, H.P. Laser shock processing of aluminum alloys. Application to high cycle fatigue behaviour. Mat. Sci. Eng. A 1996, 210, 102–113. [Google Scholar] [CrossRef]
- Zhang, W.; Yao, Y.L. Micro scale laser shock processing of metallic components. J. Manuf. Sci. Eng. 2002, 124, 369–378. [Google Scholar] [CrossRef]
- Wu, B.; Tao, S.; Lei, S. Numerical modeling of laser shock peening with femtosecond laser pulses and comparisons to experiments. Appl. Surf. Sci. 2010, 256, 4376–4382. [Google Scholar] [CrossRef]
- Vasu, A.; Grandhi, R.V. Effects of curved geometry on residual stress in laser peening. Surf. Coat. Tech. 2013, 218, 71–79. [Google Scholar] [CrossRef]
- Vasu, A.; Hu, Y.X.; Grandhi, R.V. Differences in plasticity due to curvature in laser peened components. Surf. Coat. Tech. 2013, 235, 648–656. [Google Scholar] [CrossRef]
- Ding, K. Three-dimensional dynamic finite element analysis of multiple laser shock peening processes. Surf. Eng. 2003, 19, 351–358. [Google Scholar] [CrossRef]
- Brockman, R.A.; Braisted, W.R.; Olson, S.E.; Tenaglia, R.D.; Clauer, A.H.; Langer, K.; Shepard, M.J. Prediction and characterization of residual stresses from laser shock peening. Int. J. Fatigue 2012, 36, 96–108. [Google Scholar] [CrossRef]
- Luo, K.Y.; Lin, T.; Dai, F.Z.; Luo, X.M.; Lu, J.Z. Effects of overlapping rate on the uniformities of surface profile of LY2 Al alloy during massive laser shock peening impacts. Surf. Coat. Tech. 2015, 266, 49–56. [Google Scholar] [CrossRef]
- Zhang, X.; Li, H.; Duan, S.; Yu, X.; Feng, Y.; Wang, B.; Huang, Z. Modeling of residual stress field induced in Ti-6Al-4V alloy plate by two sided laser shock processing. Surf. Coat. Tech. 2015, 280, 163–173. [Google Scholar] [CrossRef]
- Hu, Y.X.; Gong, C.; Yao, Z.Q.; Hu, J. Investigation on the non-homogeneity of residual stress field induced by laser. Surf. Coat. Tech. 2009, 203, 3503–3508. [Google Scholar] [CrossRef]
- Tan, Y.; Wu, G.; Yang, J.M.; Pan, T. Laser shock peening on fatigue crack growth behaviour of aluminium alloy. Fatigue Fract. Eng. Mater. Struct. 2004, 27, 649–656. [Google Scholar] [CrossRef]
- ABAQUS, Inc. Analysis. In Abaqus Analysis User’s Manual; ABAQUS, Inc.: Palo Alto, CA, USA, 2003; Volume II. [Google Scholar]
- Johnson, G.R.; Cook, W.H. A constitutive model and data for metals subjected to large strains, high strain rates and high temperatures. In Proceedings of the 7th International Symposium on Ballistics, Hague, The Netherlands, 19–21 April 1983; pp. 541–547. [Google Scholar]
- Chandrasekaran, H.; M’saoubi, R.; Chazal, H. Modelling of material flow stress in chip formation process from orthogonal milling and split Hopkinson bar tests. Mach. Sci. Tech. 2005, 9, 131–144. [Google Scholar] [CrossRef]
- Fabbro, R.; Fournier, J.; Ballard, P.; Devaux, D.; Virmont, J. Physical study of laser-produced plasma in confined geometry. J. Appl. Phys. 1990, 68, 775–784. [Google Scholar] [CrossRef]
- Zhang, W.; Yao, Y.L.; Noyan, I.C. Microscale laser shock peening of thin films, part 1: Experiment, modeling and simulation. J. Manuf. Sci. Eng. ASME 2004, 126, 10–16. [Google Scholar] [CrossRef]
- Ballard, P. Residual stresses induced by rapid impact-applications of laser shocking. J. Phys. 1991, 1, 487–494. [Google Scholar]
- Peyre, P.; Berthe, L.; Fabbro, R. Laser shock processing of materials: Basics mechanisms and applications. In Proceedings of the 65th Meeting of Japan Laser Processing Society, Tokyo, Japan, 2–5 December 2005; Volume 12, pp. 95–109. [Google Scholar]


© 2019 by the authors. Licensee MDPI, Basel, Switzerland. This article is an open access article distributed under the terms and conditions of the Creative Commons Attribution (CC BY) license (http://creativecommons.org/licenses/by/4.0/).