Article

Simulation of the Cooling Effect of Porous Asphalt Pavement with Different Air Voids

1
Department of Civil Engineering, Nanjing University of Aeronautics and Astronautics, Nanjing 210016, China
2
Zhejiang Provincial Institute of Communications Planning, Design & Research Co. Ltd., Hangzhou 310006, China
*
Author to whom correspondence should be addressed.
Appl. Sci. 2019, 9(18), 3659; https://doi.org/10.3390/app9183659
Submission received: 26 July 2019 / Revised: 21 August 2019 / Accepted: 2 September 2019 / Published: 4 September 2019

Abstract

:
Porous asphalt pavement shows lower internal temperature than does dense-graded asphalt pavement under high temperature conditions in summer. To study the cooling effect of porous asphalt pavement, the thermophysical properties of a dense-graded asphalt concrete (AC) mixture and a porous asphalt concrete (PAC) mixture were determined using a parallel model. Then, a laboratory-simulated sunshine experiment was carried out, and the convective heat transfer coefficients of specimens were inferred by virtual experiment. Lastly, the temperature field distribution simulation of PAC pavement was analyzed. The results show that the thermophysical properties of the PAC-13 mixture are lower than those of the AC-13 mixture; the larger the proportion of air voids, the greater the difference appears. Under windy conditions, the convective heat transfer coefficients of the PAC specimen surfaces are higher than those of AC specimens, and the convective heat transfer coefficient of the specimen surface shows an upward trend with increasing air voids. The cooling effect of the porous pavement increases with increasing proportion of air voids, and the cooling effect of the porous asphalt pavement is better than that of the dense-graded asphalt pavement. There is a good positive linear correlation between cooling effect and air voids, and mathematical models between them which can provide an important reference for PAC pavement design were fitted.

1. Introduction

Summer has the strongest solar radiation in the year, and the surface temperature of pavement in this season is usually 15–30 degrees higher than the air. Asphalt concrete is a temperature-sensitive material, and high temperature is an extremely unfavorable condition for asphalt concrete. Various properties of the concrete will change in such a circumstance [1,2]. Under high-temperature conditions, the rutting resistance of the pavement will be weakened, which greatly increases the possibility of rutting on the asphalt pavement surface and affects the safety performance of the pavement [3]. Porous asphalt pavements are often referred to as cool pavements. The application of porous pavement can reduce the temperature peak inside the pavement so as to achieve cooling performance. The cooling performance of porous asphalt pavement is greatly affected by the air voids, and the related theory is not yet mature [4,5]. Therefore, it is necessary to study the influence of the air voids on the pavement temperature field and determine the cooling performance.
Mathematical methods have often been used to predict the internal temperature distribution of pavements by forming a specific database for predicting the regional temperature field distribution by monitoring the internal temperature of the pavement for a long time [6,7,8,9]. However, the object of the method is rather special and not suitable for wide applications. Therefore, numerical analysis methods which mostly use the zone discretization method to calculate the temperature of each node have been developed and utilized. Based on the heat conduction equation, Hermansson [6] used the finite difference approximation method to establish a simulation model of an asphalt pavement temperature field. Straub et al. [7] used discrete elements to discretize the pavement structure into several nodes and obtained the temperature values of each node by iteration. Hermansson [8] utilized a method proposed by Barber [9] to establish a model for the internal temperature simulation of pavement and verified it using LTPP data.
Different from the statistical and numerical analysis methods, analytical methods can comprehensively consider the influence of solar radiation, atmospheric temperature, pavement surface radiation, and environmental factors on the pavement temperature field during the pavement heat conduction process and thereby obtain a more rigorous and accurate solution. The advantage of this type of method is that there is no need to consider time steps or numerical stability and convergence conditions. Yan [10] used an isotropic surface layer, and the heat transfer problem under cyclic thermal force was solved through the analysis of the temperature field of the multilayer system. Liu and Yuan [11] proposed a theoretical solution for three-layer pavement based on the Fourier–Biot heat conduction equation. Wang and Roesler [12] proposed an analytical solution for one-dimensional pavement heat conduction by Laplace transform. On the premise that the pavement surface temperature is uniform, Wang [13] obtained the analytical solution of the one-dimensional road temperature field of the pavement surface temperature. On the basis of the Laplace transform method, Chong et al. [14] proposed a method for determining the pavement surface temperature under dynamic conditions such as geographical location, temperature, cloud cover, sunshine duration, and material properties.
Although domestic and international scholars have been deeply involved in various aspects of asphalt pavement research, there are relatively few studies on porous asphalt pavement, and the related technology is not yet mature. The internal temperature of asphalt pavement affects the service level and safety level of the pavement. The higher the temperature, the more prone to rutting, slippage, and deflection is the pavement, resulting in failure of the pavement and instability [15,16,17,18]. In this study, laboratory experiments and simulation experiments were carried out on porous pavement with different air voids. The cooling performance of the porous pavement was deeply studied; this can provide a reference for the promotion and application of porous asphalt pavements.
The objective of this study was to evaluate the cooling effect of porous asphalt concrete (PAC) pavements (compared with dense-graded asphalt pavement) with different air voids and to explore the functional relationship between the cooling effect of porous asphalt pavement and air voids.

2. Specimen Preparation

All specimens in the study had a height of 10 cm and a bottom area of 30 × 30 cm, as shown in Figure 1. The specimens consisted of two layers. The thickness of the upper layer was 4 cm, and the lower layer was 6 cm. According to different design requirements, AC-13/PAC-13 and AC-20 were laid on the upper layer and lower layer, respectively. The gradation of PAC-13 is shown in Table 1, and five kinds of PAC-13 specimens were made.
The air voids (p) of the specimens were calculated using Equation (1), and the results are shown in Table 1.
p = ( 1 γ s γ t ) × 100 %
Here, γs is the bulk volume relative density of the asphalt mixture and γt is the theoretical maximum relative density of the asphalt mixture.
We selected the upper layer and middle layer in the actual pavement as the research objects for the design of structural combinations. The design results and specimen numbers are shown in Table 2.

3. Determination of the Thermophysical Properties of Mixtures

3.1. Specific Heat

The specific heat, an inherent property of a material, is defined as the heat absorbed by a unit of mass when there is a unit temperature increase. Domestic and foreign scholars have carried out systematic research on the specific heat of asphalt mixtures. The specific heat of the asphalt mixture can be expressed by a parallel model:
c m = c i B i
where cm is the specific heat of the asphalt mixture (J/(kg·K)), ci is the specific heat of component i of the mixture (J/(kg·K)), and Bi is the mass fraction of component i of the mixture.
A porous asphalt mixture mainly consists of coarse aggregate, fine aggregate, mineral powder, asphalt, and voids. Since the coarse aggregate and the fine aggregate in this study were both basalt, they share the same specific heat. According to Equation (2), the specific heat of the mixture for different proportions of air voids can be figured out.

3.2. Thermal Conductivity

The thermal conductivity is defined as the heat transfer through a square meter of a material (1 m thick) with a temperature difference of 1 degree (K, C) on both sides of the surface within 1 second under stable heat transfer conditions. The unit of thermal conductivity is W/(m·K)
In this study, the thermal conductivity of the porous asphalt mixture specimens was tested using a heat flow meter.

3.3. Thermal Diffusivity

The thermal diffusivity is a measurement of the rate at which a disturbance of the temperature at one point in the object is transmitted to another point. Taking the case of object heating as an example, the heat transfer process belongs to unsteady heat conduction. When the object is heated, heat energy will be continuously absorbed along the way to increase the local temperature, and the process continues until the temperature inside the object reaches the same degree everywhere. Compared with thermal conductivity, the thermal diffusivity is more intuitive in reflecting the rate of heat transfer inside the material.
The expression of the thermal diffusivity is
α = λ ρ c
where α is the thermal diffusivity of the material (m2/s), λ is the thermal conductivity of the material (W/(m·K)), ρ is the density of the material (kg/m3), and c is the specific heat of the material (J/(kg·K)).

3.4. Data Analysis

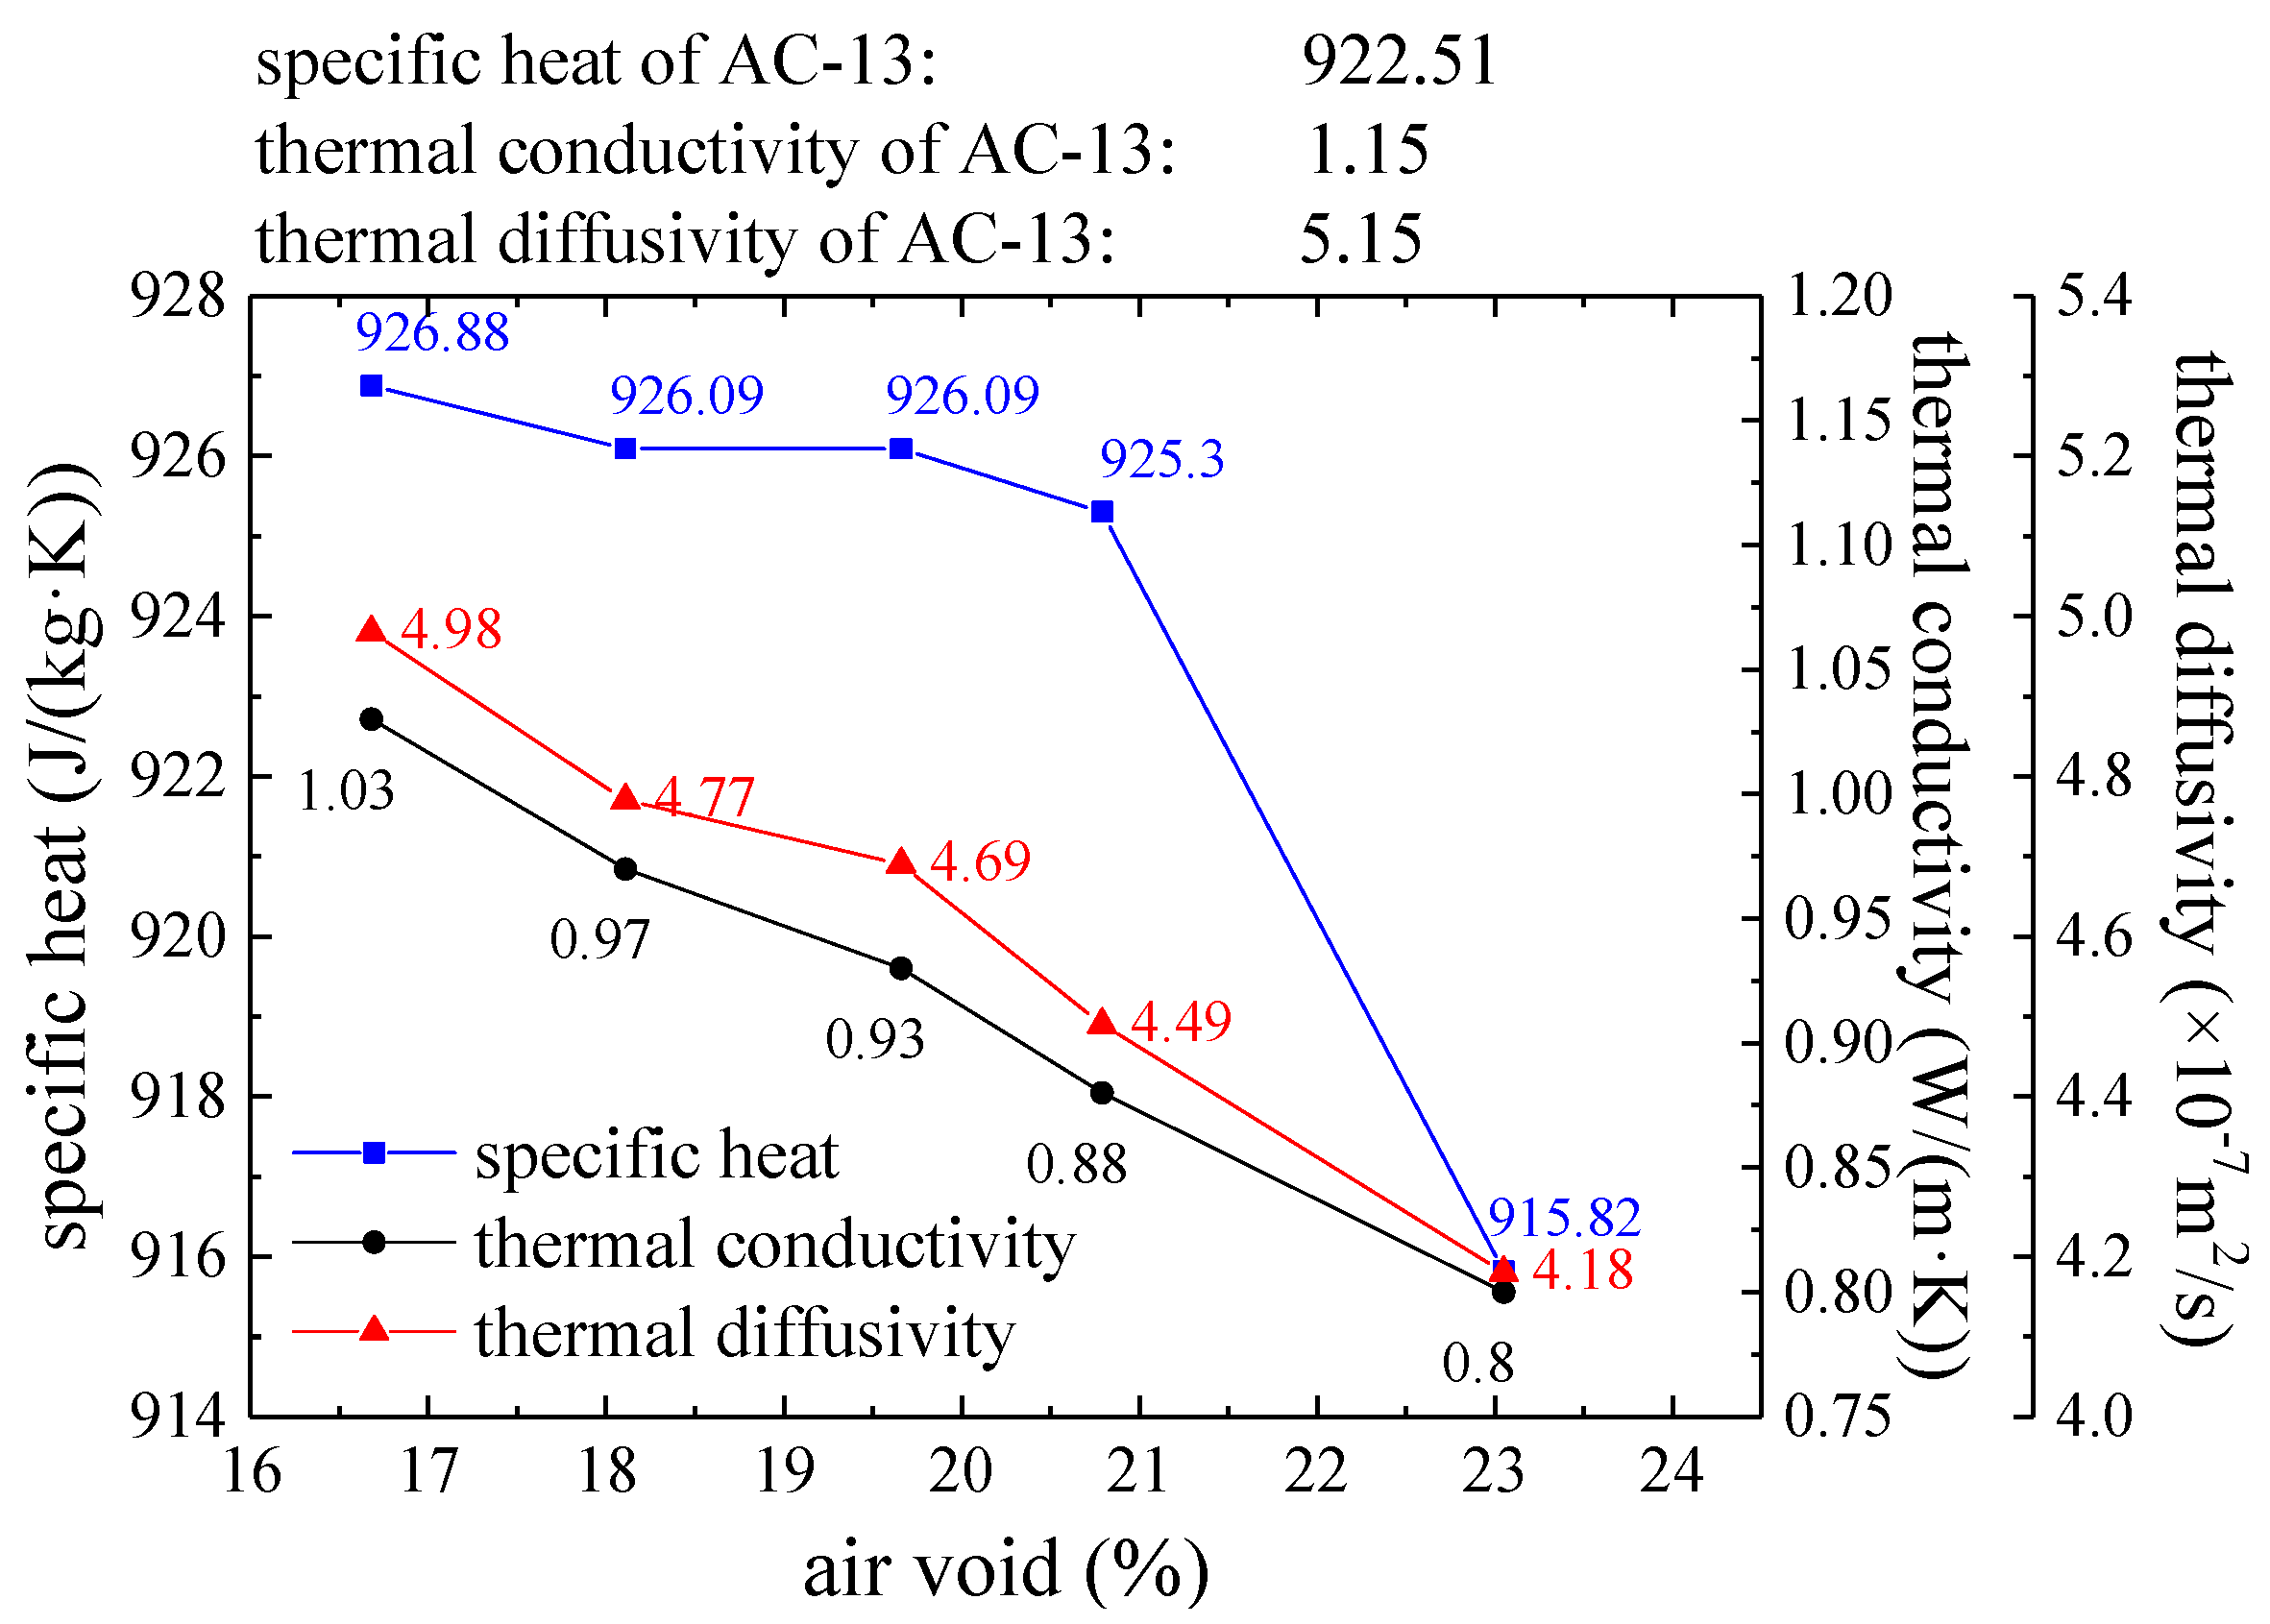
According to the above Equations, the specific heat, thermal conductivity, and thermal diffusivity of a PAC-13 porous asphalt mixture can be easily accessed. The results are shown in Figure 2. It can be seen that the specific heat, thermal conductivity, and thermal diffusivity of the PAC-13 porous asphalt mixtures decreased with increasing proportion of air voids. Bigger air voids lead to less heat absorption per unit volume of porous asphalt mixture; moreover, the process of heat transfer and diffusion is also slowed down.
Comparing the thermophysical property values of the PAC-13 porous asphalt mixtures and those of dense-graded asphalt mixture (AC-13), it was shown that the specific heat of the dense-graded asphalt mixture is generally smaller than that of a porous asphalt mixture, while the thermal conductivity and thermal diffusion showed the opposite behavior. So, a conclusion can be draw that the heat absorption, conduction, and diffusion performance of the dense-graded asphalt mixture are better than that of a porous asphalt mixture.
Through the above analysis, it turns out that the temperature field inside porous asphalt pavement is less sensitive to surface temperature change than that in dense-graded pavement. In addition, when a porous asphalt pavement surface absorbs the same heat, bigger air voids will result in lower temperature at a certain depth, and the temperature will also be lower than that in dense-graded pavement.

4. Sunshine Experiment

Actual sunshine experiments are greatly influenced by environmental factors, and their poor controllability and long experiment cycle are fatal shortcomings. In this study, a simulated sunshine experiment and a finite element virtual experiment were used to evaluate the cooling effect of porous asphalt pavement.

4.1. Simulated Sunshine Experiment under Windless Conditions

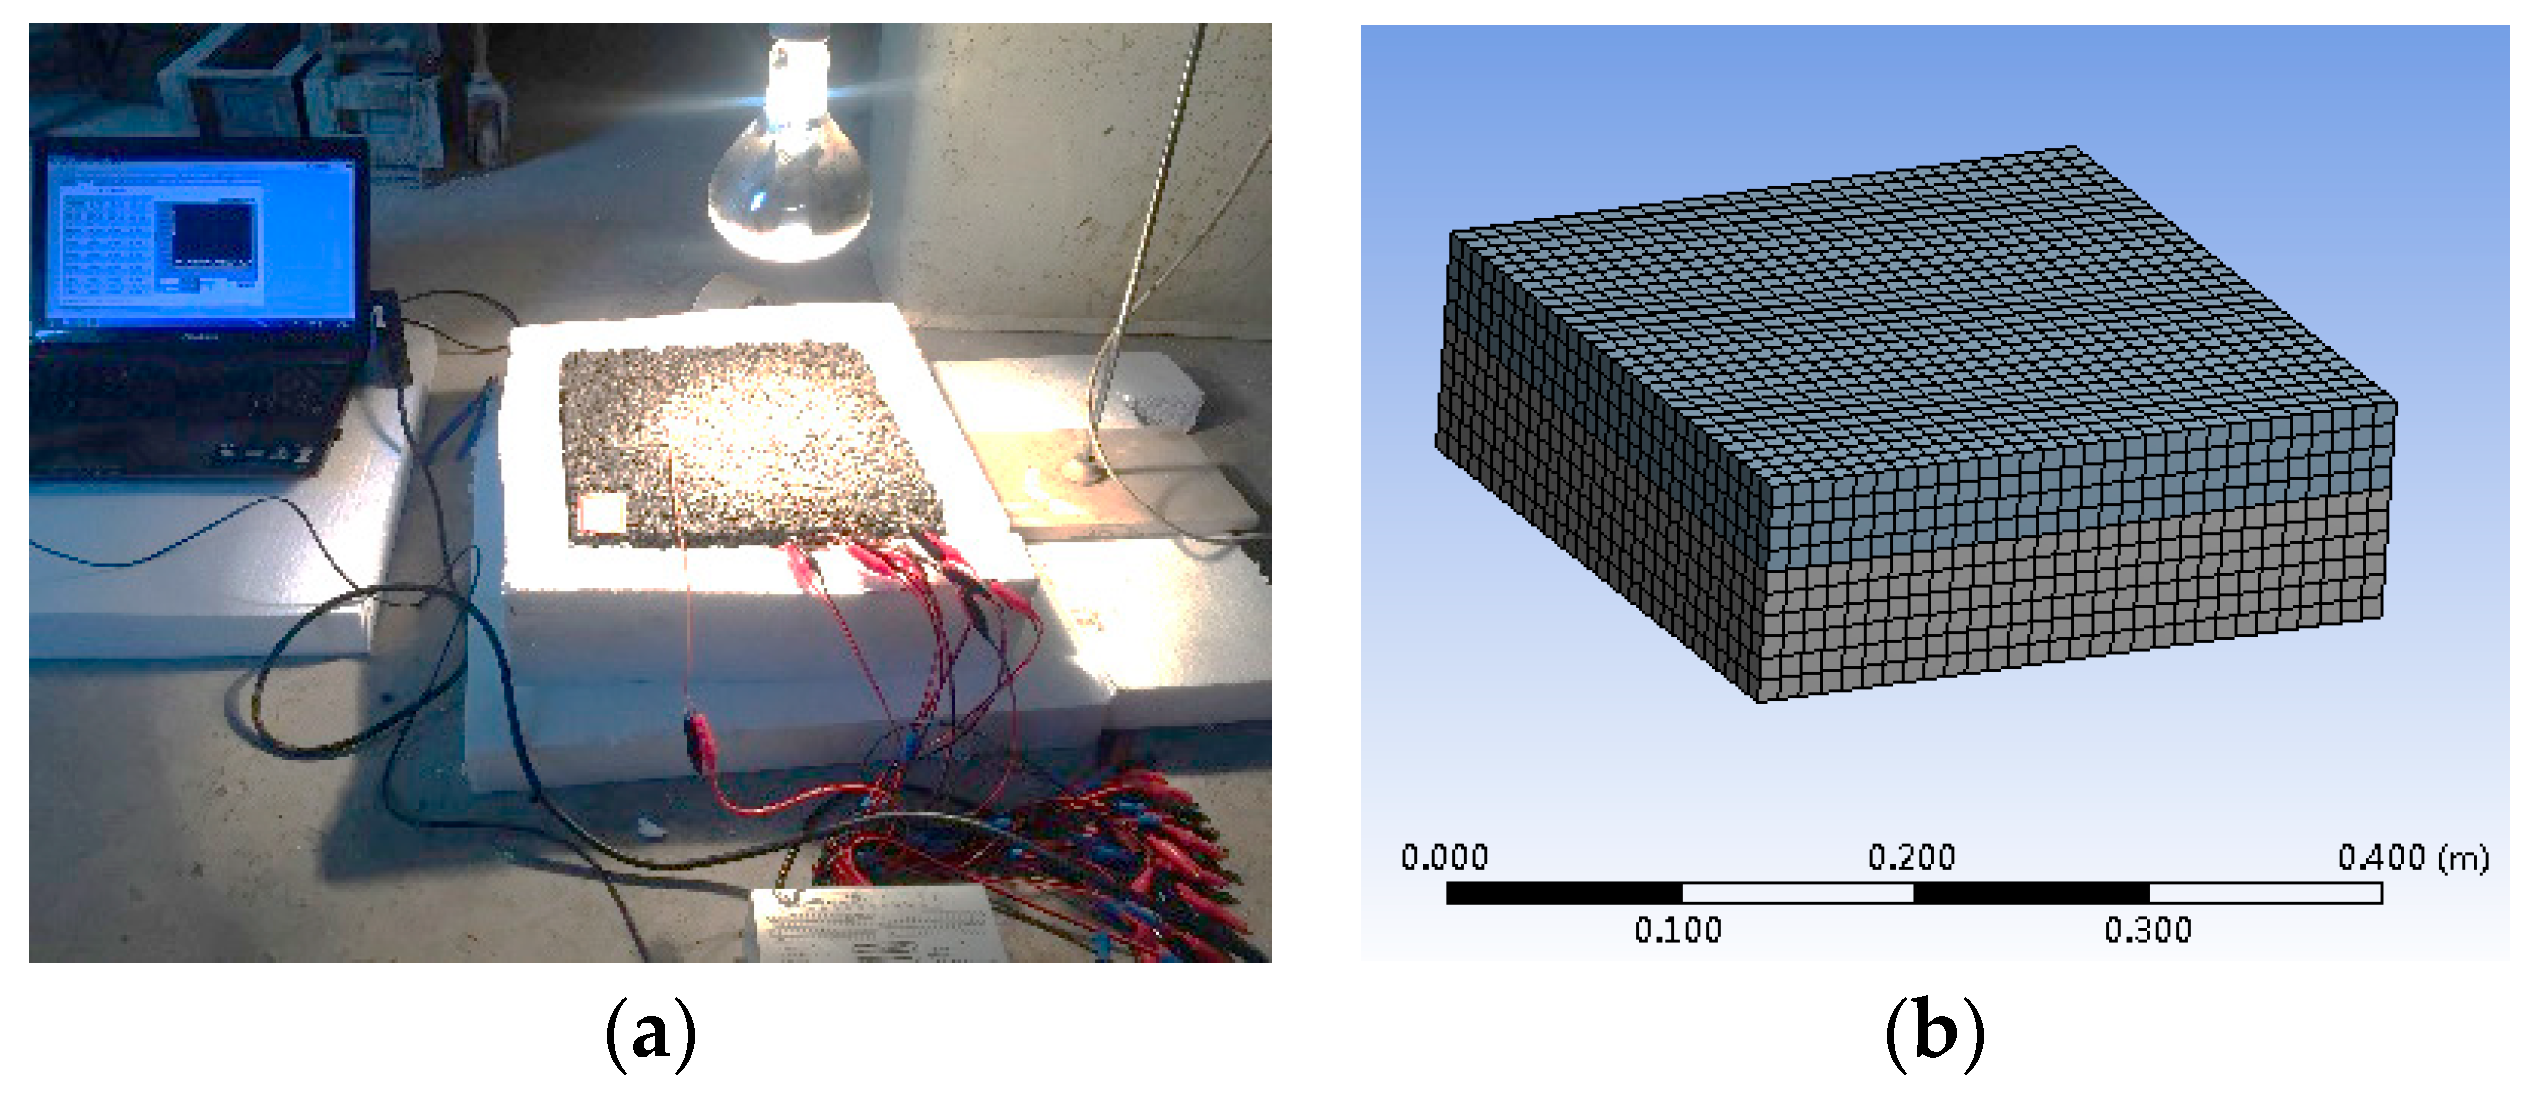
The specimens were placed on a thermal insulation board (Styrofoam), and the four sides of the specimens were covered with 10 cm thick thermal insulation board, as shown in Figure 3a. A UV light bulb (A, 220 V, 275 W) was used as the light source to simulate sunshine to heat the specimens, and a temperature sensor was used to record the temperature at different depths of the specimens.

4.2. Simulated Sunshine Experiment under Windy Conditions

For actual pavement, the water content and surface wind speed are main factors that have a great impact on the cooling effect of the pavement. However, in an experiment, it is difficult to accurately control the water content because it easily flows away from the boundary. So, this study mainly focused on the influence of surface air flow on the temperature of the specimens.
In actual engineering applications, the air flow velocity (wind speed) is relatively easily obtained. Taking Nanjing as an example, according to the relevant data released by Nanjing Meteorological Observatory, the annual average wind speed in Nanjing is 2.61 m/s. For experiments considering wind, a fan was used to increase the air flow on the surface of the specimens, working on the basis of the windless experiment conditions. The horizontal distance between fan and specimens was adjusted until the surface wind speed was about 2.61 m/s.

4.3. Finite Element Virtual Experiment

ANSYS Workbench was used to model the specimens in this study. The finite element model being meshed is shown in Figure 3b. The size of the model was 30 × 30 × (4 + 6) cm. The relevant thermophysical properties in Figure 2 were assigned to the finite element models.
The four sides and the bottom boundary conditions of the models were set as adiabatic walls, and only the upper surface of models was allowed to exchange heat energy with the outside. The heat radiation coefficient of the upper surface was set to 0.93. According to the empirical formula (as shown in Equation (4)), the convective heat transfer coefficient (hr) of the model surface can be determined.
h r = 3.7 v + 9.4
The v in Equation (4) represents the wind speed (m/s), and it was set to 0 in the sunshine simulation experiment under windless conditions. Therefore, the surface convective heat transfer coefficient was 9.4 W·m−2·°C−1. The convective heat transfer coefficient on the model surface under windy conditions should be determined by combining the laboratory experiment and virtual experiment results.

4.4. Data Analysis

Asphalt concrete is a temperature-sensitive material. Nonlinear viscoelastic response will occur inside asphalt concrete at high temperatures [19,20,21]. Porous asphalt pavement performs similarly at high temperatures.
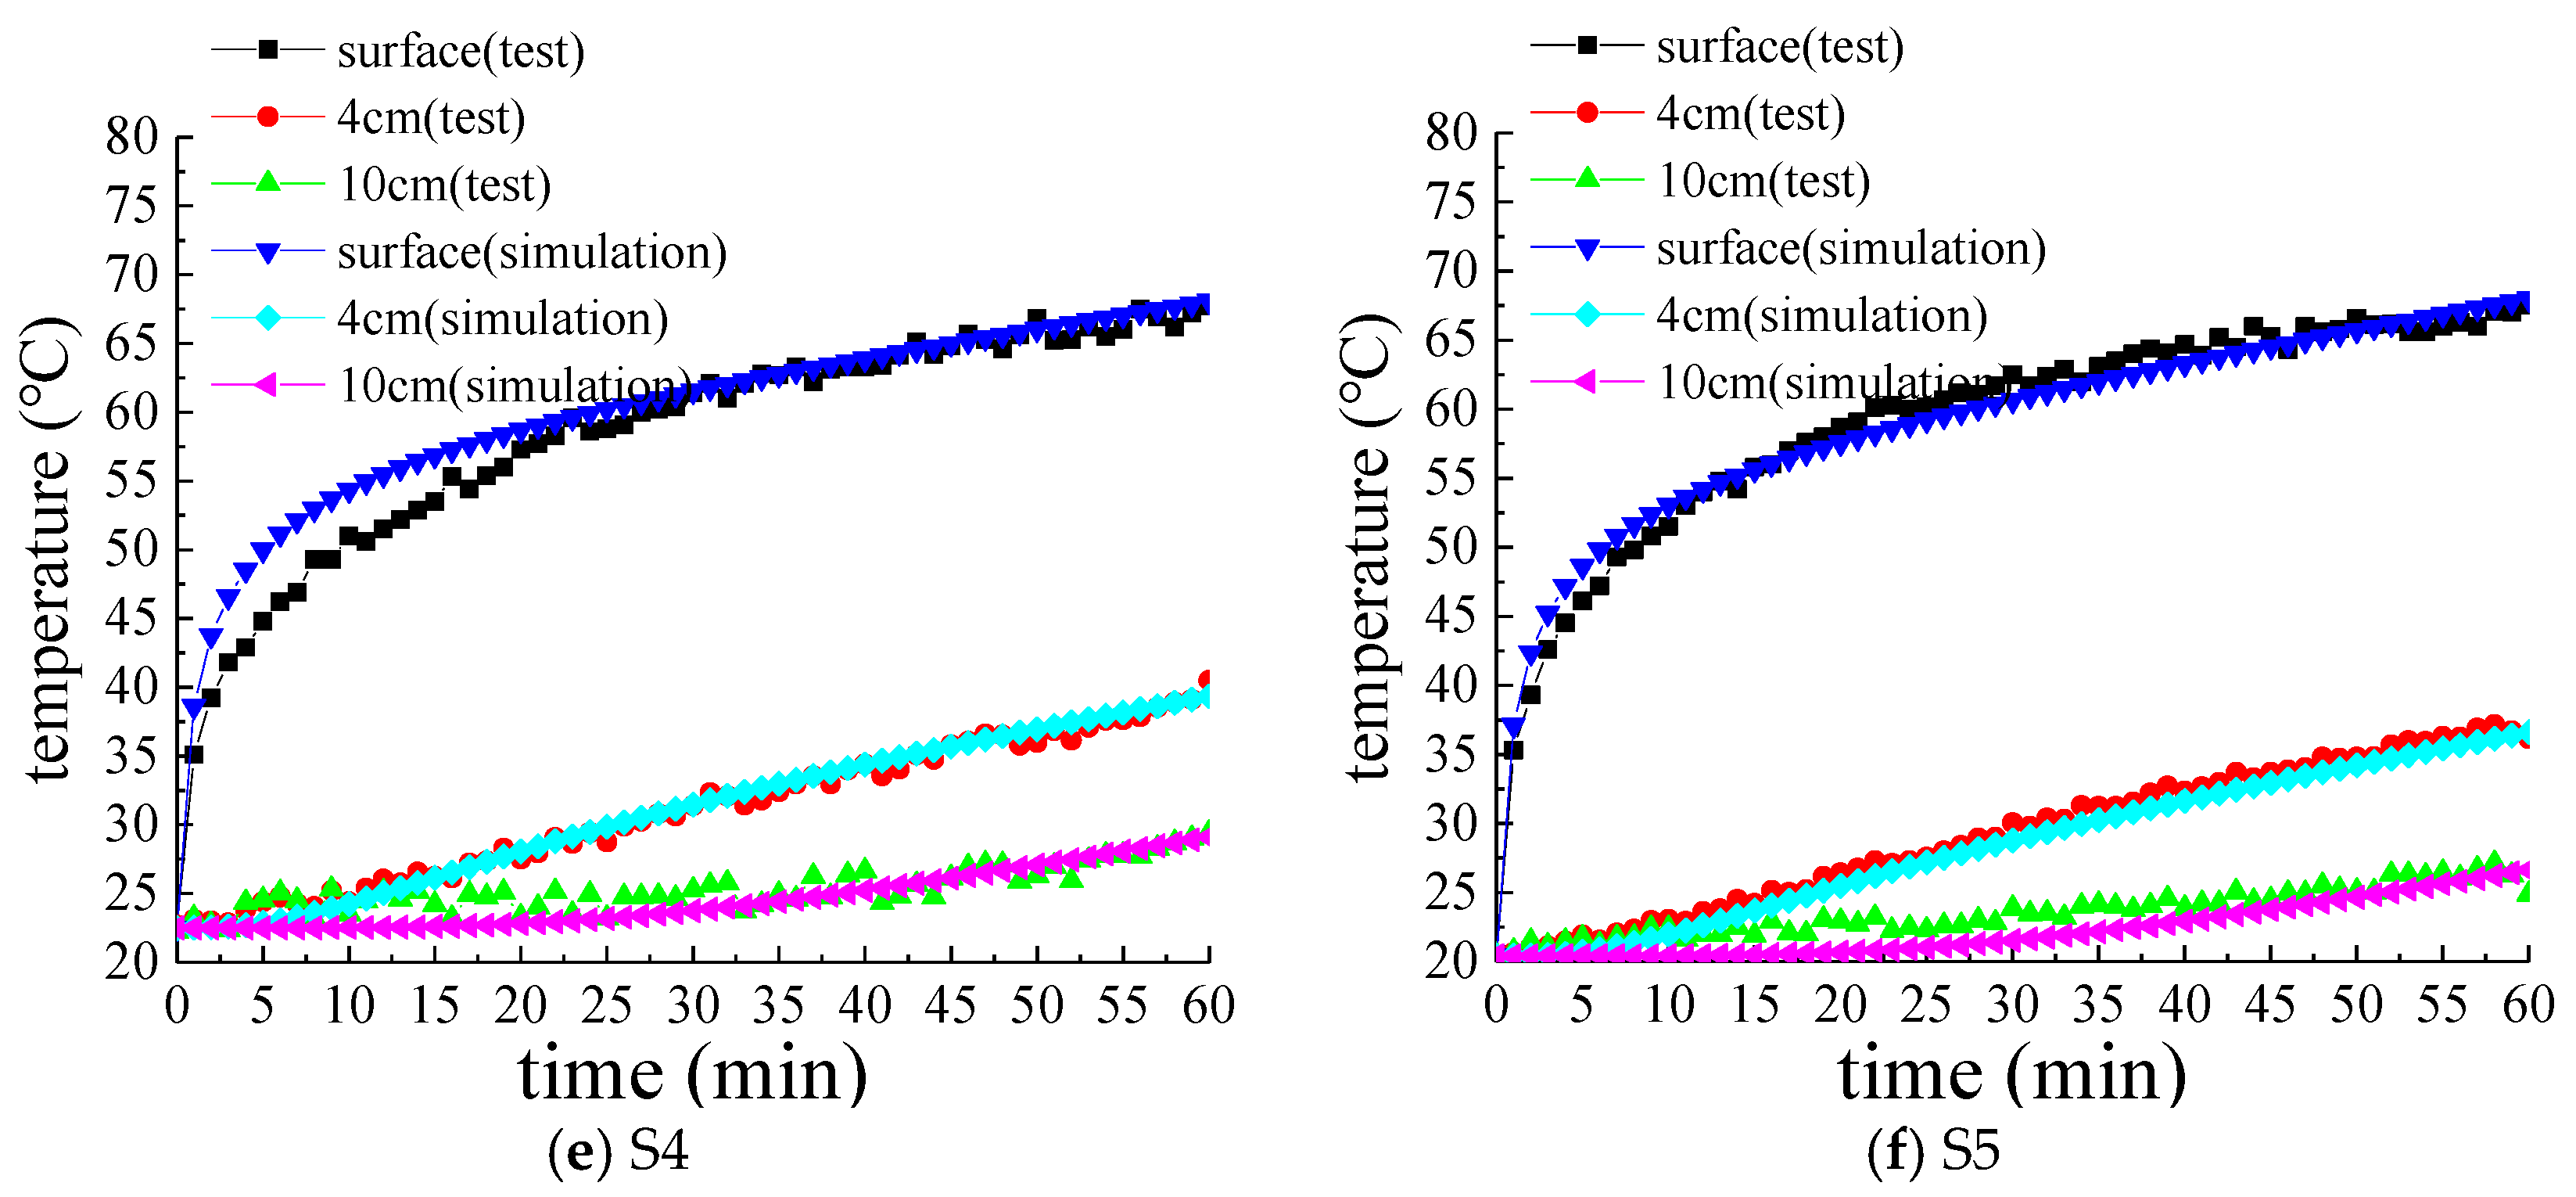
The surface temperature variation curves of each specimen in the sunshine experiment under windless conditions are shown in Figure 4, including two kinds of curves. The curves marked with “(test)” represent the results of the laboratory sunshine experiment, and the others marked with “(simulation)” are the results of the virtual simulation experiment.
It was shown that the temperature variation of the AC specimens and the PAC specimens was similar at the same depth. At the beginning of the experiment, the surface temperature of all specimens rose rapidly. As time went by, the surface temperature curves gradually become gentle and tended to be stable. By comparing temperature values at different depths, it can be concluded that the temperature conduction in asphalt pavement has hysteresis on the vertical direction. With increasing depth, this hysteresis becomes more obvious. About half of the temperature increment was completed within a few minutes after the experiments began. However, at the bottom of the specimens, almost no temperature change was observed in the first 25 minutes. Therefore, with increasing depth, the temperature variation will be less affected by the temperature variation of the pavement surface. Besides this, the results of the laboratory experiment and the virtual simulation experiment are very close, indicating that the accuracy of the virtual experiment is very reliable.
The temperature values of the specimens at different depths in the windless laboratory sunshine experiment are listed in Table 3. As shown in the table, the surface temperature of PAC specimens was slightly higher than that of the AC specimens. The reason for this phenomenon is that after absorbing heat on the surface in a windless environment, there is no air flow between adjacent voids to take away heat and reduce temperature. Moreover, as mentioned above, the thermal diffusion coefficient of the porous asphalt mixture decreases with increasing proportion of air voids. Therefore, larger air voids will accumulate more heat on the surface, so the temperature will be higher.
In addition, when the depth was 4 or 10 cm (corresponding to the top surface and the bottom surface of the middle layer), the temperature of the PAC specimen was lower than that of the AC specimen, indicating that when the wind and pavement are all dry, the temperature of the middle layer of porous pavement is still lower than that of the dense-graded pavement. Rutting mainly occurs in the middle and lower layers. Therefore, porous asphalt pavement can reduce the temperature of the middle layer and lower layers, reduce the probability of rutting under extreme conditions, and thus improve the safety performance of the pavement.
It can also be concluded from Table 3 that the larger the proportion of air voids, the lower the temperature of the lower layer in the PAC specimen, and the temperatures at both depths were lower than those in the AC specimen. The results indicated that the cooling performance of the PAC specimens was better than that of the AC specimen. Thus, the cooling performance of PAC pavement is better than that of dense-graded pavement.
Compared with the sunshine experiment under windless conditions, only wind speed changed in the sunshine experiment under windy conditions, and the other conditions remain unchanged. Therefore, it can be considered that changes in the test results are only related to the surface wind speed and the thermophysical characteristics of specimens. In order to save space, only the results of the specimen surface temperature are depicted in Figure 5. It can be seen that the surface temperature variation curves of the PAC specimens and the AC specimen are similar, and the temperature of the specimen surfaces rose very fast at the beginning of the test. As time went by, the temperature curves gradually become gentle and tended to be stable, and the surface temperature of PAC specimens was always smaller than that of the AC specimen. In addition, except for S4, the temperature curves of the specimens show that the larger the air voids, the lower the surface temperature. The surface equilibrium temperatures of specimens also showed a similar phenomenon, as shown in Table 4, indicating that the cooling performance of PAC specimens was better than that of the AC specimen.
According to the surface temperature variation curve of the AC specimen, the power of the infrared light absorbed by the specimen can be calculated (about 65 W). The thermophysical property parameters of the specimens were previously determined. Only the convective heat transfer coefficient of the specimen surface is still unknown. Therefore, the calculation results of the finite element model can be controlled by adjusting the input value of the convective heat transfer coefficient. When the simulation result is close to the actual measurement result in Figure 5, the value can be considered as the convective heat transfer coefficient of the specimen surface. The convective heat transfer coefficient of each specimen is shown in Table 4.
As shown in Table 4, the convective heat transfer coefficients of the PAC specimens are larger than that of the AC specimen. There are many voids on the PAC specimen surface, so the contact area between the PAC specimen and air is larger than that for the AC specimen. When air flow occurs on the specimen surface, the PAC specimens more easily conduct heat to the air. With increasing proportion of air voids, the convective heat transfer coefficient on the specimen surface also showed an increasing trend. It was indicated that as the proportion of air voids increases, the movement of air makes it easier to carry away heat from the specimens.

5. Finite Element Simulation of the Pavement Temperature Field

In order to further study the influence of air voids on the cooling performance of porous asphalt pavement, a simulation study of the sunshine experiment by finite element software was carried out by the authors.
The software ABAQUS was used in the research for finite element simulation. The whole process mainly consists of six steps: model establishment, material parameter assignment, boundary conditions assignment, steady-state analysis, transient analysis, and data post-processing.

5.1. Model Establishment

A virtual experiment was used to simulate the temperature field distribution of porous asphalt pavement. Because the process of defining boundary conditions in ANSYS Workbench is complicated and the calculation speed is slow, the study only used ABAQUS to simulate the temperature change of the pavement within 24 hours. According to the simulation results, the maximum temperature variation in pavement with different air voids was analyzed, and the influence of air voids on the cooling performance of the porous pavement was evaluated.
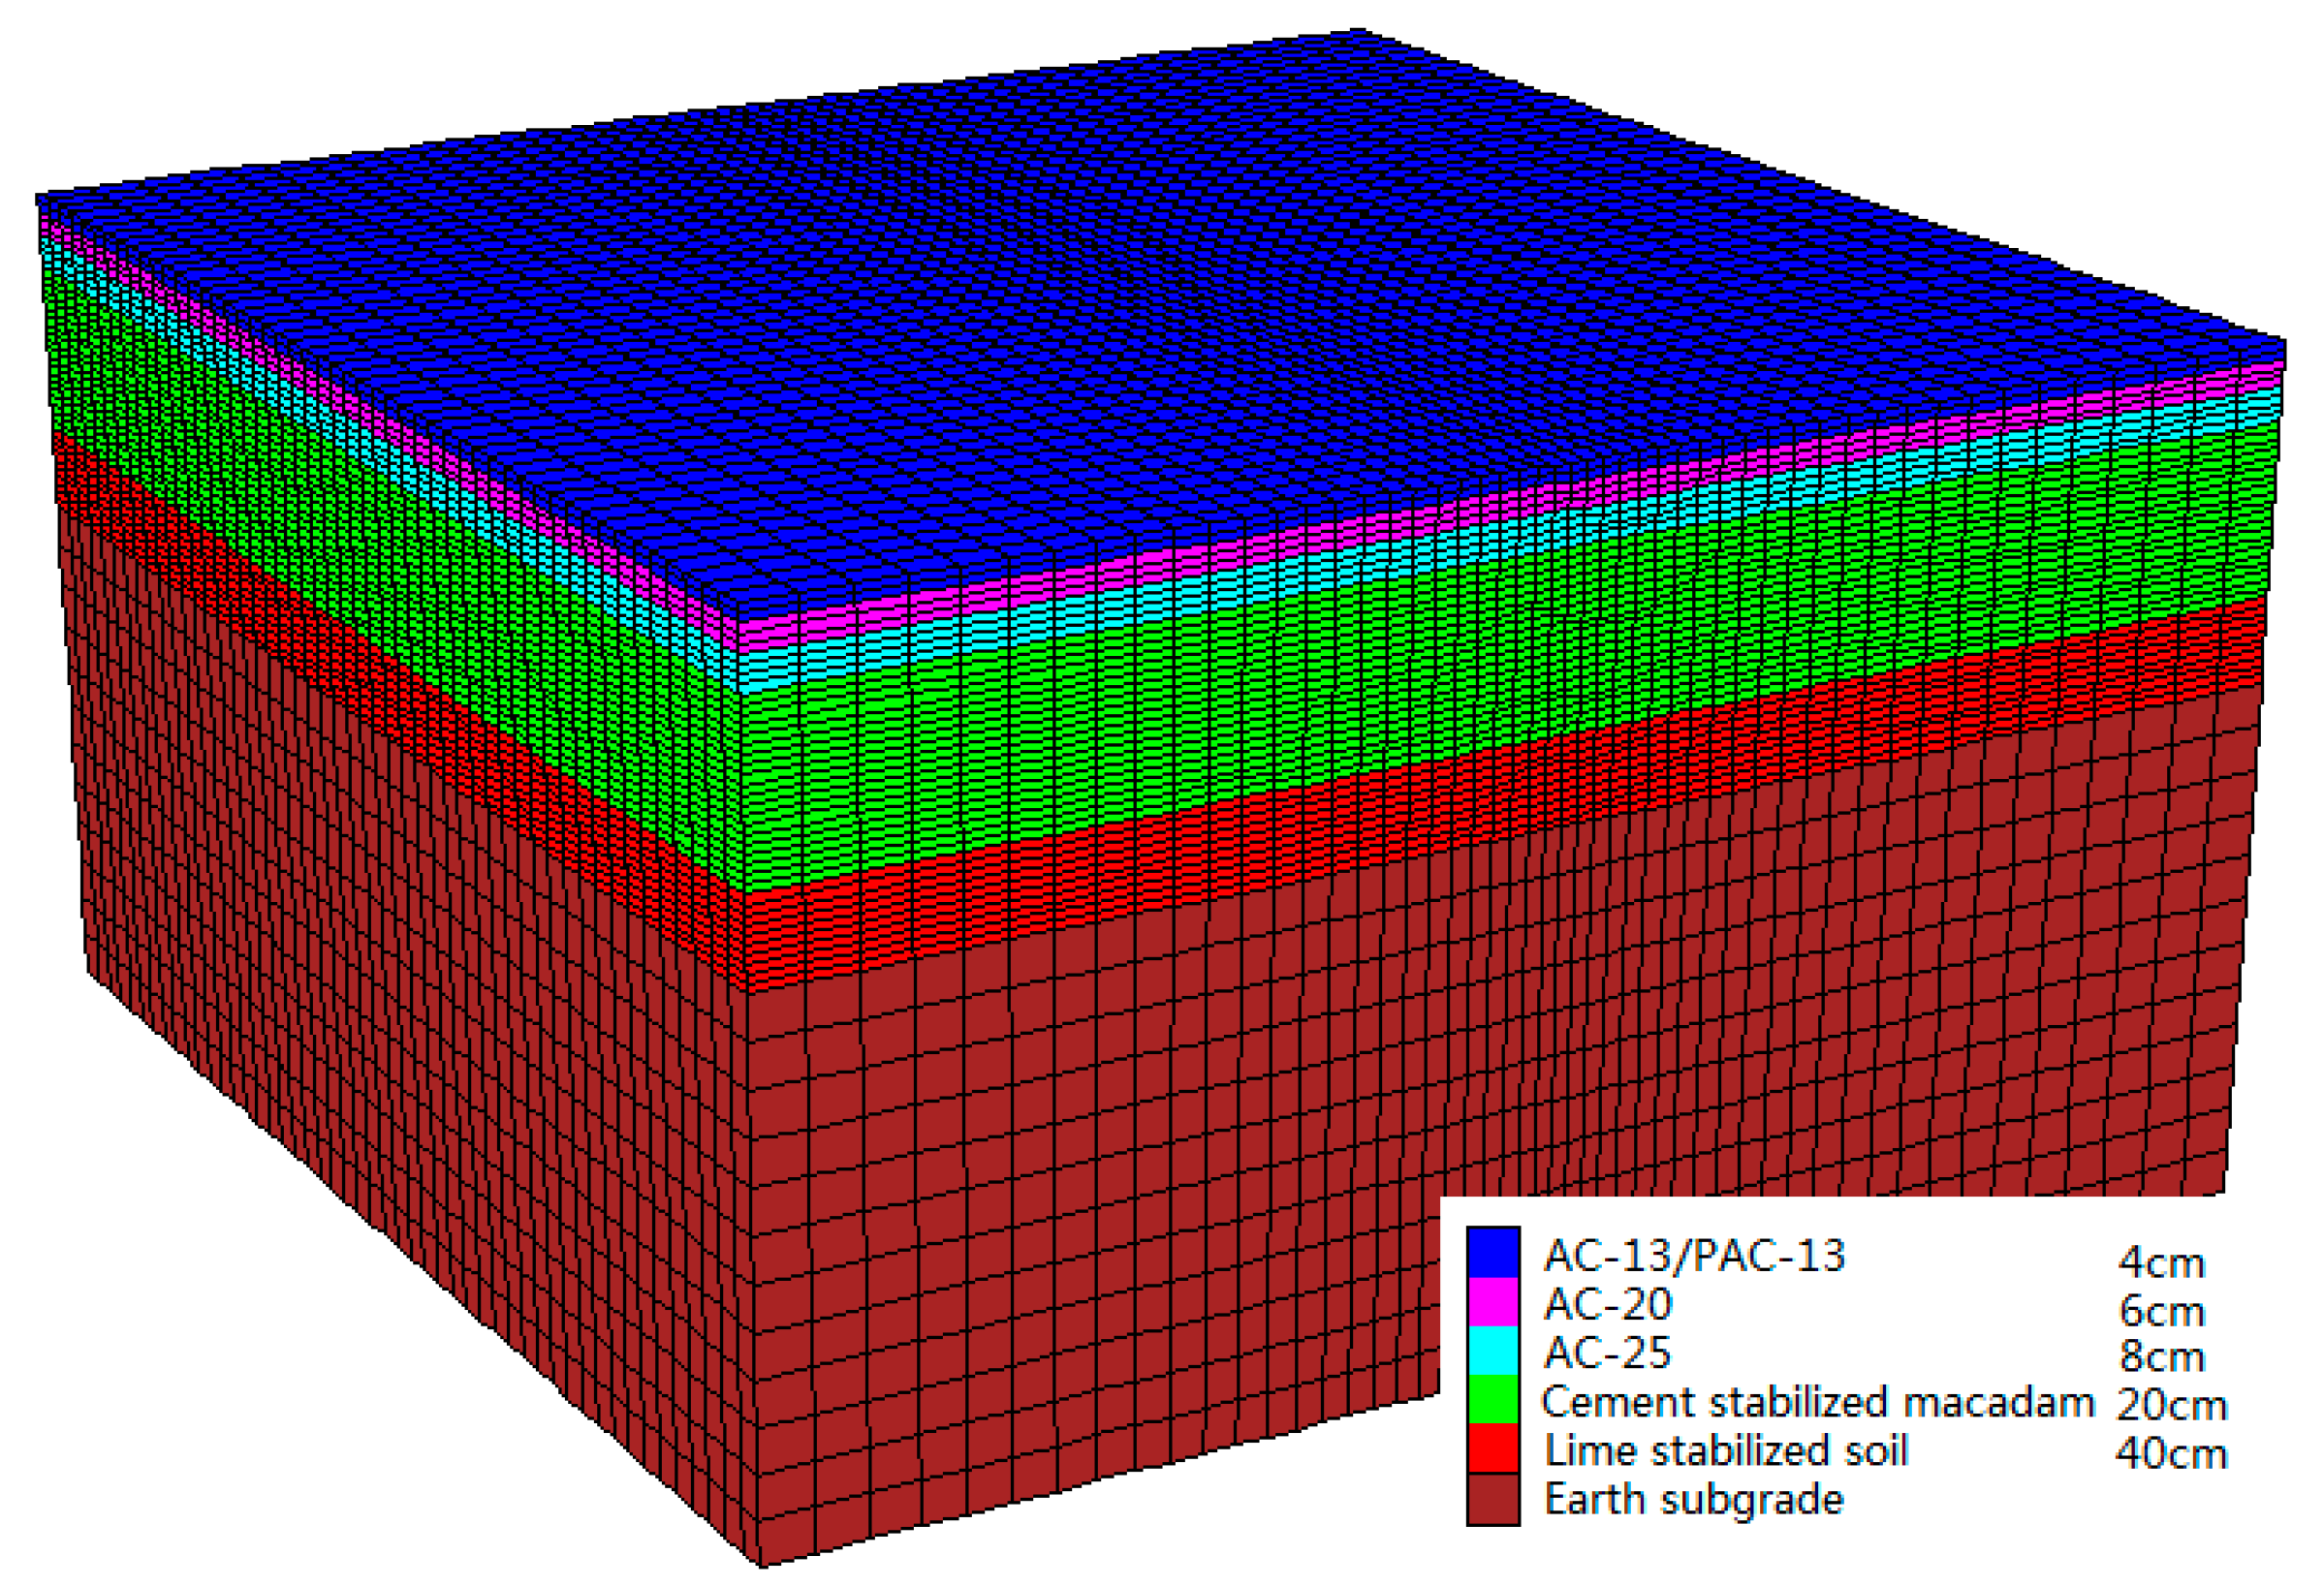
Pavement is a layered structure, so the study divided the models into six layers. The upper layer was AC-13/PAC-13, the middle layer was AC-20, the lower layer was AC-25, the base layer was a cement-stabilized macadam base layer, and the cushion layer was made of lime-stabilized soil. The order and thickness of each layer were as shown in Figure 6.
In the finite element simulation process, every layer was treated as a complete and independent isotropic material. It was assumed that the pavement had a good compaction effect and that there was no thermal resistance between two adjacent layers with a tight contact interface. Therefore, after meshing, it was only necessary to input the thermophysical property parameters of each layer into the model to complete the model establishment.
The thermophysical properties of the materials used in the upper and middle layers were studied as mentioned above. The thermophysical property parameters of the other layers are shown in Table 5.

5.1.1. Boundary Conditions

High-temperature instability damage to pavement mostly occurs in asphalt pavement when exposed to high-intensity light exposure and drying conditions. Therefore, in evaluating the influence of the air voids on the cooling effect of PAC pavement, the pavement was considered in dry conditions and with no water in the voids. Environmental factors that affect the temperature field of the pavement include solar radiation, air temperature, and wind speed. The convective heat transfer coefficient of each PAC specimen was studied as mentioned above. In addition, it was necessary to determine the daily variation of solar radiation and air temperature.
(1) The Variation of Daily Solar Radiation
The daily variation of solar radiation q(t) used in the models is shown in Equation (5):
q ( t ) = { 0 0 t 12 c 2 q 0 cos m ω ( t 12 ) 12 + c 2 t 12 + c 2 0 12 + c 2 t 24
where q0 = 0.131mQ is the maximum radiation intensity at noon (J/m2), m = 12/c, Q is the total amount of solar radiation in a day (J/m2), c is the effective sunshine hours (h), and ω = 2π/24 is the angular frequency (rad).
(2) The Variation of Daily Temperature
Two sinusoidal functions were used to express the variation of daily temperature, as shown in Equation (6):
T a = T ¯ a + T m [ 0.96 sin ω ( t t 0 ) + 0.14 sin 2 ω ( t t 0 ) ]
where Ta is the air temperature (°C); T ¯ α = (Tmax + Tmin)/2 is the average daily temperature (°C), Tm = (TmaxTmin)/2 is the amplitude of daily temperature (°C), and t0 is the initial phase.
In this study, Tmax = 40 °C, Tmin = 26 °C, and t0 = 3.

5.1.2. Finite Element Model

Referring to the width of the actual road lane, the size of the pavement models was set to be 3.75 × 3.75 × 2 m. At the same time, the external temperature load was loaded on the surface of the model so that heat exchange between the pavement and the external environment only existed on the surface of the models. Meanwhile, because heat transfer mainly occurs in the superstructure of the pavement, an upper dense and lower sparse form was adopted in mesh generation as it can improve the calculation speed and accuracy. The mesh generation results are shown in Figure 6.
After the modeling was completed, the pavement temperature field was analyzed according to the determined parameters. The analysis mainly included two processes named steady-state analysis and transient analysis. The key step of steady-state analysis is to set the initial temperature of the model. For the convenience of the following analysis and comparison, the initial temperature of the model was set to 27 °C and the duration of the steady-state analysis was set to 1 × 10⁻⁷ h.
Transient analysis is the key step in the whole analysis process of finite element models. During the transient analysis process, the temperature load is applied to the surface in order to analyze the heat transfer process of the models. The step length was set to be 1 and the total number of steps was 24, with each analysis step corresponding to an integer hour in a day.

5.2. Finite Element Simulation Result Analysis

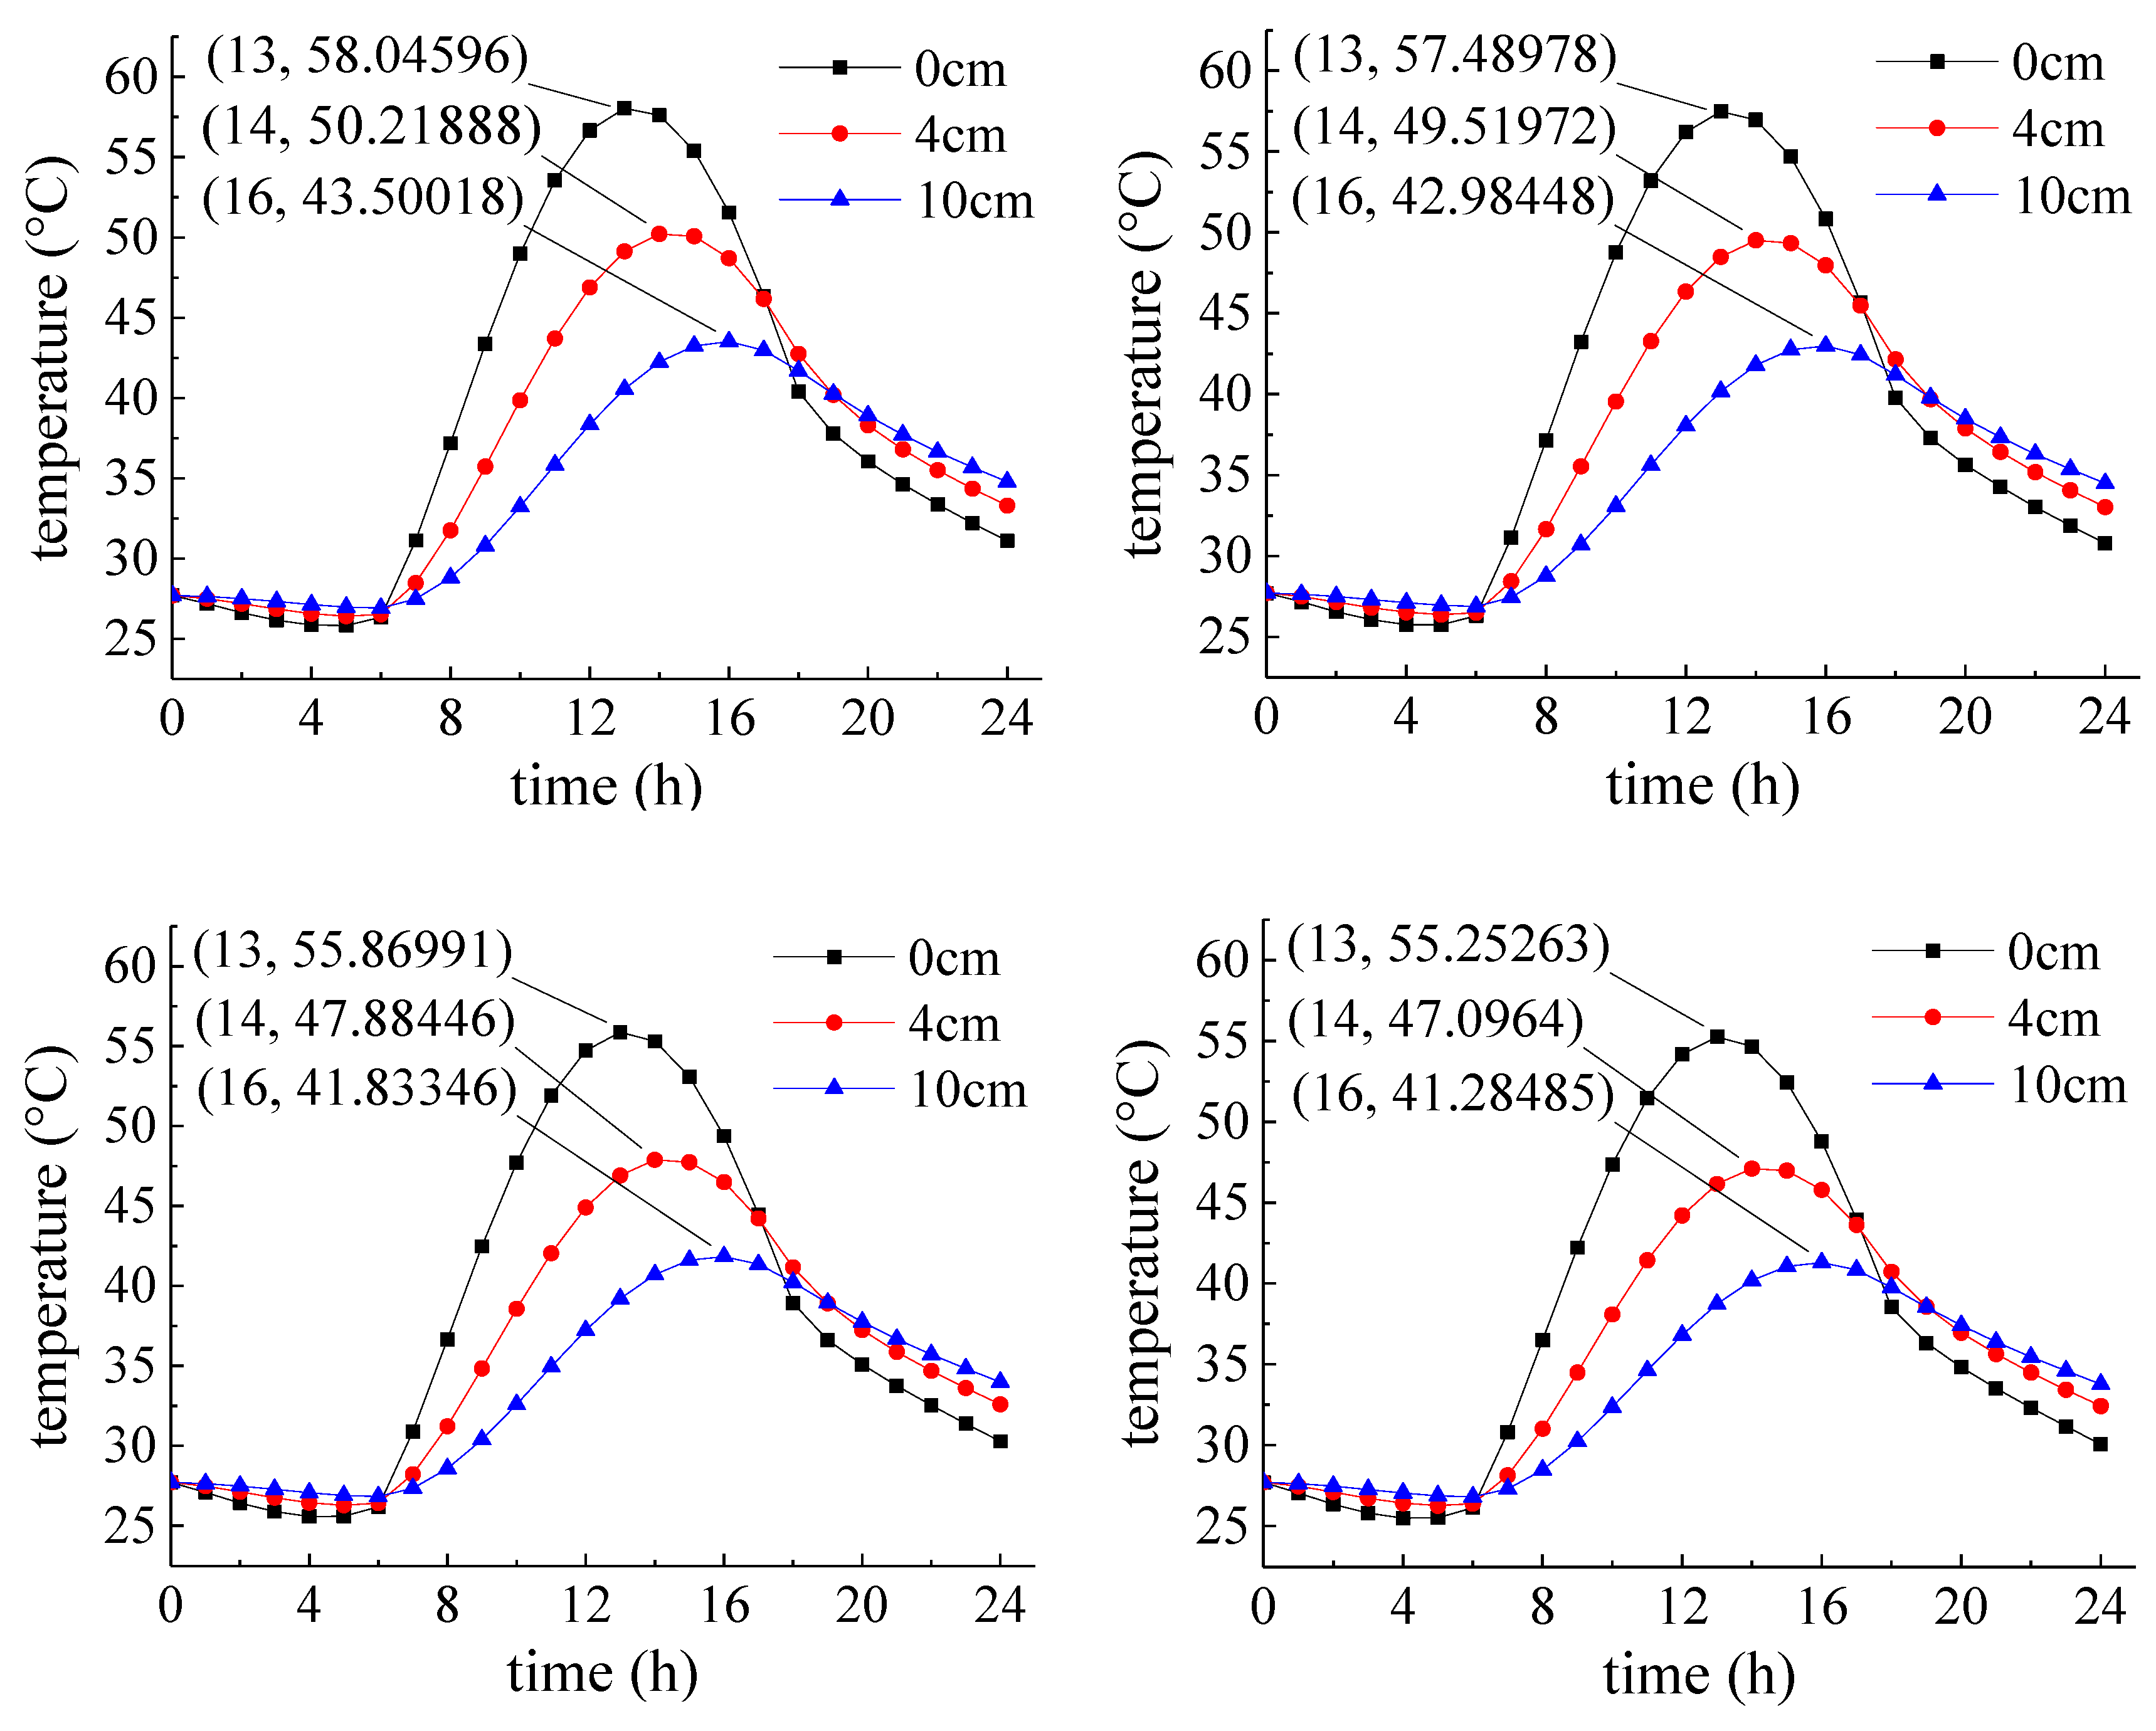
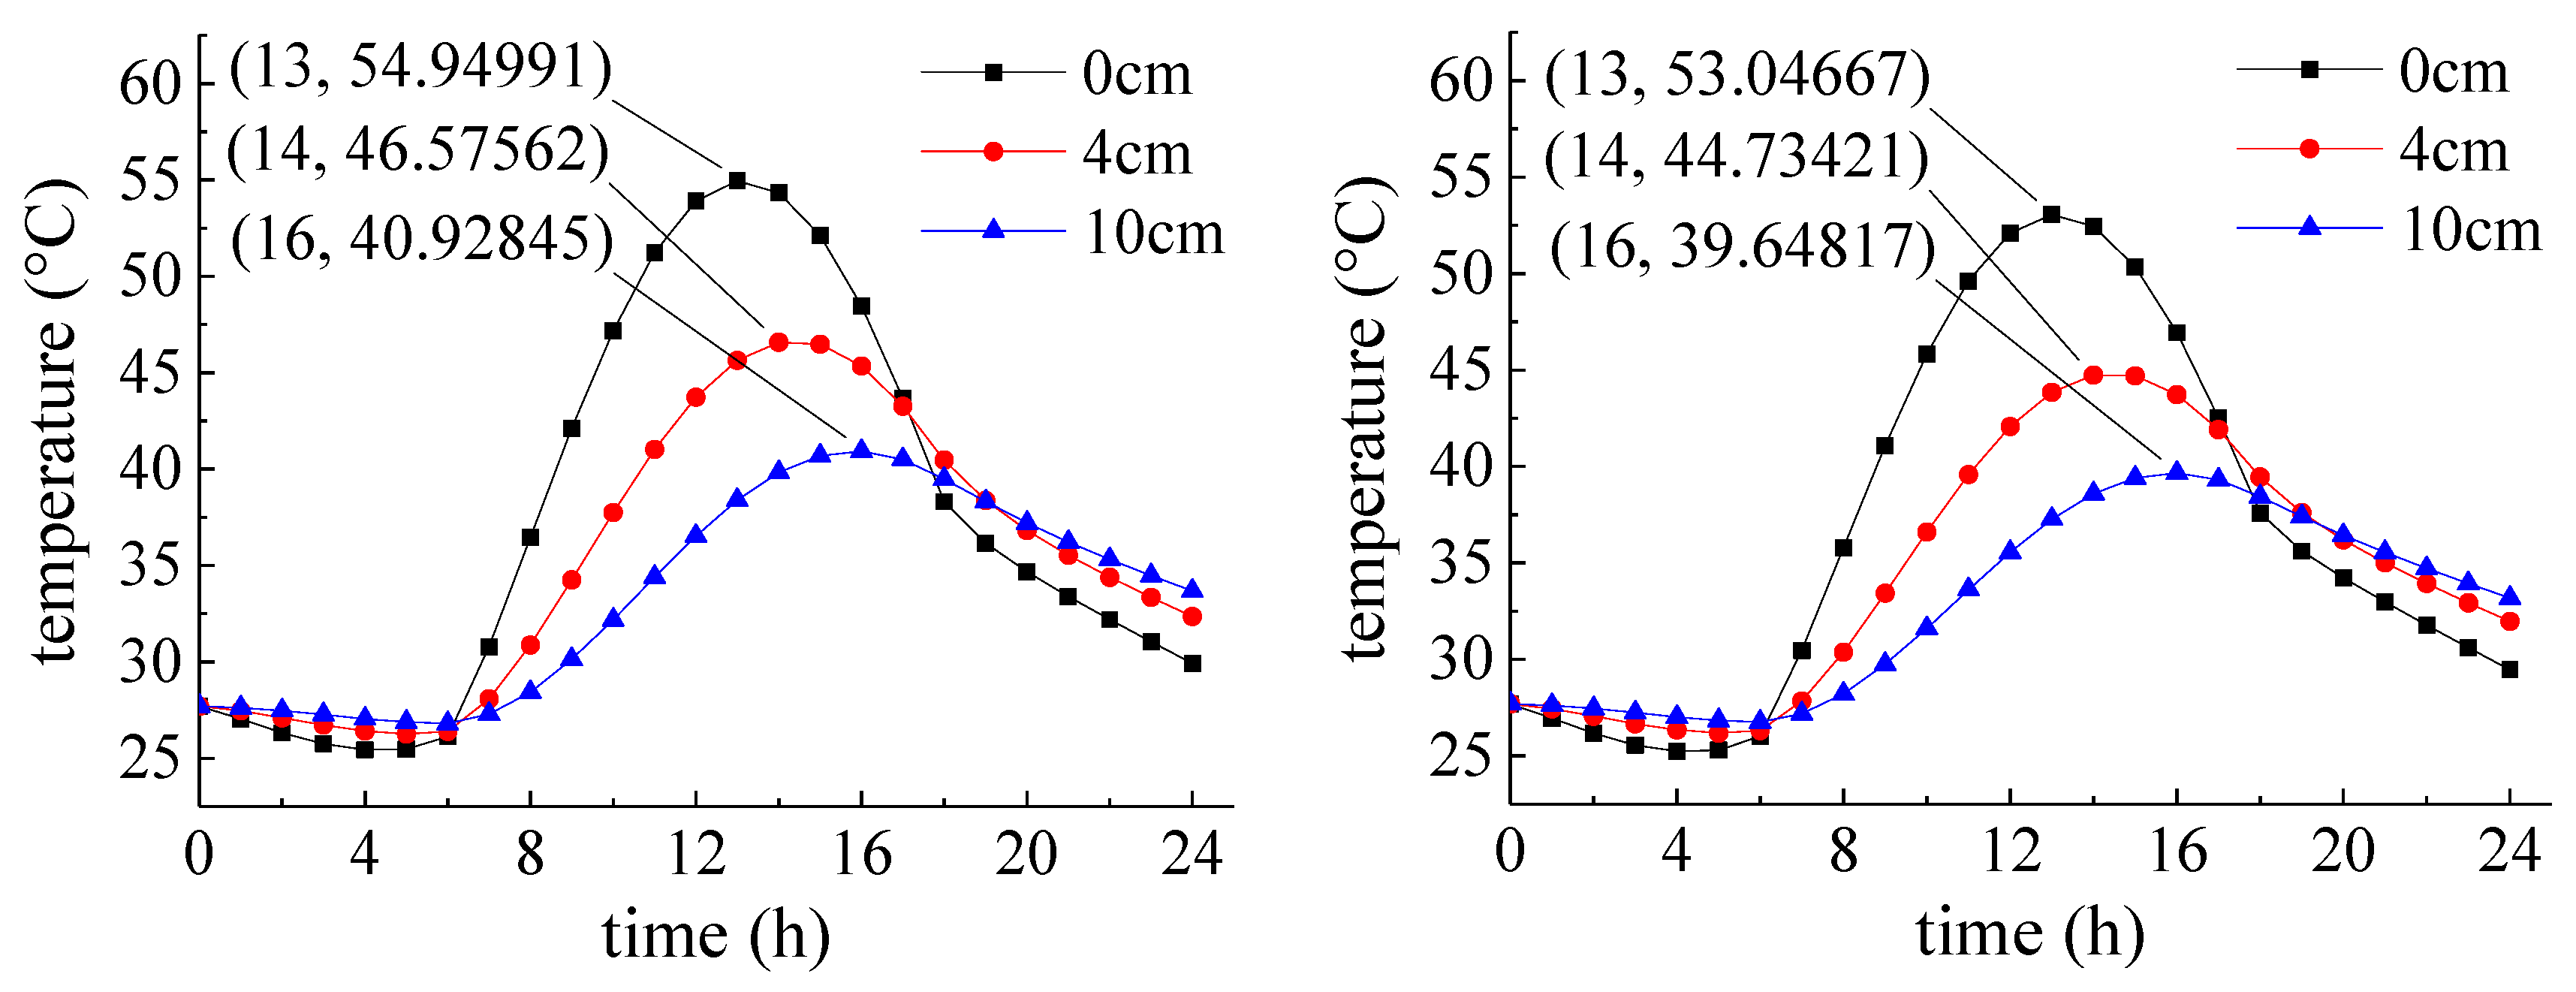
Because the temperature of the upper layer and the middle layer has a great influence on the pavement, we selected three main depths in the temperature field analysis process to evaluate the cooling effect of the porous asphalt pavement. The three depths were located on the pavement surface and 4 and 10 cm below the pavement surface. The data from each depth in each analysis step were collected to obtain the daily variation of the pavement surface temperature at different depths, as shown in Figure 7.
As shown in Figure 7, the temperature of the pavement surface changed dramatically within 24 hours, and with increasing depth, the temperature change extent decreased gradually. The temperature peaks at different depths (including surface, 4 cm, and 10 cm) appeared at 13:00, 14:00, and 16:00, respectively. As the depth increased, the temperature peak appeared with more lag. This phenomenon explains the hysteresis of heat transfer.
From the coordinate data where the temperature peak occurred, it can be seen that the temperature peak at each depth of the PAC pavement was lower than that of the dense-graded asphalt pavement. Among the PAC pavement models studied, the minimum value of surface temperature peak appeared on the surface of the S5 pavement model at 53.05 °C. Similarly, the minimum temperature peak values at 4 cm depth and 10 cm depth also appeared at the corresponding depths of the S5 pavement model; the values were 44.73 and 39.65 °C, respectively. In addition, it can be seen that with increasing proportion of air voids, the temperature peak at a certain depth of the PAC pavement model showed a downward trend, indicating that the cooling performance of porous asphalt pavement is obviously better than that of dense-graded asphalt pavement.
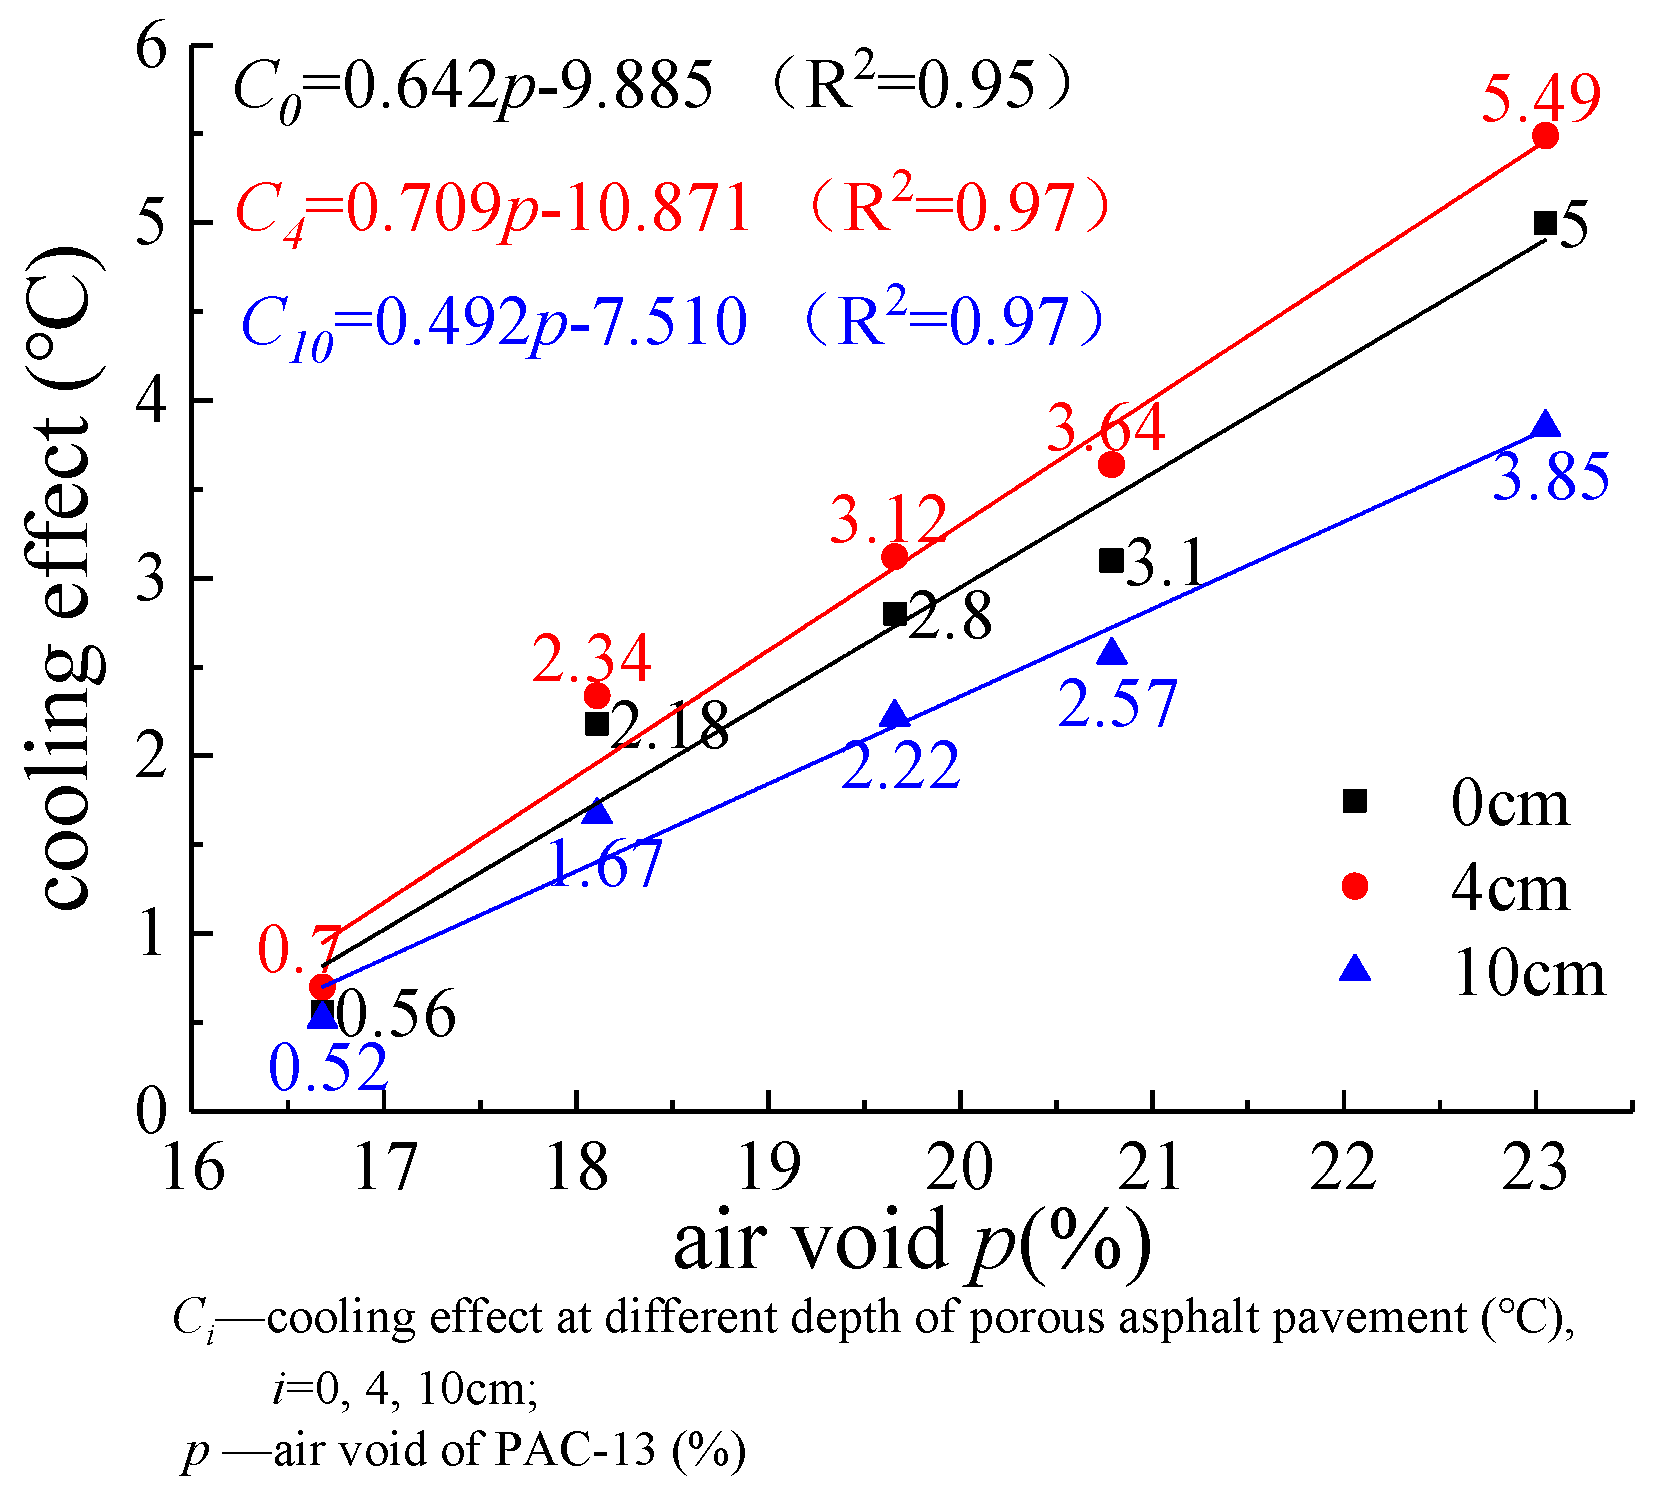
In order to quantify the cooling effect of PAC pavement, AC pavement was used as a benchmark, and the difference between the peak temperatures of the PAC pavement and the AC pavement at different depths was used to characterize the cooling effect, as shown in Figure 8. Fitting models between air voids and the cooling effect were obtained. The fitting curves and Equations are shown in the figure. It can be concluded that with increasing proportion of air voids, the cooling effect of the porous asphalt pavement at each depth showed an increasing trend. When the upper layer air void was 16.68%, there was almost no cooling effect on the pavement surface. When the upper layer air void was 23.05%, the cooling effect was the most obvious, and the cooling effects at 0, 4, and 10 cm depth were 5, 5.49, and 3.85 °C, respectively. Through the fitting models, a good positive linear correlation was found between the cooling effect at each depth of the single-layer porous pavement and the proportion of air voids of the PAC-13 pavement.
The above research shows that PAC pavement can effectively reduce the temperature inside the pavement, thereby reducing the occurrence of rutting and tire burst caused by high-temperature pavement and improving the pavement safety performance. The fitting models can provide an important reference for PAC pavement design.

6. Conclusions

(1) The thermophysical properties of a porous asphalt mixture are greatly affected by the proportion of air voids. The specific heat, thermal conductivity, and thermal diffusivity decreased with increasing proportion of air voids. Voids can reduce the heat absorption, heat conduction, and heat dissipation capacity of a porous asphalt mixture and thus affect the cooling effect of porous asphalt pavement.
(2) A sunshine experiment and a virtual experiment verified that the cooling performance of porous asphalt pavement was better than that of dense-graded pavement. The cooling effect was positively correlated with the proportion of air voids. The larger the proportion of air voids, the better the cooling effect of the porous asphalt pavement.
(3) According to the results of the finite element simulation, a mathematical model between the cooling effect and air voids was established.
(4) In applications in practical engineering, larger air voids are not a necessary condition. this is because when the air voids reach a critical value, the strength of the pavement will be greatly reduced and will not meet the requirements of use. The air void proportions used in this study were selected on the basis of guaranteeing the strength of the pavement. Our research results can provide an important reference for PAC pavement design.

Author Contributions

L.G.—Conception or design of the work; Y.L.—Data collection; Z.W.—Data analysis and interpretation; S.J.—Drafting the article; J.X.—Critical revision of the article.

Funding

This research was supported by National Key R&D Program of China (Grant No. 2018YFB1600101), National Natural Science Foundation of China (Grant No.51908286), and Primary Research and Development Plan of Jiangsu Province (Grant No. BE2015349).

Conflicts of Interest

The authors declare no conflict of interest.

References

  1. Simonsen, E.; Janoo, V.C.; Isacsson, U. Prediction of Pavement Response During Freezing and Thawing Using Finite Element Approach. J. Cold Reg. Eng. 1997, 11, 308–324. [Google Scholar] [CrossRef]
  2. Shao, X.Z.; Shao, H.M.; Bi, Y.F.; Sun, L.J. Testing Method of Asphalt Mixture Poisson Ratio. J. Tongji Univ. 2006, 34, 1470–1474. [Google Scholar]
  3. Qin, R.J.; Li, Y.Z.; Li, Z.K. Analyzing the Cause of Asphalt Pavement Rut Damage of Heng-Zao Freeway. In Proceedings of the GeoHunan International Conference, Changsha, Hunan, China, 3–6 August 2009. [Google Scholar]
  4. Jiang, J.W.; Ni, F.J.; Dong, Q.; Yao, L.Y.; Ma, X. Investigation of the internal structure change of two-layer asphalt mixtures during the wheel tracking test based on 2D image analysis. Constr. Build. Mater. 2019, 209, 66–76. [Google Scholar] [CrossRef]
  5. Gao, L.; Ni, F.J.; Luo, H.L.; Charmot, S. Characterization of air voids in cold in-place recycling mixtures using x-ray computed tomography. Constr. Build. Mater. 2015, 84, 429–436. [Google Scholar] [CrossRef]
  6. Hermansson, Å. Simulation model for calculating pavement temperature including maximum temperature. Transport. Res. Rec. 2000, 1699, 134–141. [Google Scholar] [CrossRef]
  7. Straub, A.L.; Schenck, H.N., Jr.; Przbycien, F.E. Bituminous Pavement Temperature Related to Climate. Highway Res. Rec. 1968, 256, 53–77. [Google Scholar]
  8. Hermansson, Å. Mathematical model for paved surface summer and winter temperature: Comparison of calculated and measured temperatures. Cold Reg. Sci. Technol. 2004, 40, 1–17. [Google Scholar] [CrossRef]
  9. Barber, E.S. Calculation of maximum pavement temperature from weather reports. Highway Res. Bd. Bull. 1957, 168, 1–8. [Google Scholar]
  10. Yan, Z.R. Analysis of the Temperature Field in Layerd Pavement System. J. Tongji Univ. 1984, 3, 76–85. [Google Scholar]
  11. Liu, C.; Yuan, D. Temperature distribution in layered road structures. J. Transp. Eng. 2000, 126, 93–95. [Google Scholar] [CrossRef]
  12. Wang, D.; Roesler, J.R. One-dimensional rigid pavement temperature prediction using Laplace transformation. J. Transp. Eng. 2012, 138, 1171–1177. [Google Scholar] [CrossRef]
  13. Wang, D. Analytical approach to predict temperature profile in a multilayered pavement system based on measured surface temperature data. J. Transp. Eng. 2012, 138, 674–679. [Google Scholar] [CrossRef]
  14. Chong, W.; Tramontini, R.; Pivoto Specht, L. Application of the Laplace Transform and Its Numerical Inversion to Temperature Profile of a Two-Layer Pavement under Site Conditions. Numer. Heat Tr. A-Appl. 2009, 55, 1004–1018. [Google Scholar] [CrossRef]
  15. Thanh, D.V.; Feng, C.P. Study on Marshall and Rutting test of SMA at abnormally high temperature. Constr. Build. Mater. 2013, 47, 1337–1341. [Google Scholar] [CrossRef]
  16. Walubita, L.F.; Faruk Abu, N.M.; Zhang, J.; Hu, X.D.; Lee, S.I. The Hamburg rutting test-Effects of HMA sample sitting time and test temperature variation. Constr. Build. Mater. 2016, 108, 22–28. [Google Scholar] [CrossRef]
  17. Javilla, B.; Mo, L.T.; Hao, F.; Shu, B.N.; Wu, S.P. Multi-stress loading effect on rutting performance of asphalt mixtures based on wheel tracking testing. Constr. Build. Mater. 2017, 148, 1–9. [Google Scholar] [CrossRef]
  18. Zheng, Y.X.; Zhang, P.; Liu, H. Correlation between pavement temperature and deflection basin form factors of asphalt pavement. Int. J. Pavement Eng. 2017, 6, 1–10. [Google Scholar] [CrossRef]
  19. Darabi, M.K.; Huang, C.W.; Bazzaz, M.; Masad, E.A.; Little, D.N. Characterization and validation of the nonlinear viscoelastic-viscoplastic with hardening-relaxation constitutive relationship for asphalt mixtures. Constr. Build. Mater. 2019, 216, 648–660. [Google Scholar] [CrossRef]
  20. Bazzaz, M.; Darabi, M.K.; Little, D.N.; Garg, N. A straightforward procedure to characterize nonlinear viscoelastic response of asphalt concrete at high temperatures. Transport. Res. Rec. 2018, 2672, 481–492. [Google Scholar] [CrossRef]
  21. Bazzaz, M. Experimental and Analytical Procedures to Characterize Mechanical Properties of Asphalt Concrete Materials for Airfield Pavement Applications. Ph.D. Thesis, University of Kansas, Lawrence, KS, USA, 2018; p. 247. [Google Scholar]
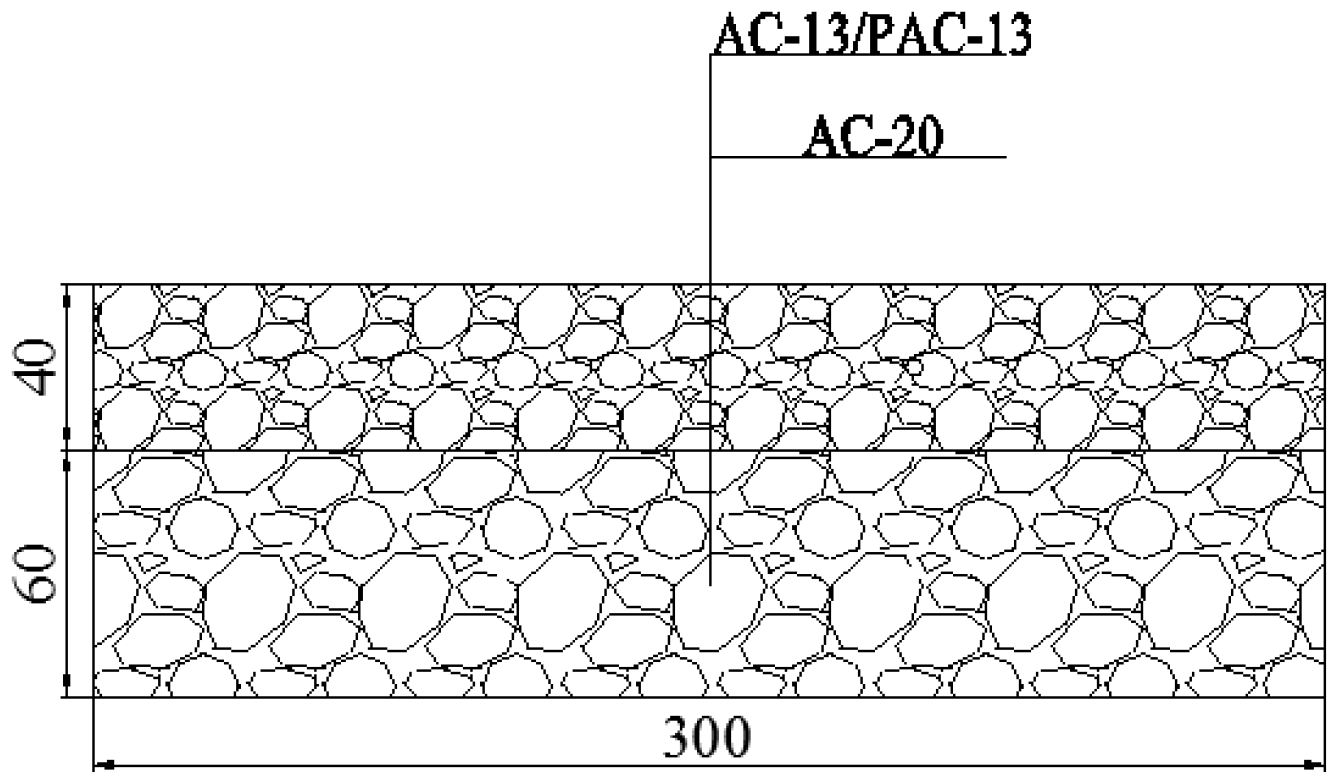
Figure 1. Schematic diagram of the specimens.
Applsci 09 03659 g001
Figure 2. Thermophysical properties of PAC-13 mixtures with different proportions of air voids.
Applsci 09 03659 g002
Figure 3. Sunshine experiment: (a) laboratory experiment; (b) finite element model.
Applsci 09 03659 g003
Figure 4. Temperature variation curves of each specimen.
Applsci 09 03659 g004aApplsci 09 03659 g004b
Figure 5. Surface temperature variation curves of specimens.
Applsci 09 03659 g005
Figure 6. Pavement model in ABAQUS.
Applsci 09 03659 g006
Figure 7. Temperature variation curves of each specimen at different depths.
Applsci 09 03659 g007aApplsci 09 03659 g007b
Figure 8. Fitting curves of air void proportion and the cooling effect of PAC pavement.
Applsci 09 03659 g008
Table 1. The results of PAC-13 aggregate gradation.
Sieve Size (mm)Recommended Gradation (%)PAC-13 Gradation (%)
Upper LimitLower LimitMedian12345
16100100100100100100100100
13.2100909595959592.795
9.5714055.57067.56556.845
4.753010202826.52516.710
2.36228152118.51610.48
1.181861214.514.3147.97
0.6144910.510116.66
0.31237.59895.25
0.159366664.54
0.0757354443.83
Air Voids (%)16.6818.1119.6620.7923.05
Table 2. Results of the design of structural combinations.
Specimen TypeUpper-Layer Material (air voids)Lower-Layer MaterialSpecimen Number
4 cm AC-13 + 6 cm AC-20AC-13AC-20AC
4 cm PAC-13 + 6 cm AC-20PAC-13 (16.68%)AC-20S1
PAC-13 (18.11%)AC-20S2
PAC-13 (19.66%)AC-20S3
PAC-13 (20.79%)AC-20S4
PAC-13 (23.05%)AC-20S5
Table 3. Specimen equilibrium temperature.
Specimen NumberUpper-Layer Air Voids (Material)Lower-Layer MaterialEquilibrium Temperature (°C)
Surface4 cm10 cm
ACAC-13AC-2065.641.330.3
S116.68% (PAC-13)AC-2064.84029.2
S218.11% (PAC-13)AC-2067.441.328.9
S319.66% (PAC-13)AC-2066.4539.328.8
S420.79% (PAC-13)AC-2067.238.828.6
S523.05% (PAC-13)AC-2067.537.1527.86
Table 4. Surface equilibrium temperatures and convective heat transfer coefficients.
Specimen NumberUpper Layer Air Void (Material)Lower Layer MaterialSurface Equilibrium Temperature (°C)Convective Heat Transfer Coefficient (W·m-2·°C-1)
ACAC-13AC-2028.519.058
S116.68% (PAC-13)AC-2028.220.642
S218.11% (PAC-13)AC-2027.824.639
S319.66% (PAC-13)AC-2027.426.551
S420.79% (PAC-13)AC-2027.527.639
S523.05% (PAC-13)AC-2026.634.148
Table 5. Thermophysical property parameters of the model.
MaterialDensity (kg/m³)Specific Heat (J·kg−1·°C−1)Thermal Conductivity (J·m−1·h−1·°C−1)
AC252300924.91.3
Cement-stabilized macadam2200911.71.56
Lime-stabilized soil2100942.91.43
Earth Subgrade180010401.56