Abstract
Human pulmonary epithelial cells are protected by two layers of fluid—the outer watery periciliary liquid layer (PCL) and the uppermost non-Newtonian mucus layer (ML). Aerosols and inhaled toxic particles are trapped by the ML which must then be removed swiftly to avoid adverse health implications. Epithelial cells are covered with cilia that beat rapidly within the PCL. Such ciliary motion drives the mucus transport. Although cilia can penetrate slightly inside the mucus to assist mucus movement, the motion of the underlying PCL layer within the airway surface liquid (ASL) is significant in mucus and pathogens transport. As such, a detailed parametric study of the influence of different abnormal cilia characteristics, such as low beating frequency, short length, abnormal beating pattern, reduced ciliary density, and epithelium patchiness due to missing cilia on the PCL transport, is carried out numerically. Such abnormalities are found in various chronic respiratory diseases. In addition, the shear stress at the epithelium is assessed due to the importance of shear stress on the epithelial function. Using the immersed boundary (IB) method combined with the finite-difference projection method, we found that the PCL, under standard healthy conditions, has net forward motion but that different diseased conditions decrease the forward motion of the PCL, as is expected based on clinical understanding.
1. Introduction
Airway surface liquid (ASL) covers the respiratory epithelia that is mainly comprised of two distinct layers: mucus layer (ML)—a non-homogenous, non-Newtonian, viscoelastic fluid [1]; and periciliary liquid layer (PCL)—treated as a watery lubricating (nearly Newtonian) fluid layer with much less viscosity [2]. Transport of the ASL is of vital importance to keep the respiratory system clear from inhaled particulate matters deposited on the ML. Such clearance mechanism is facilitated by periodic ciliary actions, with the ASL being swept forward during the effective stroke and backward during the recovery stroke [3].
Ineffective and poor mucus clearance is a major factor for lung health. There are generally two main reasons for muco-ciliary dysfunction in the respiratory system: airway mucosal diseases (such as cystic fibrosis (CF), chronic obstructive pulmonary disease (COPD), asthma, etc.) and ciliary abnormalities. Mucosal diseases occur in patients as a result of the conversion from healthy to pathologic mucus, where the mucus hydration and its biochemical constituents change by multiple mechanisms, leading to higher viscosity and elasticity of the mucus (see Fahy and Dickey [4], and the references therein). Defects in ciliary structure and function can cause abnormal ciliary beating. Primary ciliary dyskinesia (PCD) is known as the most significant disorder causing ciliary abnormalities [5].
There is fairly a limited number of numerical studies in the literature with the focus of modelling of diseased lungs. Guo and Kanso [6] emulated diseased environments in their 2D simulations by varying the viscoelastic properties and the thickness of the ML. Their findings revealed that the effects of the mucus elasticity depends very much on the ML thickness. Specifically, for the diseased states (thinner PCL), the higher elasticity led to a decrease in the mucus transport, whereas an opposite trend was observed for the healthy states. Chatelin et al. [7] attempted to simulate the high viscous effect of pathologic mucus in CF three-dimensionally by taking into account the highly shear-thinning nature of mucus and thus the non-Newtonian effects on the muco-ciliary clearance. Based on the mucus samples collected from patients with and without CF disorder, they concluded that shear-thinning effects can be of the same order as the viscoelastic effects for the mucus transport. Jayathilake et al. [8] studied ASL flow physics two-dimensionally in the presence of cilia beating under various ciliary abnormalities, such as ciliary beat pattern, length of cilia, immotile cilia, beating amplitude, and uncoordinated beating of cilia. According to the results obtained, each of the above ciliary abnormalities could greatly reduce the process of mucus clearance, except for uncoordinated beating.
The ultimate goal of this paper is to obtain a clear understanding of how the epithelial cilia-driven fluid flows perform under various ciliary abnormalities in respiratory diseases. Such abnormalities, whether inherited (genetic disorder) or acquired, are directly linked to lung infection and chronic respiratory diseases in humans. Table 1 summarises the most common lung disorders along with their damaging effects on the ciliary function. More details on varioues types of ciliary abnormalities, such as PCD, CF, asthma, and COPD, can be found in [5,9,10].

Table 1.
Ciliary abnormalities due to inherited and acquired disorders.
We therefore performed a parametric analysis to investigate the effects of ciliary abnormalities, like low beating frequency, short length, abnormal beating pattern, and reduced ciliary density, as well as epithelium patchiness due to missing cilia on the PCL transport as an extension to previous work reported in Reference [23]. To achieve this, the three-dimensional equations of fluid motion are solved using the IB method coupled with finite-difference projection method. Some theoretical studies have concluded that the PCL remains stationary during the process of clearance [24,25,26,27,28,29]. However, experimental findings [30] argued that if PCL was stationary, inhaled hydrophilic toxicants might remain in the lung for extended periods of time. Hence, axial PCL transport is needed in order to efficiently clear the lung from this class of toxic substances. Overall, by analysing the transport behaviour of PCL, the present 3D model not only could provide valuable insights into muco-ciliary clearance, the results of this parametric study could be useful for designing lab-on-a-chip microfluidic devices which are used for pumping and/or mixing purposes [31,32,33].
The paper is organized as follows: Section 2—details of the numerical method are given; Section 3—the results and relevant discussions are presented in terms of PLC flow rate, velocity changes above the tips of cilia, and alterations in shear stress at the epithelium; and Section 4—conclusions for the results are provided, and directions for future research are suggested.
2. Numerical Method
In this work, the time-dependent Newtonian PCL flow is solved by a projection method and the force exerted by cilia on the fluid is computed via the IB method. Figure 1a shows a three-dimensional bounded domain m3 that contains immersed massless boundaries (cilia). The ciliated domain is considered as m2. For this fluid-structure interaction problem, the incompressible Navier–Stokes equations are considered which can be written as
where is the fluid velocity, p is the fluid pressure, and and are constant density and dynamic viscosity of the fluid, respectively.
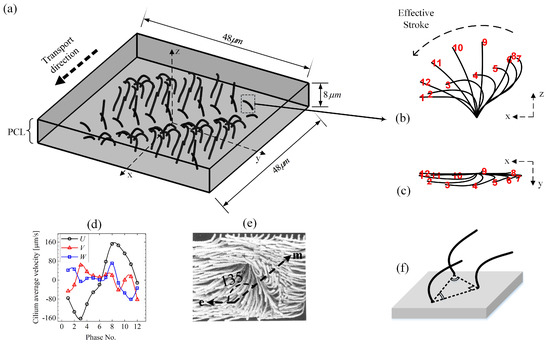
Figure 1.
Model schematics. (a) Ciliary array of motile cilia beating within the periciliary liquid layer (PCL). (b) Side view and (c) top view of beating kinematics of an individual cilium reported by Gheber and Priel [34], which shows the changes in shape of each cilium at intervals of through one beat cycle (). Cilia move in a planner motion during their rapid effective stroke (phase No. ∼ 1–7 ), but the recovering cilia (phase No. ∼8–12 ) are not performing a planner beat. When viewed from above, the ciliary tips follow a anticlockwise oval path. (d) The cilium velocity components. (e) Interpretation of ciliary activity on cultured rabbit tracheal epithelium from the model of Sanderson and Sleigh [3]. Arrows e and m indicate the directions of effective stroke and metachronal wave, respectively. (f) Adopted ciliary pack for all the simulation cases unless stated otherwise.
Since one portion of an infinite problem is simulated in the present work, periodic boundary conditions are applied to the side walls normal to the x and y axes. Herawati et al. [35] observed that the fluid velocity at the epithelium boundaries remain static due to the slow movements of the basal bodies (a protein structure found at the base of a cilium) at the cell boundaries of cultured mouse tracheal multiciliated cells. Hence, the bottom boundary at the epithelium is treated as no-slip wall in our simulations. Given that the boundary condition at the PCL-mucus interface is influenced by the surface tension force between the ML and PCL, as well as the complex fluid rheology of the mucus, it is reasonable to assume the top boundary as the free slip wall in the present mucus-free model. The mentioned boundary conditions can be presented in the mathematical form as:
Note that in this work the geometry is described using terms such as top and bottom, but within the respiratory tracts, the orientation may be in any direction. Gravity is not considered in the present model.
To study the flow–structure interaction in biological systems, the immersed boundary (IB) methods have been applied successfully. Employing this method [36,37,38,39] (see Figure 2b), each cilium can be represented by a set of N control points as functions of Lagrangian coordinate S () and time t () embedding in the Eulerian fluid domain. Thus, the cilium length can be given by where is the Lagrangian grid spacing along the IB, as depicted in Figure 2a. Here, T is the period of cilium beat cycle. The control points can be treated as force generators to the fluid, which are computed by using the following direct forcing method at Cartesian grid point :
where is the marching time step between the time levels n and , and is the distributed cilium velocity which can be obtained as
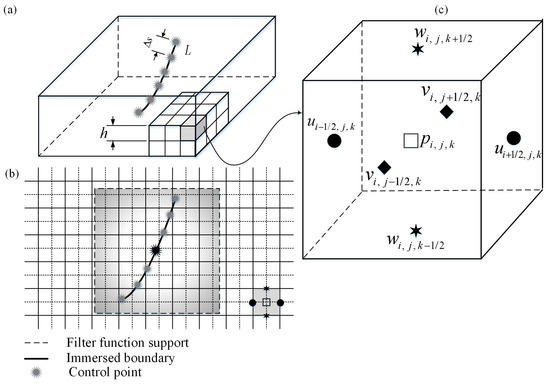
Figure 2.
(a) Flow domain with an immersed boundary (IB). is the spacing between the control points, and is the grid spacing. (b) Interpolation strategy of the immersed boundary method. (c) The MAC mesh cell. The velocity components u, v, and w are defined at the cell faces, while the pressure p is introduced at the cubic cell centre.
Since the cilium control points do not coincide with the fluid grid points , the filter function is employed to transfer the information between those two grids [40], which is defined by
where h is the Eulerian grid spacing (see Figure 2a). It should be noted that to avoid penetration of streamlines into the Lagrangian grid spacing.
Three-dimensional kinematics of the cilia are prescribed using the ciliary beat profiles shown in Figure 1b,c, which is introduced as the ’standard beat’ throughout this work. It is assumed that cilia beat with the frequency of . It can be clearly seen in Figure 1d that, through one beat cycle, the magnitude of the cilium velocity components in the x-direction U is significantly higher compared with the other two velocity components—V in the y-direction and W in the z-direction. This means that the driving force imparted by cilia is dominant in the x-direction. The packing among the cilia is also depicted in Figure 1f.
The metachronal wave produced by actions of cilia travels approximately at an angle of to the effective stroke, as reported in the experiment on ciliary activity of cultured rabbit trachea epithelium by Sanderson and Sleigh [3] (see Figure 1e). Hence, considering one full wave over the computational domain using the same propagation angle, the initial arrangements of the cilia are chosen such that they are in similar phase along the wave fronts, with a fixed phase difference of and the interciliary spacing being m. The velocity of the cilia is prescribed accordingly and the position of them at every time step is calculated as . Once the force exerted to the fluid was computed explicitly, Equations (1) and (2) are then discretised and solved for the velocity field and pressure using the pressure-increment projection algorithm, analogous to that described in Reference [41]. The staggered marker-and-cell (MAC) Eulerian mesh [42] is used for the spatial discretization (as shown in Figure 2c), and the intermediate velocity field is calculated as follows:
where and
Since the does not satisfy the divergence free condition in Equation (2), a pressure increment is computed as
To calculate the Helmholtz equation for in (7) and the Poisson equation for in (9), we employ FISHPACK [43] fast solvers. Having solved for the and , the velocity and pressure fields are then updated as
The standard projection method has been successfully applied in many muco-ciliary studies [6,8,23,44,45], and all the authors have reported satisfactory values for the fluid transport when compared with the available experimental data. Nonetheless, the accuracy of this method at low Reynolds numbers has been questioned because the projection on divergence-free fields has been observed to induce tangential spurious velocities [46]. Although this is an important limitation to consider, the actual degree of loss of accuracy that might result is unknown for muco-ciliary systems. What makes the projection method attractive is that, at each time step, one only needs to solve a sequence of decoupled elliptic equations for the velocity and the pressure, which makes it more computationally efficient. However, it is necessary to evaluate the accuracy of the algorithm which is tested for the Couette flow, as well as for Stokes flow, in a lid-driven cavity, for , which is a creeping flow condition of analogous flow regime to muco-ciliary transport.
Figure 3a provides results for the Couette flow at a range of times compared with the analytical solution of the Navier–Stokes equations, which can be expressed as [47]
where is the width of the channel, is the fluid kinematic viscosity, and is the fluid velocity calculated at position y and time t. Comparable to the results obtained by the analytical solution, the present results deviated by no more than 0.12% which is acceptable within the current context. As for the second validation (Figure 3b), the streamline results of the present work are in good agreement with those obtained by an analytical method in the works of Shankar [48] and Pan and Acrivos [49], supporting the use of the numerical algorithm to simulate Stokes flows for our purposes. Detailed discussions on the validity and robustness of the implemented IB method are found in Reference [23,44,50] and hence not repeated here. Table 2 summarizes the computational steps used in the present work. For the numerical simulations, we use the parameter set displayed in Table 3.
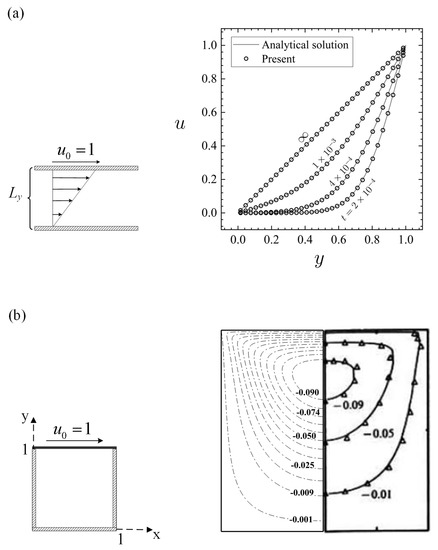
Figure 3.
Code validation at . (a) Results for fluid velocity for the Couette flow comparing the present simulation results with the analytical solution. (b) Results for streamlines for a lid-driven cavity comparing the present code results (‘−.’) with the works of Shankar [48] (‘−’) and Pan and Acrivos [49] (‘Δ’).
Table 2.
The numerical procedure for each time step of the present method.
Table 3.
Parameters used in the simulations. L, , , and o of cilia are the standard parameter set, which can have different values depending on the type of our parametric studies.
3. Results and Discussion
3.1. Cilia-Driven Fluid Flow
To assess the numerical convergence of the discretization scheme, we evaluate the effects of time step, fluid grid, and number of control points on the time-averaged fluid velocity in the x-direction. This is computed over the total PLC volume using where is the fluid volume and s. The results show that the solution changes little under spatial and temporal mesh refinement and the discretization scheme reaches convergence over the third cycle, as seen in Figure 4. Therefore, the fluid grid size (where ), the control points and the time step s are chosen for our simulations.
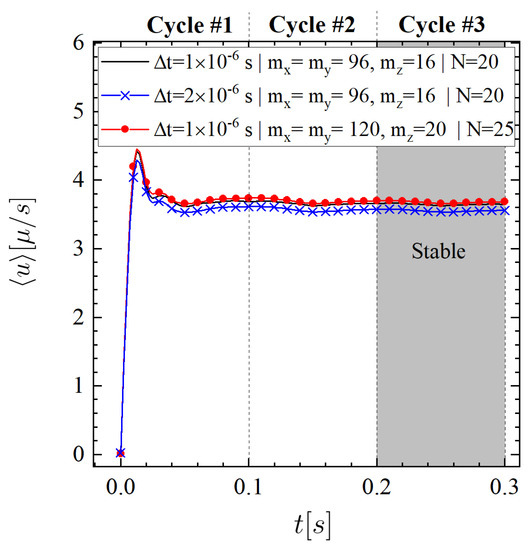
Figure 4.
Numerical convergence study by varying the time step size , number of fluid grids (i.e., ), and number of control points N.
Figure 5 shows the time-averaged velocity generated by ciliary motion. The mean velocity contour in the middle section of the computational domain in the z-direction reveals a very complex region, as depicted in Figure 5a. In addition to this, since the cilia beat most effectively in the x-direction, it is expected to have regions with higher velocities in this direction. The largest values of the mean velocity magnitude are observed on the m plane (Figure 5b) which can facilitate the mobility of the ML. Figure 5c,d depict the x- and y-component of velocity field (i.e., and ) at two representative planes: and , respectively. It is observed that the maximum contour value of is approximately four times larger than that of . To quantify these flow changes, the time-averaged velocity profiles as functions of z are constructed in the middle of the computational domain (intersection of and planes), as seen in Figure 5e. These findings clearly confirm that a considerable amount of flow in the direction parallel to effective stroke is generated. Referring to Figure 5c, one can also observe that the main direction of the fluid transport above the cilia tips is towards the positive x-direction which agrees well with the actual clearance mechanism; unidirectional transport of the ASL over time. Furthermore, our calculations for the time-averaged fluid velocity which is computed over the total PLC volume in y-direction led to a very small value: m/s vs. m/s. Henceforth, we shall present our findings for flow parallel to the direction of cilia effective stroke.

Figure 5.
Time-averaged flow velocity. (a,b) Contour plots of mean velocity fields at planes m and m, respectively. (c,d) Velocity contours at planes in the directions parallel (m) and perpendicular (m) to effective stroke, respectively. (e) Flow profiles in the x- and y-directions as functions of z. The profiles are plotted at the intersection of planes shown in (c,d) of this figure.
Figure 6 shows streamlines and velocity profiles generated by ciliary actions during the stable beating cycle which takes 0.1 s. The streamlines are taken at the plane m (left panel) and at the plane m (shown by a dotted line in the top view). Six equally spaced velocity profiles are shown with vertical dotted line for m (right panel). The cilia are labelled 1–6 from left to right. We now seek to understand the interaction between the fluid and cilia at various time instants. Viewing from above, many small size vortices are formed above the cilia tips due to the packed distribution of cilia, as well as the complex nature of cilia-driven fluid field. Such turbulence-like streamlines are due to the flow separations in the vicinity of ciliary actions. However, the overall fluid regime is still laminar. Outside the ciliary domain (i.e., m), it is more likely to have bigger recirculation zones. The elevation view shows a row of six cilia which are at different beating phase, depending on the simulation time. Case (a) shows a snapshot of the results at the beginning of the beating cycle, i.e., s. In case (b), cilium 1 is seen to stand up and perform its effective stroke. The action of this cilium is pushing the fluid forward in the positive x-direction; the corresponding velocity profile shows this positive fluid motion. The cilium continues to move forward (case (c)), but compared to the previous case, the corresponding fluid velocity profile shows smaller values. Case (d) depicts the recovery stroke for this cilium where an opposing vortex is set up in the fluid above the cilium tip, resulting in a reverse flow with a negative velocity profile. One can note that this relatively strong vortex is formed above the other cilia with similar beating phase in the other snapshots. Eventually, at s, which corresponds to the case (e), the cilium 1 start reaching to its previous initial position to begin the next cycle. This biological fluid-structure interaction is very similar to what is observed in nature. For example, birds extend their wings to overcome the viscous resistance and then bend them closer to their body to avoid cancelling out their effective forward motion.
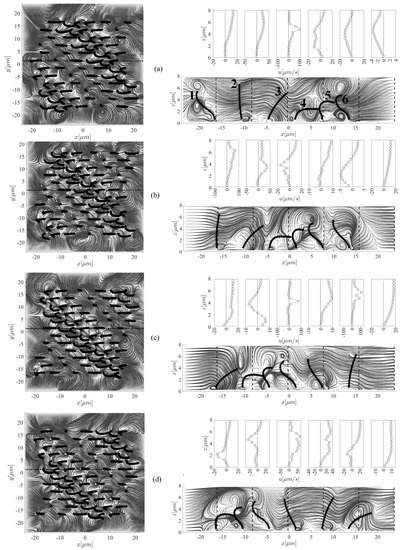
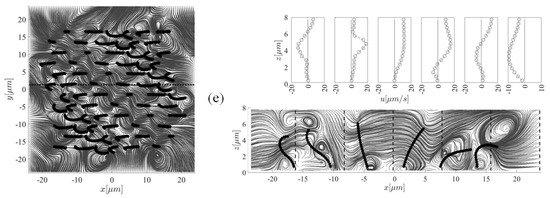
Figure 6.
Snapshots of the streamlines and fluid velocity profiles in the x-direction (upper-right panel) taken at five different instants (i.e., (b) s, (b) s, (c) s, (d) s, and (e) s) within the stable beating cycle (T = 0.1 s) to highlight the cilia-driven flow mechanism and the fluid mixing. In case (b), cilium 1 stands up to perform its effective stroke that continues up to the instant s (case (c)), after which, the recovery phase (case (d)) begins. This motion continues and the cilium arrives to its initial position (case (a)). Left and right panels show the top and side views of the computational domain, respectively. Note that for better clarity of the velocity profiles, the x-axis in each plot has a different scale.
To provide information on the PCL transport, the flow rate is computed as
The surface mean velocity where the ML sits on top is also obtained as
The fluid-flow induced wall shear stress at the epithelia are also another important factor of interest that, to our knowledge, has not been numerically investigated, which is calculated as
It has been experimentally observed that the shear stress can alter the epithelial paracellular permeability (i.e., diffusion of ions or molecules via the intercellular space) significantly [53]. The magnitude of fluid vorticity is the last metric of interest which is averaged over the PCL volume and computed as
Figure 7 shows the transients of flow rate, PCL surface average velocity, wall shear stress, and volume-averaged vorticity magnitude obtained from Equations (13)–(16). With 72 cilia beating at 10 Hz, the average of PCL flow rate, surface mean velocity, wall shear stress, and vorticity magnitude are obtained as follows: m/s, m/s, cm, and s, respectively. Our surface velocity results are qualitatively consistent with those reported in Reference [54], but different quantitatively, with the time-averaged PCL mean velocity being m/s. The reasons for this discrepancy are due to differences in the adopted ciliary density and prescribed beating pattern. In addition, they considered a synchronized cilia beating (no methachronal wave) and a fluid with variable viscosity, both of which can contribute to the further difference.
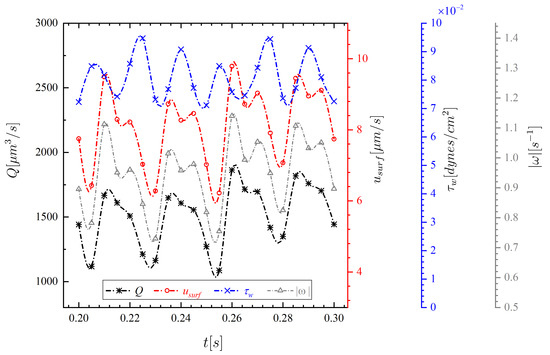
Figure 7.
Transients of PCL flow rate Q, surface mean velocity , wall shear stress , and volume-averaged vorticity magnitude for the standard case over the third cycle.
3.2. Parametric Investigations
To achieve the goal of this paper, we perform thorough parametric investigations to evaluate the effects of parameters including ciliary beat frequency , length of cilia L, ciliary beat pattern (CBP), ciliary pack, ciliary density, and missing ciliary patch on the simulation results. It will also be explained how changes in these parameters could represent some of the abnormalities listed in Table 1.
The results of our parametric study are assessed in terms of three metrics: (i) Time-averaged flow rate as
(ii) time-averaged surface mean velocity as
and (iii) time-averaged wall shear stress as
It should be noted that in all of the following results, the numerical setting is the same as the standard setting given in Table 3, except when stated differently.
Figure 8 shows the variation of time-averaged flow rate generated by the ciliary action for six different parameters. Parameter (I): Ciliary beat frequency (). In the healthy human lung, cilia beat rapidly at about 8–15 Hz [55]. However, experimental findings in PCD shows a considerable variability from 1.4–24.9 Hz due to gene mutations [56]. Further, in acquired disorders, such as cigarette smoking, environmental pollutants, and asthma, tends to decrease [9,10,19]. To study the effect of on the flow rate, the beat frequency is varied in the range of 5–25 Hz. The flow rate varies linearly with , as shown in Figure 8a. The effect of on the results is significant—a decrease in from 10 to 5 Hz, due to diseased conditions for example, reduces the flow rate by 50%. Note that 10 Hz is considered as the standard or healthy beat frequency throughout this work.
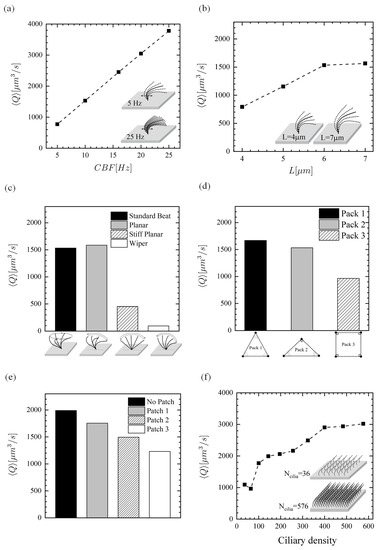
Figure 8.
Time-averaged PCL flow rate. Effect of (a) beat frequency, (b) length of cilia, (c) ciliary beat pattern, (d) ciliary pack, (e) missing ciliary patch, and (f) ciliary density (number of cilia over the ciliated domain).
Parameter (II): ciliary length (L). Clinical findings reveal that cigarette smokers, people exposed to environmental pollutants and patients suffering from COPD have shorter cilia [15,16,21]. As such, it is important to investigate the PCL locomotion for abnormal ciliary length. It was found that the shorter the cilia are, the more the PCL flow rate is hindered. Compared to the standard length m, the ciliary lengths of 5 m and 4 m led to 25% and 48% reduction in the fluid flow rate, respectively. However, increasing the length to m could not alter the result significantly—only 2% increase was observed. This may be related to the cilia tips getting closer to the PCL surface and resulting interactions, but the exact cause is left for future investigation.
Parameter (III): CBP. Studies of CBP in individuals with asthma and COPD showed impaired CBPs in bronchial epithelial [20] and nasal cilia [22], respectively. Two distinctive beat patters have been reported for cilia from PCD disease subjects: stiff and wiper planar motions [12,13]. The earlier is constructed by assuming a stiff cilium beats within a range of ∼150 with twelve equally spaced phase numbers over one cycle. The later motion is constructed in the same manner but the range of motion is assumed ∼130, where a straight line pointing from the cilium base to the cilium tip makes the angle with respect to the bottom wall. In addition to these ciliary abnormalities, two-dimensional beating kinematics (planar) is also incorporated into the model and compared against the three-dimensional ciliary motion (standard beat). This motion is constructed by setting the y-component of 3D beat profile equal to zero.
Comparing the standard CBP to planar CBP, the flow rate was almost identical. This agrees well with the results of Ding et al. [57], who concluded that both 2D and 3D ciliary kinematics show qualitatively similar transport due to the metachronal waves. In the stiff planar and wiper cases, the fluid flow rate drops significantly: by 70% in planar and by 94% in wiper.
Parameter (IV): ciliary pack. The spatial relationships of cilia on the epithelial surface is not very clear because cilia are tightly packed on the epithelia which makes it difficult to visualise them by means of scanning electron microscopy (SEM). Sanderson and Sleigh [3] interpreted an area of ciliary activity on cultured rabbit tracheal epithelium by a model in which cilia had equilateral triangular packing (Pack 1; Figure 9a). Here, we suggest two other possible packing types (see Figure 9a): isosceles triangle (Pack 2)—which is initially employed in the present work for the cilia-driven fluid flow analyses and then for the first three parametric studies; and square pack (Pack 3)—which has been commonly used by researchers [7,45,54,57]. To find out which packing type could be more effective in the fluid transport, the three mentioned packings are compared with one another. Note that the ciliary density (i.e., cilium/area taken up for each cilium) is kept constant at 0.055 cilium/m for this comparison. That is to say, only 64, 68, and 72 cilia could be fitted within the ciliary domain using Pack 3, Pack 1, and Pack 2, respectively. The results show that Pack 1 provides the highest flow rate which is slightly larger than that of Pack 1, revealing that although pack 1 has a fewer number of driving ciliary forces, it is capable to push the fluid more efficiently. However, the square pack (Pack 3) decreases the forward motion of fluid up to nearly 40%. These findings could play an important role in the optimal design of cilia-on-chip systems.
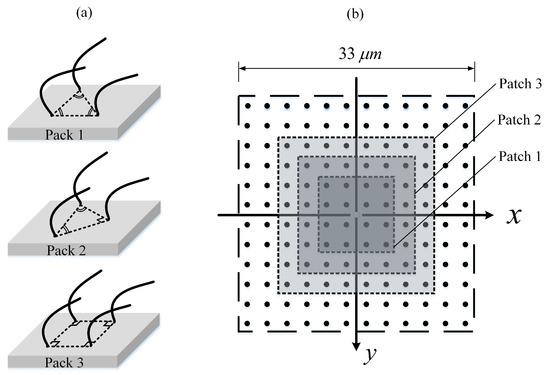
Figure 9.
(a) Schematic of ciliary pack. (Pack 1): equilateral triangular; (Pack 2): isosceles triangle; (Pack 3): square. (b) Schematic of an array of 144 cilia with three patches representing the regions of missing cilia.
Parameter (V): missing ciliary patch. Examination of the airway ciliated cells of smokers and CF patients shows loss of cilia [10,14]. Exposure to airborne pollutants is another reason of loss of ciliated cells [17]. In order to study the regions of missing cilia, three patches of different sizes are considered using Pack 3, as depicted in Figure 9b. As seen in Figure 8e, is inversely proportional to the patch size.
Parameter (VI): ciliary density. Decrease of ciliary density on the nasal epithelium is another respiratory impairment in COPD subjects [58]. To explore the effect of ciliary density, 36–576 equally spaced cilia are distributed (using Pack3) over the ciliary domain (m) in the x- and y-directions which correspond to inter-ciliary spacing range of 1.43–6.6 m within the same computational domain. Given that the reported value for the spacing between cilia is m [59], further decreasing the spacing between two adjacent cilia can cause spurious numerical effects since the neighbouring cilia may overlap, and as a result, two Lagrangian points with opposite velocities can occupy the same fluid grid cell. It is also important to emphasise that the wavelength formed by motile cilia is kept constant for all of the ciliary densities. Thus, the phase numbers of cilia are interpolated according to their positions within the ciliary domain. The linear dependency of on frequency (Figure 8a) and number of cilia (Figure 8e) can be expected as the driving force linearly increases with frequency and number of cilia in the creep flow regime and therefore the average PCL flow would lineally depend on these two parameters. Figure 8f shows the relation between the ciliary density and . This simulation results show that although there is a decrease for the case with 64 cilia, the flow rate initially increases with increasing the number of cilia because the total driving force increases. However, when the cilia are too close to each other the flow generated by one cilium would be partially cancelled out by the surrounding cilia and one can therefore see a plateau in as the number of cilia approaches 400. In all of the simulations presented, results obtained for the 2nd and 3rd cycles have been almost identical, regardless of packing type, patch size, and ciliary density. Hence, the time-averaged results presented in this section are obtained over the cycle 3 with the period of s.
It is now interesting to investigate the variation of time-averaged surface mean velocity for all of the six above-mentioned parameters (see Figure 10). One can clearly see that the curves exhibit relatively similar trends as the time-averaged flow rates , particularly in parameters (I), (IV), (V), and (VI); Figure 10a,d–f. This similarity is to be expected since the flow rate is the product of area and velocity. The linear relationship between and in Figure 10a is also to be expected due to the negligible inertia forces (very low Reynolds number) for this problem which, consequently, results in a linear momentum Equation (1). Additionally, the experimental findings also indicate that ciliary forces depend linearly on the [60]. Figure 10b shows that the surface mean velocity depends highly on the ciliary length L. Decreasing L from 7 to 4 m, for example, could reduce by 206%, indicating that smoke-induced shortening of cilia could decrease the muco-ciliary clearance significantly. Interestingly, it was found that the standard beat is able to slightly improve the surface mean velocity compared with the planar beat (see Figure 10c), although it had less fluid transport capability. On the other hand, experienced a reduction of over 80% when using the stiff planar beat, and the surface remained almost stationary for the wiper motion. As mentioned in above, exhibits relatively similar trend as when comparing different ciliary pack(parameter (IV)). That is to say, Pack 1 has the largest value, followed by Pack 2 and Pack 3, respectively (see Figure 10d). Hussong et al. [61] measured the in-plane fluid velocities above the epithelium surface of mucus-free mice tracheae using the micro Particle Image Velocimetry technique and observed that regions where no beating cilia are located had smaller velocities compared to the regions with ciliated cells. This indicates that the cilia-induced PCL velocity slows down when patchiness occurs within the ciliated cells, thus hindering the effective mucus transport (Figure 10e); see Table 1 for disorders associated with cilia loss. As shown in Figure 10f, for 400 cilia and above, the surface mean velocity seems to level off and is not very sensitive to further changes in cilia number.
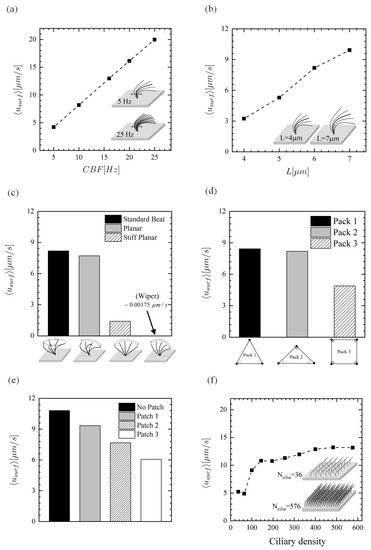
Figure 10.
Time-averaged surface mean velocity. Effect of (a) beat frequency, (b) length of cilia, (c) ciliary beat pattern, (d) ciliary pack, (e) missing ciliary patch, and (f) ciliary density (number of cilia over the ciliated domain).
As mentioned earlier, little is known regarding the effects of fluid-induced shear stress on the epithelial function. The relationship between parameters (I)–(VI) and shear stress at the epithelium is presented in Figure 11. The results show that the time-averaged wall shear stress increases almost linearly with (Figure 11a), while the increase of with L is non-linear (Figure 11b). It is clear that the velocity gradients at the epithelium intensifies with the increment of beating frequency and ciliary length. The shear stress for different CBPs is compared in Figure 11c. The shear stress of the planar, stiff planar, and wiper CBPs is 20%, 16%, and 38% smaller than that of the standard beat pattern, respectively. As can be expected, if the number of cilia is decreased, there would be smaller fluid velocity gradients from the ciliary actions, thus decreasing at the epithelium. As such, since Pack1 (with 68 cilia) and Pack 3 (with 64 cilia) have smaller number of cilia, they have lower levels of shear stress than Pack2 (with 72 cilia) (see Figure 11d). Similarly, the shear stress becomes smaller with decreasing ciliary density and increasing the size of missing ciliary patch, as depicted in Figure 11e,f. It is worth mentioning that exploring the effects of shear force on the epithelial function can be of very complex task biologically. Nevertheless, the experimental work of Sidhayewhich [53] showed that the shear stress can regulate barrier function, alter paracellular permeability, and provide insight into the homeostatic mechanism in the respiratory epithelia.
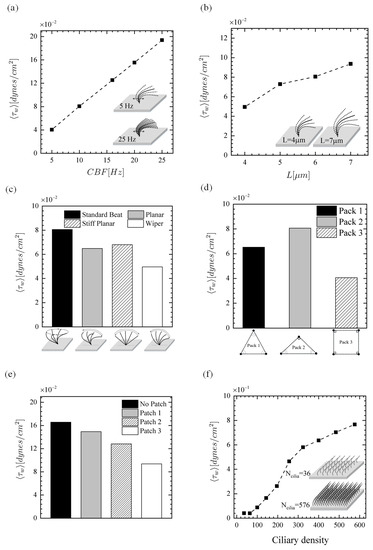
Figure 11.
Time-averaged wall shear stress. Effect of (a) beat frequency, (b) length of cilia, (c) ciliary beat pattern, (d) ciliary pack, (e) missing ciliary patch, and (f) ciliary density (number of cilia over the ciliated domain).
4. Conclusions
By using a finite-difference fluid solver coupled to an IB method, we first examined cilia-driven fluid flows, and then thorough parametric studies were performed to better understand the fluid flow characteristics of PCL in humans with ciliary disorders. Our results can be summarized as follows:
(1) A complex region was generated by the ciliary carpet, and a substantial amount of flow is transferred in the direction parallel to effective stroke. Further, the visualization of the velocity field, particularly above the cilia tips, showed unidirectional transport of the ASL over time. This is in accord with the actual muco-ciliary mechanism. It was also found that vortex-like structures are formed above the cilia tips once they are moving backward during their recovery stroke. However, when the cilia move forward during their effective stroke, small vortices appear below the cilia tip.
(2) Our flow rate and surface velocity results imply the significant role of ciliary beat frequency, suggesting that the discovery of novel pharmaceuticals that can target cilia and increase their frequency of beating could enhance the PCL transport, and as a result, better transport of the ML under diseased conditions, such as asthma, or in cigarette smokers. It should be noted that increasing the beat frequency results in a high shear stress at the epithelium which may adversely affect the epithelial functions.
(3) It was shown that decreasing the ciliary length, which is the case in COPD patients and smokers, hinders the PCL flow rate and the surface mean velocity. It is also found that if the length of cilia is increased, it is less likely to see any significant changes in the PCL flow rate, while the time-averaged surface velocity would increase.
(4) In PCD patients with stiff planar and wiper ciliary beat patterns, pathogens are not effectively cleared from the respiratory tracts due to the large reduction of PCL flow rate, as well as the surface velocity. Nevertheless, the impaired ciliary beat patterns would not significantly change the shear stress.
(5) Generally, the triangular ciliary packs could outperform the square pack, thus increasing the pumping performance of engineered ciliated tissues in microfluidic chips. Note that the case of the equilateral triangle pack showed a higher fluid transport rate than the isosceles triangle pack, but less wall shear stress.
(6) If the patch size is increased, the flow rate, surface velocity, and the shear stress of fluid will be reduced accordingly. Thus, CF patients and cigarette smokers are more prone to infection from the loss of the cilia.
(7) It was found that the flow rate and surface velocity first increase sharply with increasing ciliary density (or number of cilia within the same computational domain) and then reach a plateau. On the other hand, the changes of shear stress depend highly on the number of cilia and did not level off at the higher ciliary density.
In the future work, the present model can be extended to study how drugs dissolved into the PCL would be absorbed by the epithelial cells, or how chemical species secreted by epithelial cells would be dispersed by PCL flows.
Author Contributions
S.M.V. and P.G.J. implemented the numerical model. S.M.V. performed the numerical simulations and the model output postprocessing. S.M.V. wrote the first draft of the manuscript. D.H., P.G.J. supervised and critically reviewed and changed the first draft and suggested additional simulations. R.B. supervised and critically reviewed and revised the subsequent drafts. All authors approved the final version of the manuscript.
Funding
This research received no external funding.
Acknowledgments
S.M.V. would like to acknowledge the QUTPRA scholarship scheme for financial support.
Conflicts of Interest
The authors declare no conflict of interest.
Abbreviations
The following abbreviations are used in this manuscript:
| PCL | Periciliary liquid layer |
| ASL | Airway surface liquid |
| ML | Mucus layer |
| CF | Cystic fibrosis |
| IB | Immersed boundary |
| COPD | Chronic obstructive pulmonary disease |
| PCD | Primary ciliary dysfunction |
| CBF | Cilia beat frequency |
| CBP | Ciliary beat pattern |
References
- Quraishi, M.; Jones, N.; Mason, J. The rheology of nasal mucus: A review. Clin. Otolaryngol. Allied Sci. 1998, 23, 403–413. [Google Scholar] [CrossRef]
- Boucher, R.C. Airway surface dehydration in cystic fibrosis: Pathogenesis and therapy. Annu. Rev. Med. 2007, 58, 157–170. [Google Scholar] [CrossRef]
- Sanderson, M.; Sleigh, M. Ciliary activity of cultured rabbit tracheal epithelium: Beat pattern and metachrony. J. Cell Sci. 1981, 47, 331–347. [Google Scholar]
- Fahy, J.V.; Dickey, B.F. Airway mucus function and dysfunction. N. Engl. J. Med. 2010, 363, 2233–2247. [Google Scholar] [CrossRef]
- Knowles, M.R.; Daniels, L.A.; Davis, S.D.; Zariwala, M.A.; Leigh, M.W. Primary ciliary dyskinesia. Recent advances in diagnostics, genetics, and characterization of clinical disease. Am. J. Respir. Crit. Care Med. 2013, 188, 913–922. [Google Scholar] [CrossRef]
- Guo, H.; Kanso, E. A computational study of mucociliary transport in healthy and diseased environments. Eur. J. Comput. Mech. 2017, 26, 4–30. [Google Scholar] [CrossRef]
- Chatelin, R.; Anne-Archard, D.; Murris-Espin, M.; Thiriet, M.; Poncet, P. Numerical and experimental investigation of mucociliary clearance breakdown in cystic fibrosis. J. Biomech. 2017, 53, 56–63. [Google Scholar] [CrossRef]
- Jayathilake, P.; Le, D.; Tan, Z.; Lee, H.P.; Khoo, B.C. A numerical study of muco-ciliary transport under the condition of diseased cilia. Comput. Methods Biomech. Biomed. Eng. 2015, 18, 944–951. [Google Scholar] [CrossRef]
- Thomas, B.; Rutman, A.; Hirst, R.A.; Haldar, P.; Wardlaw, A.J.; Bankart, J.; Brightling, C.E.; O’callaghan, C. Ciliary dysfunction and ultrastructural abnormalities are features of severe asthma. J. Allergy Clin. Immunol. 2010, 126, 722–729. [Google Scholar] [CrossRef]
- Tilley, A.E.; Walters, M.S.; Shaykhiev, R.; Crystal, R.G. Cilia dysfunction in lung disease. Annu. Rev. Physiol. 2015, 77, 379–406. [Google Scholar] [CrossRef]
- Rossman, C.M.; Lee, R.M.; Forrest, J.B.; Newhouse, M.T. Nasal ciliary ultrastructure and function in patients with primary ciliary dyskinesia compared with that in normal subjects and in subjects with various respiratory diseases. Am. Rev. Respir. Dis. 1984, 129, 161–167. [Google Scholar]
- Rossman, C.M.; Forrest, J.B.; Lee, R.M.; Newhouse, M.T. The dyskinetic cilia syndrome: Ciliary motility in immotile cilia syndrome. Chest 1980, 78, 580–582. [Google Scholar] [CrossRef]
- Chilvers, M.A.; Rutman, A.; O’callaghan, C. Ciliary beat pattern is associated with specific ultrastructural defects in primary ciliary dyskinesia. J. Allergy Clin. Immunol. 2003, 112, 518–524. [Google Scholar] [CrossRef]
- Auerbach, O.; Stout, A.; Hammond, E.C.; Garfinkel, L. Changes in bronchial epithelium in relation to sex, age, residence, smoking and pneumonia. N. Engl. J. Med. 1962, 267, 111–119. [Google Scholar] [CrossRef]
- Leopold, P.L.; O’Mahony, M.J.; Lian, X.J.; Tilley, A.E.; Harvey, B.G.; Crystal, R.G. Smoking is associated with shortened airway cilia. PLoS ONE 2009, 4, e8157. [Google Scholar] [CrossRef]
- Hessel, J.; Heldrich, J.; Fuller, J.; Staudt, M.R.; Radisch, S.; Hollmann, C.; Harvey, B.G.; Kaner, R.J.; Salit, J.; Yee-Levin, J.; et al. Intraflagellar transport gene expression associated with short cilia in smoking and COPD. PLoS ONE 2014, 9, e85453. [Google Scholar] [CrossRef]
- Calderón-Garcidueñas, L.; Rodríguez-Alcaraz, A.; Villarreal-Calderón, A.; Lyght, O.; Janszen, D.; Morgan, K.T. Nasal Epithelium as a Sentinel for Airborne Environmental Pollution. Toxicol. Sci. 1998, 46, 352–364. [Google Scholar] [CrossRef]
- Carson, J.L.; Collier, A.M.; Fernald, G.W.; Hu, S.C.S. Microtubular discontinuities as acquired ciliary defects in airway epithelium of patients with chronic respiratory diseases. Ultrastruct. Pathol. 1994, 18, 327–332. [Google Scholar] [CrossRef]
- Riechelmann, H.; Kienast, K.; Schellenberg, J.; Mann, W. An in vitro model to study effects of airborne pollutants on human ciliary activity. Rhinology 1994, 32, 105–108. [Google Scholar]
- Dulfano, M.; Luk, C.; Beckage, M.; Wooten, O. Ciliary inhibitory effects of asthma patients’ sputum. Clin. Sci. 1982, 63, 393–396. [Google Scholar] [CrossRef]
- Lam, H.C.; Cloonan, S.M.; Bhashyam, A.R.; Haspel, J.A.; Singh, A.; Sathirapongsasuti, J.F.; Cervo, M.; Yao, H.; Chung, A.L.; Mizumura, K.; et al. Histone deacetylase 6–mediated selective autophagy regulates COPD-associated cilia dysfunction. J. Clin. Investig. 2013, 123, 5212–5230. [Google Scholar] [CrossRef]
- Yaghi, A.; Zaman, A.; Cox, G.; Dolovich, M.B. Ciliary beating is depressed in nasal cilia from chronic obstructive pulmonary disease subjects. Respir. Med. 2012, 106, 1139–1147. [Google Scholar] [CrossRef]
- Jayathilake, P.; Tan, Z.; Le, D.; Lee, H.; Khoo, B. Three-dimensional numerical simulations of human pulmonary cilia in the periciliary liquid layer by the immersed boundary method. Comput. Fluids 2012, 67, 130–137. [Google Scholar] [CrossRef]
- Blake, J.R.; Sleigh, M.A. Mechanics of ciliary locomotion. Biol. Rev. 1974, 49, 85–125. [Google Scholar] [CrossRef]
- Sleigh, M. The nature and action of respiratory tract cilia. In Respiratory Defense Mechanisms. Part 1; Marcel Dekker: New York, NY, USA, 1977; pp. 247–288. [Google Scholar]
- Fulford, G.R.; Blake, J.R. Muco-ciliary transport in the lung. J. Theor. Biol. 1986, 121, 381–402. [Google Scholar] [CrossRef]
- Satir, P.; Sleigh, M.A. The physiology of cilia and mucociliary interactions. Annu. Rev. Physiol. 1990, 52, 137–155. [Google Scholar] [CrossRef]
- King, M.; Agarwal, M.; Shukla, J. A planar model for mucociliary transport: Effect of mucus viscoelasticity. Biorheology 1993, 30, 49–61. [Google Scholar]
- Lubkin, D.J.; Gaffney, E.A.; Blake, J.R. A Viscoelastic Traction Layer Model of Muco-Ciliary Transport. Bull. Math. Biol. 2006, 69, 289. [Google Scholar] [CrossRef]
- Matsui, H.; Randell, S.H.; Peretti, S.W.; Davis, C.W.; Boucher, R.C. Coordinated clearance of periciliary liquid and mucus from airway surfaces. J. Clin. Investig. 1998, 102, 1125–1131. [Google Scholar] [CrossRef]
- Khaderi, S.; den Toonder, J.; Onck, P. Microfluidic propulsion by the metachronal beating of magnetic artificial cilia: A numerical analysis. J. Fluid Mech. 2011, 688, 44–65. [Google Scholar] [CrossRef]
- Den Toonder, J.M.; Onck, P.R. Microfluidic manipulation with artificial/bioinspired cilia. Trends Biotechnol. 2013, 31, 85–91. [Google Scholar] [CrossRef]
- Hanasoge, S.; Hesketh, P.J.; Alexeev, A. Microfluidic pumping using artificial magnetic cilia. Microsyst. Nanoeng. 2018, 4, 11. [Google Scholar] [CrossRef]
- Gheber, L.; Priel, Z. Extraction of cilium beat parameters by the combined application of photoelectric measurements and computer simulation. Biophys. J. 1997, 72, 449–462. [Google Scholar] [CrossRef]
- Herawati, E.; Taniguchi, D.; Kanoh, H.; Tateishi, K.; Ishihara, S.; Tsukita, S. Multiciliated cell basal bodies align in stereotypical patterns coordinated by the apical cytoskeleton. J Cell Biol 2016, 214, 571–586. [Google Scholar] [CrossRef]
- Peskin, C.S. Flow patterns around heart valves: A numerical method. J. Comput. Phys. 1972, 10, 252–271. [Google Scholar] [CrossRef]
- McQueen, D.; Peskin, C. Shared-memory parallel vector implementation of the immersed boundary method for the computation of blood flow in the beating mammalian heart. J. Supercomput. 1997, 11, 213–236. [Google Scholar] [CrossRef]
- Luo, H.; Mittal, R.; Zheng, X.; Bielamowicz, S.A.; Walsh, R.J.; Hahn, J.K. An immersed-boundary method for flow–structure interaction in biological systems with application to phonation. J. Comput. Phys. 2008, 227, 9303–9332. [Google Scholar] [CrossRef]
- Tian, F.B.; Dai, H.; Luo, H.; Doyle, J.F.; Rousseau, B. Fluid–structure interaction involving large deformations: 3D simulations and applications to biological systems. J. Comput. Phys. 2014, 258, 451–469. [Google Scholar] [CrossRef]
- Dauptain, A.; Favier, J.; Bottaro, A. Hydrodynamics of ciliary propulsion. J. Fluids Struct. 2008, 24, 1156–1165. [Google Scholar] [CrossRef]
- Brown, D.L.; Cortez, R.; Minion, M.L. Accurate projection methods for the incompressible Navier–Stokes equations. J. Comput. Phys. 2001, 168, 464–499. [Google Scholar] [CrossRef]
- Harlow, F.H.; Welch, J.E. Numerical calculation of time-dependent viscous incompressible flow of fluid with free surface. Phys. Fluids 1965, 8, 2182–2189. [Google Scholar] [CrossRef]
- Adams, J.; Swarztrauber, P.; Sweet, R. Fishpack—A Package of Fortran Subprograms for the Solution of Separable Elliptic Partial Differential Equations. 1980. Available online: http://www.netlib.org/fishpacksending (accessed on 24 April 2018).
- Lee, W.; Jayathilake, P.; Tan, Z.; Le, D.; Lee, H.; Khoo, B. Muco-ciliary transport: Effect of mucus viscosity, cilia beat frequency and cilia density. Comput. Fluids 2011, 49, 214–221. [Google Scholar] [CrossRef]
- Quek, Y.L.R.; Lim, K.M.; Chiam, K.H. Three-dimensional computational model of multiphase flow driven by a bed of active cilia. Comput. Fluids 2018, 170, 222–235. [Google Scholar] [CrossRef]
- Guermond, J.L.; Minev, P.; Shen, J. An overview of projection methods for incompressible flows. Comput. Methods Appl. Mech. Eng. 2006, 195, 6011–6045. [Google Scholar] [CrossRef]
- Morris, J.P.; Fox, P.J.; Zhu, Y. Modeling low Reynolds number incompressible flows using SPH. J. Comput. Phys. 1997, 136, 214–226. [Google Scholar] [CrossRef]
- Shankar, P. The eddy structure in Stokes flow in a cavity. J. Fluid Mech. 1993, 250, 371–383. [Google Scholar] [CrossRef]
- Pan, F.; Acrivos, A. Steady flows in rectangular cavities. J. Fluid Mech. 1967, 28, 643–655. [Google Scholar] [CrossRef]
- Le, D.V.; White, J.; Peraire, J.; Lim, K.M.; Khoo, B. An implicit immersed boundary method for three-dimensional fluid–membrane interactions. J. Comput. Phys. 2009, 228, 8427–8445. [Google Scholar] [CrossRef]
- Pedersen, P.S.; Holstein-Rathlou, N.H.; Larsen, P.L.; Qvortrup, K.; Frederiksen, O. Fluid absorption related to ion transport in human airway epithelial spheroids. Am. J. Physiol.-Lung Cell. Mol. Physiol. 1999, 277, L1096–L1103. [Google Scholar] [CrossRef]
- Aleksandrov, A.; Trakhtengerts, M. Viscosity of water at temperatures of −20 to 150 °C. J. Eng. Phys. Thermophys. 1974, 27, 1235–1239. [Google Scholar] [CrossRef]
- Sidhaye, V.K.; Schweitzer, K.S.; Caterina, M.J.; Shimoda, L.; King, L.S. Shear stress regulates aquaporin-5 and airway epithelial barrier function. Proc. Natl. Acad. Sci. USA 2008, 105, 3345–3350. [Google Scholar] [CrossRef]
- Chatelin, R.; Poncet, P. A hybrid grid-particle method for moving bodies in 3D stokes flow with variable viscosity. SIAM J. Sci. Comput. 2013, 35, B925–B949. [Google Scholar] [CrossRef]
- Knowles, M.R.; Boucher, R.C. Mucus clearance as a primary innate defense mechanism for mammalian airways. J. Clin. Investig. 2002, 109, 571–577. [Google Scholar] [CrossRef]
- Raidt, J.; Wallmeier, J.; Hjeij, R.; Onnebrink, J.G.; Pennekamp, P.; Loges, N.T.; Olbrich, H.; Häffner, K.; Dougherty, G.W.; Omran, H.; et al. Ciliary beat pattern and frequency in genetic variants of primary ciliary dyskinesia. Eur. Respir. J. 2014, 44, 1579–1588. [Google Scholar] [CrossRef]
- Ding, Y.; Nawroth, J.C.; McFall-Ngai, M.J.; Kanso, E. Mixing and transport by ciliary carpets: A numerical study. J. Fluid Mech. 2014, 743, 124–140. [Google Scholar] [CrossRef]
- Piotrowska, V.M.; Piotrowski, W.J.; Kurmanowska, Z.; Marczak, J.; Górski, P.; Antczak, A. Rhinosinusitis in COPD: Symptoms, mucosal changes, nasal lavage cells and eicosanoids. Int. J. Chronic Obstr. Pulm. Dis. 2010, 5, 107. [Google Scholar]
- Teff, Z.; Priel, Z.; Gheber, L.A. Forces applied by cilia measured on explants from mucociliary tissue. Biophys. J. 2007, 92, 1813–1823. [Google Scholar] [CrossRef][Green Version]
- Teff, Z.; Priel, Z.; Gheber, L.A. The forces applied by cilia depend linearly on their frequency due to constant geometry of the effective stroke. Biophys. J. 2008, 94, 298–305. [Google Scholar] [CrossRef]
- Hussong, J.; Lindken, R.; Faulhammer, P.; Noreikat, K.; Sharp, K.; Kummer, W.; Westerweel, J. Cilia-driven particle and fluid transport over mucus-free mice tracheae. J. Biomech. 2013, 46, 593–598. [Google Scholar] [CrossRef]
© 2019 by the authors. Licensee MDPI, Basel, Switzerland. This article is an open access article distributed under the terms and conditions of the Creative Commons Attribution (CC BY) license (http://creativecommons.org/licenses/by/4.0/).