1. Introduction
The role of patent analysis is to analyze the patent documents related to a given technology using statistical methods or machine learning algorithms. Because the patent has abundant information on the completed research and development, many researchers have been carrying out technology analysis using the patent document data. In addition, since the patent system protects the inventor’s right exclusively for their developed technology, many researchers have tried to file and register their developed technology to patent offices around the world [
1]. In addition, they want to understand different types of relevant technology using on the results of patent analysis. So far, various patent analysis studies using statistical analysis and machine learning have been published. Jun and Lee (2013) used a social network analysis (SNA) method for analyzing Apple’s patents to understand the technology innovation of Apple [
2]. This research represented the technological relations between various sub technologies of Apple by using an SNA visualization. Also, Choi and Hwang (2014) proposed a patent keyword network analysis method using network construction based on graph theory [
3]. They applied their method to improve technology development efficiency in light emitting diode (LED) and wireless broadband fields. In addition, many patent analysis studies using visualization have been published in various fields [
2,
4,
5,
6]. In addition to this network visualization technique, Kim et al. (2017) performed patent analysis using statistical methods [
7]. They considered penalized regression models based on ridge and least absolute shrinkage and selection operator (LASSO) regressions to get patent analysis results. Uhm et al. (2017) carried out a statistical inference to analyze patent keywords for technology forecasting [
8]. This paper estimated the significance intervals of patent keywords, and provided the future trends of technological keywords. Recently, various research on patent analysis considering time has been in progress in diverse fields. If we analyze the patent data with time, we can understand more about the technological evolution. Guidolin and Guseo (2014), Hong et al. (2016), and Lakka et al. (2013) studied some meaningful approaches for patent analysis over time [
9,
10,
11]. Kim and Jun (2017) proposed a time series model considering integer valued elements because the patent-keyword matrix has integer valued elements which use the frequency values of keywords in patents [
12]. They used the integer valued generalized autoregressive conditional heteroskedasticity (GARCH) model with Poisson and negative binomial distributions for integer valued patent analysis.
This study concentrated on the time factor in patent analysis, so it was limited to finding the technological relationships between the technological keywords. In this paper, we propose a patent analysis method that performs integer valued time series analysis and statistical relation analysis of technologies at the same time. We combined the integer valued GARCH with copula directional dependence to build the proposed patent analysis model [
13]. To verify the performance of our research, we conducted experiments using the patent documents filed and registered by Apple. In addition, we will show the technological relationships of Apple’s sub technologies over time. We organized this paper as follows.
Section 2 introduces the research background of our study. We proposed a patent analysis model using copula directional dependence via integer-valued GARCH in
Section 3. In
Section 4, we illustrated the experimental results of this paper using Apple’s patent keywords. Lastly, we provided our conclusions in
Section 5.
2. Research Background
In this paper, we analyze patent keywords for technology analysis. A patent document contains rich and valuable information about researched and developed technology, because the patent system protects the inventor’s exclusive right to use the technology for a period of time [
1,
14]. In most of the studies related to patent analysis, the authors first constructed a patent-keyword matrix by extracting keywords from patent documents for patent analysis [
6,
8,
12,
15,
16,
17,
18]. The matrix is composed of a patent row and keyword column, and it represents the frequency value of each keyword in a patent. In the previous research, this matrix was used for patent analysis by using statistics and machine learning algorithms. The results from the patent analysis are useful for technology management processes such as research and development (R&D) planning, new product developments, technology forecasting, etc. Therefore, technology management based on patent analysis has been carried out in diverse fields. The general process of patent analysis is as follows [
6,
14,
19]:
- Step 1:
Select and understand the target technology
- Step 2:
Make a keyword equation for patent searching and collect patents related to the target technology
- Step 3:
Transform the collected patent documents into structured data
- Step 4:
Analyze structured data (a patent-keyword matrix) using statistics or machine learning
- Step 5:
Apply patent analysis results to technology management.
We first determined the target technology for which we want to perform patent analysis. Next, we made a keyword search expression to search for patent documents related to the target technology. If the target technology is limited to the technology of a specific company such as Apple, instead of the keyword search equation, we then searched for all the patents filed and registered by the company. In this paper, we analyze the technology registered by Apple, so we searched the patent documents applied for and registered by Apple. Patent analysis cannot be done directly on the searched patent documents. This is because patent document data is not a table structure which consists of a row of observations (tuple) and a column of variables (attribute) for statistical analysis. To solve this problem, we have to transform the patent documents into patent-keyword matrix (structured data) which is composed of patent rows and keyword columns, and includes the frequency value of each keyword in a patent. We used various text mining techniques to build the structured patent data. Then, we analyze this matrix using statistical methods and machine learning algorithms. Lastly, we applied the results of patent analysis to technology management processes such as R&D planning or technology forecasting.
3. Patent Analysis Model Using Copula Directional Dependence via Integer-Valued GARCH
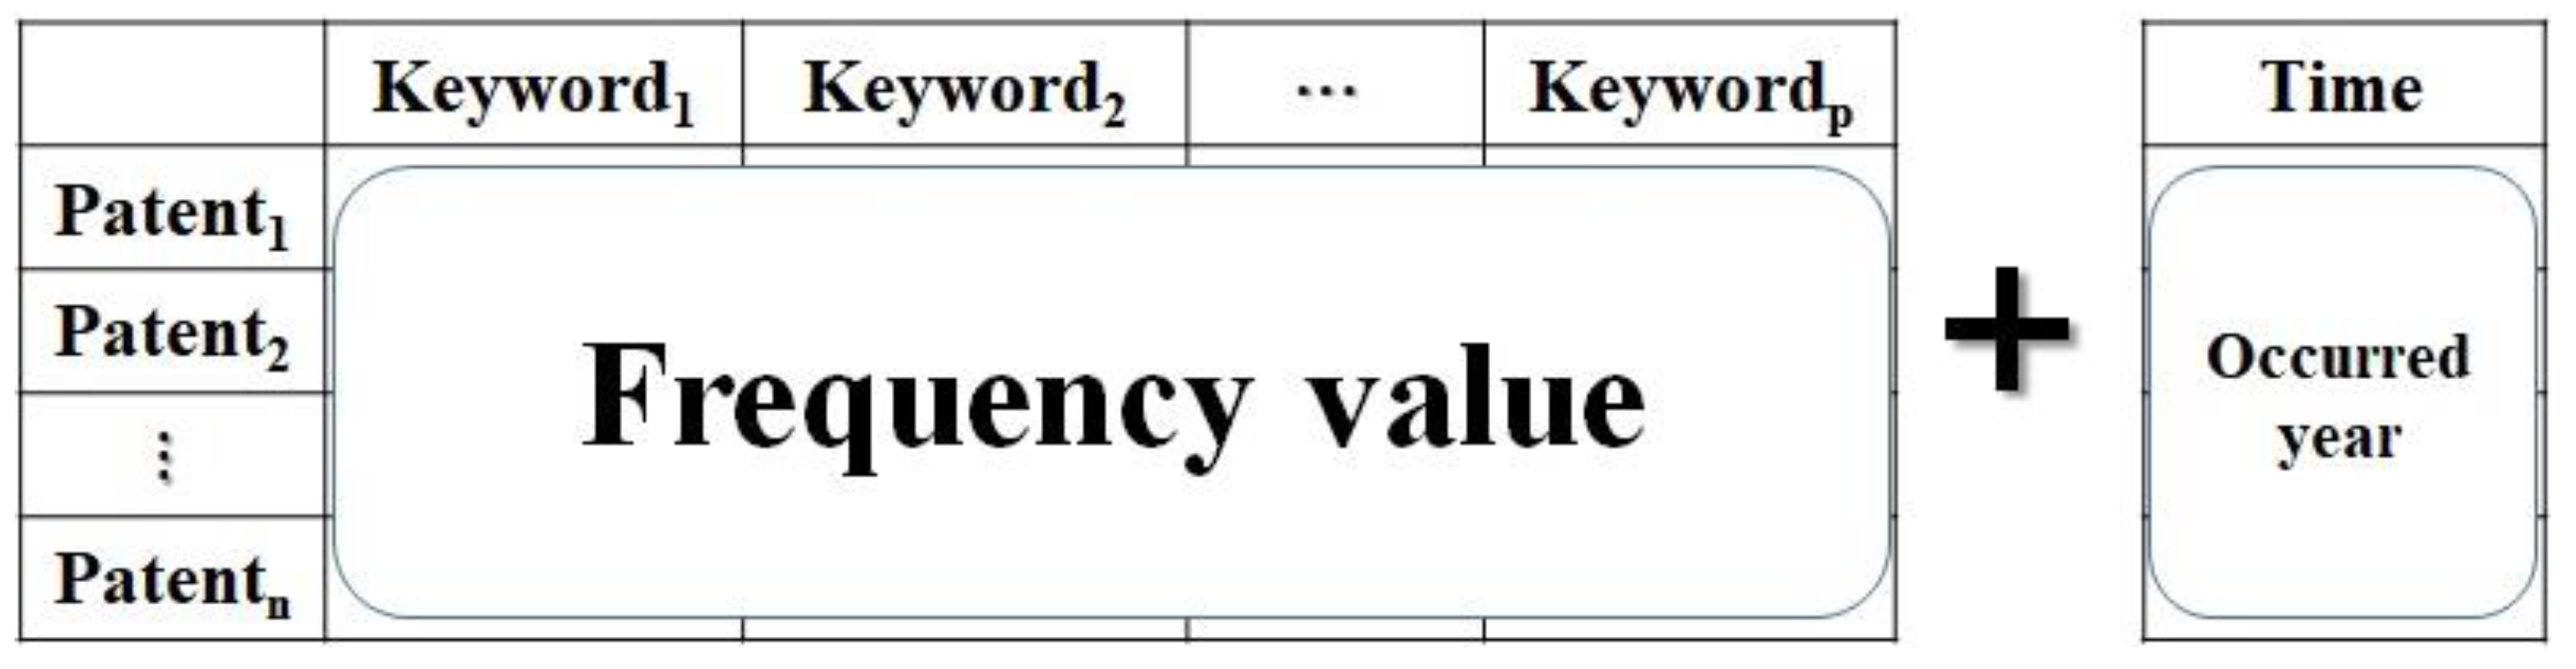
Patent-keyword matrix is a popular data structure for technology analysis based on patent document data. In this paper, we also use this data structure for the proposed methods. First we collected the patent documents from the popular patent databases in the world. Next, we transformed the patent data into the patent-keyword matrix using various text mining techniques such as text document collections (corpus). The matrix consists of patent (row) and keyword (column), and each element of the matrix represents the occurred frequency of each keyword in each patent. In this paper, we add another column to the matrix. The column is time factor (year), because our model analyzes the patent keywords over time.
Figure 1 shows a patent-keyword matrix with the time factor developed by our research.
In
Figure 1, each frequency value of the matrix is an integer. So we need a statistical approach to integer value analysis that considers the time factor. In this paper, we apply time series analysis and count data analysis to build the integer-valued analysis with time for patent data analysis. Integer-valued time series data are commonly observed in real data applications as well as technology analysis. Dealing with integer-valued time series using ARMA (autoregressive moving average) models and GARCH (generalized autoregressive conditional heteroscedastic) models which are used for real-valued data is not suitable for accommodating integer-valued time series in patent analysis. Integer-valued time series are non-negative and their variance often changes over time, which means that the assumption of homogeneous variance seems to be improper for such a time series. The integer-valued GARCH (INGARCH) model was proposed by Ferland et al. (2006) [
20]. This model is used for integer-valued time series analysis. Also, the INGARCH model with Poisson deviates is an analogue of the GARCH model with normal deviates.
Xt and
Ft-1 are integer-valued time series data at time
t and information set up to time
t-1, and then the INGARCH(p,q) model is represented by a Poisson distribution as follows [
20].
where m is the parameter of the Poisson distribution, and this is defined as follows [
20]:
The INARCH(p) model is the INGARCH(p,q) model with q = 0. The conditional distribution of
Xt is Poisson in the INGARCH(p,q) model, and then the conditional mean depends on the past values of the time series and its own past values. In addition, the INGARCH(1,1) model is shown as follows [
20]:
Therefore, the conditional mean at time
t is dependent on the value at time
t-1 and on its own value at time
t-1 . In our research, the integer-valued GARCH model is combined with the copula directional dependence for patent keywords analysis over time. Copula is a multivariate function distributed on [0, 1] uniformly. The first proposed Copula by Sklar (1959) was a two dimensional function based on bivariate distribution as follows [
21]:
where
represents the Copula function, and
is a bivariate cumulative distribution of x and y.
and
are cumulatively marginal distributions of x and y, respectively. The range of
is [0,1]. So
and
are part of a uniform distribution as follows:
Copula provides the dependent process between the random variables of x and y by using a marginal distribution with removing influences. To control the variables with heteroskedasticity, we used the bounded time series model based on beta regression analysis [
22]. Using this model, we directly interpreted the regression parameters with an original response scale. In this paper, we propose Copula directional dependence via the integer-valued GARCH based beta regression model. In the proposed model for patent keyword analysis,
Yt is a response variable (keyword) on the unit interval at time t, and
xt is a covariate vector (keyword vector). In the beta regression model,
Yt|
xt follows the beta distribution as follows [
23]:
where α and β are the parameters of the beta distribution for mean and precision, and
is the beta function based on gamma function
as follows [
23]:
In our research, the dependence of
on
xt was obtained by a logit mode of mean parameter(
) as follows:
where
is a transpose of
xt, and
is coefficient vector. Our proposed copula directional dependence by integer-valued GARCH model, which is based on nonlinear logit model, is more flexible than the current available approaches to directional dependence by linear regression type model [
24]. To verify the accuracy of the model, we used two measures: Akaike information criterion (AIC) and Bayes information criterion (BIC). The AIC is defined as follows [
25]:
where n and P are sample size and model parameters. SSE represents the error sum of squares. We determined the best model with the smallest AIC value. Next, the BIC was represented as follows [
25]:
We also selected the best model with the smallest BIC value. In next section, we carried out various experiments to illustrate the validity of our research models using the AIC and BIC measures.
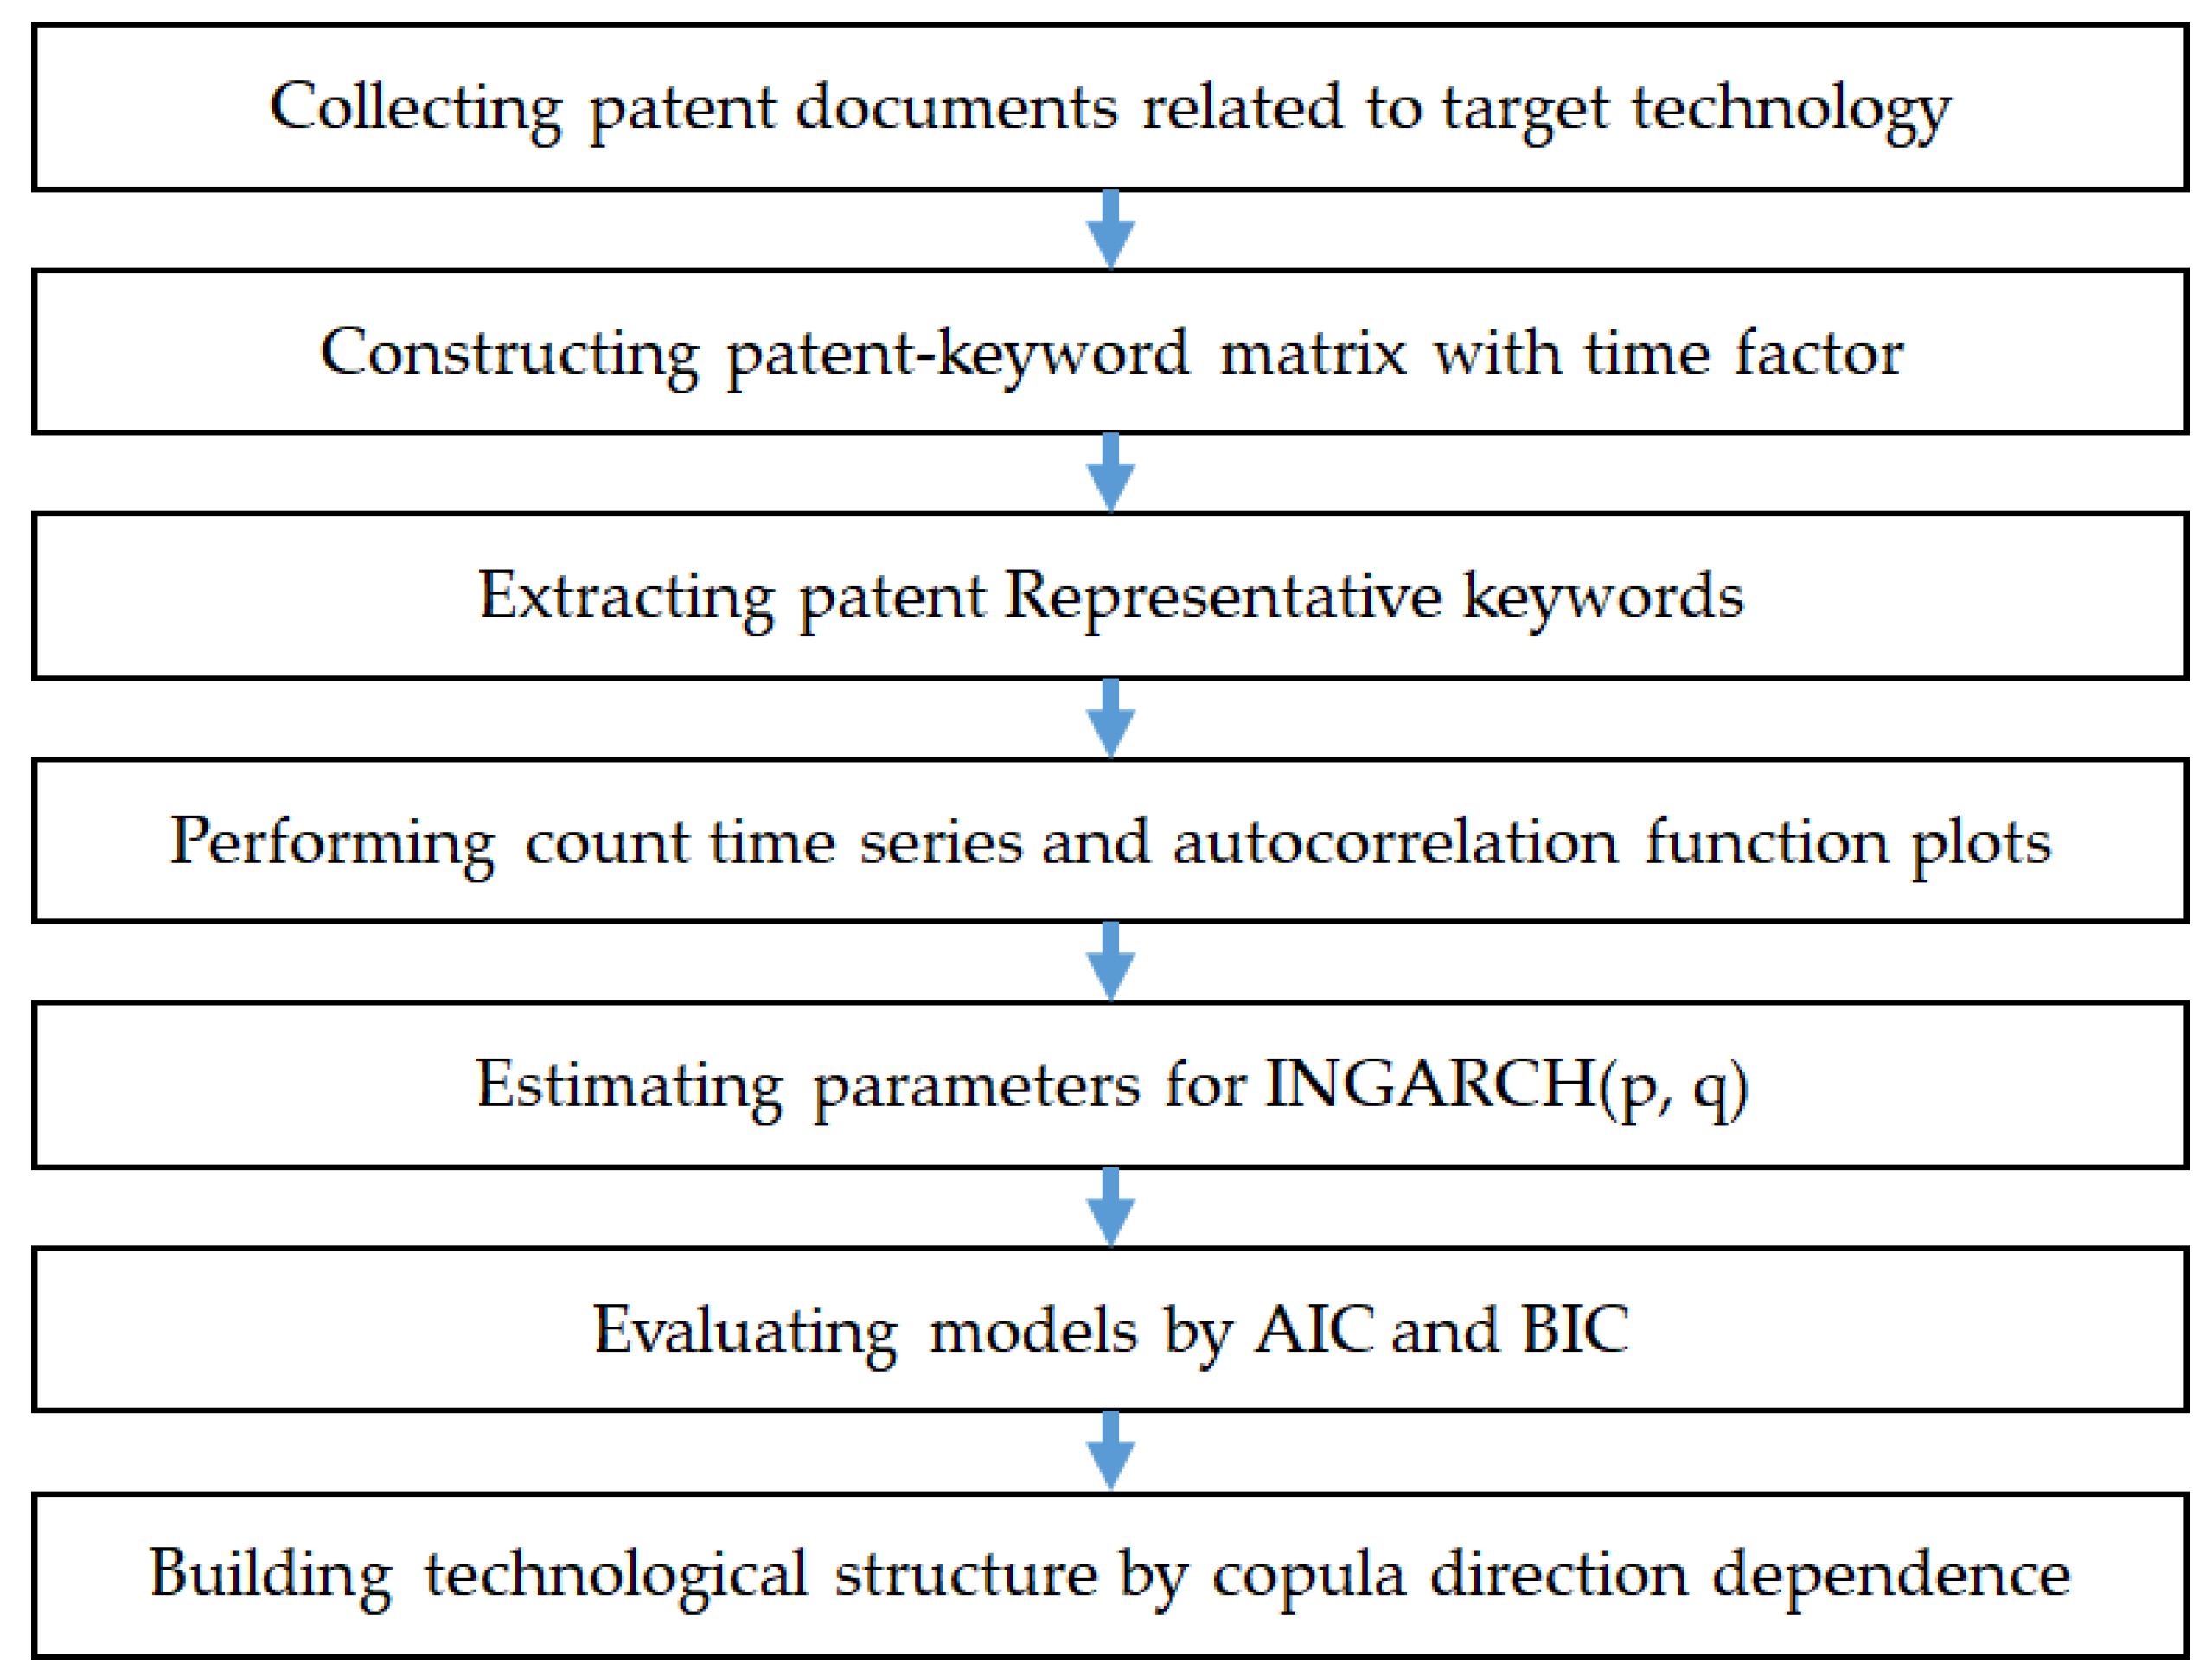
Figure 2 shows the proposed patent keyword analysis process using time series and copula models.
Once the target technology for analysis was selected, we collected the patent documents related to the target technology from all the patent databases in the world. Using the collected patent document data, we constructed a patent-keyword matrix, and the row and column of this matrix were the patent and the keyword. The value of this matrix was the occurred frequency of each keyword in a patent. Next we extracted the core keywords related to target technology from the matrix. To understand the technological structure of the target domain we first performed a visualization using a count time series and autocorrelation function plots. For more detailed technology analysis, we used the INGARCH model and estimated the parameters of this model. For the evaluation of the final model, we used AIC and BIC measures. Based on the final model after the evaluation, we used copula direction dependence to find the technology relation structure for the target technology. The results of our study can be used for the R&D planning of countries and companies. A company can also use the results to develop new innovative products, and conduct technology transfer and commercialization.
4. Experimental Results
To verify the performance of our proposed method, we used the patent documents of Apple. Apple is a leading company in smart devices, and smart devices are dependent on diverse technologies. Apple’s patent data was used in many research studies for patent data analysis [
6,
17,
26]. We have searched all patent documents applied and registered by Apple until 2012 from the patent databases [
27,
28]. The number of valid patents finally selected from the collected patent data was 8119. In this paper, we extracted technological keywords from the Apple’s valid patent documents using the text mining techniques [
29]. The keyword data is a matrix consisting of a row of individual patent documents and a column of keywords. Each element of this matrix represents the occurred frequency value of the keyword in a patent document. Among them, we selected top five keywords with the highest frequency as follows; Device (6919), Data (6676), System (5936), User (4767), and Media (4157). The numbers in parentheses in the above keywords indicate the frequency of each keyword. These keywords were used to find the directional dependence by using Gaussian copula regression with beta logit [
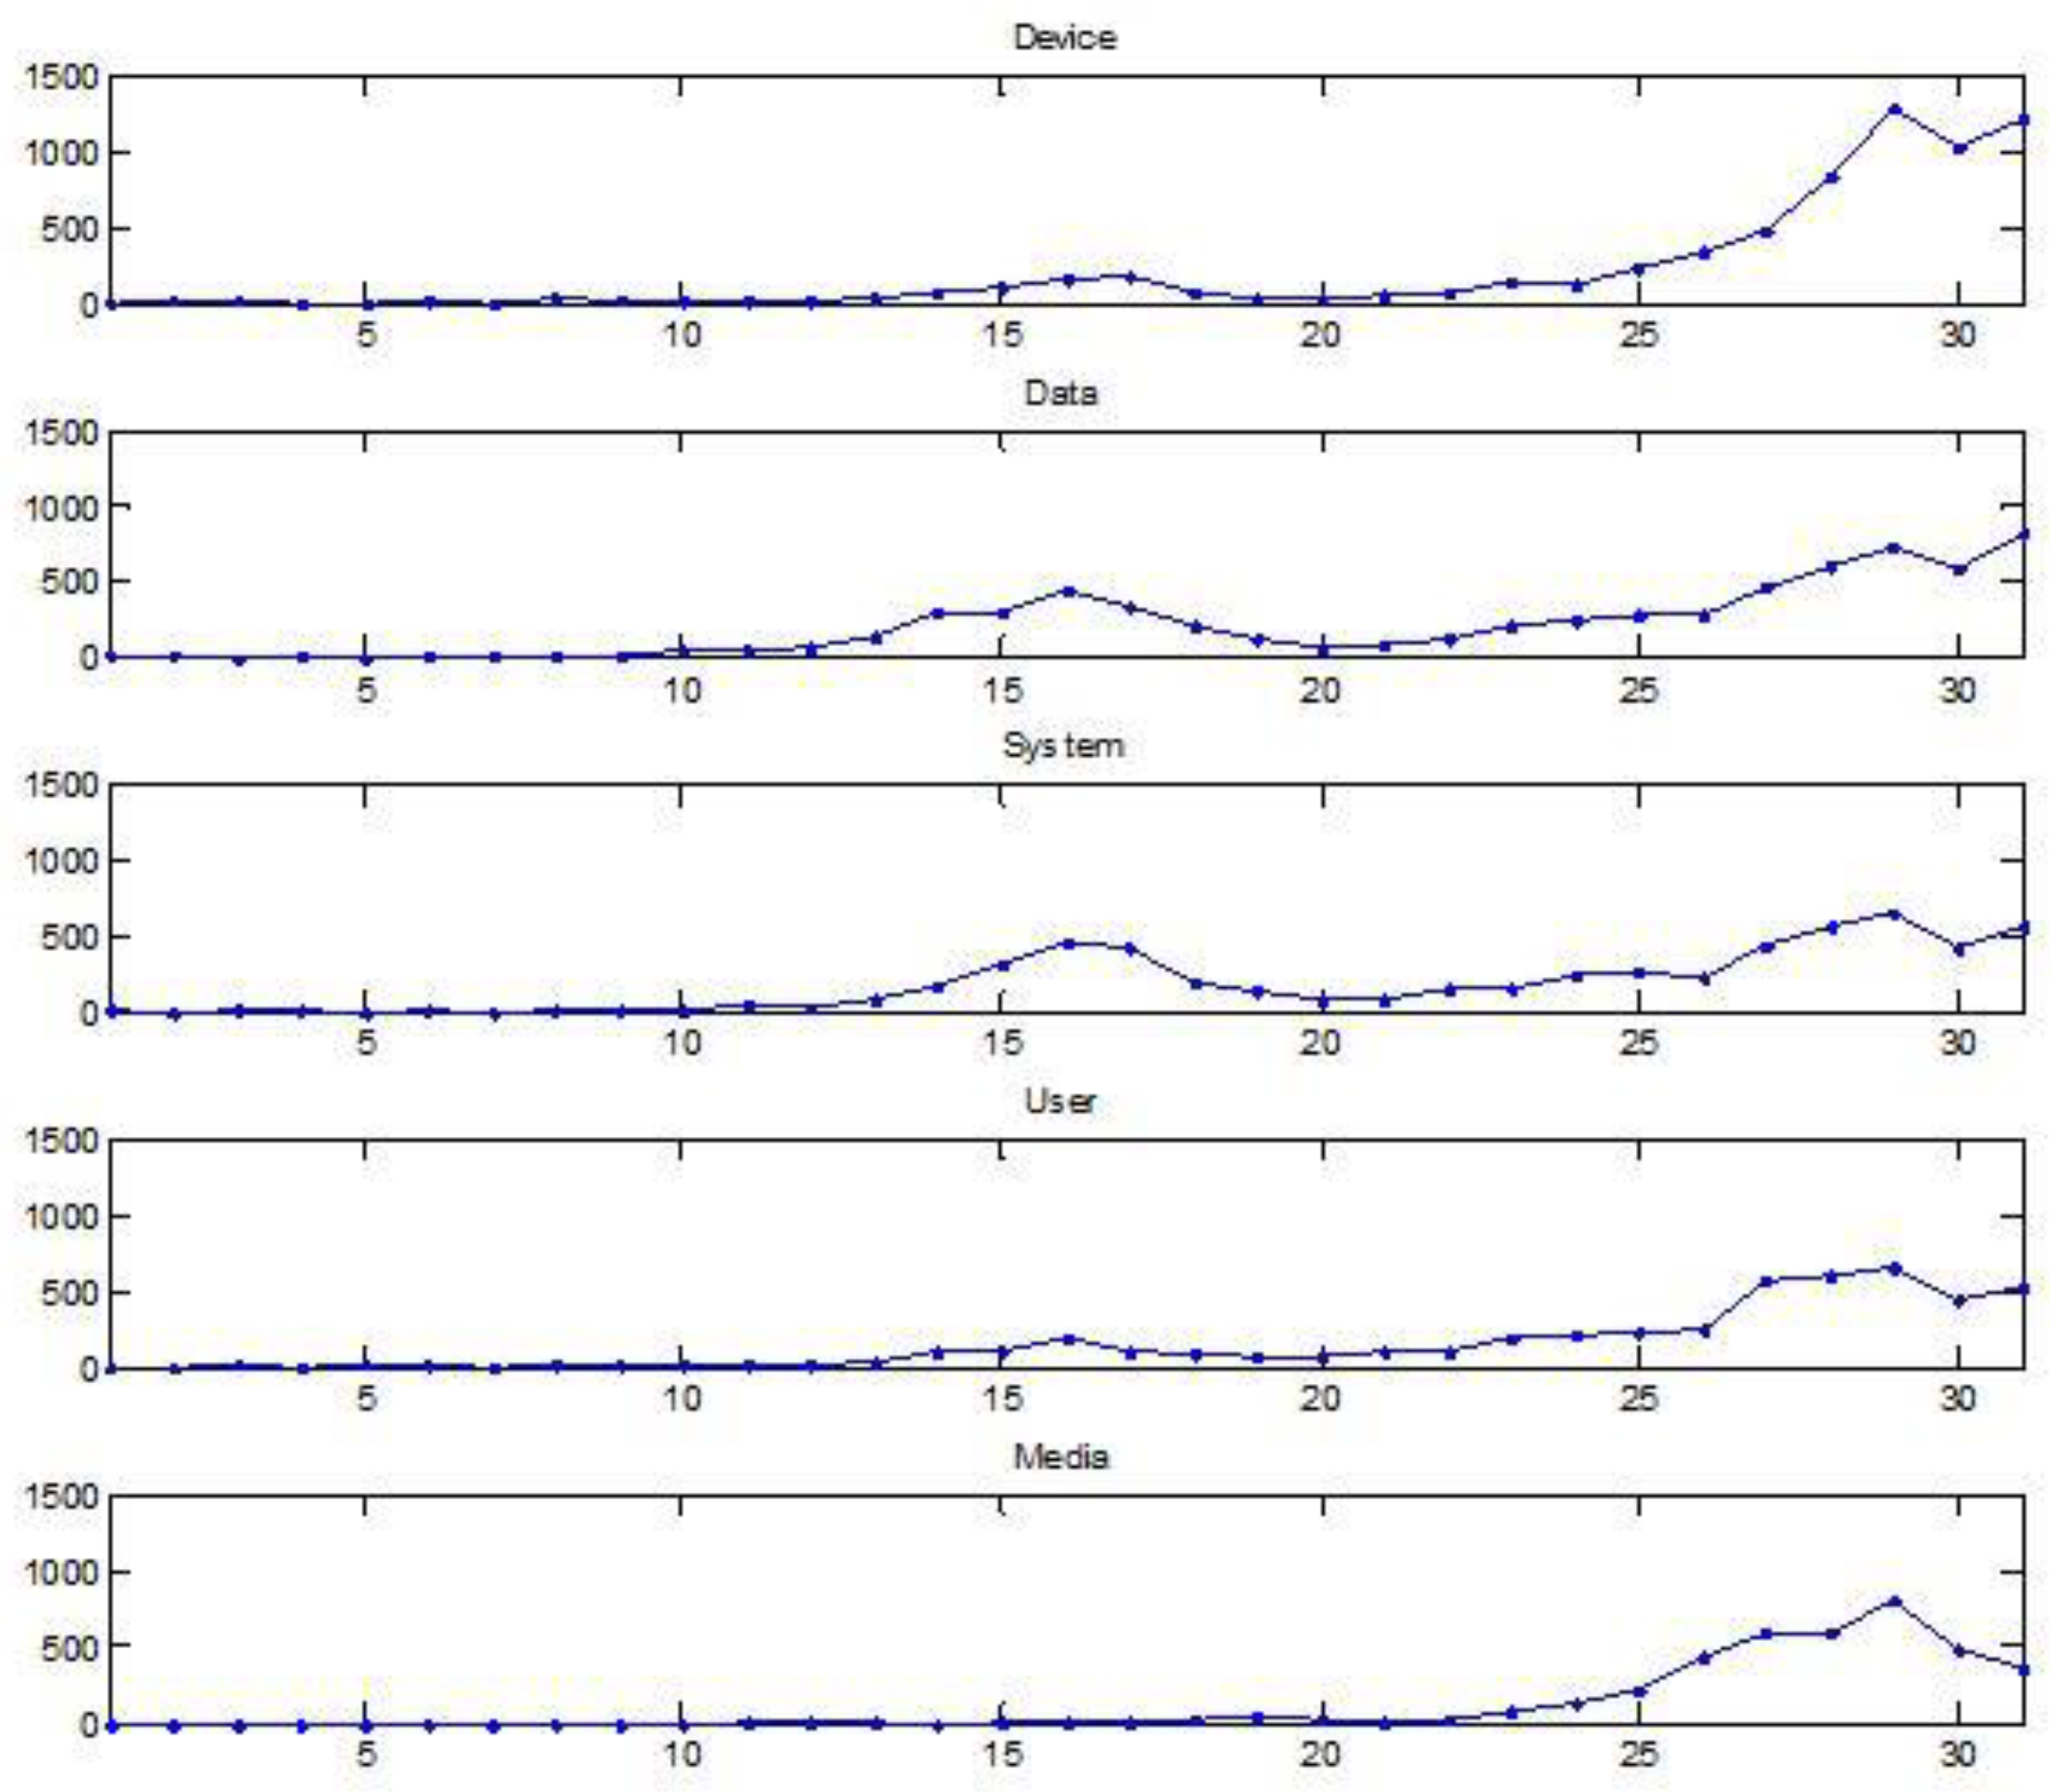
16]. First, we visually assessed the trend these five keywords showed over time.
Figure 3 shows the time series plots of ‘Device’, ‘Data’, ‘System’, ‘User’, and ‘Media’.
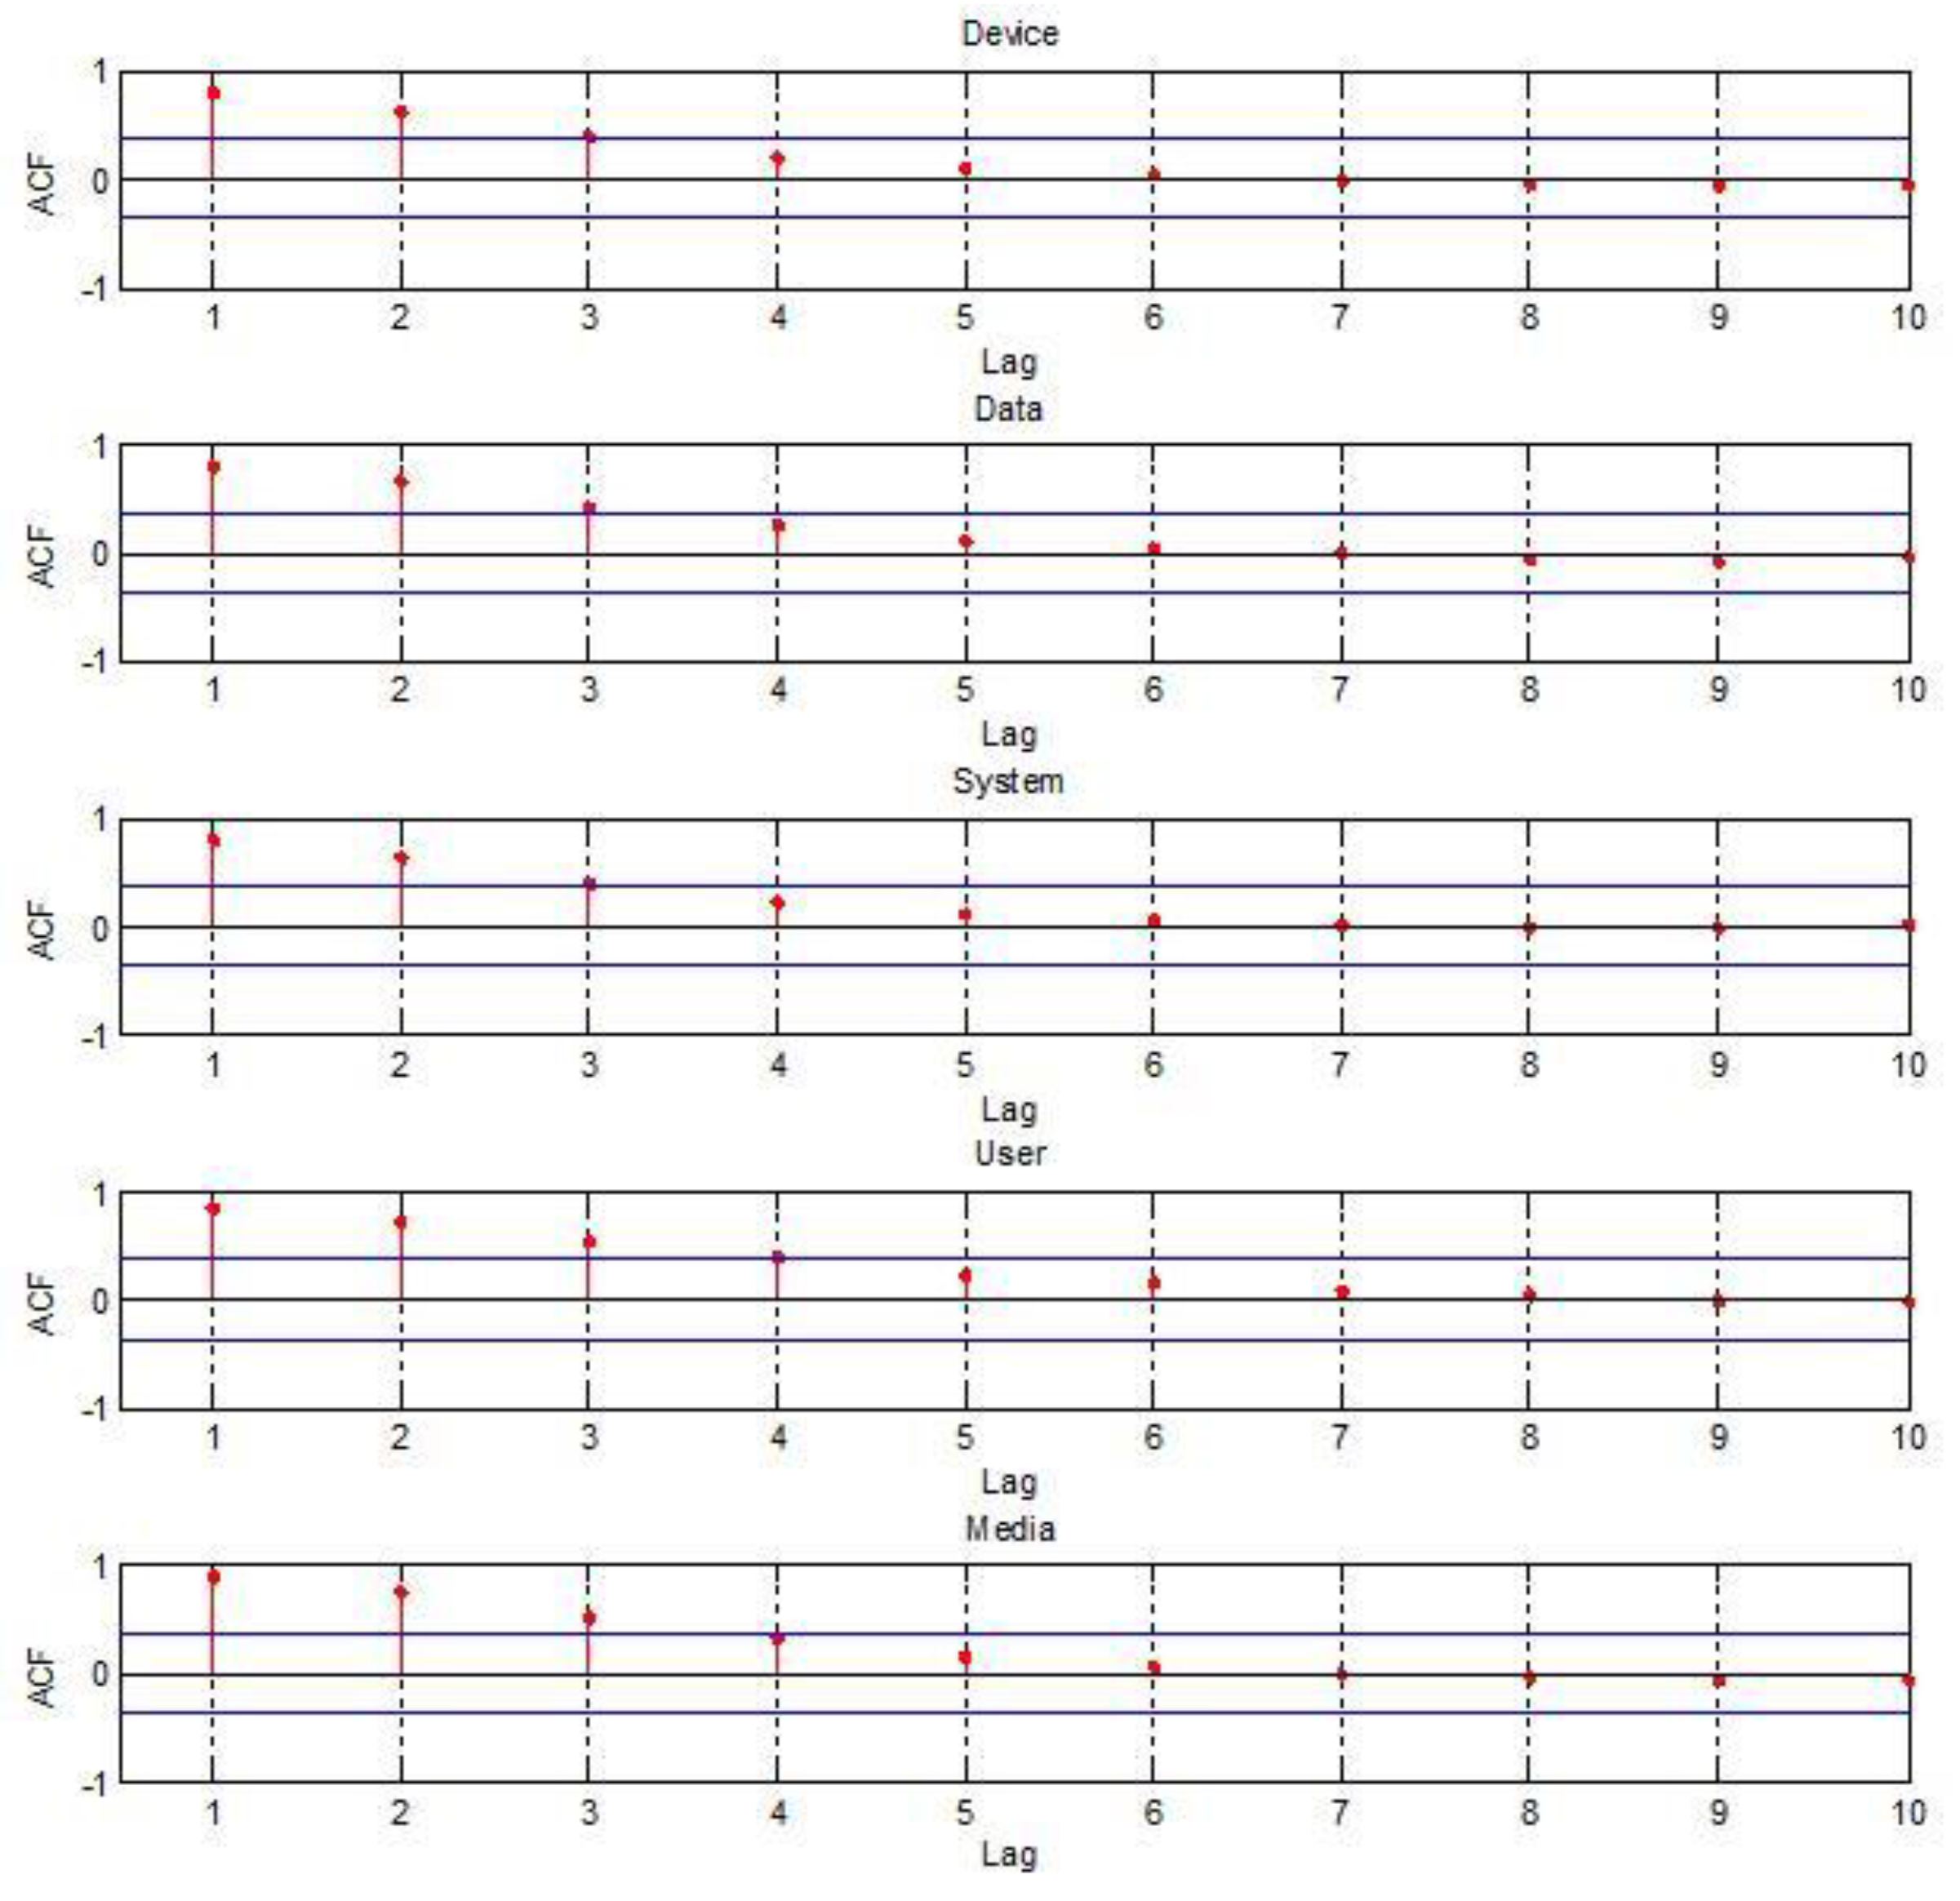
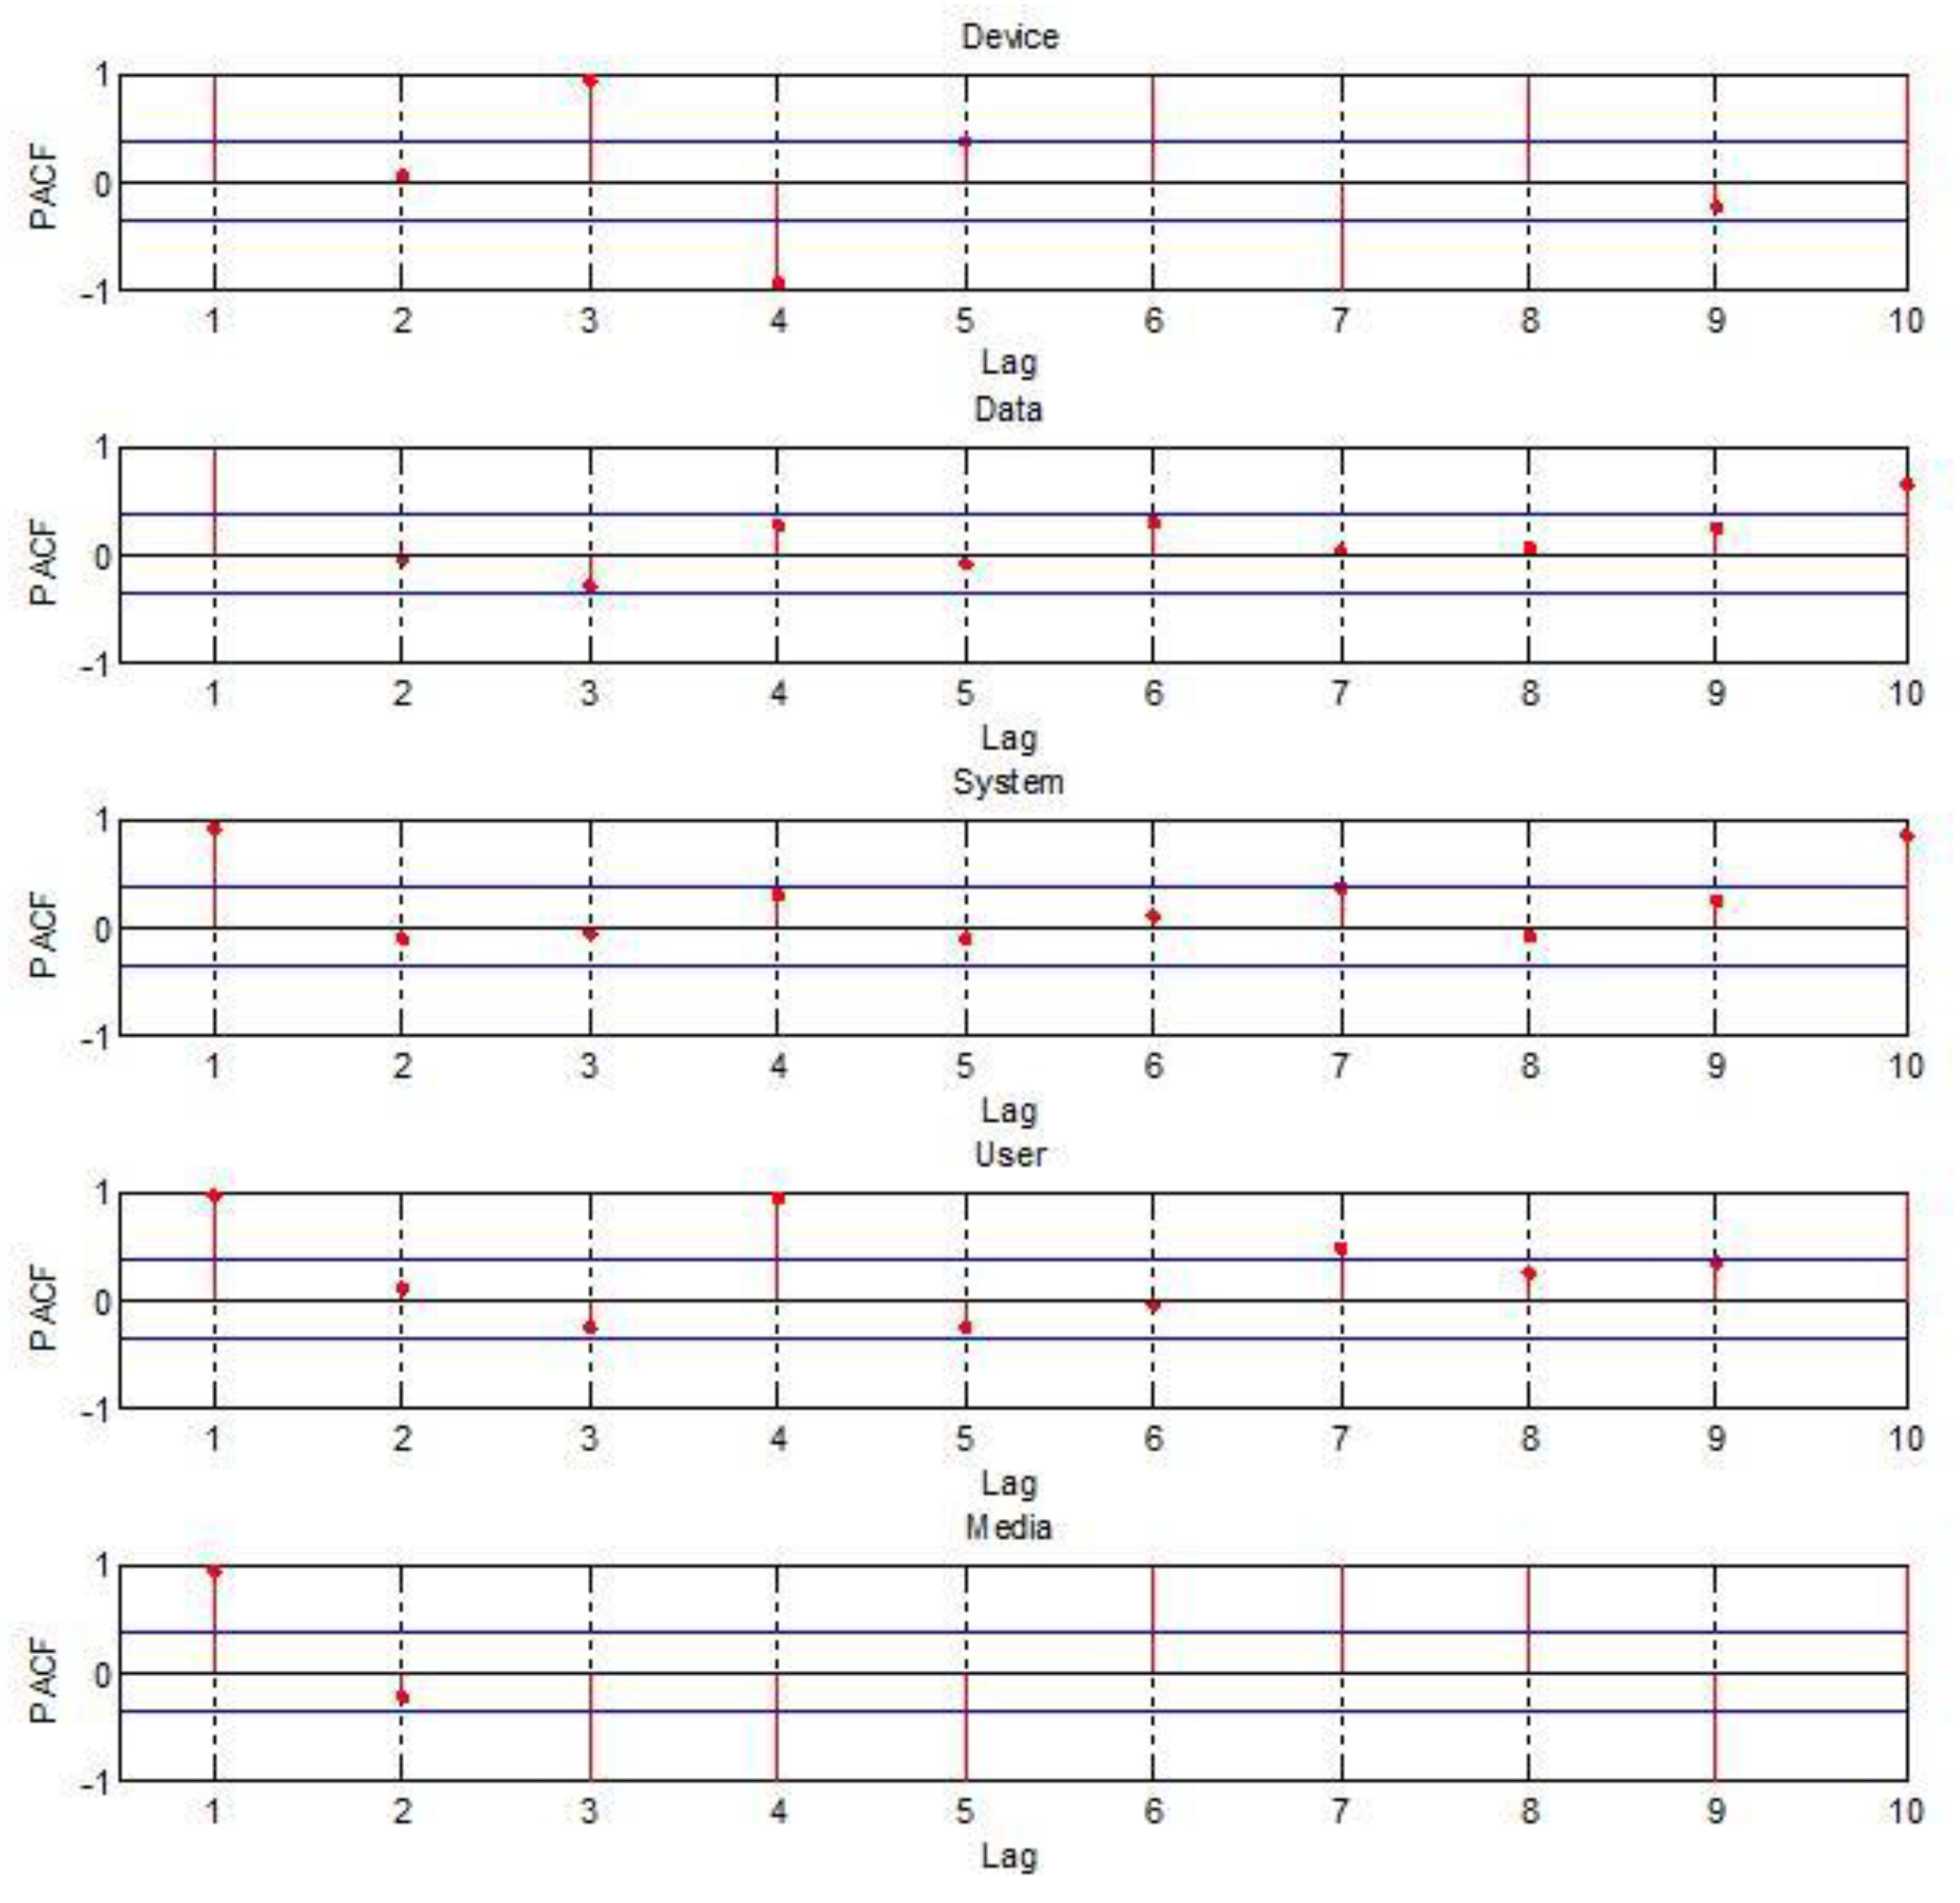
The time series plots of main Apple keywords have increasing and nonstationary patterns. To make sure that Apple time series data are nonstationary, we performed the autocorrelation function (ACF) plots and the partial autocorrelation function (PACF) plots of Apple time series keywords.
Figure 4 and
Figure 5 are the ACF plots and PACF plots which exist nonstationarily over several time lags.
From the results of
Figure 4 and
Figure 5, we can say that the Apple time series keywords are not stationary. It is appropriate that we apply the time series model considering heteroscedasticity to the five highest frequency keywords. The INGARCH(1,1), considering that the conditional distribution of count time data, Yt, follows a Poisson distribution, was applied to the five most highest frequency Apple keywords.
Table 1 is a summary of parameter estimates for INGARCH(1,1).
To estimate the parameters, we used the R data language and the ‘tscount’ package of R [
30,
31].
Table 1 shows that the conditional means of Apple five keywords at time
t depends on the value at time
t-1 more than its own value at time
t-1. By using these INGARCH(1,1) models summarizing
Table 1, we generated standardized residuals of the five main Apple keywords for the Gaussian copula models for marginal regression (GCMR) analysis with a correlation structure in order to avoid the serial dependence in the component time series [
32]. With these standardized residuals of the five main Apple keywords from INGARCH(1,1), we transformed these standardized residuals into uniform random variables. And then we considered the GCMR(Gaussian copula marginal regression) models with four correlation error structures, ARMA(p,q) where p = 1 and q = 2. For example, the model of ‘Device’ was represented as follows:
Table 2 shows an Akaike information criterion (AIC) comparison for the GCMR models with a correlation structure.
For the further analysis with the five transformed Apple time series keywords, we chose the best model based on the values of AIC for twenty transformed Apple keywords pairs in
Table 2. Among 20 pairs of two main transformed Apple keywords in
Table 2, the model shows that the 15 pairs had the smallest AIC values from the GCMR model with an ARMA(0,0) correlation error structure, and five pairs had the smallest AIC values from the GCMR model with an ARMA(0,1) correlation error structure. With the parameter estimates obtained from the best models chosen in
Table 2, we computed Gaussian copula directional dependence with the beta logit model with the 20 pairs of five transformed Apple time series keywords.
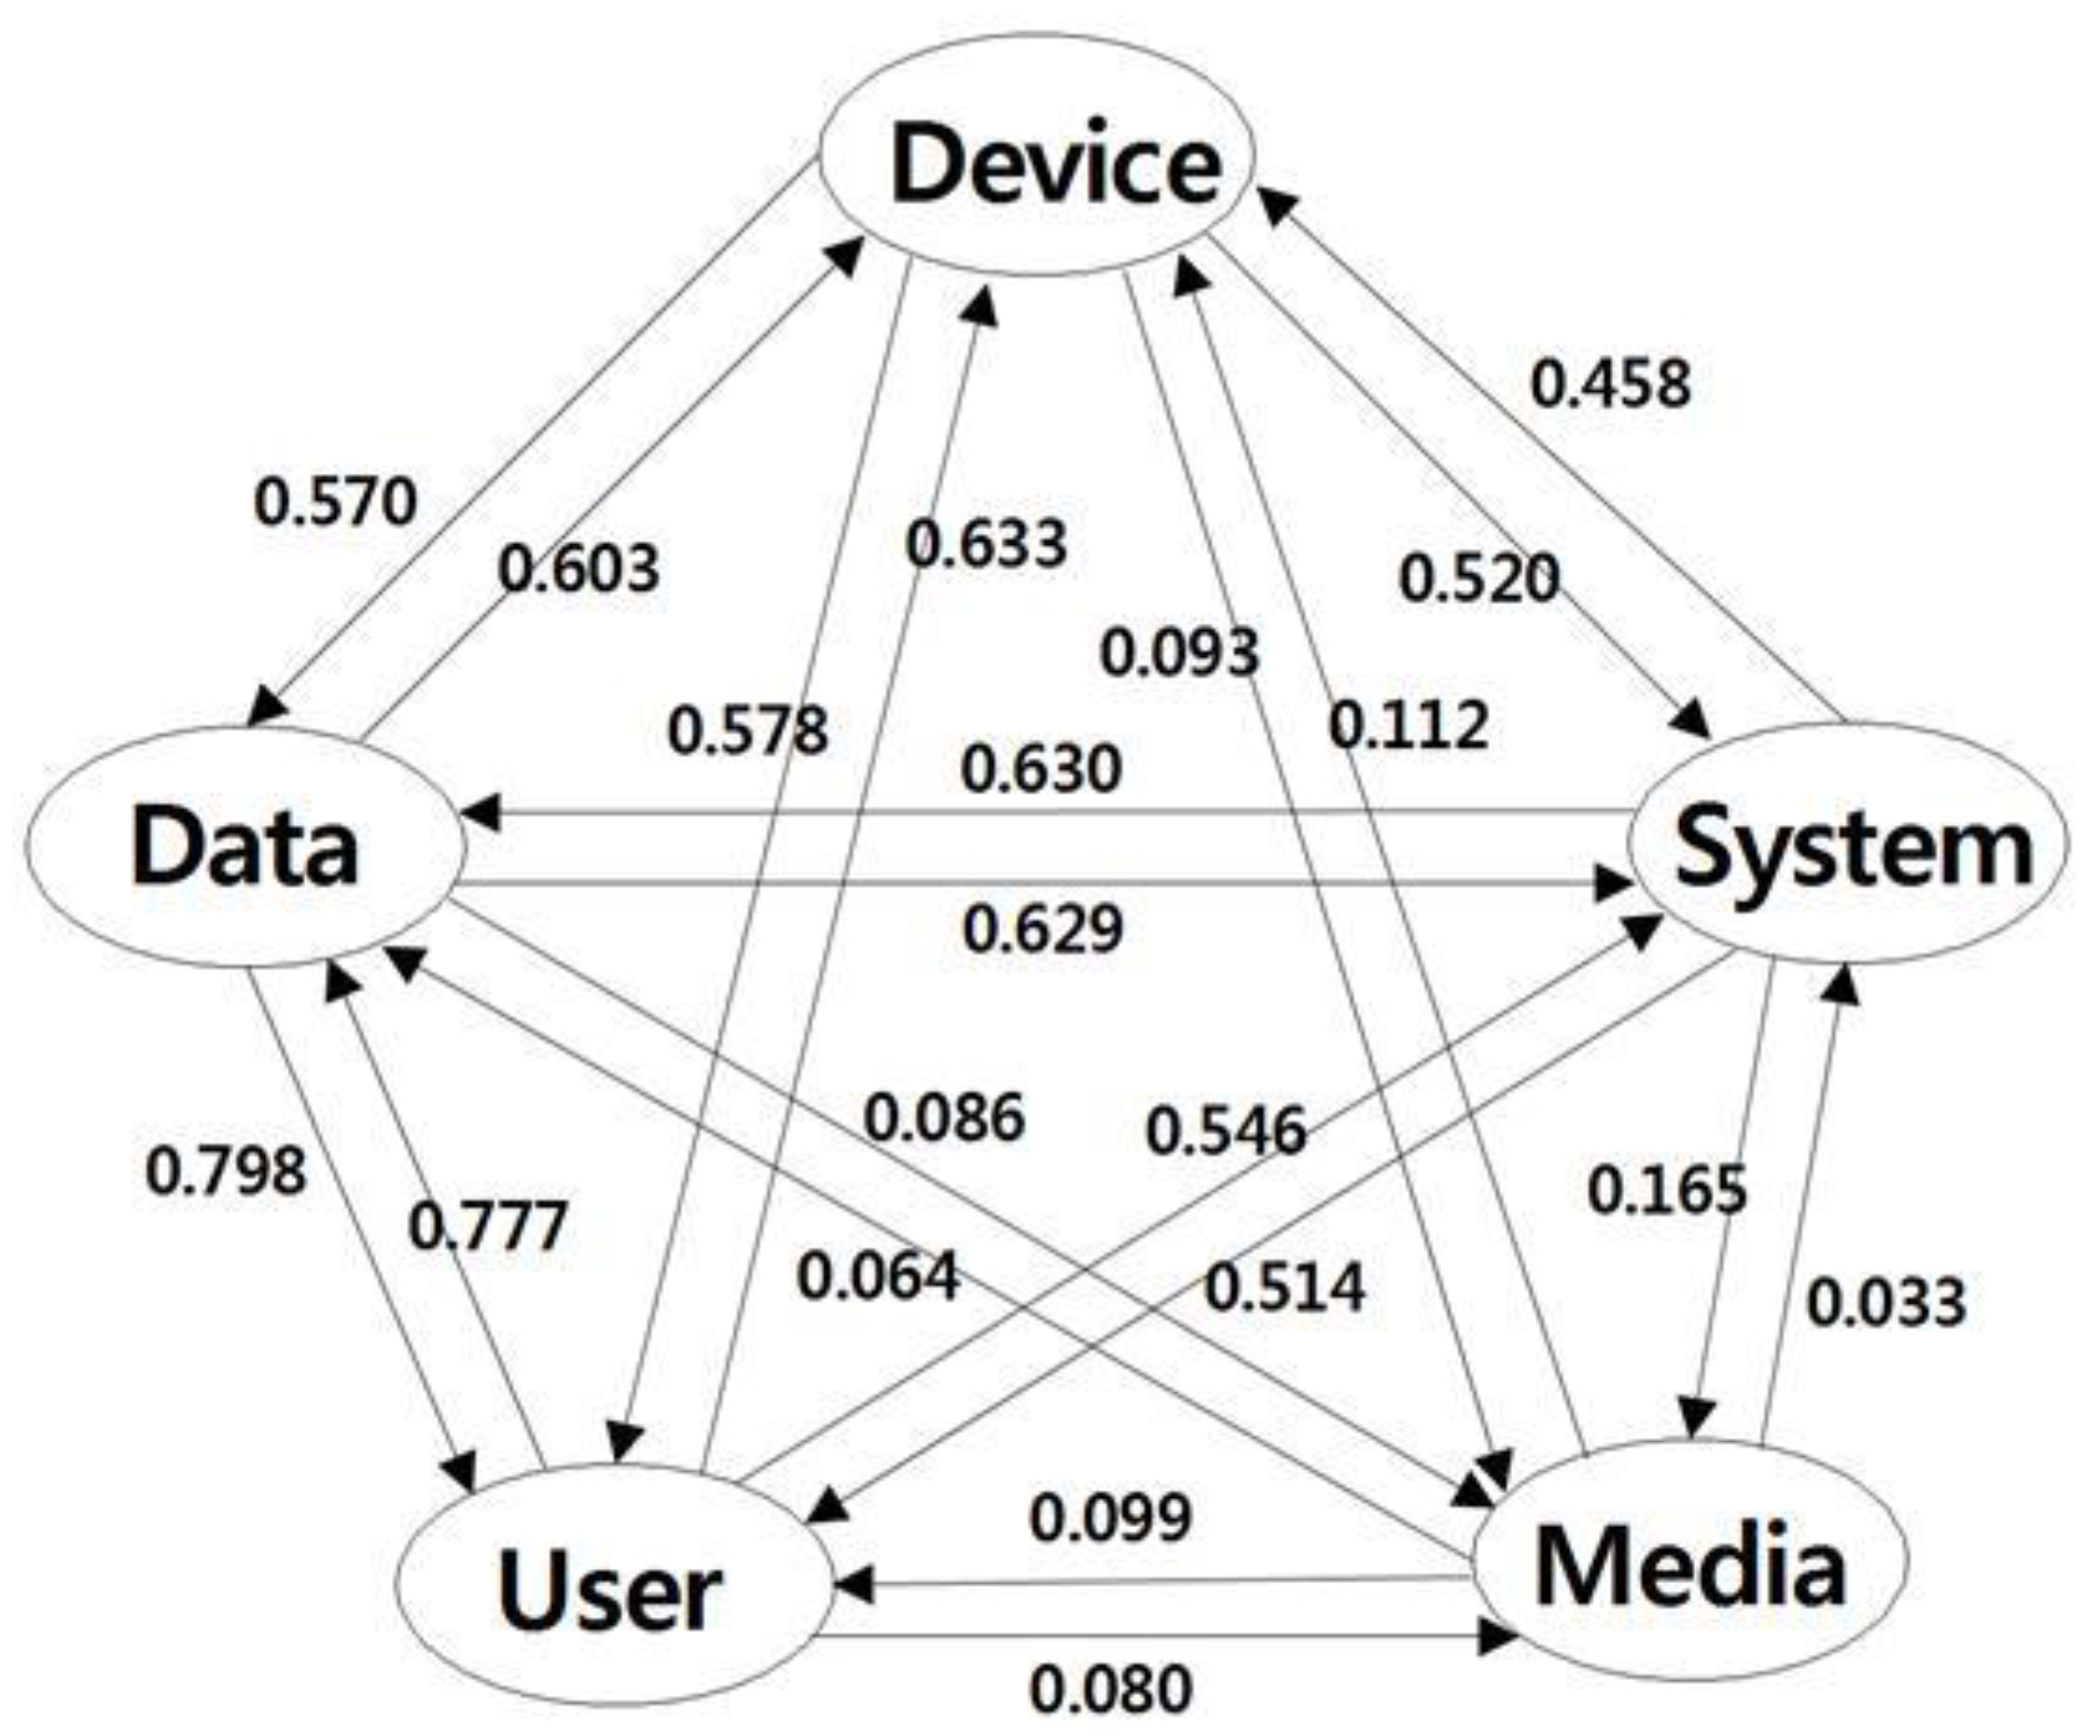
Figure 6 shows the overall picture of directional dependence of five transformed Apple keywords.
In
Figure 6, the directional dependence from Apple keyword ‘Data’ to Apple keyword ‘Device’ is greater than the directional dependence of Apple keyword ‘Device’ to Apple keyword ‘Data’. The proportion of total variation of ‘Device’ that can be explained by the copula regression of ‘Device’ on ‘Data’ is higher than the proportion of total variation of ‘Data’ that can be explained by the copula regression of ‘Data’ on ‘Device’. By following the higher directional dependencies starting from the transformed Apple keyword ‘Data’ in
Figure 6, we can derive the directional relationship among five main keywords clockwise as follows: ‘Data’ to ‘Device’, ‘Device’ to ‘System’, ‘System’ to ‘Media’, and ‘Media’ to ‘User’. This study focused on smart device technology among various technologies of Apple and carried out technology analysis. So in our experiment, we used five keywords (device, data, user, media, and system) representing the smart device technology of Apple.
Figure 6 illustrates the technological dependencies between the five patent keywords using directionality and weight values. In other words, the results of
Figure 6 can be used to identify antecedent technology required for smart device technology development, and to prioritize antecedent technology based on the size of the weight. To confirm our findings from
Figure 6, we employed the Hoff (2007) semiparametric inference for copula models via a type of rank likelihood function for the association parameters [
33]. The semiparametric inference is based on a generalization of marginal likelihood, called an extended rank likelihood, which does not depend on the univariate marginal distributions of the data. Estimation and inference for parameters of the Gaussian copula are available via a straightforward Markov Chain Monte Carlo algorithm based on Gibbs sampling. Specification of prior distributions or a parametric form for the univariate marginal distributions of the data is not necessary. By using the semiparametric Bayesian Gaussian copula estimation, we wanted to see the relationship between two keywords among five transformed Apple keywords. If we looked at the 50% quantile of correlation coefficients in
Table 3, then the posterior 50% quantile of correlation coefficient for Device×Data had 0.72 which is close to 0.603 (Data→Device), and 0.57 (Device→Data).
Similarly, the 50% quantiles of correlation coefficients in
Table 3 are close to the values in
Table 2. We can say that our results of Gaussian copula directional dependence with the beta logit model are reasonably correct. The reason for writing this conclusion is that references [
34,
35,
36,
37,
38] used an asymmetric type of Farlie-Gumbel-Morgenstern (FGM) copula in the form of the Rodriguez-Lallena and Ubeda-Flores (2004) family of copulas to study and examine the directional dependence of financial data and gene data but failed to obtain the close values of the correlation coefficients of real data [
39]. Therefore, our proposed Gaussian copula directional dependence regression with the beta logit model fitted the Apple keywords well.
5. Conclusions
To analyze the patent keyword data over time, we proposed a Gaussian copula directional dependence by using the beta logit model with an integer-valued GARCH model for marginal distributions. We tried to develop the model considering the characteristic of patent data and technology analysis which are time factor and frequency (integer) value. Using the proposed directional dependence with the highest frequency Apple data, we were interested in Apple’s technological structure and its technological innovation. The patent keywords extracted from collected patent documents issued by Apple were used in our experiments, because the keywords contain technological aspects of Apple’s developments. From this study, we found how much the target response keyword is influenced by the predictor keywords by copula modeling. Technologies of predictor keywords affect the technological developments of target response keywords. The associations between predictor and response keywords provide novel information for Apples R&D planning. By using a Gaussian copula marginal regression with the beta logit model, we also found the detailed dependence structure of Apple keywords. So, by performing these methods, this paper showed the meaningful trends and relationships among the technologies of Apple.
This paper is worthy of study from two perspectives: academic and practical. From the first academic point of view, our study presented a statistical analysis method for patent keyword analysis considering time. Next, this paper contributes to the technology management such as research and development planning, technology marketing, new product development, etc. from a practical point of view. For example,
Figure 6 in our experimental results shows that Apple’s device technology is affected by the detailed technologies of data, user, media, and system. In particular, it can be seen that data and user technologies have more impact on device technology than do media and system technologies. This is because the weight values of data and user are 0.603 and 0.633, respectively, which are relatively larger than the weight values of 0.112 and 0.458 of the media and the system. The other relationships in
Figure 6 can also be interpreted in this way. In our future study, we will develop more advanced statistical models that can use more keywords using various copula analyses, generalized linear models, and other integer valued time series models.


