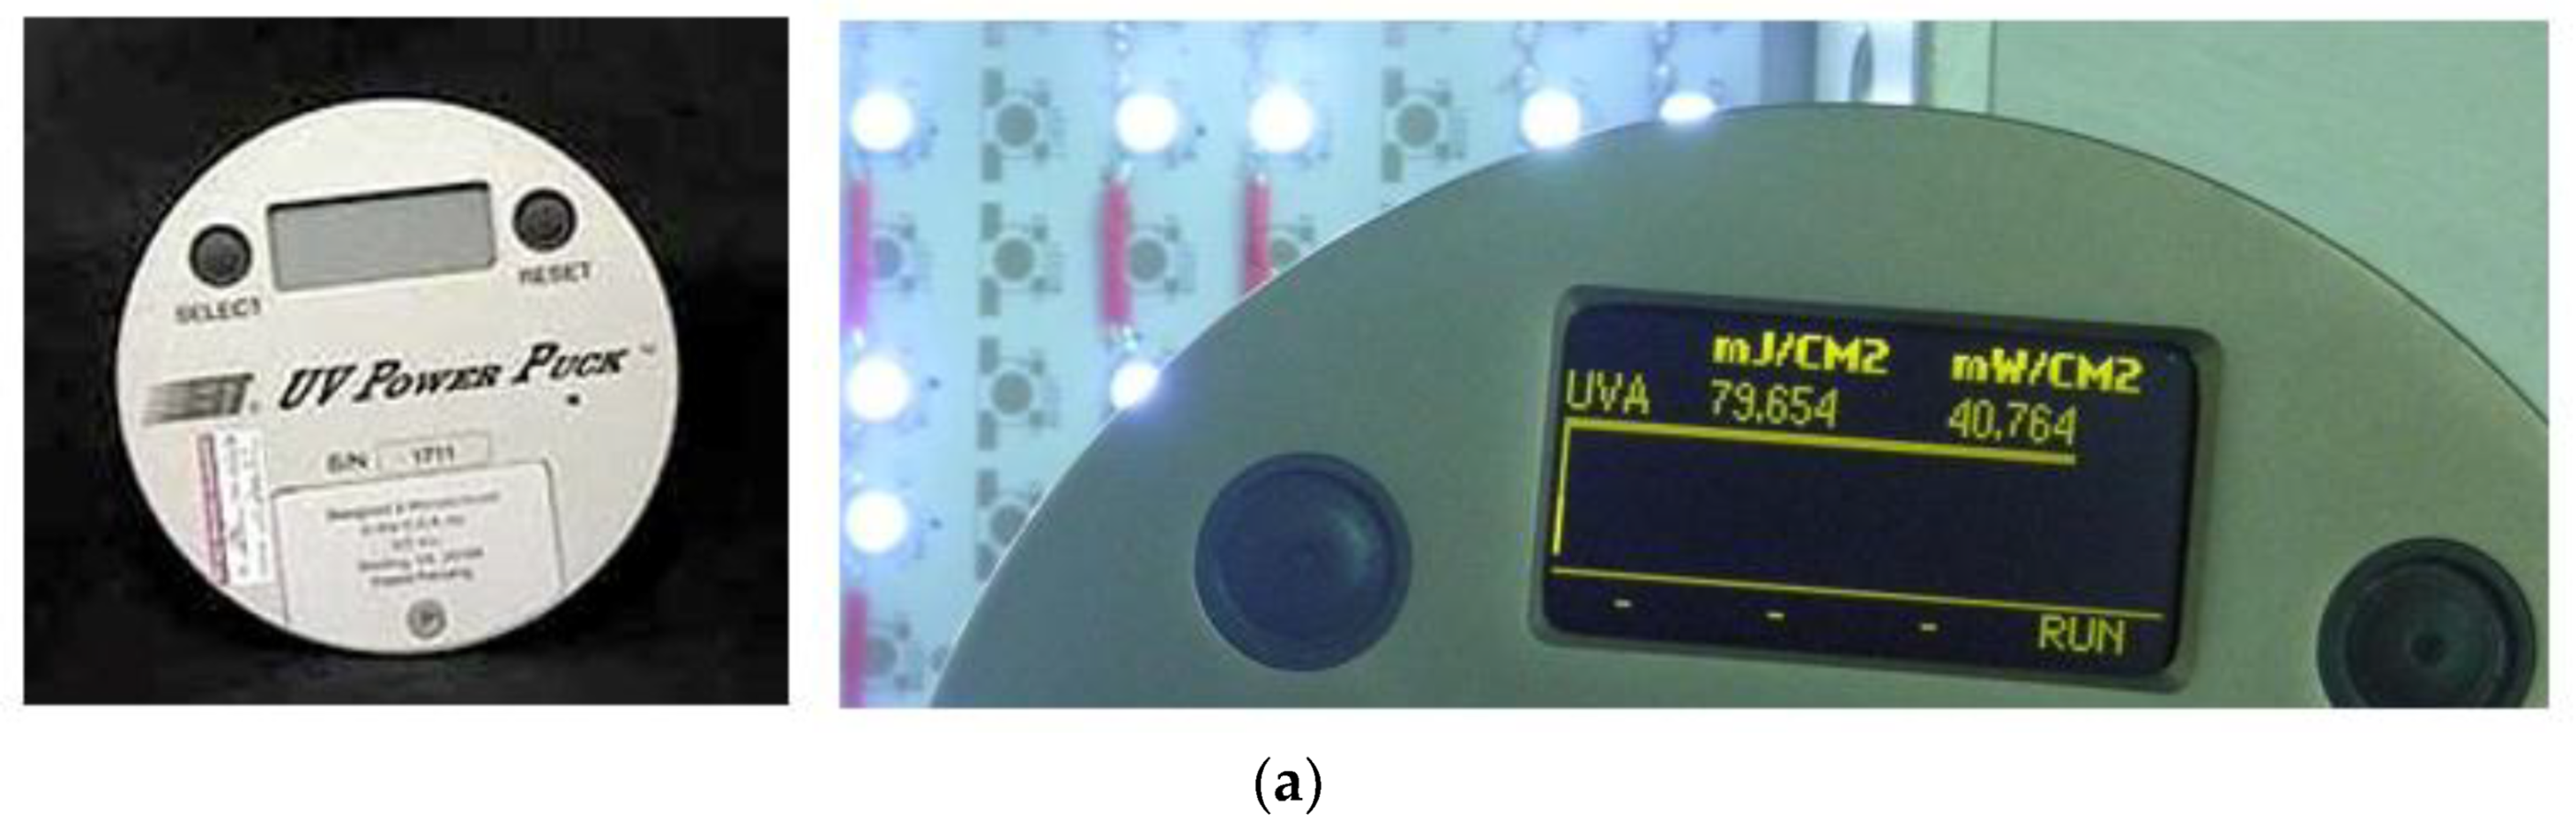
Figure 1.
Measuring instruments: (a) EIT UV Power Puck, (b) Model of type A in actual process, (c) The light source is 8 cm away from the UV intensity sensor, and the exposure product has the same placement as it.
Figure 1.
Measuring instruments: (a) EIT UV Power Puck, (b) Model of type A in actual process, (c) The light source is 8 cm away from the UV intensity sensor, and the exposure product has the same placement as it.
Figure 2.
Light-emitting diodes (LEDs) model in simulation.
Figure 2.
Light-emitting diodes (LEDs) model in simulation.
Figure 3.
LED scattering angle in simulation.
Figure 3.
LED scattering angle in simulation.
Figure 4.
The design variables S1 and S2.
Figure 4.
The design variables S1 and S2.
Figure 5.
Simulation model: (a) type A, (b) type B.
Figure 5.
Simulation model: (a) type A, (b) type B.
Figure 8.
Reflective cover model.
Figure 8.
Reflective cover model.
Figure 9.
Simulation results of each reflective cover type: (a) Results of the reflective cover type 1, (b) Results of the reflective cover type 2, (c) Results of the reflective cover type 3.
Figure 9.
Simulation results of each reflective cover type: (a) Results of the reflective cover type 1, (b) Results of the reflective cover type 2, (c) Results of the reflective cover type 3.
Figure 10.
Parameter design change model of type A.
Figure 10.
Parameter design change model of type A.
Figure 11.
LED arrangement of each type: (a) Type (a), (b) Type (b), (c) Type (c), (d) Type (d).
Figure 11.
LED arrangement of each type: (a) Type (a), (b) Type (b), (c) Type (c), (d) Type (d).
Figure 12.
Simulation results of each type: (a) Results of type (a), (b) Results of type (b), (c) Results of type (c), (d) Results of type (d).
Figure 12.
Simulation results of each type: (a) Results of type (a), (b) Results of type (b), (c) Results of type (c), (d) Results of type (d).
Figure 13.
LED arrangement of type (d) of each design change: (a) Design change (I), (b) Design change (II), (c) Design change (III), (d) Design change (IV).
Figure 13.
LED arrangement of type (d) of each design change: (a) Design change (I), (b) Design change (II), (c) Design change (III), (d) Design change (IV).
Figure 14.
Simulation results of type (d) of each design change: (a) Results of design change (I), (b) Results of design change (II), (c) Results of design change (III), (d) Results of design change (IV).
Figure 14.
Simulation results of type (d) of each design change: (a) Results of design change (I), (b) Results of design change (II), (c) Results of design change (III), (d) Results of design change (IV).
Figure 15.
Model of type C.
Figure 15.
Model of type C.
Figure 16.
Simulation results of type C: (a) Results of type C, (b) Uniformity of type C.
Figure 16.
Simulation results of type C: (a) Results of type C, (b) Uniformity of type C.
Figure 17.
The 1/8 model of type C.
Figure 17.
The 1/8 model of type C.
Figure 18.
The Influence area (I).
Figure 18.
The Influence area (I).
Figure 19.
The Influence area (II).
Figure 19.
The Influence area (II).
Figure 20.
The LED power adjustment state.
Figure 20.
The LED power adjustment state.
Figure 21.
Simulation results after adjustment LED power: (a) Results of adjustment LED power, (b) Uniformity of adjustment LED power.
Figure 21.
Simulation results after adjustment LED power: (a) Results of adjustment LED power, (b) Uniformity of adjustment LED power.
Figure 22.
The final LED arrangement.
Figure 22.
The final LED arrangement.
Figure 23.
LED power distribution: type 1.
Figure 23.
LED power distribution: type 1.
Figure 24.
Simulation results of LED power adjustment type 1.
Figure 24.
Simulation results of LED power adjustment type 1.
Figure 25.
(a) The comparison of experimental and simulation of LED power adjustment type 1, (b) The error of experimental and simulation.
Figure 25.
(a) The comparison of experimental and simulation of LED power adjustment type 1, (b) The error of experimental and simulation.
Figure 26.
LED power distribution: type 2.
Figure 26.
LED power distribution: type 2.
Figure 27.
Simulation results of LED power adjustment type 2.
Figure 27.
Simulation results of LED power adjustment type 2.
Figure 28.
(a) The comparison of experimental and simulation of LED power adjustment type 2, (b) The error of experimental and simulation.
Figure 28.
(a) The comparison of experimental and simulation of LED power adjustment type 2, (b) The error of experimental and simulation.
Figure 29.
The experimental model of LED power adjustment type 2 in the actual process.
Figure 29.
The experimental model of LED power adjustment type 2 in the actual process.
Table 1.
Technical specifications of the UV intensity sensor.
Table 1.
Technical specifications of the UV intensity sensor.
| Parameter | Range |
|---|
| temperature | 0~110° |
| induction spectrum | UVA, UVB, UVC, UAA |
| intensity | 0~100 mW/cm2 |
Table 2.
LED optical characteristics.
Table 2.
LED optical characteristics.
| Parameter | Min. | Max. |
|---|
| Radiant flux | 15 mW | 600 mW |
| Peak wavelength | 360 nm | 430 nm |
| Forward voltage | 2.8 V | 4 V |
| Viewing angle | 130° | 150° |
Table 5.
Uniformity of reflective cover type simulation results.
Table 5.
Uniformity of reflective cover type simulation results.
| Reflective Cover | Uniformity |
|---|
| type 1 | 87.84% |
| type 2 | 85.84% |
| type 3 | 90.91% |
Table 6.
Uniformity of type A of each design variables simulation results.
Table 6.
Uniformity of type A of each design variables simulation results.
| Type | Uniformity |
|---|
| type (a) | 84.86% |
| type (b) | 85.86% |
| type (c) | 87.55% |
| type (d) | 94.53% |
Table 7.
Uniformity of type (d) of each design change simulation results.
Table 7.
Uniformity of type (d) of each design change simulation results.
| Type | Uniformity |
|---|
| design change (I) | 89.31% |
| design change (II) | 88.47% |
| design change (III) | 90.34% |
| design change (IV) | 92.79% |

