Article

Small Dam Drainage with Nonwoven Geotextile after 40 Years of Exploitation

Department of Hydraulic and Sanitary Engineering, University of Life Sciences, 60-637 Poznań, Poland
*
Author to whom correspondence should be addressed.
Appl. Sci. 2019, 9(19), 4161; https://doi.org/10.3390/app9194161
Submission received: 13 August 2019 / Revised: 23 September 2019 / Accepted: 25 September 2019 / Published: 4 October 2019

Abstract

:
Synthetic materials such as nonwovens, mats and membranes have been commonly used in civil engineering for many years. The changes of geotextile characteristics in time (permeability, porosity, etc.) are poorly understood. Many authors have presented the changes in the properties of synthetic materials, mainly based on laboratory tests. The studies on geotextile samples taken from working hydraulic structures are not so many. Over 40 years, the reduction in the permeability of nonwoven geotextile was about four-fold. Probably the reason for that reduction is mechanical clogging caused by fine particles which have moved from the earth dam soil to the nonwoven geotextile. Over 40 years of operations, despite the reduction in permeability of the nonwoven geotextile, the drainage worked properly. The experiment was conducted in the field and laboratory and a two-dimensional numerical model built in software package HYDRUS (two-dimensional/three-dimensional (2D/3D)) Standard was proposed. The field measurements allow calibration and validation of the numerical model. The conducted simulations showed that at a maximum water level in the reservoir equal to 3.32 m, the water supply to the drainage is higher from upstream than from downstream. Particularly, water supply from above to the drainage is absent.

1. Introduction

Currently, synthetic materials such as nonwoven geotextiles, mats, membranes or geogrids are commonly used in many branches of construction [1]. However, initially, they were used with some fears due to limited knowledge about their changes of properties over time. After about 10 years of geotextile use, the author of Reference [2] enquired whether the great interest in these materials in geotechnical engineering is just a popular or a lasting trend. The author immediately responds to himself that they are and will be widely used as substitutes for traditional building materials and will spearhead the development of innovative techniques appropriate only for geotextiles. After several decades, we can say that we know the methods of testing the physical properties of different geosynthetics [3,4], we can determine the criteria for their selection depending on their function in construction [5,6], and failures and bad solutions provide us with additional knowledge [7,8]. However, it is important to know how the physical properties of these materials have changed over time.
Initially, many years of geosynthetics works were simulated in laboratories, repeating changes of water level with a high frequency. Młynarek et al. [9] described the changes occurring on the contact surface of the nonwoven fabric and soil, during several hours of observation reproducing the operation of the nonwoven fabric as a separation and filtration layer. The migration of the smallest particles causes a decrease of the water permeability coefficient of the nonwoven fabric and the formation of a reverse filter at the interface between the non-woven fabric and soil. As a result of the flow of water from the protected soil, particles with a diameter smaller than the pore diameters of the nonwoven fabric are carried out. Larger particles stop at the surface of the non-woven fabric, forming a reverse filter or, as the authors call it, a "bridge network". Depending on the properties of the geotextile and soil, changes in the ground-geotextile contact can follow one of three characteristics: I—the reverse filter is created and the motion of particles is stopped, II—continuous loss of protected soil particles, or III—the reverse filter is created while, simultaneously, the smallest particles flow out. The proper operation of geotextile as filtering layers requires that the processes should proceed according to the characteristics of I or II. Młynarek et al. [9] noted that due to the interaction between soil and geotextile, the most important period is the initial period of filtration when the processes of outflowing particles and stabilization take place the most intensively (in the study conditions of about 20 hours). During the operation of the geotextile as a filtering layer, due to changes occurring, we can distinguish five characteristic periods: migration of soil particles, flow of the finest particles, formation of filter/non-woven structure (filter cake), fine particle retention in geotextile (clogging), and stabilization of the protected ground. These processes usually are not linear and the duration of each of them depends on the volume flow of water flowing through the surface of geotextile Q/A (m3 s−1 m−2). However, it can be assumed that in a sufficiently long period of operation, the drainage work stabilizes [9].
Recently, it has been possible to find nonwovens research after a longer period of operation of several years. Miszkowska et al. [10,11] have presented research on the nonwoven geotextile drainage of the earth dam in Białobrzegi (side dam of the Zegrze Reservoir) after 7 and 22 years of operation. In relation to the nonwoven fabric, the water permeability coefficient decreased by 1.16 and 1.6 times respectively, after 7 and 22 years. The coefficient of water permeability of nonwoven geotextile, Kn, was still more than 10 times higher than the permeability coefficient of the protected soil, Ksoil. The reduction of the geotextile permeability results from the processes of mechanical, chemical and biological clogging. The authors have highlighted that these processes do not occur in parallel and equally over the entire surface of the material.
Changes in the filtration properties of nonwoven geotextile after 18 years are described by Veylon et al. [12]. Two types of non-woven fabric (nonwoven needle-punched and woven-strip geotextile) were used as separating and filtering layers in drainage trenches. During the exploitation period, the water permeability of nonwovens decreased about 3.8-fold. The authors explain that clogging can be caused by physical, biological and/or chemical processes. The mechanism of physical clogging is the accumulation of fine particles in the geotextile or before the geotextile filter. Biological clogging requires very specific physicochemical conditions in terms of temperature, alkalinity and the concentration of minerals and organic substances.
Lewandowski et al. [13] described changes in the filtration coefficient of nonwoven geotextile drainage of the small natural barrier in Piaski-Szczygliczka. The authors presented the results of the nonwoven geotextile test after the eighth and eleventh years of operation. During this period, the water permeability coefficient decreased almost 4-fold. The article analyzes the impact of fluctuations in the water table in the reservoir on the mechanical clogging on nonwoven geotextile.
Access to archival documentation led to the decision to continue the research on geotextile drainage of the Piaski-Szczygliczka barrage after 40 years of operation. The use of computer software in predicting seepage under an earth dam has become more popular, but as noted by Šimůnek et al. [14] and Li et al. [15], it is important that these tools should be properly calibrated and validated, especially on the basis of values measured in the field [16]. Numerical analysis using HYDRUS code can be successfully used to describe seepage under the earth dam in different cases [17]. The attempt to determine the influence of clogged nonwoven geotextile on water flow in soil using HYDRUS (two-dimensional/three-dimensional (2D/3D)) Standard is another challenge.

2. Materials and Methods

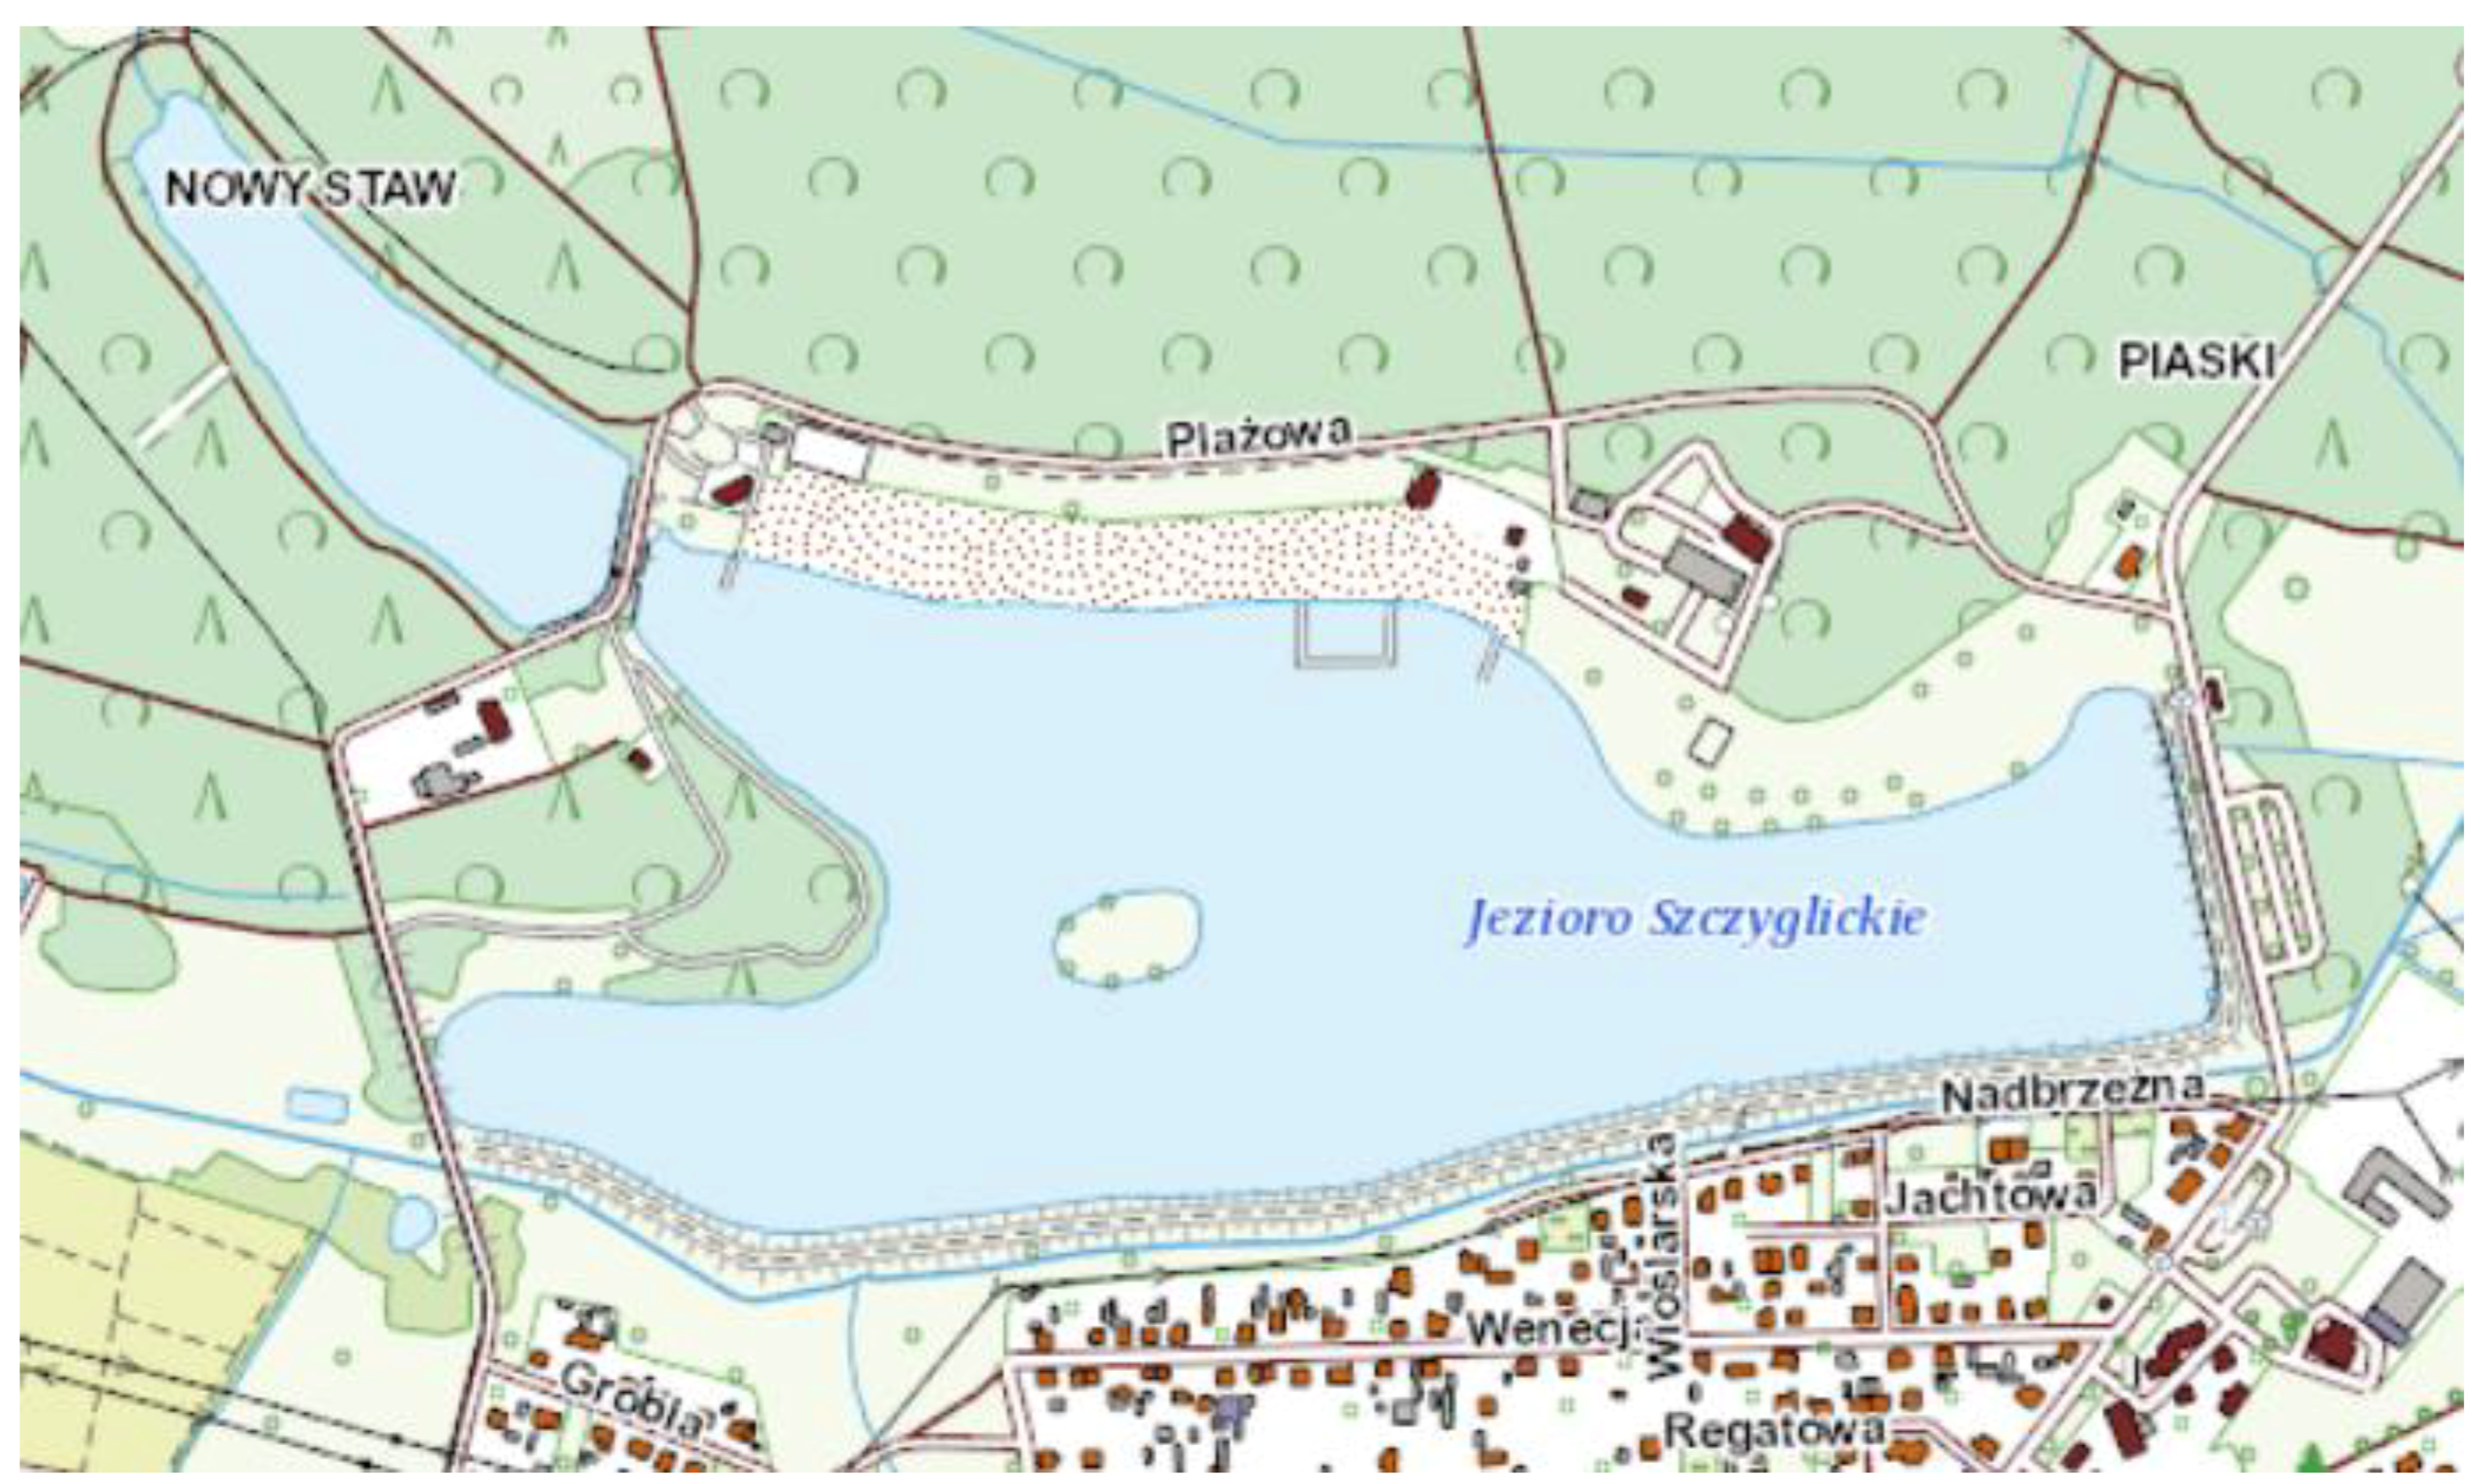
2.1. The Piaski-Szczygliczka Reservoir

The artificial water reservoir Piaski-Szczygliczka has been in use since 1977. The reservoir was created in the valley of the Ołobok river in the northern part of the city of Ostrów Wielkopolski (in the middle of Great Poland, Figure 1).
The reservoir currently has a recreational function. Characteristic for this reservoir is that it was created along the Ołobok River and its power supply was designed by capturing water from the river and pumping it with a 2.5 km pipeline. It turned out that the flows of a small river, the left-bank inflow of the Ołobok River, are sufficient to fill and supply the reservoir. The reservoir is limited by the upper dam, side dams, as well as the main dam (Figure 2). Thanks to their construction, the reservoir has the parameters shown in Figure 3. The area of the reservoir at the normal water level is 30.63 ha (length approximately 1060 m, and width equal to 386 m) and the average water depth is 2.14 m.
The main building of the damming reservoir is the front dam with a concrete discharge device, in which the following falls: a fixed overflow with a width of 1.0 m and a crown elevation of 128.0 m above sea level and a bottom outlet in the form of two steel pipelines with a diameter of 500 mm closed by wedge gate valves. The front dam with a slope of 1:2 and a crown width of 3.0 m was made of medium and fine sands with a hydraulic conductivity, Ks, about 9·10−5 m s−1.
The drainage banks have been strengthened with reinforced concrete slabs with a thickness of 0.20 m, whereas the debris turbines are sown with grass mixtures. Due to the high permeability of the soil under the reservoir, the bottom along the length of 316 m from the foot of the escarpment is caulked with 0.15 mm thickness of PVC (polyvinyl chloride). The dam’s drainage was built along the escarpment with outflow to the Ołobok River. Originally, the drainage pipes were made of ceramic filters with a diameter of 0.2 m covered by gravel. In connection with the research related to the use of nonwoven geotextiles in the construction of drainage, it was divided in half into two sections with a length of 92.5 m each—upper reconstructed used nonwoven geotextile as the reverse filter. The first one has not been rebuilt (Figure 4). The two sections were separated from each other by a control well which allowed measurement of the water outflow from the upper part of the drainage. Until 1990, this drainage was the subject of a detailed study of the employees of the Department of Water and Sanitary Engineering, University of Life Science in Poznań. During this research, some parameters, such as water levels in piezometers and in the reservoir, were measured [13].

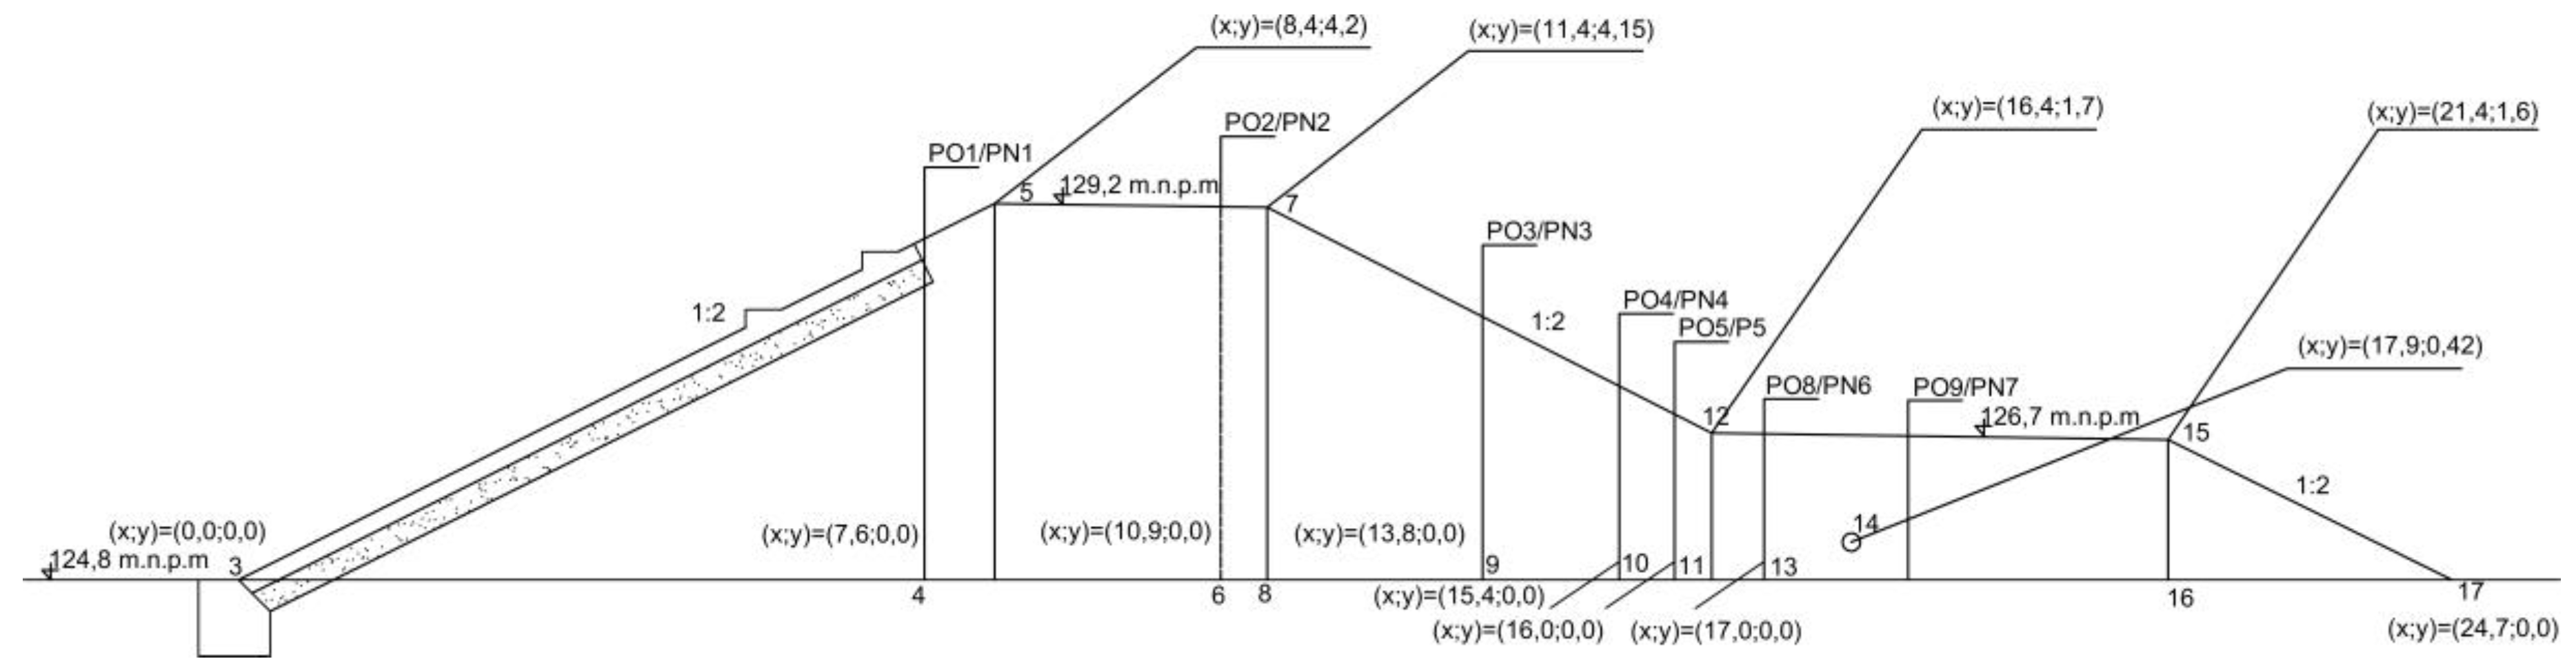
2.2. The Dam Drainage

As mentioned above, the drainage part was designed using synthetic materials–WD-3 nonwoven geotextile. A schematic diagram of the drainage cross-section is presented in Figure 4. The drainage structure consists of drainpipes (20 cm diameter) in gravel aggregate d50 = 10 mm, 10 cm thickness, surrounded by nonwoven geotextiles (Figure 5). Characteristics of nonwoven WD-3: thickness 4.21 mm, surface density 277 g m−2, apparent pore size 125 μm, water permeability coefficient kn = 1.3·10−2 m s−1 [13]. The apparent O95 pore size was determined by the dry screening method. This nonwoven fabric was produced in the technology of nonwoven needle punched from polypropylene (50%) and polyester (50%) fibers with a thickness of 36.65 μm [18]. More detailed parameters and a description of their determination methods are presented by Młynarek [3]. It should be assumed that the characteristics of individual nonwoven fabric supplies may have been slightly different. The drainage was covered with a mixture of medium and fine sands with characteristic diameters d85 = 0.50 mm and d20 = 0.20 mm.

2.3. Method

Our research was conducted in the field from which we took samples to properly calibrate and validate the numerical two-dimensional (2D) model using the HYDRUS (2D/3D) package. Use of software in water flow in porous media simulations is becoming a standard [19,20,21].
The samples of nonwoven geotextile for testing were taken on May 17, 2018. The following procedure was applied during the sampling:
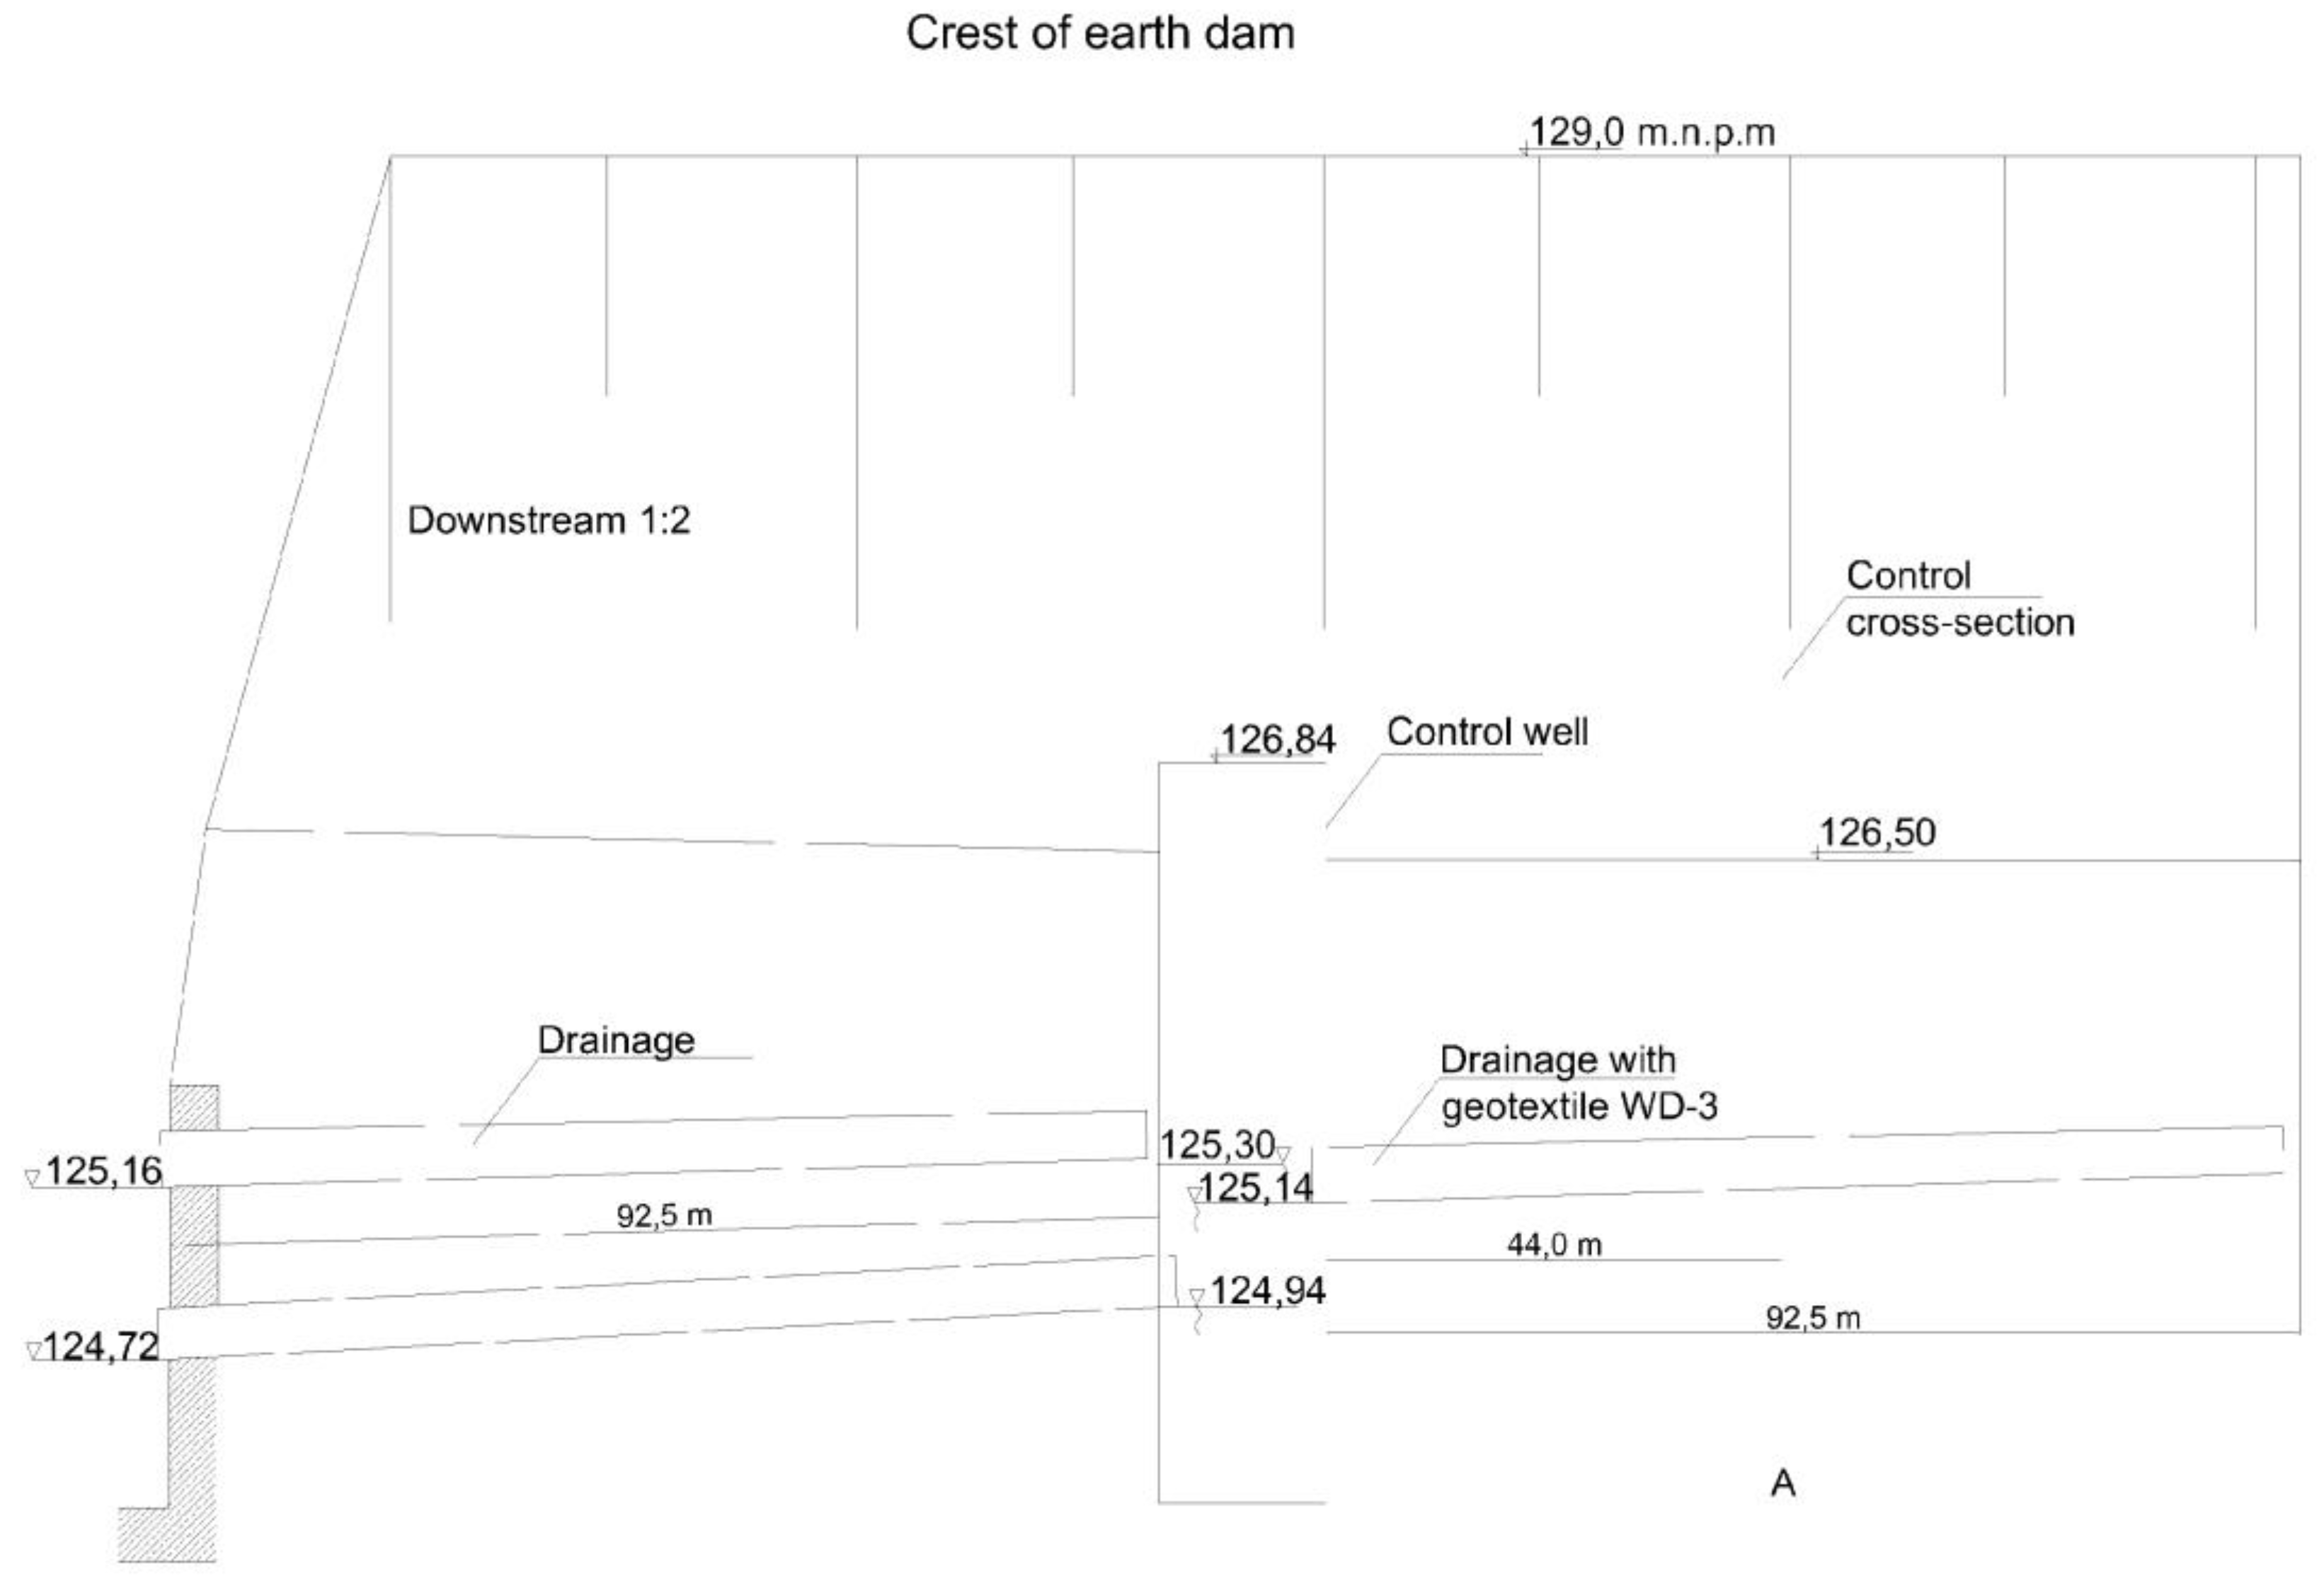
  • The sampling site was taken approximately 10 m above the well connecting the upper and lower sections of the drainage (place indicated as control cross-section in Figure 4);
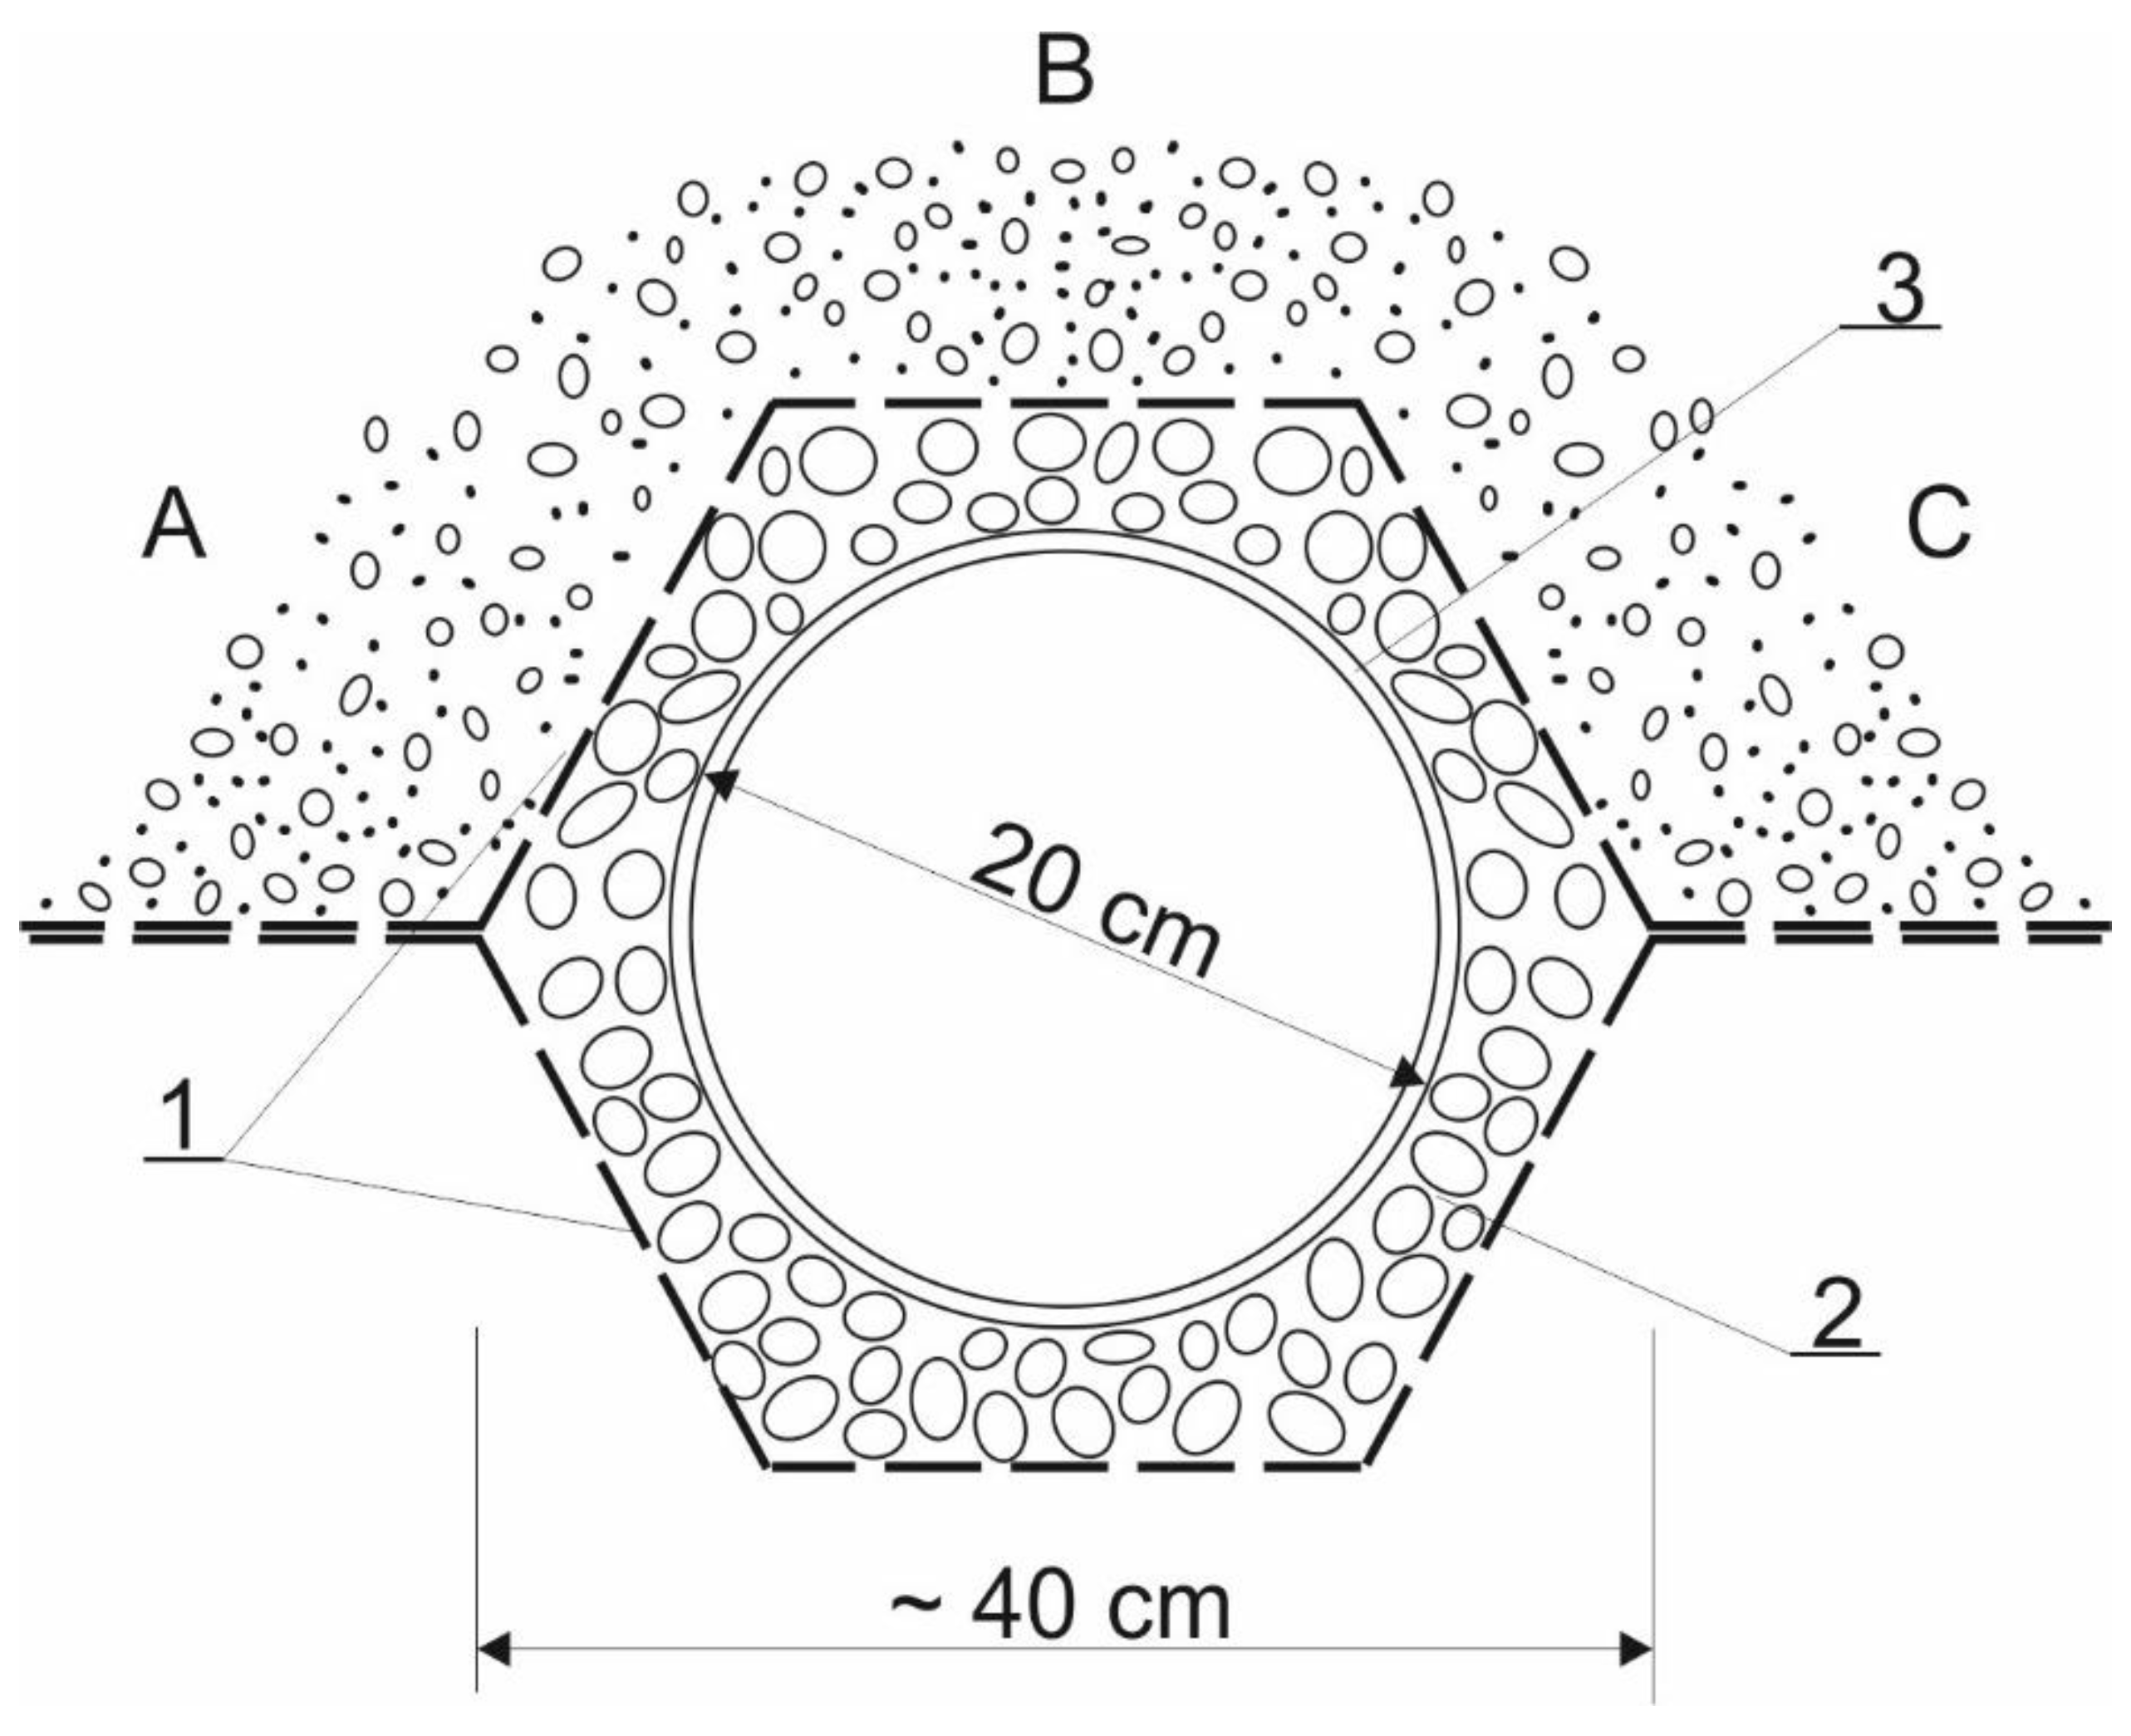
  • The samples were taken from a 2.0 m × 1.5 m excavation from a depth of 1.65 m;
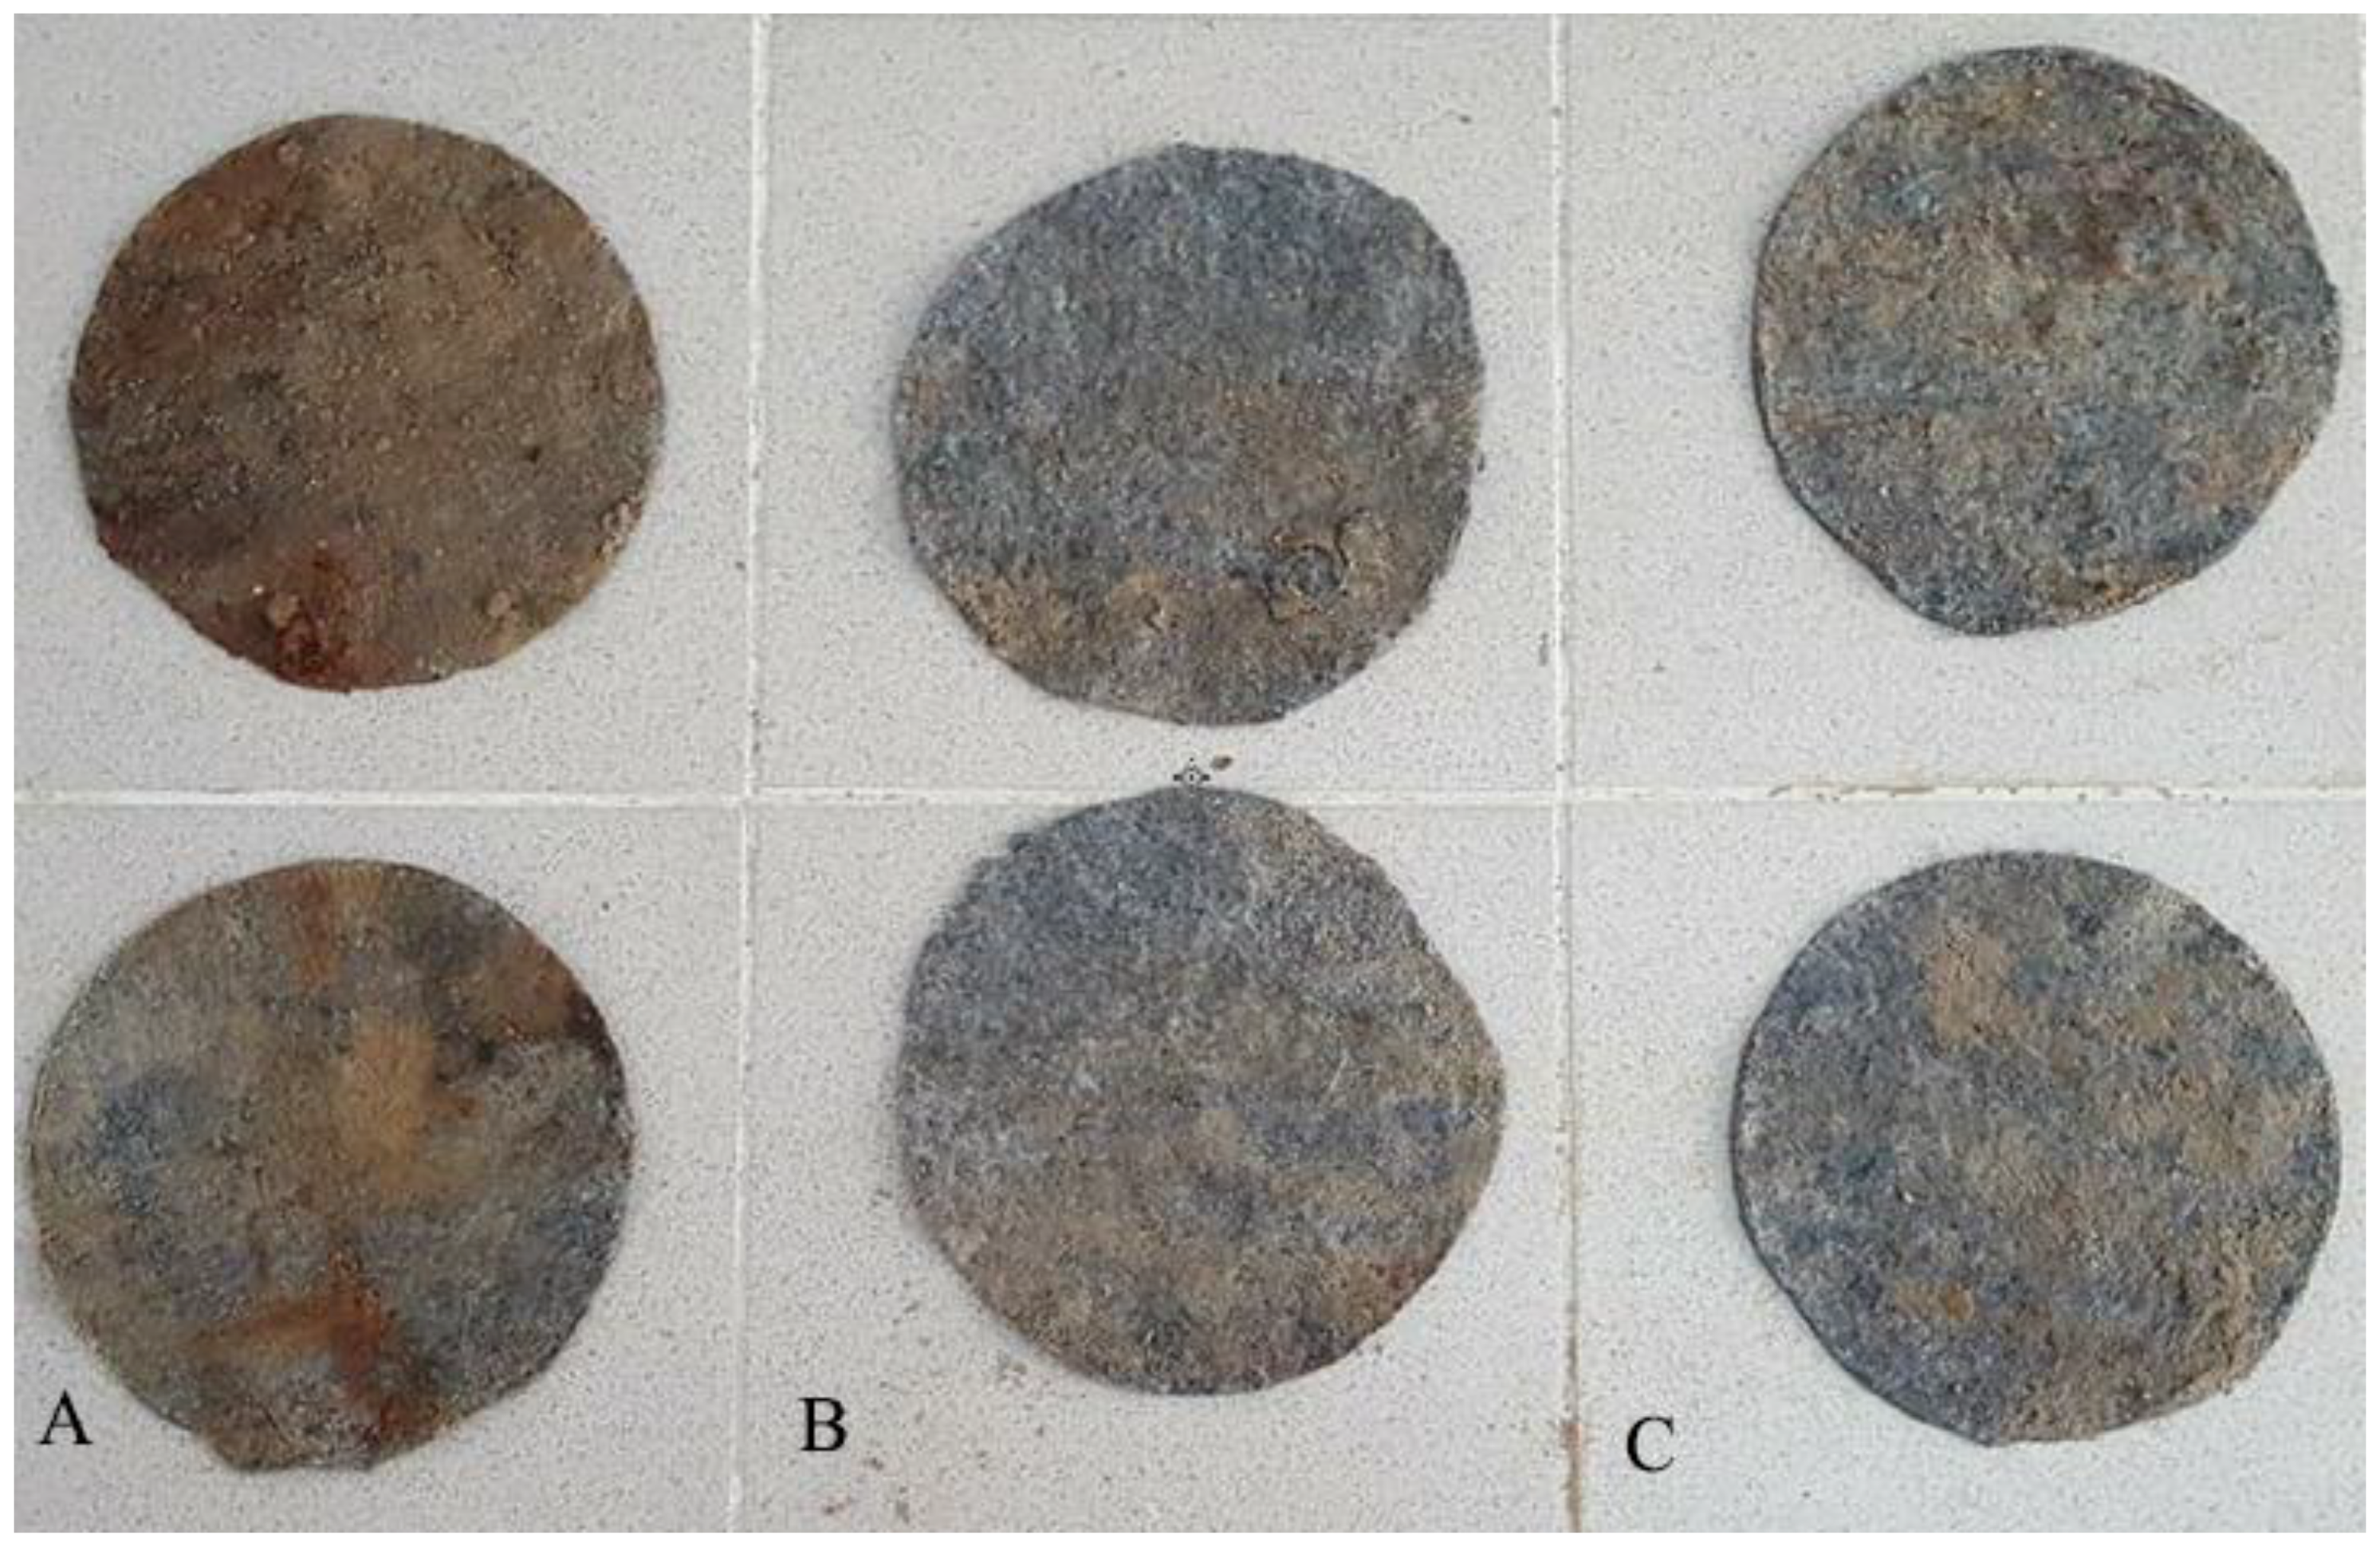
  • A fragment of nonwoven geotextile with dimensions of 1.0 m × 1.5 m was cut out, which was divided into six samples;
  • The non-woven fabric was placed in a plastic bag, which allowed the moisture of the sample to be maintained until the water permeability test was carried out;
  • The material taken was replaced by a nonwoven geotextile with similar characteristics;
  • A 10 cm layer of soil directly covering the nonwoven geotextile was removed with particular care, simultaneously collecting three soil samples for grain size analysis.
The appearance of the nonwoven geotextile surface taken from the drainage was not much different from the nonwoven fabric. However, two significant differences were observed: the nonwoven surface on the earth dam side covered a considerable amount of sand that was retained by the material fibers (the sand was not shedding), while on the nonwoven surface on the other side, there was extensive brown coloration caused by the elimination of iron trihydroxide. The side of nonwovens adjacent to the drainage was clean, without adherent grains of sand, and on the surface, permanently imprinted grains of backfill drainage were visible. From the downstream, visible spots of iron were concentrated on the curvature of the nonwoven fabric. Compared to the description of the appearance of WD-3 nonwoven fabric taken in 1987 and 1990 [13], no roots of plants or white spots of calcium carbonate were found.
The water permeability coefficient was measured using a stand prepared in accordance with PN-EN ISO 11,058 for a method with a constant hydrostatic pressure. The laboratory set consists of a vertical Plexiglas column with diameter D = 194 mm. The tested nonwoven geotextile was placed on a round plate with holes 4 mm in diameter. The volumetric flow rate in the column was measured using the substitute vessel method. To measure hydraulic losses, open piezometers connected to the Siemens SISTRANS P DS III pressure transducer were used. The reading of the piezometric pressure difference was carried out with an accuracy of 0.1 mm.
Nonwoven samples for water permeability tests were cut from the whole material taken in three zones: on the upper side of water A, on the drainage axis B and on the lower side of water C (Figure 5). Two samples from each zone were collected for water permeability tests (Figure 6).
After the water permeability tests, the nonwoven geotextile samples were dried and additional parameters, i.e., surface density and the amount and size of the sand in the nonwoven pores, were determined. All samples of nonwoven geotextile were weighed, before and after shaking. During these measurements, it was noted that soil was spilled out only from the pores opened from the external surface of the nonwoven geotextile.

2.4. Numerical Calculations

In this research, we used the well-known software HYDRUS (2D/3D) Standard to predict pressure heads in the earth dam [16]. This program is a computer package that allows one to simulate the flow of water and pollution, mass and heat [22] through saturated and unsaturated porous media [23]. The two-dimensional model was built with a mixed flow regime, using the finite element method. Water flow under unsaturated conditions was calculated in the presented 2D model using the Richards equation [24]. The simulations were made in the schematic model presented in Figure 7.
The second kind of boundary condition qn = 0 (no flow) was assumed on the base of the aquifer layer. A drainage pipe along the air-side embankment from the level of the bench to the end of the ditch a seepage face condition was used. In this case, the length of the seepage face is not known a priori, and its length is determined iteratively by the software. In the HYDRUS (2D/3D) software it is assumed that the pressure head is constant and equal to zero along the seepage face. The boundary condition of type I (marked in red) defined the constant maximum water level (3.32 m) in the reservoir equilibrium from the lowest located nodal point. Similarly, the initial condition, defined for the entire seepage area, was established using the hydrostatic pressure equilibrium from the lowest located nodal point at the bottom, equal to 8.7 m. Soil parameters in Table 1 were estimated using Rosetta software [25] based on textural and literature data [26].
Calculations were performed with a varying time step in the range of 1 · 10−5 to 5 days. The model was run for 30 days.
To simulate clogged nonwoven geotextile located around the gravel and sand near the drainage pipe, we adopted the following assumptions, presented in Figure 8:
  • The nonwoven geotextile permeability was adopted in accordance with the measurement from the sample taken,
  • The permeability of nonwoven geotextile lying below the drainage pipe was taken similarly to geotextile A. This assumption was made because the research should be conducted in future and taking a sample below the drain would cause a disturbance in the drainage pipe. The geotextile sample can only be taken without distribution above a drainage pipe.

3. Results and Discussion.

The water permeability coefficient of geotextile kn according to the Darcy formula was determined for each sample tested using all measurements (N = 9 repetitions). The results of the measurements are presented in Table 2.
The research was conducted from 1987 and confirmed changes in permeability of nonwoven geotextile since that time, which was the highest in the first 10 years of drainage work and fell by about 6% every year during this period. The changes of permeability in the nonwoven geotextile over time are presented in Figure 9. The lowest permeability coefficient value was noted in nonwoven geotextile located in zone A.
Relative changes of nonwoven geotextile permeability over time based on our own research and that by other authors are shown in Figure 10. The value of relative permeability except results presented by Mieszkowska and Koda [11] after 21 years of operations are convergent and presented a steady fall of nonwoven permeability. In our research, the permeability coefficient was measured after 8, 11 and 41 years of drainage operations. The decrease of this parameter was about 0.6. 0.26 and 0.22 times the value of the permeability coefficient ((kn)0) of clean nonwoven geotextile, respectively.
We observed the largest reduction of permeability during the first eleven years. The next thirty years of drainage work did not change the permeability so rapidly. The mechanical clogging phenomena of the nonwoven geotextile physically changed properties only with the flow of filtering water in the direction from the protected soil to the drainage. The results are presented in Table 3.
The area density values of all measured samples were much higher than those of clean nonwoven geotextile (277 g m−2). The highest value of the area density was obtained for the sample from the A zone and even after shaking it was almost double.
Probably, the reason for nonwoven geotextile permeability decreasing was mechanical clogging caused by fine particles of sand moved by ground water flow. Confirmation of the above is the grain size distributions curve of soil held in porous nonwoven geotextile. In Figure 11, sample A contains more fine particles than samples B and C, which explains the low permeability of nonwoven geotextile from upstream.
The measurements also included a 10 cm layer of soil directly covering the nonwoven geotextile. The visible differences between three soil samples around the drainage (in zones A, B, and C) are presented in Figure 12. In sample A, the iron trihydroxide is not visible.
Additionally, from the above-presented soils, the grain size analysis was performed. The results are shown in Figure 13. Again, the sample marked as A is quite different from the others. It has fewer fine particles which are found in nonwoven geotextile WD-3. Characteristic diameter d85 and d95 of soil A were changed from 0.50 mm to 1.25 mm and from 1.0 to 4.0 mm, respectively.
The changes of grain size distributions near nonwoven geotextile described above are associated with formulation of filter cake (Figure 14), as described by other authors [9,12,27].
The application of HYDRUS (2D/3D) software allows one to calculate and present the piezometric pressure (Figure 15). The simulations can be presented in any time step. The calculation results can show inter alia water leaking at different levels of damming.
Conducted simulations show that seepage velocity around drainage is non-uniformly distributed. We saw the maximum value of velocity in the bottom part of the drainage and it is more than two times higher than the value of earth dam soil, which can be dangerous [28]. Intensive internal erosion with migrations of fines particles can lead to internal cracking. The highest value of seepage velocity was observed in the lowest part of the drainage and was equal to about 17 m/day. In the upper part of the drainage, the seepage velocity was less than 0.00003 m/day (Figure 16).

4. Conclusions

The conducted measurements both from the field tests and calculations using HYDRUS (2D/3D) software allow one to formulate the following conclusions:
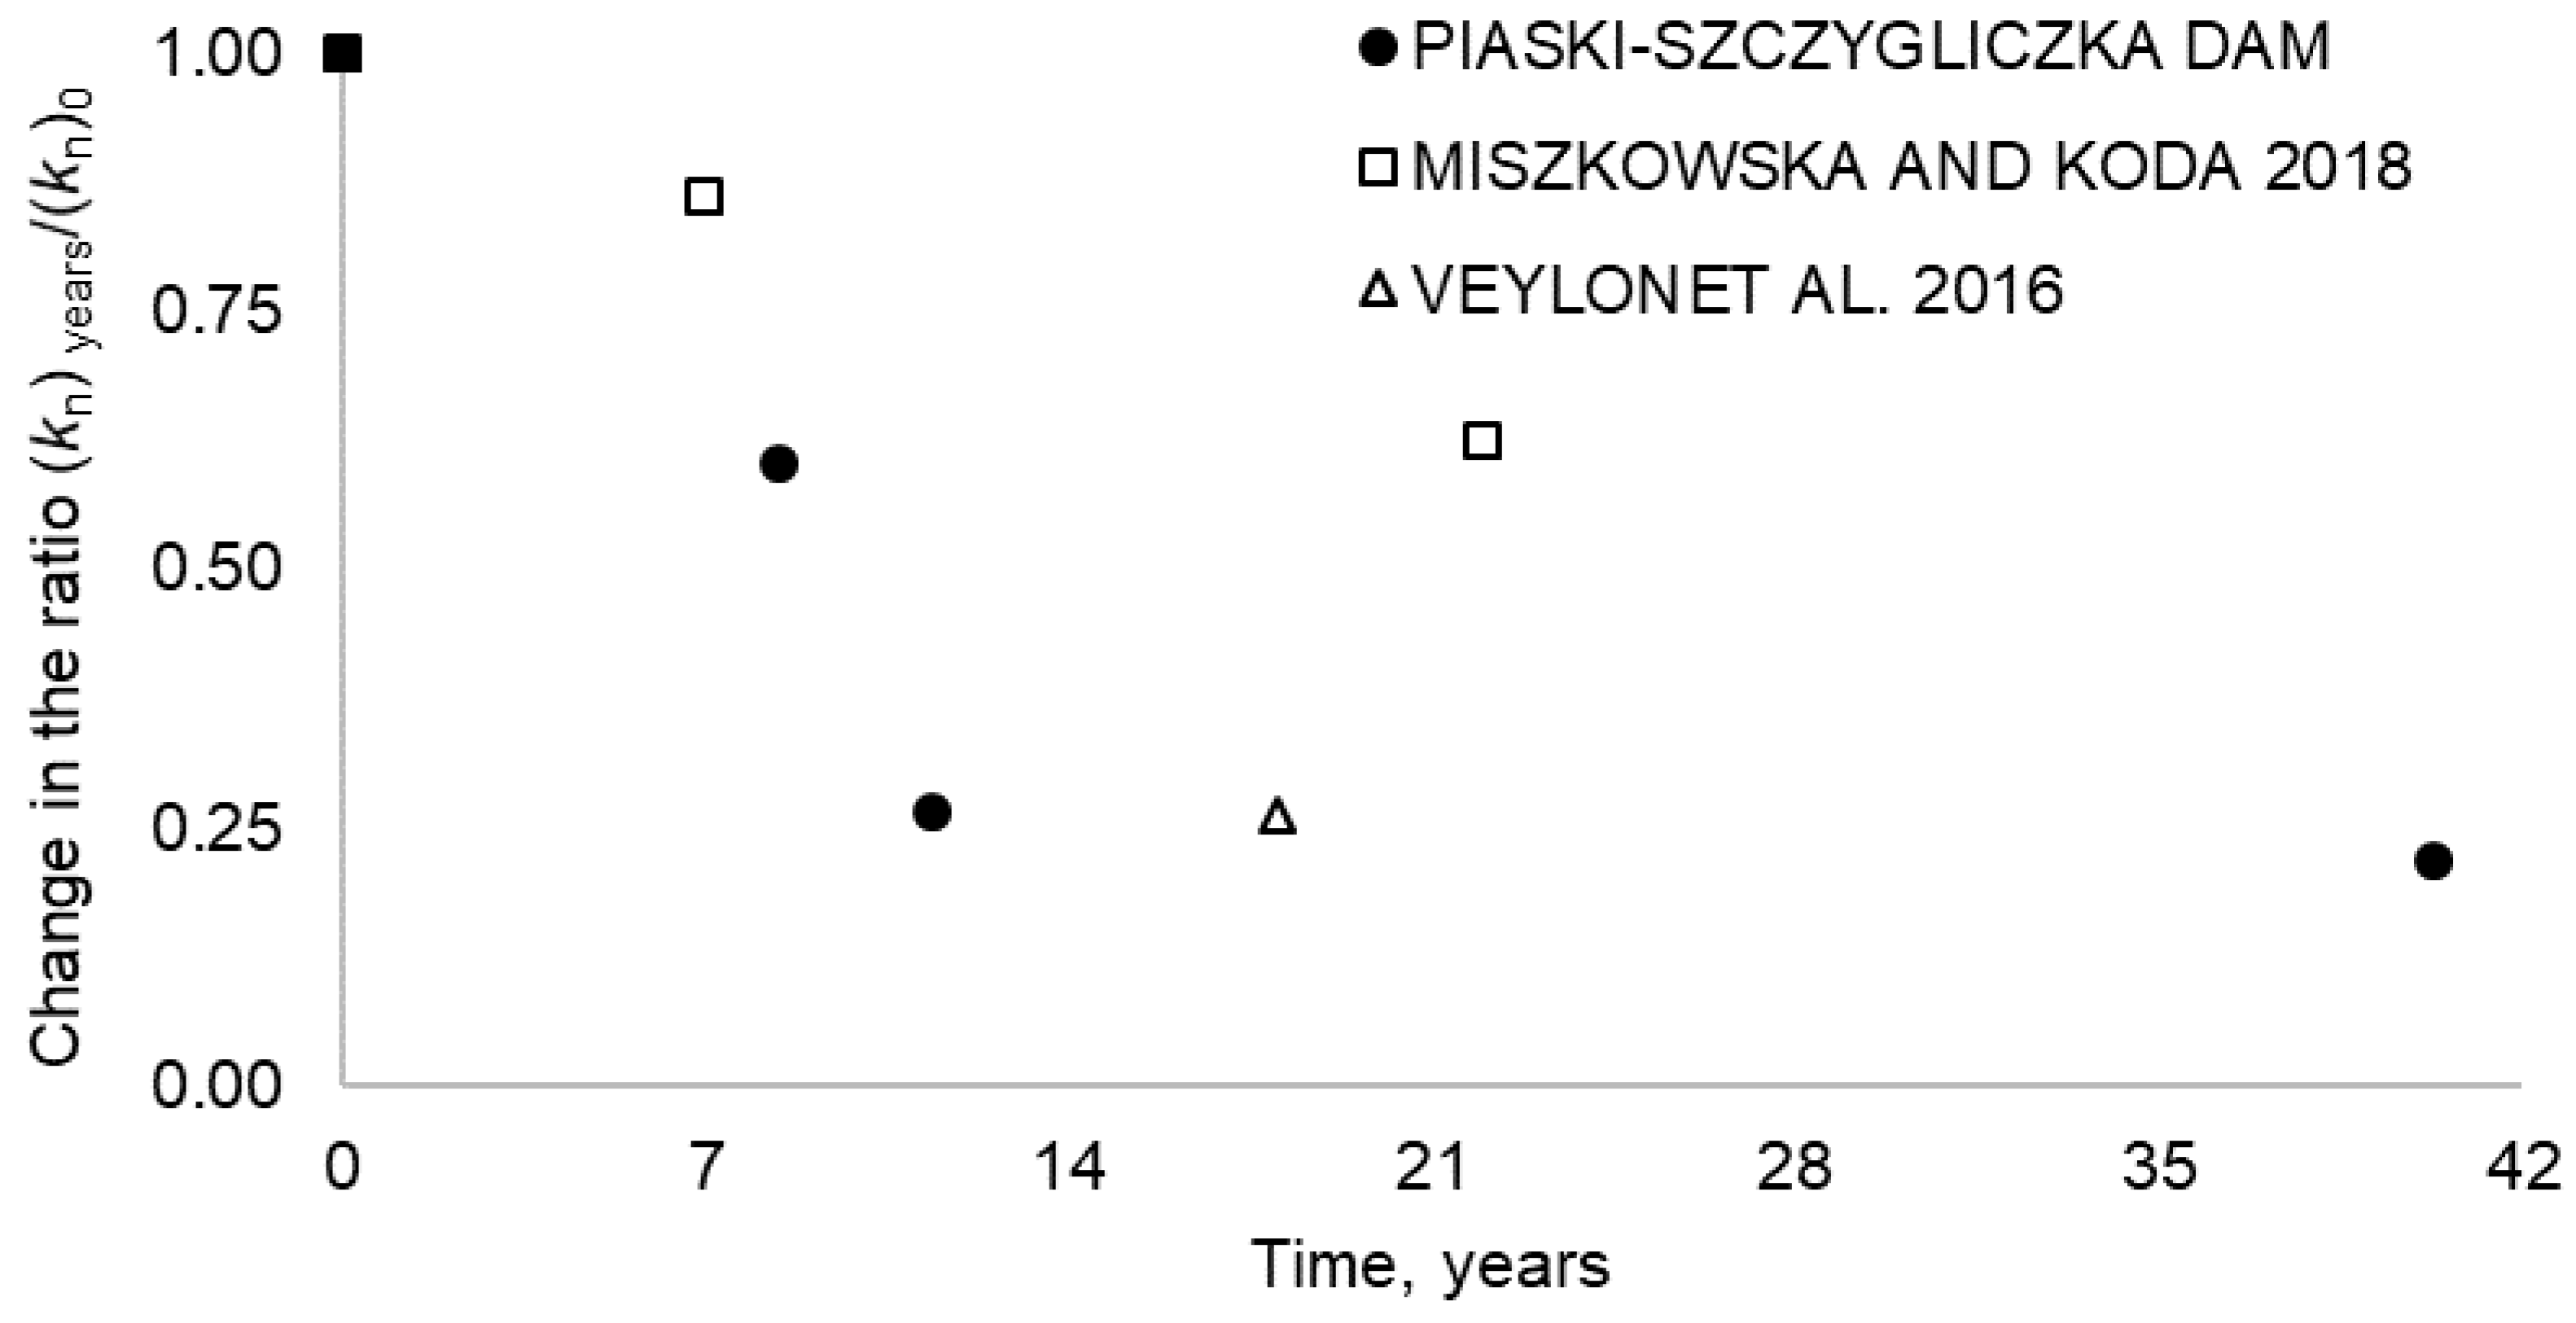
  • The drainage with nonwoven geotextile after 40 years of operations still works properly. During this time, the permeability coefficient was reduced more than four-fold, but it is still many times higher (more than 18 times) than the permeability coefficient of earth dam soil.
  • Both our own research and that of other authors indicate that a significant change in permeability (reduction of it, about from three to four times) of nonwoven geotextile comes after the first 10 years of drainage work. Additionally, with the determination coefficient equal to about R2 = 0.75, it can be concluded that the permeability of nonwoven geotextile is reduced by about 6% per year of operation.
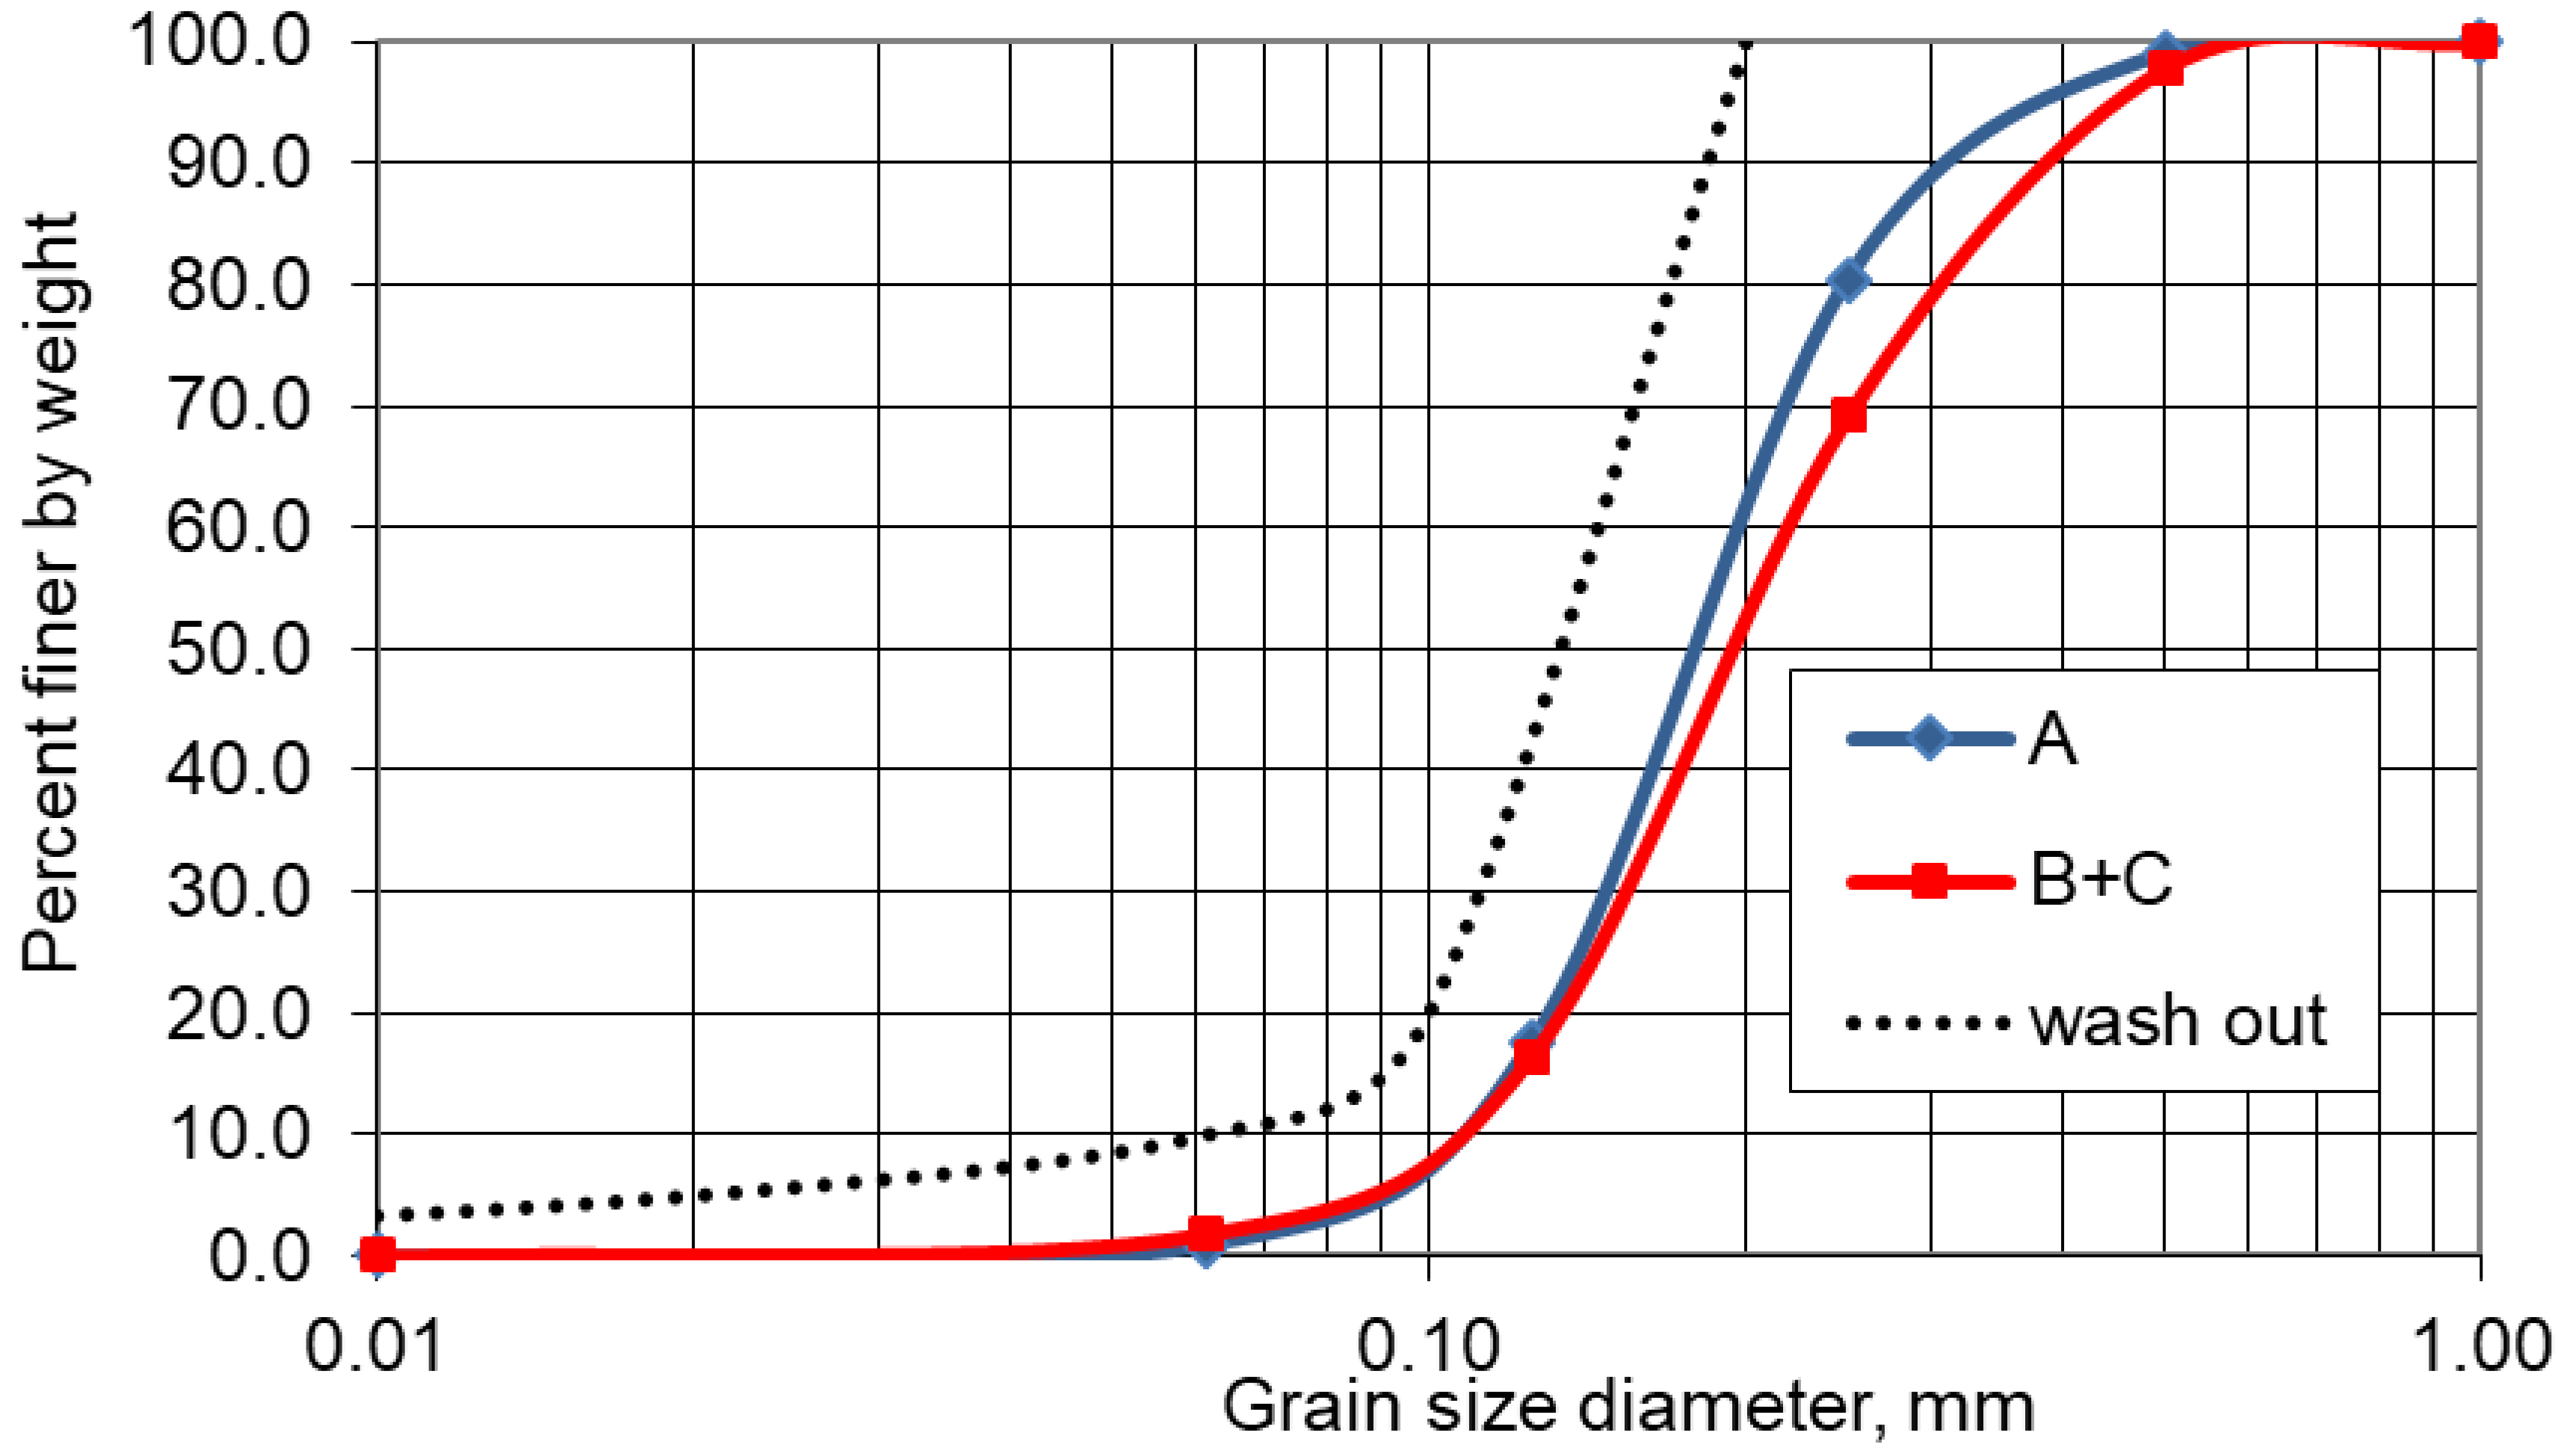
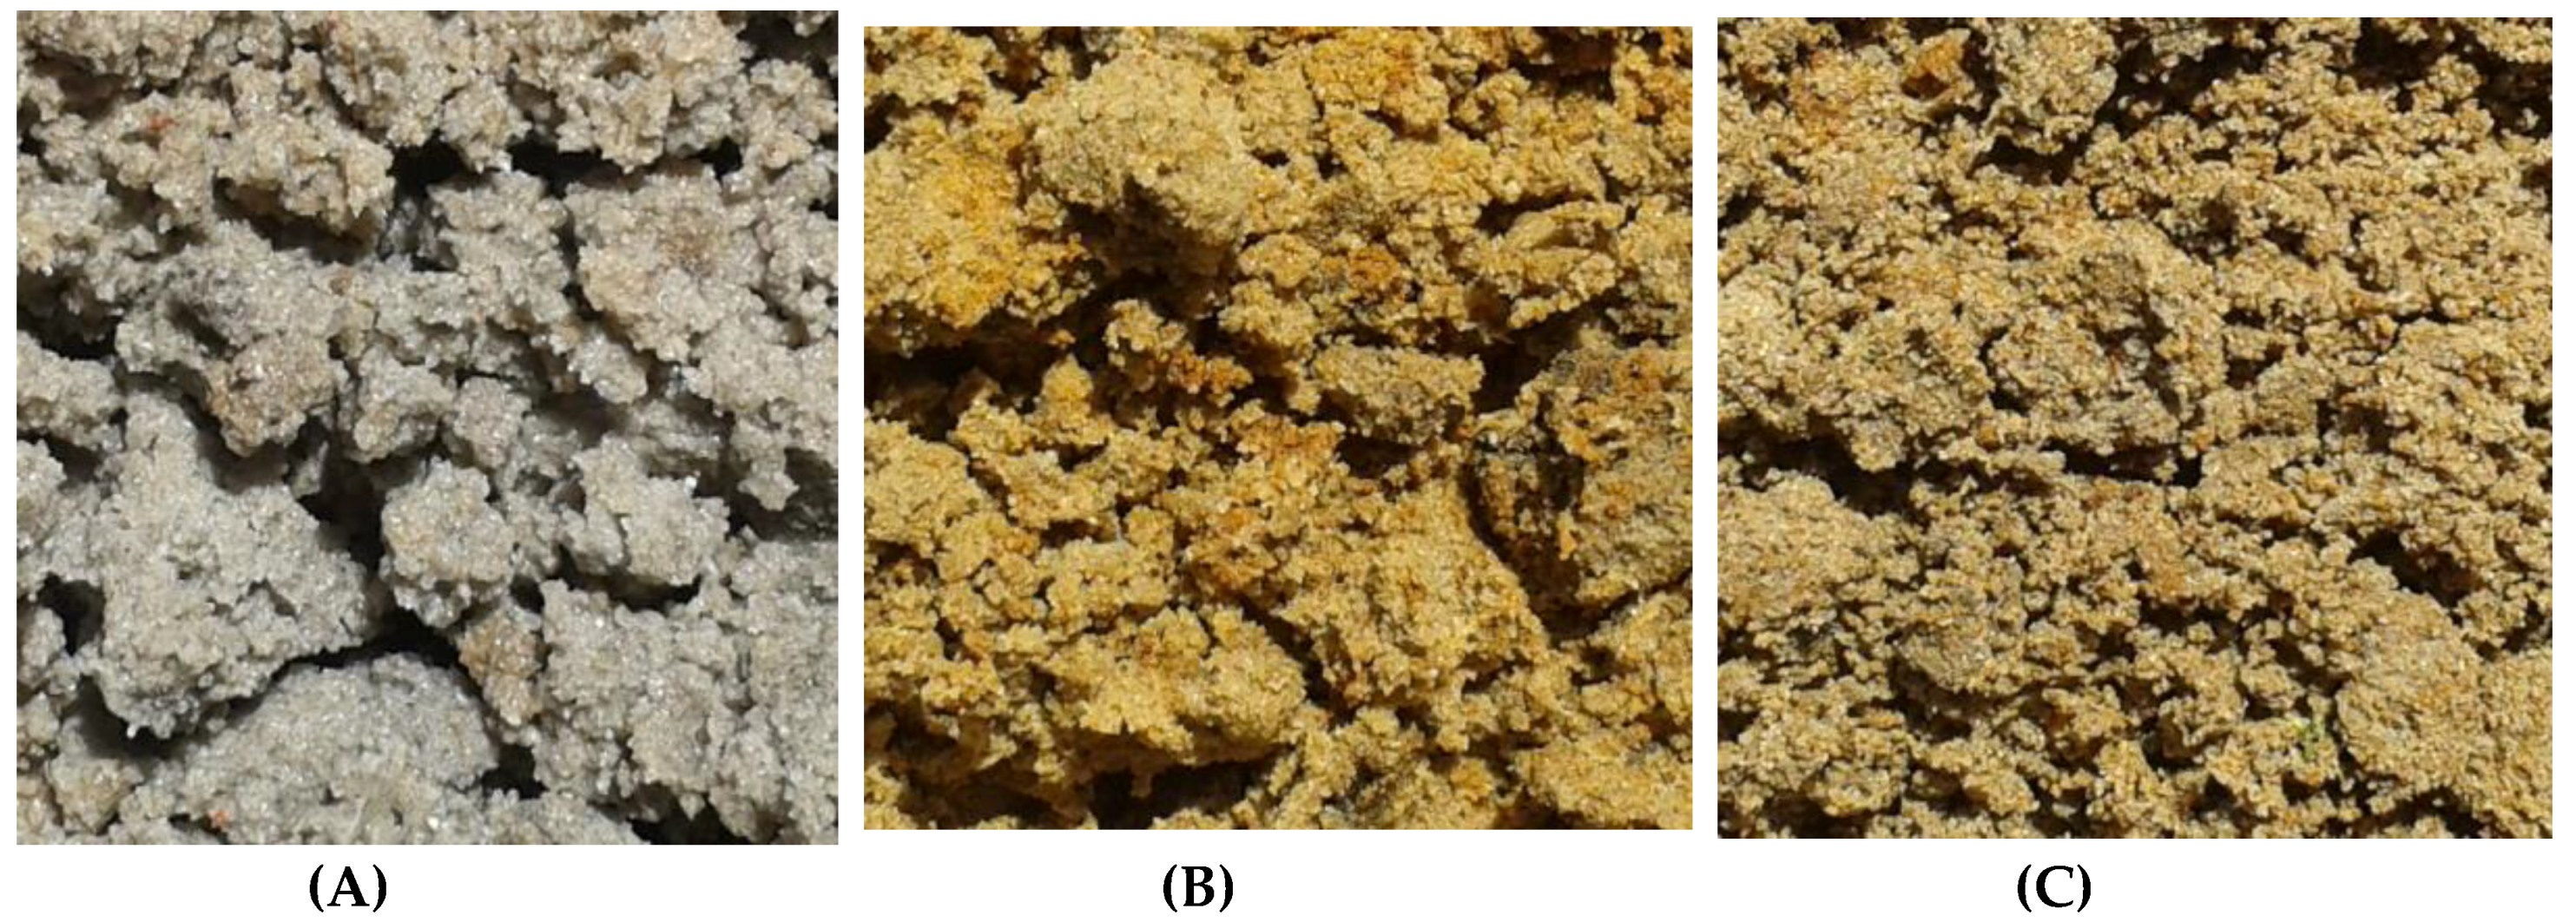
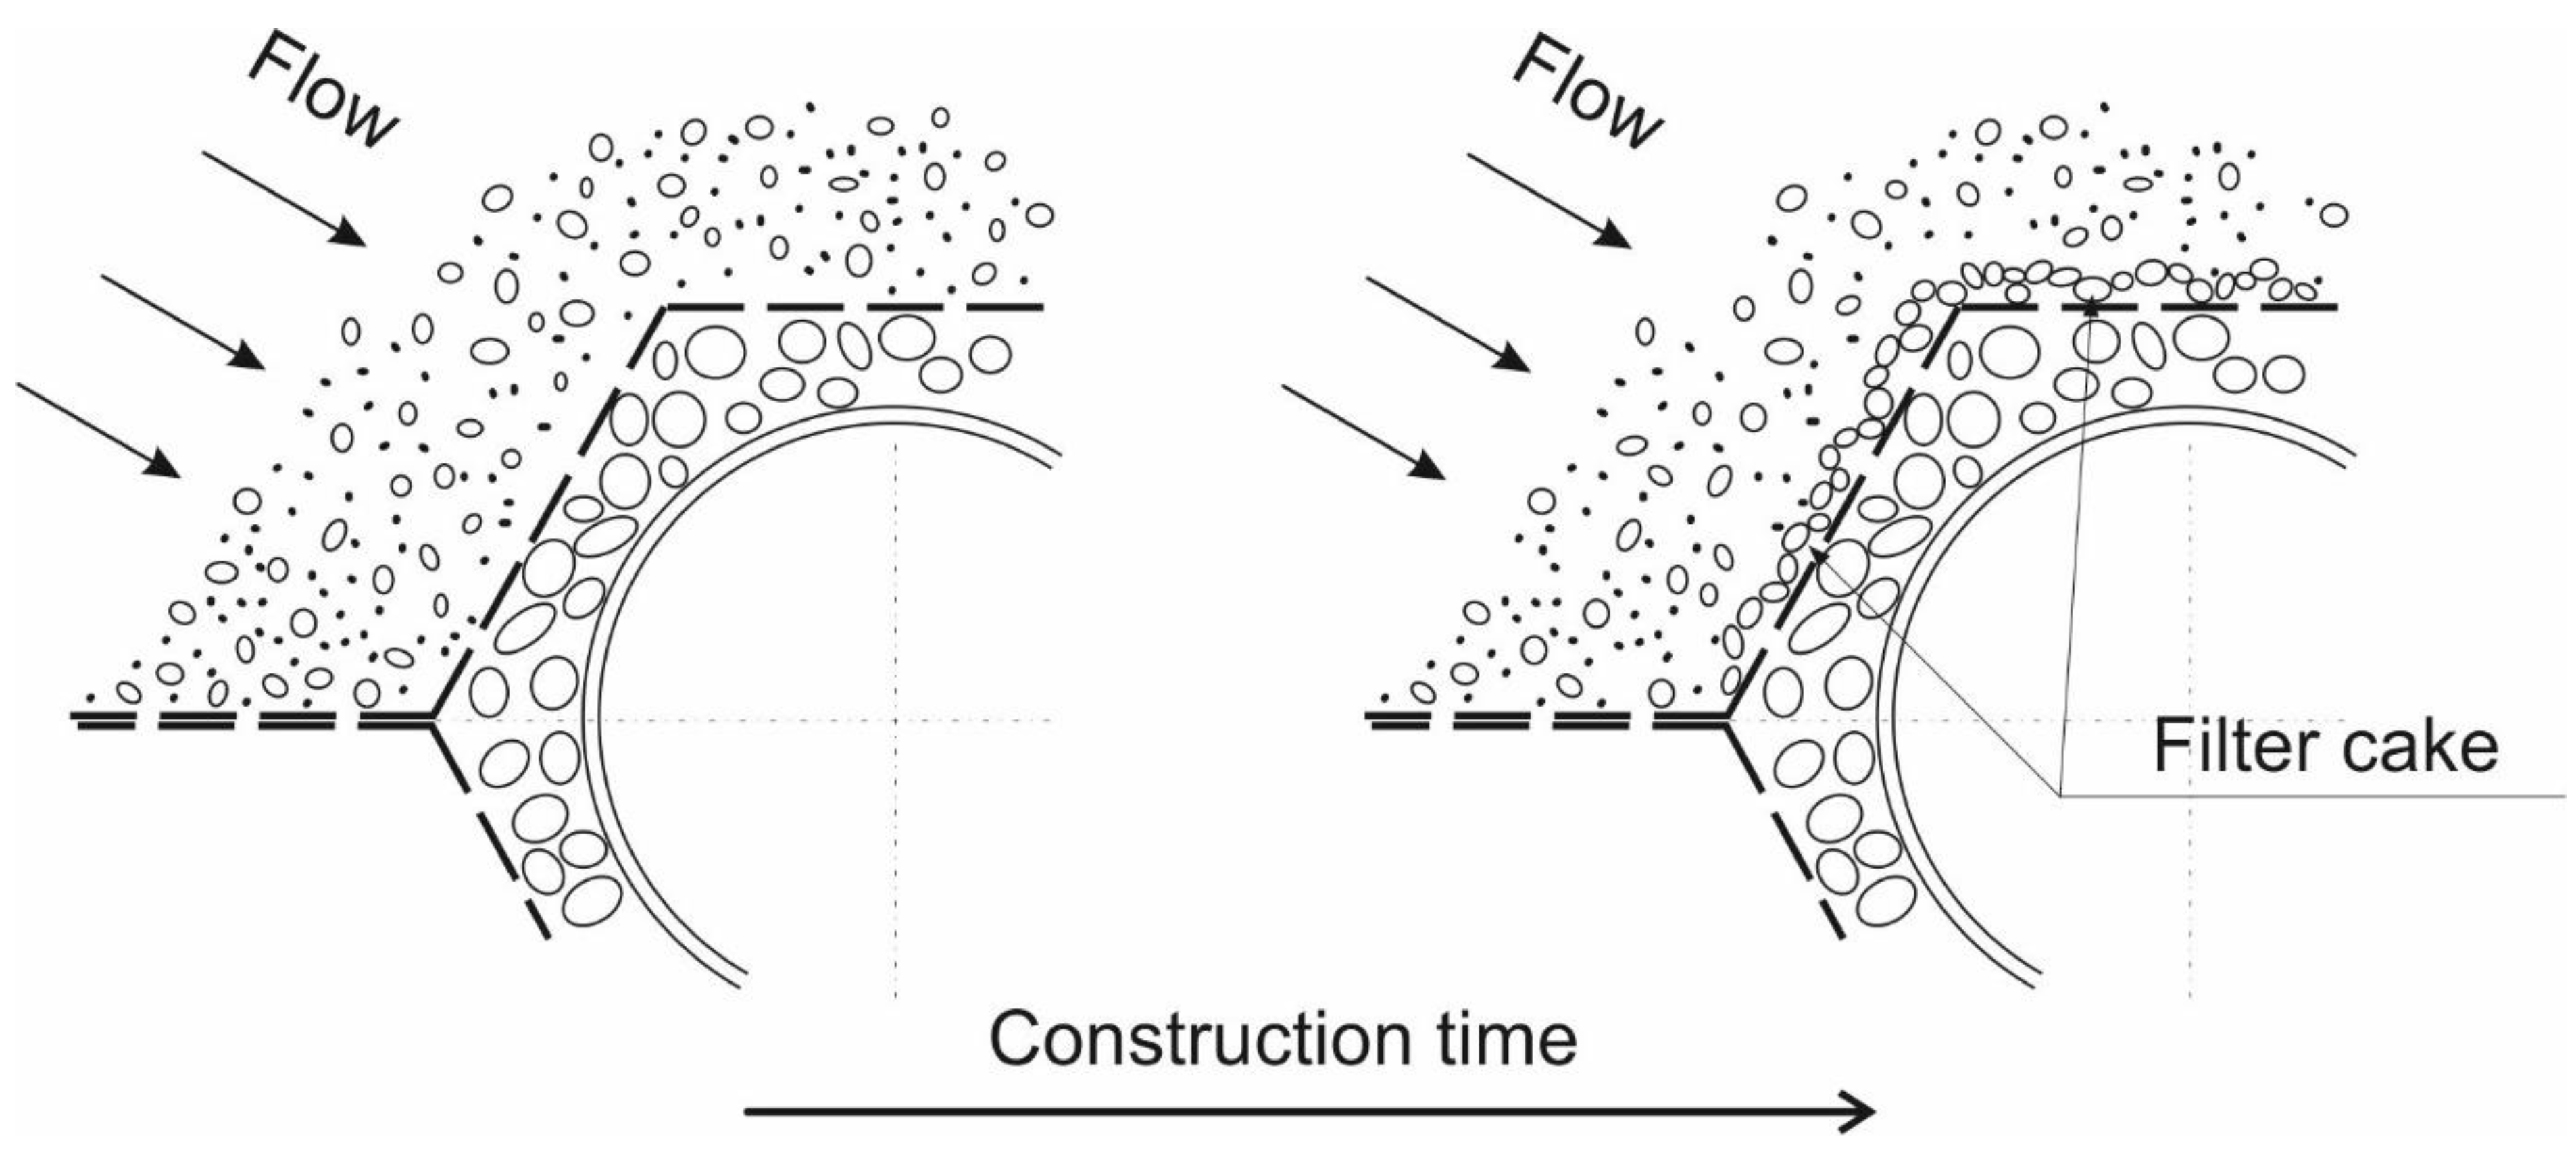
  • The main reason for reduction of geotextile permeability is mechanical clogging caused by fine sand which builds structures called bridges (a kind of filter cake).
  • Symptoms of chemical clogging noted on the air side of drainage did not worsen the permeability.
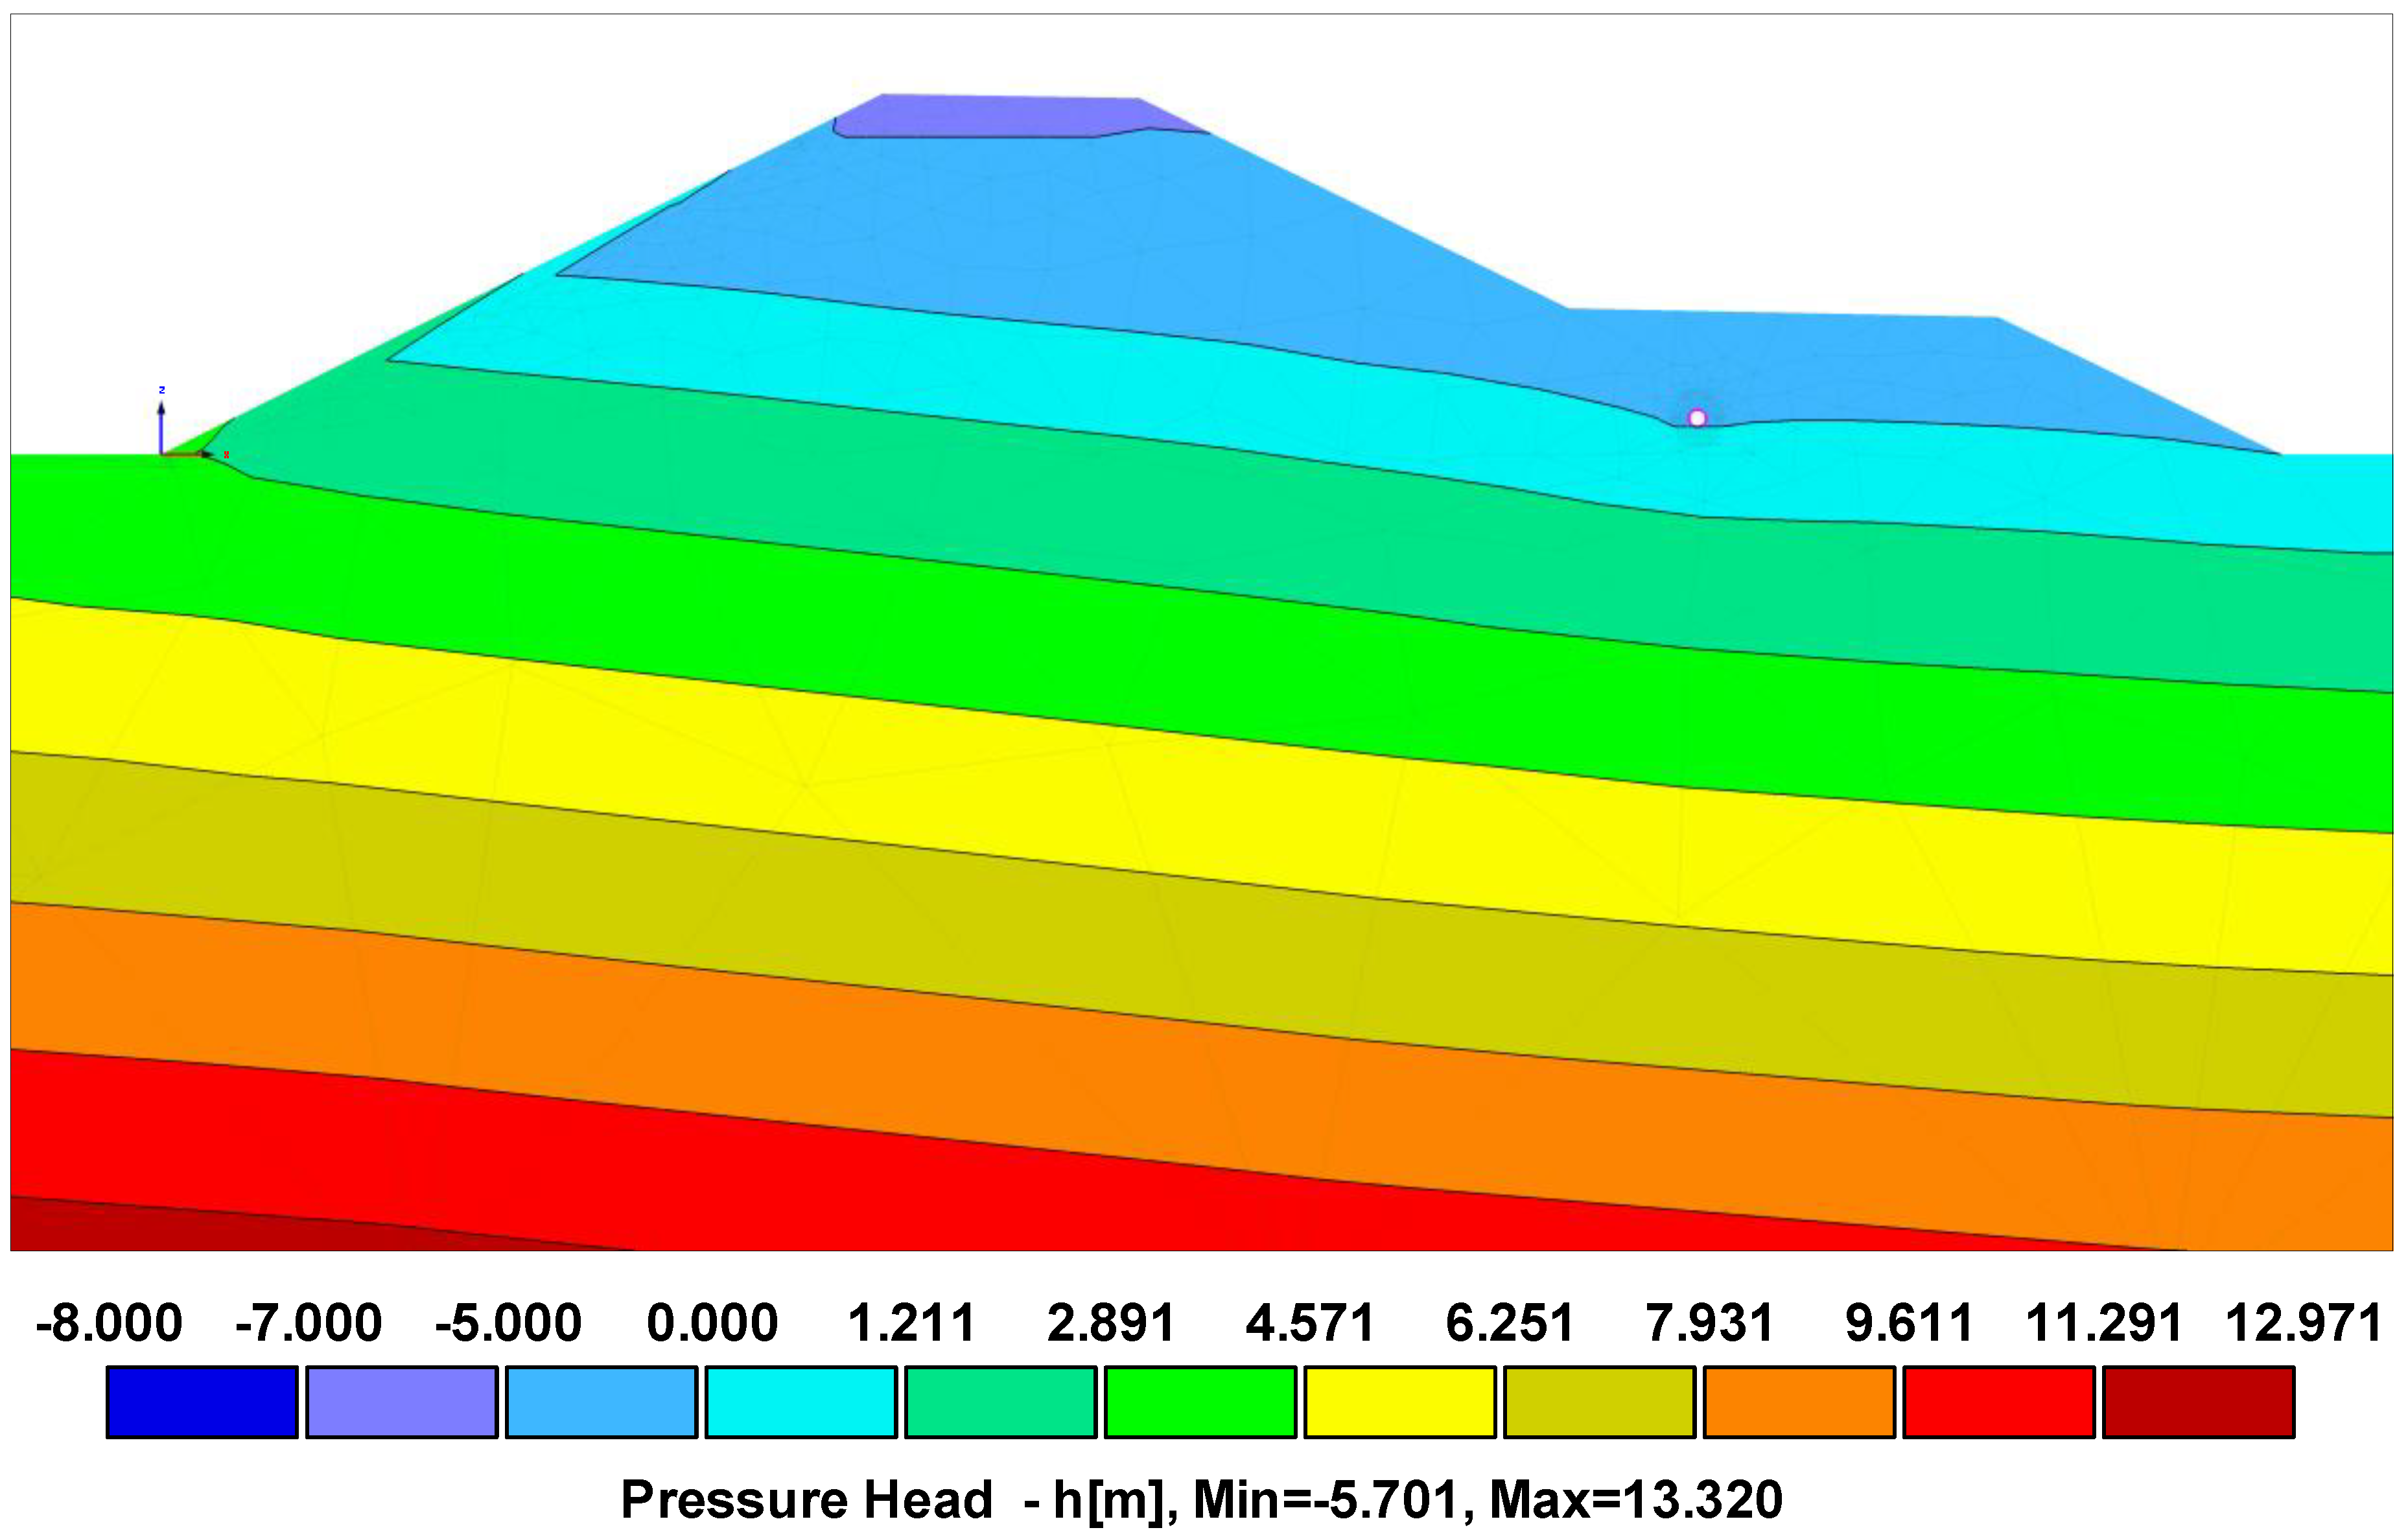
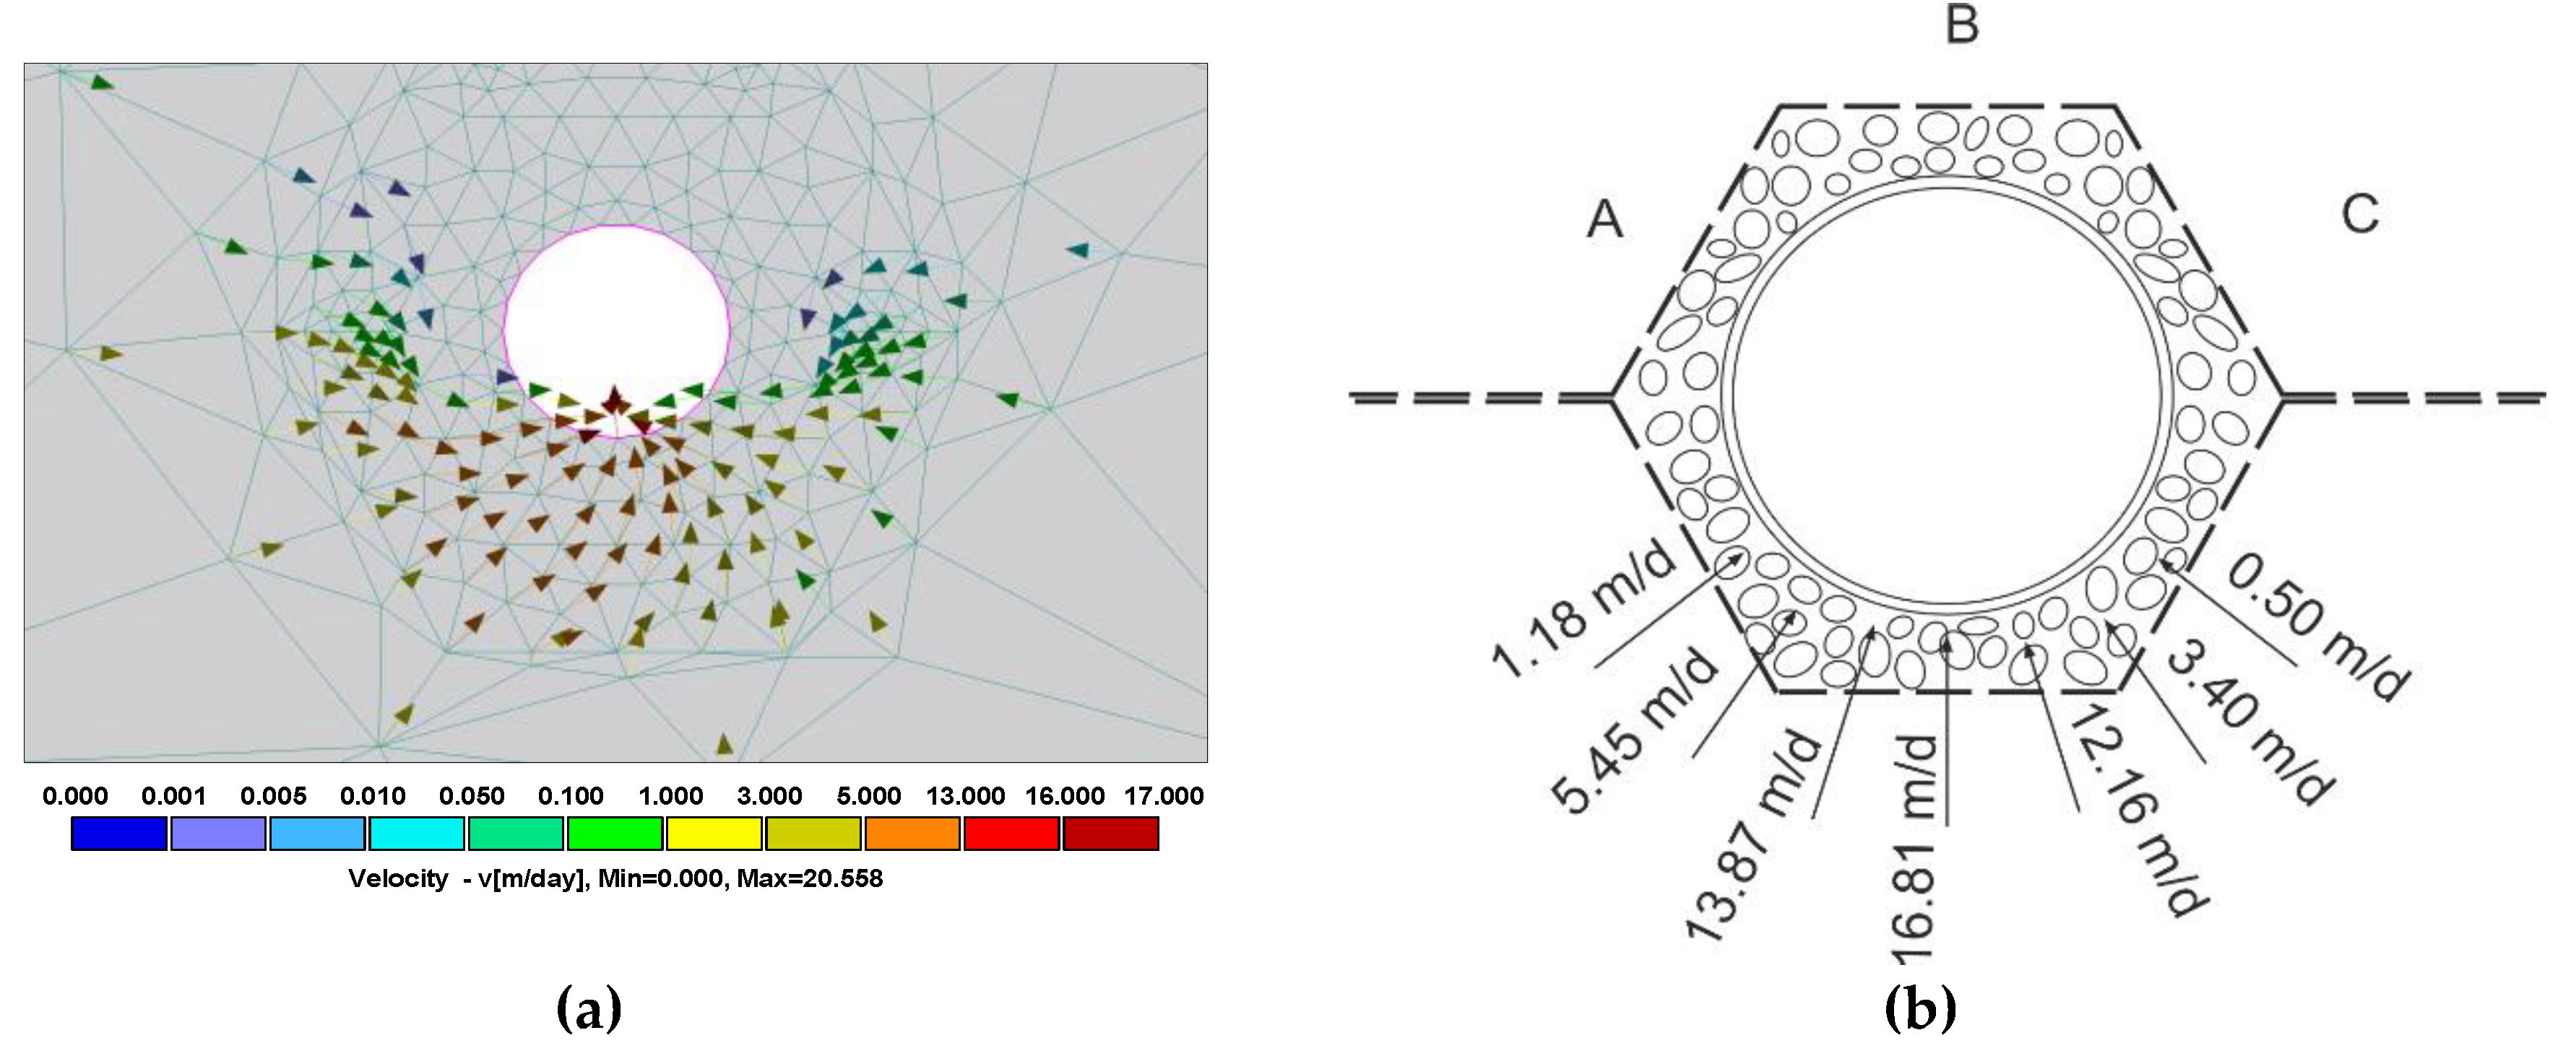
  • Simulations performed using HYDRUS (2D/3D) software showed that at the maximum water level in the reservoir equal to 3.32 m, water supply to the drainage is higher from upstream than from downstream. Particularly, water supply from above to the drainage is absent.
  • HYDRUS (2D/3D) simulations allow one to predict changes of hydraulic characteristics of geotextiles and protected soil under the drainage pipe in case in situ research is unavailable without structural damage.

Author Contributions

Conceptualization, J.N., and P.Z.; methodology, J.N.; validation, J.N., P.Z.; investigation, J.N. and P.Z. and F.N.; data curation, F.N.; writing—original draft preparation, P.Z. and J.N.; writing—review and editing, P.Z. and J.N.; visualization, J.N. and P.Z.

Funding

This research received no external funding.

Conflicts of Interest

The authors declare no conflict of interest.

References

  1. Holtz, J. Geosynthetics for Soil Reinforcement; The Ninth Spencer J. Buchanan Lecture, November 2001; Geo-Institute of ASCE: Seattle, WA, USA, 2001. [Google Scholar] [CrossRef]
  2. Leflaive, E. Geotextiles: Their rationale and future. Geotext. Geomembr. 1985, 2, 23–30. [Google Scholar] [CrossRef]
  3. Młynarek, J. Hydraulic conductivity and pore sizes of nonwoven filter fabrics. Geotext. Geomembr. 1985, 2, 65–77. [Google Scholar] [CrossRef]
  4. Gniewek, A.; Gawryluk, A. Metody badań właściwości filtracyjnych geosyntetyków. Pr. Inst. Tech. Bud. Kwart. 2011, 1, 15–27. Available online: http://yadda.icm.edu.pl/yadda/element/bwmeta1.element.baztech-article-BTB2-0069-0055/c/Gniwek.pdf (accessed on 30 July 2019). (In Polish).
  5. Bolt, A.F.; Duszyńska, A. Kryteria doboru geosyntetyków jako warstw separacyjnych i filtracyjnych. Inżynieria Morska Geotech. 1998, 1, 1–11. Available online: http://www.pg.gda.pl/~adusz/pliki/IMG_Kryteria_98.pdf (accessed on 30 July 2019). (In Polish).
  6. Giroud, J.P. Development of criteria for geotextile and granular filters. IGS News. 2004, 20, pp. 12–14. Available online: https://www.igs-uk.org/wp-content/uploads/2014/06/DeveolpmenCriteriaForGeotextilesGranularFilters.pdf (accessed on 30 July 2019).
  7. Giroud, J.P. The Vienna Terzaghi lecture. In Geosynthetics Engineering: Successes, Failures and Lessons Learned, Proceedings of 5 Osterreichische Geotechniktagung, Osterreichischer Ingenieur und Architekten Verein, Vienna, Austria, 21–22 February 2005; International Geosynthetics Society: Jupiter, FL, USA, 2006; pp. 11–54. Available online: http://www.jcigs.org/8ICG/SL/GiroudTerzaghiLectureHandoutForYokohamaA4.pdf (accessed on 30 July 2019).
  8. Koerner, R.M.; Koerner, G.R. Lessons learned from geotextile filter failures under challenging field conditions. Geotext. Geomembr. 2015, 272–281. [Google Scholar] [CrossRef]
  9. Młynarek, J.; Lewandowski, J.B.; Rollin, A.L.; Boldue, G. Soil-geotextile system interaction. Geotext. Geomembr. 1991, 10, 161–176. [Google Scholar] [CrossRef]
  10. Miszkowska, A.; Koda, E.; Krzywosz, Z.; Król, P.; Boruc, N. Zmiany właściwości filtracyjnych włókniny po 22 latach eksploatacji w drenażu zapory ziemnej. Acta Sci. Pol. Archit. 2016, 15, 119–126. Available online: http://www.architectura.actapol.net/pub/15_3_119.pdf (accessed on 30 July 2019).
  11. Miszkowska, A.; Koda, E. Change of water permeability of nonwoven geotextile exploited in earthfill dam. In Proceedings of the 25th Anniversary of MendelNet Conference Proceedings, Brno, Czech Republic, 7–8 November 2018; pp. 440–445. Available online: https://mendelnet.cz/pdfs/mnt/2018/01/92.pdf (accessed on 30 July 2019).
  12. Veylon, G.; Stoltz, G.; Mériaux, P.; Faure, Y.H.; Touze-Foltz, N. Performance of geotextile filters after 18 years’ service in drainage trenches. Geotext. Geomembr. 2016, 44, 515–533. [Google Scholar] [CrossRef]
  13. Lewandowski, J.B.; Młynarek, J.; Zawadzki, P. Badania skuteczności działania geotekstyliów w konstrukcjach budownictwa wodno-melioracyjnego. Zeszyty Naukowe AR Krakowie 1990, 249, 387–403. Available online: https://www.researchgate.net/publication/330729419_Badania_skutecznosci_dzialania_geotekstyliow_w_konstrukcjach_budownictwa_wodno-melioracyjnego_Investigation_on_geotextile_filter_performance_in_hydraulic_engineering_structures (accessed on 30 July 2019). (In Polish).
  14. Šimůnek, J.; Šejna, M.; van Genuchten, M.T. The HYDRUS-2D Software Package for Simulating Two-Dimensional Movement of Water, Heat, and Multiple Solutes in Variably Saturated Media; Version 2.0, IGWMC-TPS-53; International Ground Water Modeling Center, Colorado School of Mines: Golden, CO, USA, 1999. [Google Scholar]
  15. Li, H.; Yi, J.; Zhang, J.; Zhao, Y.; Si, B.; Hill, R.L.; Cui, L.; Liu, X. Modeling of soil water and salt dynamics and its effects on root water uptake in Heihe Arid wetland, Gansu, China. Water 2015, 7, 2382–2401. [Google Scholar] [CrossRef]
  16. Okamoto, K.; Sakai, K.; Nakamura, S.; Cho, H.; Nakandakari, T.; Ootani, S. Optimal Choice of Soil Hydraulic Parameters for Simulating the Unsaturated Flow: A Case Study on the Island of Miyakojima, Japan. Water 2015, 7, 5676–5688. [Google Scholar] [CrossRef] [Green Version]
  17. Nieć, J.; Zawadzki, P.; Walczak, Z.; Spychała, M. Calculating earth dam seepage using hydrus software applications. Acta Sci. Pol. Form. Circumiectus 2017, 16, 43–56. Available online: http://www.formatiocircumiectus.actapol.net/pub/16_3_43.pdf (accessed on 30 July 2019). [CrossRef]
  18. Zawadzki, P. Assessment of test methods used to measure geotextile pore size. In Proceedings of the IV International Conference on Slope Stability and Protection, Wrocław, Poland, 23–25 April 1991; pp. 184–192. Available online: https://www.researchgate.net/publication/330728794_Assessment_of_test_methods_used_to_measure_geotextile_pore_size (accessed on 30 July 2019).
  19. Hu, H.; Zhang, J.; Li, T. Dam-Break Flows: Comparison between Flow-3D, MIKE 3 FM, and Analytical Solutions with Experimental Data. Appl. Sci. 2018, 8, 2456. [Google Scholar] [CrossRef]
  20. Hämmerling, M.; Błażejewski, R.; Walczak, N. Modeling of Local Scour in Non-cohesive Soils Below Sills Using SSIIM Computer Code. Annu. Set Environ. Prot. 2013, 15, 538–550. Available online: https://ros.edu.pl/images/roczniki/2013/pp_2013_035.pdf (accessed on 30 July 2019).
  21. Walczak, Z.; Sroka, Z.; Tschuschke, W.; Stefanek, P.; Wrzosek, K. Reduction of the Warta River flow caused by seepage from river bed, during additional discharge from Jeziorsko Reservoir. Acta Sci. Pol. Form. Circumiectus 2017, 16, 217–232. [Google Scholar] [CrossRef]
  22. Negm, A.; Capodici, F.; Ciraolo, G.; Maltese, A.; Provenzano, G.; Rallo, G. Assessing the Performance of Thermal Inertia and Hydrus Models to Estimate Surface Soil Water Content. Appl. Sci. 2017, 7, 975. [Google Scholar] [CrossRef]
  23. Błażejewkski, R.; Nieć, J.; Murat-Błażejewska, S.; Zawadzki, P. Comparison of infiltration models with regard to design of rectangular infiltration trenches. Hydrol. Sci. J. 2018, 62, 1707–1716. [Google Scholar] [CrossRef]
  24. Šimůnek, J.; van Genuchten, M.T.; Šejna, M. The HYDRUS Software Package for Simulating the Two- and Three-Dimensional Movement of Water, Heat, and Multiple Solutes in Variably-Saturated Porous Media; Technical Manual. Version 2.0; PC-Progress: Prague, Czech Republic, 2012. [Google Scholar]
  25. Schaap, M.G.; Leij, F.J.; van Genuchten, M.T. ROSETTA: a computer program for estimating soil hydraulic parameters with hierarchical pedotransfer functions. J. Hydrol. 2011, 251, 163–176. [Google Scholar] [CrossRef]
  26. Finch, S.D.; Radcliffe, D.E.; West, L.T. Modeling trench sidewall and bottom flow in on-site wastewater systems. J. Hydrol. Eng. 2008, 13, 693–701. [Google Scholar] [CrossRef]
  27. Miszkowska, A.; Lenart, S.; Koda, E. Changes of permeability of nonwoven geotextile due to clogging and cyclic water flow in laboratory conditions. Water 2017, 9, 660. [Google Scholar] [CrossRef]
  28. Novak, P.; Moffat, A.I.B.; Nalluri, C.; Narayanam, R. Hydraulic Structures. Spon Press; Taylor & Francis Group: London, UK; New York, NY, USA, 2001; ISBN 0-415-25071-4. [Google Scholar]
Figure 1. View of the research place.
Applsci 09 04161 g001
Figure 2. Earth dam constructions and parameters.
Applsci 09 04161 g002
Figure 3. Piaski-Szczygliczka Reservoir storage capacity and water surface area curves.
Applsci 09 04161 g003
Figure 4. Schematic diagram of downstream cross-section.
Applsci 09 04161 g004
Figure 5. Drainage of the Piaski-Szczygliczka Dam: 1. Nonwoven geotextile WD-3; 2. Gravel; 3. Slotted pipe; A, B and C—nonwoven geotextile and soils sampling zones.
Applsci 09 04161 g005
Figure 6. Samples of nonwoven geotextile WD-3 from the drainage of the Piaski-Szczygliczka Dam; from A, B and C sampling zones.
Applsci 09 04161 g006
Figure 7. Numerical scheme built in software package HYDRUS (two-dimensional/three-dimensional (2D/3D)).
Applsci 09 04161 g007
Figure 8. Schematic diagram of simulated nonwoven geotextile with different obtained permeability.
Applsci 09 04161 g008
Figure 9. Changes of permeability coefficient kn over time (data after 7 and 11 years, after Reference [13]).
Applsci 09 04161 g009
Figure 10. Changes in coefficient permeability ratio (kn)years/(kn)0 over the years.
Applsci 09 04161 g010
Figure 11. Grain size distribution curve of soil shaken and washed out from nonwoven geotextile samples.
Applsci 09 04161 g011
Figure 12. Soil samples from the 10 cm layer directly at nonwoven geotextile: (A) zone A upstream of drainage, (B) zone B above drainage, (C) zone C downstream of drainage.
Applsci 09 04161 g012
Figure 13. Grain size distribution curve of soil from the 10 cm layer directly at nonwoven geotextile and earth dam material.
Applsci 09 04161 g013
Figure 14. Formation of filter cake (bridge network) upstream of drainage nonwoven geotextile.
Applsci 09 04161 g014
Figure 15. Piezometric pressure at steady state at a 3.32 m water level in the reservoir.
Applsci 09 04161 g015
Figure 16. Distribution of seepage velocity around the drainage, (a) velocity vectors calculated using HYDRUS (2D/3D), (b)scheme of vectors velocity higher than 0.00003 m/day.
Applsci 09 04161 g016
Table 1. Filtration properties of used soils.
MaterialΘrΘSanKsl
(m3/m3)(m3/m3)(1/m)(-)(m/day)(-)
Sand0.0450.4314.52.687.780.5
Gravel0.050.41752.886.40.5
Concrete00.0690.0002481.9174.089·10−80.5
Silty Loam0.0670.4521.410.1080.5
Clogged A0.0450.4314.52.681290.5
Clogged B0.0450.4314.52.683450.5
Clogged C0.0450.4314.52.682590.5
Table 2. Coefficient of permeability normal to the plane kn of WD-3 nonwoven geotextile samples.
Sampleskn,
cm s−1
kavr, ± SD
cm s−1
A0.16280.15 ± 0.01
A0.1427
B0.41760.40 ± 0.02
B0.3817
C0.36550.30 ± 0.06
C0.2429
SD—standard deviation of the mean.
Table 3. Physical parameters of the nonwoven geotextile WD-3 samples (before and after shaking).
SampleArea, m2Weight, gArea Density, g m−2
WD-3BeforeAfter
BeforeAfter
A10.0375536.4716.81971.1447.6
A20.0376133.9519.75902.7525.1
B10.0388218.3414.38472.4370.4
B20.0383620.2214.83527.1386.6
C10.0379626.6018.03700.8475.0
C20.0371529.2619.58787.5527.0

