Article

Discriminative Local Feature for Hyperspectral Hand Biometrics by Adjusting Image Acutance

PAMI Research Group, Department of Computer and Information Science, University of Macau, Macau 999078, China
*
Author to whom correspondence should be addressed.
Appl. Sci. 2019, 9(19), 4178; https://doi.org/10.3390/app9194178
Submission received: 10 September 2019 / Revised: 24 September 2019 / Accepted: 25 September 2019 / Published: 6 October 2019
(This article belongs to the Section Computing and Artificial Intelligence)

Abstract

:

Featured Application

Hyperspectral hand biometrics, which combines hyperspectral techniques and hand traits is a potential application in high-security scenarios. Based on adjusting image acutance, the discriminative local features were extracted from hyperspectral dorsal hand vein images and palm vein images. In addition, this work lays the foundation for continuing studies in hyperspectral hand biometrics.

Abstract

Image acutance or edge contrast in an image plays a crucial role in hyperspectral hand biometrics, especially in the local feature representation phase. However, the study of acutance in this application has not received a lot of attention. Therefore, in this paper we propose that there is an optimal range of image acutance in hyperspectral hand biometrics. To locate this optimal range, a thresholded pixel-wise acutance value (TPAV) is firstly proposed to assess image acutance. Then, through convolving with Gaussian filters, a hyperspectral hand image was preprocessed to obtain different TPAVs. Afterwards, based on local feature representation, the nearest neighbor method was used for matching. The experiments were conducted on hyperspectral dorsal hand vein (HDHV) and hyperspectral palm vein (HPV) databases containing 53 bands. The results that achieved the best performance were those where image acutance was adjusted to the optimal range. On average, the samples with adjusted acutance compared to the original improved by a recognition rate (RR) of 29.5% and 45.7% for the HDHV and HPV datasets, respectively. Furthermore, our method was validated on the PolyU multispectral palm print database producing similar results to that of the hyperspectral. From this we can conclude that image acutance plays an important role in hyperspectral hand biometrics.

1. Introduction

Hand biometrics has been largely studied in the last few decades [1,2,3,4,5] because of its effectiveness in personal authentication. One of the most universal traits of a hand is the palmprint [6,7,8,9]. Palmprint biometrics, with the center of the palm not touching the capture device for identification, is less likely to be copied by others and is more hygienic [9]. Contrary to palmprint biometrics, hand vein biometrics, such as dorsal hand veins [10,11,12] and palm veins [13,14], are studied in security with advantages in liveness detection and anti-spoofing [12]. In the meantime, hyperspectral technology known from remote sensing [15,16,17,18], has been introduced in biometrics, where it is applied in high-security scenarios [18]. Therefore, hand biometrics when combined with hyperspectral technology, is a potential solution achieving better personal authentication [19,20].
Hyperspectral hand biometrics utilizes spectral information in a hand image. The epidermal and dermal layers of the skin on a hand constitute a scattering medium that contains various combinations of water, melanosomes, hemoglobin, bilirubin, beta-carotene, etc., which provide different absorption coefficients for an irradiated spectrum [19]. Little changes in the distribution of these layers and pigments of the skin induce significant changes in the skin’s spectral reflectance, thus generating a unique response for each person that is difficult to modify and counterfeit [20]. For hyperspectral imagery in hand biometrics in particular, each spectrum penetrates a different depth of the hand, indicating the spectral property and enabling the imaging of different surface characteristics of an individual’s hand. For example, near-infrared (NIR) can penetrate deeper than thermal infrared (8–12 um), making it useful for hyperspectral hand imagery [21]. Considering spectral information as a complement in hyperspectral hand biometrics, security issues can reach a higher level, which is more secure and better at anti-spoofing.
Hyperspectral hand biometrics is a new trend derived from single spectral and multispectral biometrics. Fei et al. [22] performed palmprint recognition on extensive single spectrum images, such as the PolyU, IITD, GPDS, and CASIA databases. Zhang et al. [23] first applied the combinations of different bands containing Blue, Green, Red, and NIR for multispectral palmprint verification, where its result was recently improved by Hong et al. [24]. Hyperspectral palm was studied by Guo et al. [25] to propose an anti-spoofing recognition system (prototype). The dorsal hand mainly concentrates on the vein structures, first discovered by Joe Rice, a senior Kodak engineer when he was designing an infrared barcode system [26]. Huang et al. [12] performed dorsal hand vein recognition based on an 850 nm NIR dorsal hand database, while other databases with the same band can be found in [27,28,29]. Chen et al. [30] applied hyperspectral techniques to select the best spectrum for the improvement of dorsal hand vein recognition, which showed potential in hyperspectral hand biometrics.
In hand biometrics, the local features play a crucial role for texture analysis [31,32]. As palmprint lines are the most significant features [7], Wu et al. [33] used the local line features for palmprint recognition. To explore more elaborate features, Zhang et al. [34] proposed a local CompCode (competitive code) method for online palmprint recognition, which was based on Gabor features. Later, this was developed into a discriminative and robust CompCode by Xu et al. [35]. Most recently, a novel double-layer local direction pattern extraction method for personal authentication was proposed by Fei et al. [6]. For dorsal hand vein recognition, Wang et al. [36] applied local SIFT (scale-invariant feature transform) features. Wang et al. [11] extracted LBP (local binary patterns) from a dorsal hand vein to build an automatic access control system. Based on the Gabor filter, Lee et al. [37] designed directional filter banks to draw local patterns for dorsal hand vein recognition.
For local feature extraction in hand biometrics, image quality is a make or break factor [38,39,40]. High-quality images collected from calibrated cameras contain much more detailed information for human perception [41]. However, Zhang et al. [42] found that the presentation of a local feature was more effective in biometrics after filtering the high-quality images to low quality. Image acutance, which can be referred to as the contrast of the edge and the background in an image evaluates the image quality. Zhang et al. [42] improved the recognition performance by converting high-quality, single-spectral images to low acutance images. That being said, to the best of our knowledge there is little to nothing in the literature that studies the properties of low-resolution hyperspectral hand biometric images. The low-resolution image mostly considered as a low-quality image can be easily imaged by a low-cost device, which can further promote the use of biometrics. Hyperspectral biometrics possess the properties of uniqueness, liveness detection, and anti-spoofing that are difficult to achieve by single-band spectral images.
Inspired by [42], in this paper we explore the performance of hyperspectral hand biometrics by filtering these images to have different acutance. The hypothesis we propose is that there exists an optimal range in image acutance for a set of hyperspectral hand images, and when this set is filtered in this range, the recognition performance will be improved. For this reason, thresholded pixel-wise acutance value (TPAV) is proposed to evaluate image acutance. By convolving with Gaussian filters, TPAV of the hyperspectral hand image changed. Local features were extracted from the changed TPAV’s corresponding database and used to implement identification. In particular, extensive experiments were conducted on HDHV (hyperspectral dorsal hand vein), HPV (hyperspectral palm vein), and MPP (multispectral palmprint) images. We found that the recognition performance can be improved by filtering the images to have different acutance, where the local features extracted are more discriminative after adjusting for image acutance.
In the rest of this paper, the image acutance adjustment is proposed in Section 2. Section 3 designs extensive experiments with an analysis of the results. Finally, the conclusions are drawn in Section 4.

2. Adjusting Image Acutance

Even though a camera can be calibrated to capture clear images based on human perception, the collected images may not achieve the best performance in digital image processing. In order to improve the effectiveness of hyperspectral hand biometrics, this section first proposes a method to evaluate image quality based on image acutance. The image acutance can be changed to different levels by having the image convolved with different Gaussian filters. Through the specific task of hyperspectral hand biometrics, the optimal range of image acutance can be found to achieve the best performance in identification. The distinction from general hyperspectral hand recognition and our proposed method is the image acutance adjusting phase (see Figure 1). Here, TPAV is applied to the extracted ROI (region of interest) image before feature extraction.

2.1. Assessing Image Acutance

Motivated by the thresholded gradient magnitude maximization denoted Tenengrad [43] and edge acutance value (EAV) in [44], a new method named thresholded pixel-wise acutance value (TPAV) is proposed to assess the image acutance in hyperspectral hand biometrics.
T P A V ( I ) = g ( x , y ) C ,   T 1 < g ( x , y ) < T 2
where
g ( x , y ) = i j | I ( x , y ) I ( x + i , y + j ) | i 2 + j 2
T 1 = M i n ( g ( x , y ) ) + a ( M a x ( g ( x , y ) ) M i n ( g ( x , y ) ) )
T 2 = M a x ( g ( x , y ) ) a ( M a x ( g ( x , y ) ) M i n ( g ( x , y ) ) )
C is the count of g ( x , y ) whose value is in the range of T 1 T 2 . I ( x , y ) is the value of pixel ( x , y ) . | i | 1 ,   | j | 1 ,   | i | + | j | > 0 . The parameter a is a small positive constant, which is set as 0.05 in the following experiments empirically. This means outliers in the image will not be counted when measuring the image acutance. TPAV both takes advantage of Tenengrad [43] and EAV [44] into consideration. Tenengrad sets a threshold for reducing the sensitivity of the algorithm to noise when it assesses the acutance of an image. However, only horizonal and vertical edges in an image are considered to count as acutance in Tenengrad. EAV applied an additional 45° and 145° directional edges in 8 neighbors of a pixel, which is more reasonable for acutance assessment [44]. To this end, TPAV combines the threshold and more directional edges to effectively assess the acutance of an image for local feature analysis. In the following Figure 2 the comparison of acutance evaluation values was demonstrated for a ROI hand image (from a single band (in a hyperspectral dorsal hand vein database) with both rotation and noise). When the image rotates, the acutance value of Tenengrad was dramatically changed (+40.4% from 6.992 to 9.816) due to the direction limitation (see Figure 2b). Also, the acutance value of EAV increased significantly (+90.5% from 12.214 to 23.265) due to noise (refer to Figure 2c). However, the TPAV did not change a great deal under rotation (−7.1% from 15.226 to 14.140) or with noise (+9.6% from 15.226 to 16.685), which validates its robustness in both rotation and noise.

2.2. Modified Image Acutance

Under normal circumstances the image directly captured by a device has clear acutance for human perception, while it may not be effective for a computer to process it for a specific vision task. To improve the task’s effectiveness, the captured image first needs to be processed. By convolving with 2-D (two-dimensional) Gaussian filters, the image obtains a modified acutance, which can be regarded as a pre-processing stage in local pattern analysis for hyperspectral hand biometrics. The 2-D Gaussian filter has two main parameters for image pre-processing: window size and variance. In the following experiments of this paper (refer to Section 3), the window size of the Gaussian filter is set as 5 × 5 empirically. By changing the variance with respect to δ, different acutance of the same image can be obtained.
G ( x , y ) = 1 2 π δ 2 e x 2 + y 2 2 δ 2
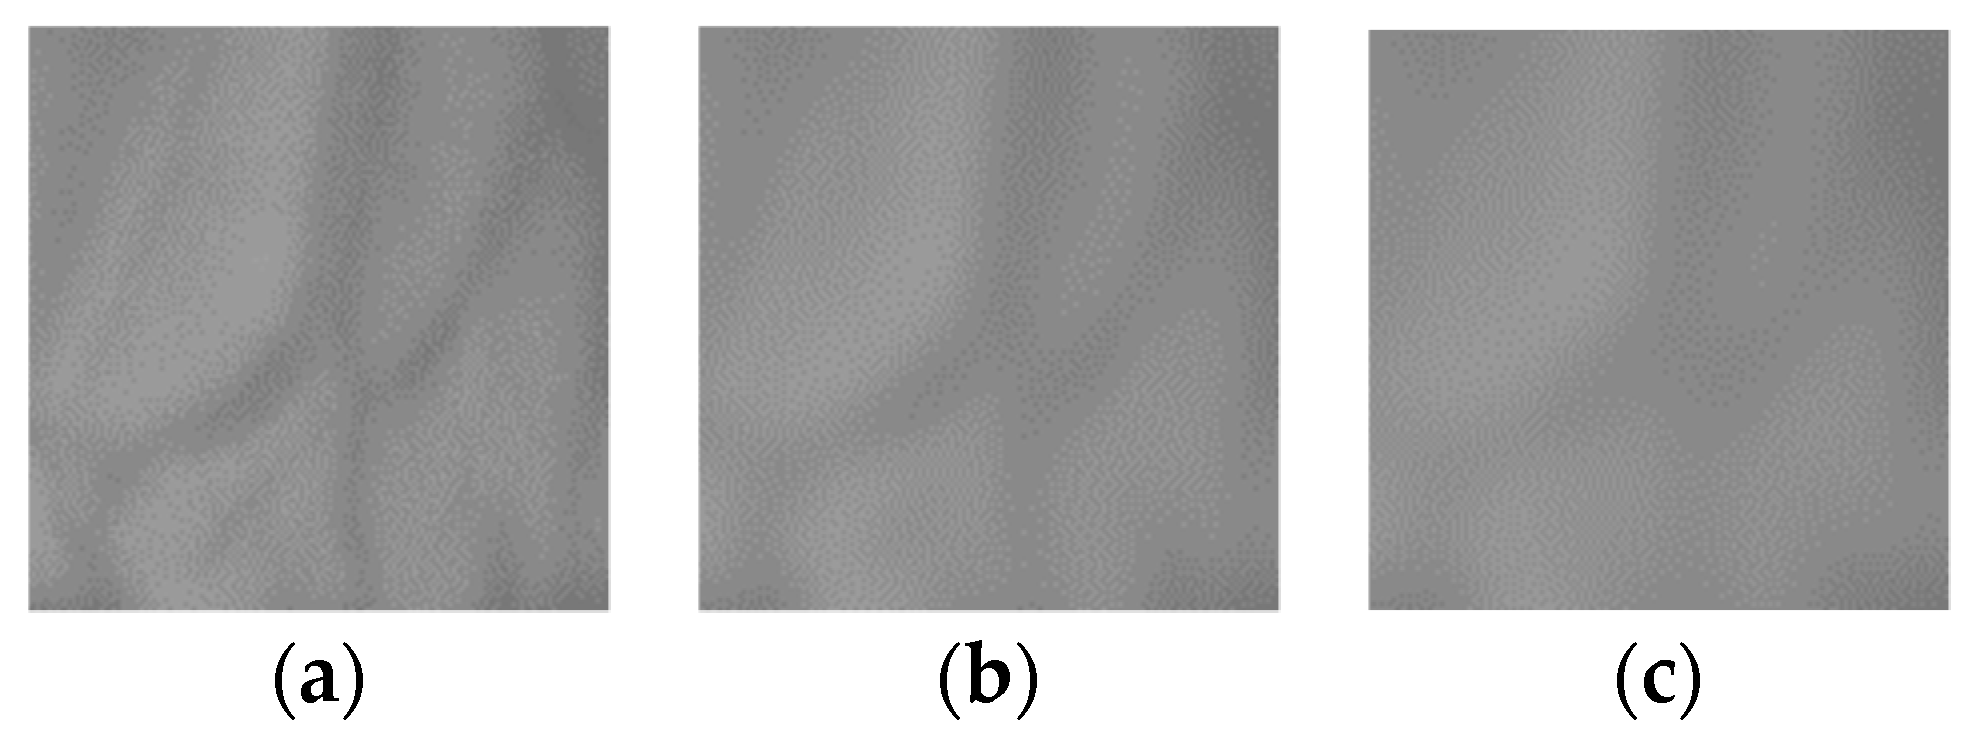
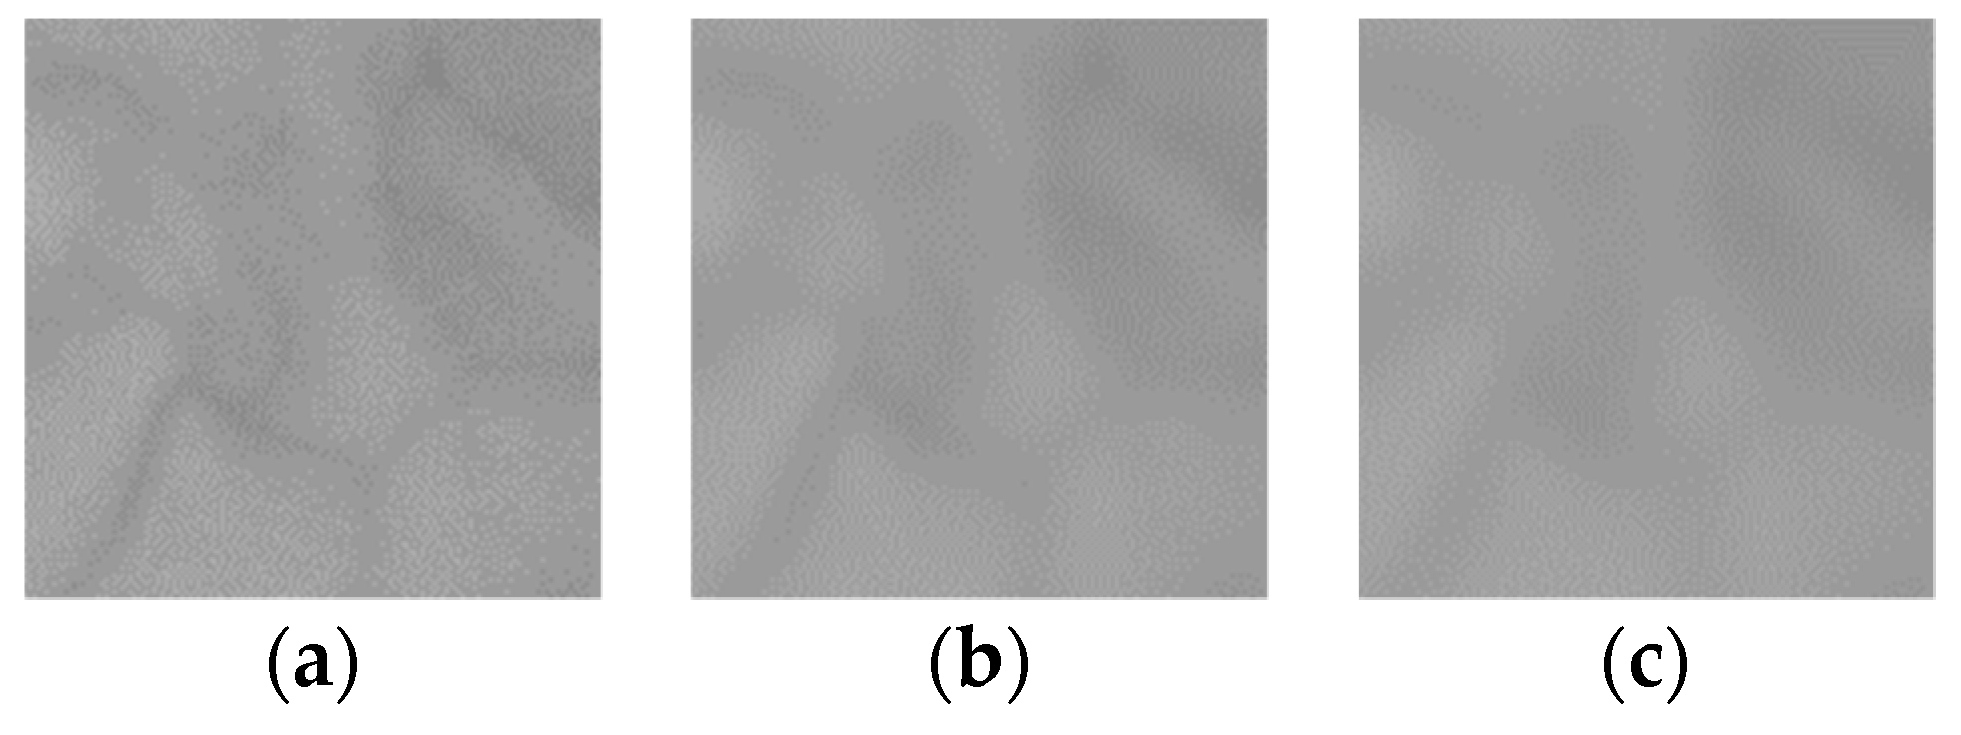
After the image is filtered, the TPAV can be obtained again for each image with different δ. As an example, Figure 3 and Figure 4 show a decreasing acutance for a dorsal hand vein and a palm vein after filtering, respectively.

2.3. Determining an Optimal Range of Image Acutance

The average TPAV of all images in a database is defined to measure the acutance of the database,
T P A V ¯ =   i = 1 N T P V A ( I i ) N
where I i is the i th image in the database which contains N images.
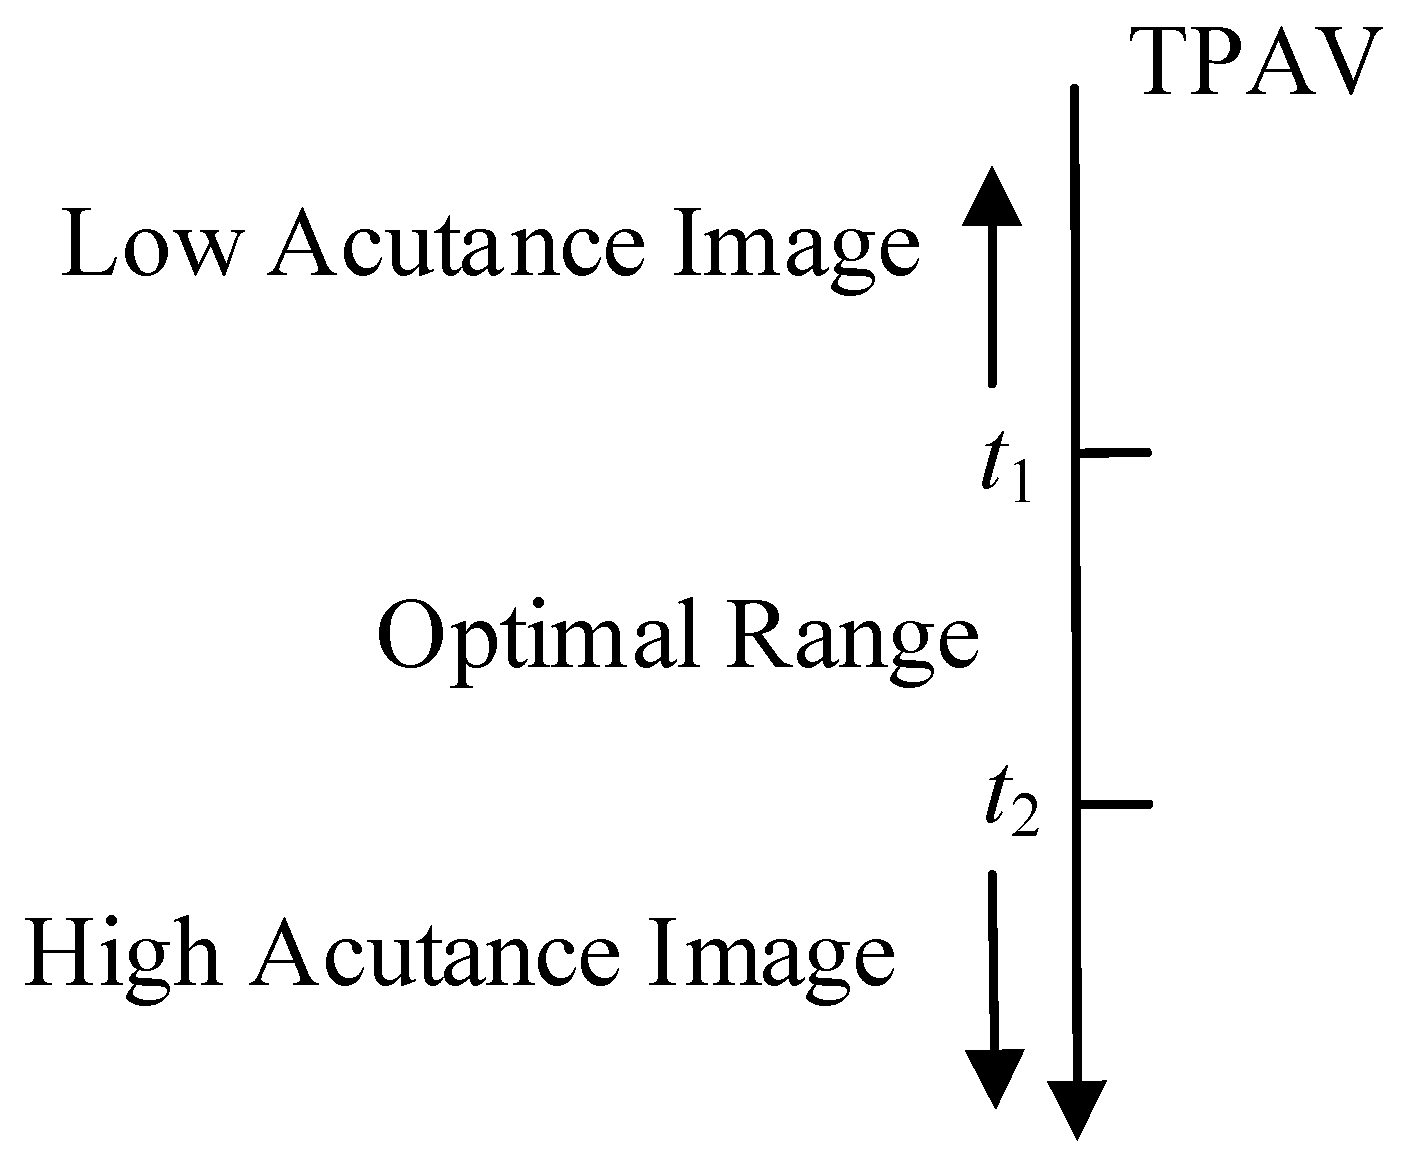
A hypothesis can be made that there is an optimal range [ t 1 ,   t 2 ] on the TPAV axis (see Figure 5). When the T P A V ¯ of a hand database is adjusted to this range, the performance of local pattern analysis will be improved. In order to find this optimal range, each image in the database will be filtered by a group of Gaussian filters with different δ in order to calculate the T P A V ¯ of each generated database and its recognition performance. The optimal range can be found when the recognition performance reaches its first three highest results with the corresponding Gaussian filters. The experiments validated that after each image in the hyperspectral hand database is filtered with a Gaussian filter, the recognition performance improves compared with the original database.

3. Experiments

In order to validate our proposed method, experiments were conducted on our HDHV and HPV datasets as well as the publicly available PolyU multispectral palmprint datasets [24] to demonstrate its generality. This section first introduces the details of the databases used. Then, according to the experimental settings identification was implemented to find an optimal acutance range. Based on the local features extracted from the modified acutance images, the mechanism of improved performance was analyzed. Finally, the computation time of every phase in the proposed method was evaluated.

3.1. Databases

The HDHV database consists of 120 individuals ranging from the ages of 20 to 50, where images were captured of their left hand. The HPV database in contrast involved 209 volunteers with respect to their left hand. All subjects gave their informed consent for inclusion before they participated in the study. The study was conducted in accordance with the Declaration of Helsinki and the protocol was approved by the Research Services and Knowledge Transfer Office of the University of Macau. The light source used in both databases including the visible and NIR covers a spectral wavelength from 520 nm to 1040 nm with an interval 10 nm, which means a total of 53 bands were captured. Each hand was imaged five times with a size of 501 × 501 at 96 dpi. These images were stored in a single channel bitmap with 8 bits per pixel format. Altogether, there were 31,800 images in the HDHV database (120 individuals × 5 images × 53 bands), and 55,385 images from the HPV database (209 volunteers × 5 samples × 53 bands). Figure 6 and Figure 7 depict some samples from the two hyperspectral hand databases.
To further confirm the effectiveness of the proposed method, the PolyU MPP (The Hong Kong Polytechnic University Multispectral Palm Print) database [24] was also experimented. This multispectral database consists of 500 different palms, where each palm was shot 6 times including four bands (Red, Green, Blue, and NIR) with the size of each ROI being 128 × 128. Only the first session of the database was involved in this paper. Therefore, there are 12,000 (500 × 6 × 4) images from the multispectral database. Figure 8 demonstrates some samples from the PolyU MPP database.

3.2. Experimental Settings

Identification experiments were conducted on every band of the hyperspectral/multispectral hand databases. The regional LBP [11] method was applied to the HDHV database for local feature extraction, while HPV and MPP used CompCode [35] for local feature representation. n samples from a total of M samples belonging to the same person’s hand in the database were selected for training with the others assigned as testing (n < M). Every band from the hyperspectral or multispectral databases were convolved with a Gaussian filter, obtaining a mean recognition rate (RR) from 100 combinations of random training-testing samples. This guarantees statistically significant results [45]. Each RR can be obtained from the following equation:
R R =   N C T S N A T S   × 100 %
where NCTS and NATS are the number of correctly classified test samples and the number of all test samples, respectively. All experiments were completed on MATLAB R2018b running on a PC with 64-bit Windows 7, i7-6700 CPU (3.40 GHz), and 16 GB RAM. To fully test the hypothesis, deep features in some respects regarded as local feature representation were also experimented under the same settings mentioned above. In particular, pre-trained CNN models, which were well trained on the ImageNet dataset [46], were used to extract local deep features from the hand databases. The pre-trained VGG-16 having performed the best in hand recognition [47], was applied in our experiments. The first fully connected layer in VGG-16 was set as the feature representation with a 4096-dimensional vector.

3.3. Experimental Results

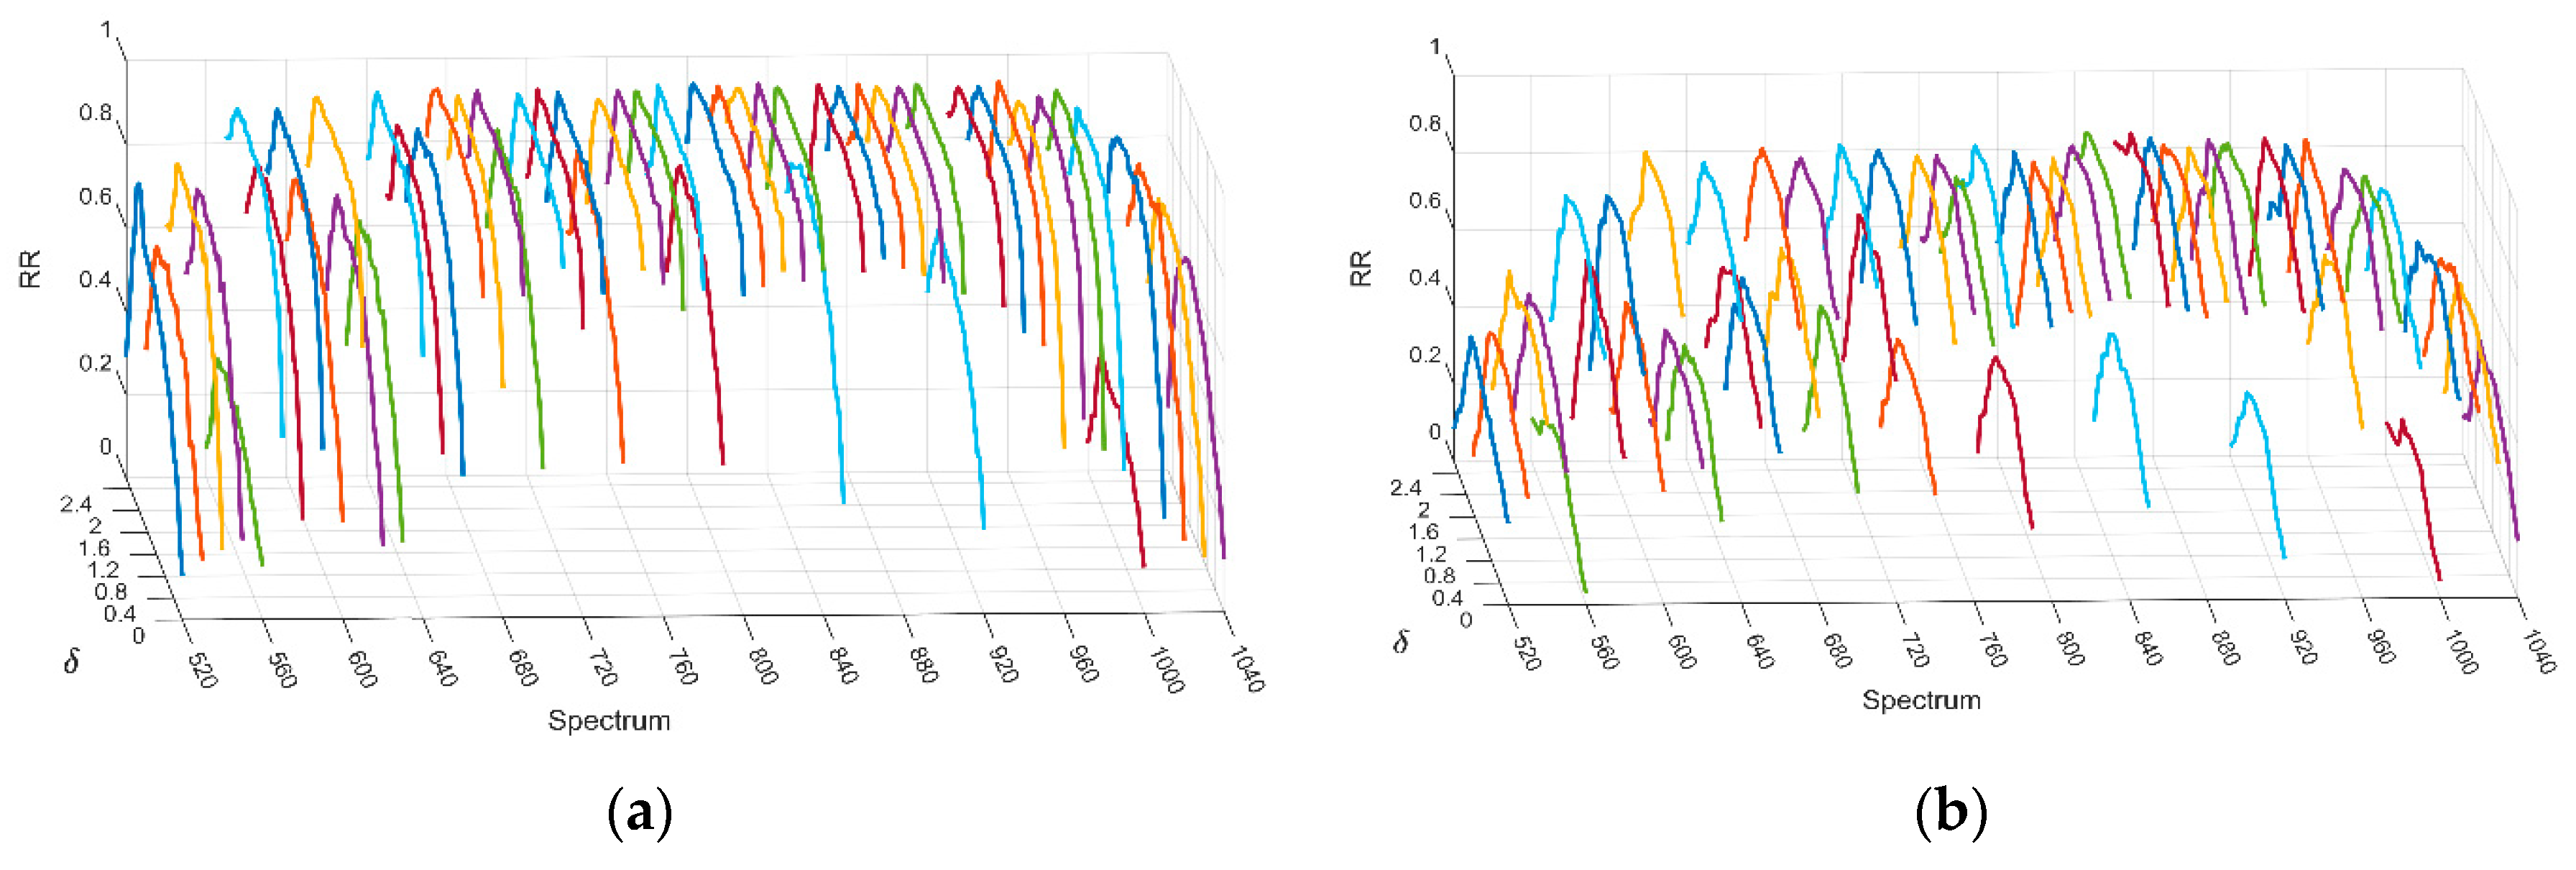
For the HDHV database to demonstrate the identification results, three samples from each hand were chosen for training, while the remainder were used for testing. The curve of each band in Figure 9 shows that the RR first increased and then decreased after being convolved with different Gaussian filters through different local feature representation methods. To demonstrate the connection between acutance and the performance, one single band was presented in Figure 10. The RR of the single band (810 nm) from the HDHV database steadily increases before reaching a peak and then starts to sharply decrease. Therefore, there exists an optimal range based on image acutance to obtain better performances than the original image. Here, the optimal acutance range is 4.103–6.755 for different feature extractors. For example, regional LBP where the highest RR can reach 0.9667 (see Figure 10a), achieves an improvement of 7.9% compared with the original image (RR = 0.8958).
For the HPV database, RR had the same tendency as the above (HDHV), which confirmed the hypothesis that an optimal range based on image acutance does exist (see Figure 11). With different feature descriptors, the optimal acutance range of a single band (840 nm for example in Figure 12) is 4.927–6.856, using CompCode where the highest RR can reach 0.9880 (see Figure 12a), which is an improvement of 21.8% compared with the original image (RR = 0.8110).
For the MPP database, the RR followed the same trends as the previous two databases. This shows that there is an optimal range based on image acutance in every spectrum with different feature representation methods (see Figure 13). For CompCode as an example (see Figure 14a), the optimal acutance range of the green spectrum is 11.549–14.257, where the highest RR reached 0.9993, which is an improvement of 7.2% compared with the original image (RR = 0.9320).
To draw conclusions more easily, the representative results of the best performing bands, in addition to the average results for all bands in each hyperspectral database are depicted in the Table 1. From this table it can be seen that for every case, after adjusting image acutance (from the optimal range) the RR increases when compared to the original ROI image, no matter which local feature extractor was used.

3.4. Experimental Analysis

To investigate why hyperspectral hand databases performed better after acutance adjustment. We assumed that the distance of the local features for an individual’s same hand is decreased, while for different people their hand distance is increased when the acutance of the database is adjusted to the optimal range. To this end, one evaluation method which is inspired by the Fisher criterion [48], was used to measure the discrimination of the features extracted from the database (after acutance adjustment). The r with respect to the ratio of within-class variance to between-class variance is introduced as follows:
r = 1 D d = 1 D ( v w d v b d ) 2
where
v w d = k = 1 K n ϵ C k ( x n d m k d ) 2    m k d = 1 N k n ϵ C k x n d
v b d = k = 1 K N k ( m k d m d ) 2    m d = 1 N n = 1 N x n d
The notations are detailed below:
v w d : the within-class variance for the d t h feature of the D features.
v b d : the between-class variance for the d t h feature of the D features.
x n d : the d t h feature of the n t h sample in the database containing N samples.
C k : the k t h class in the database consisting of K classes.
N k : the number of samples belonging to the k t h class.
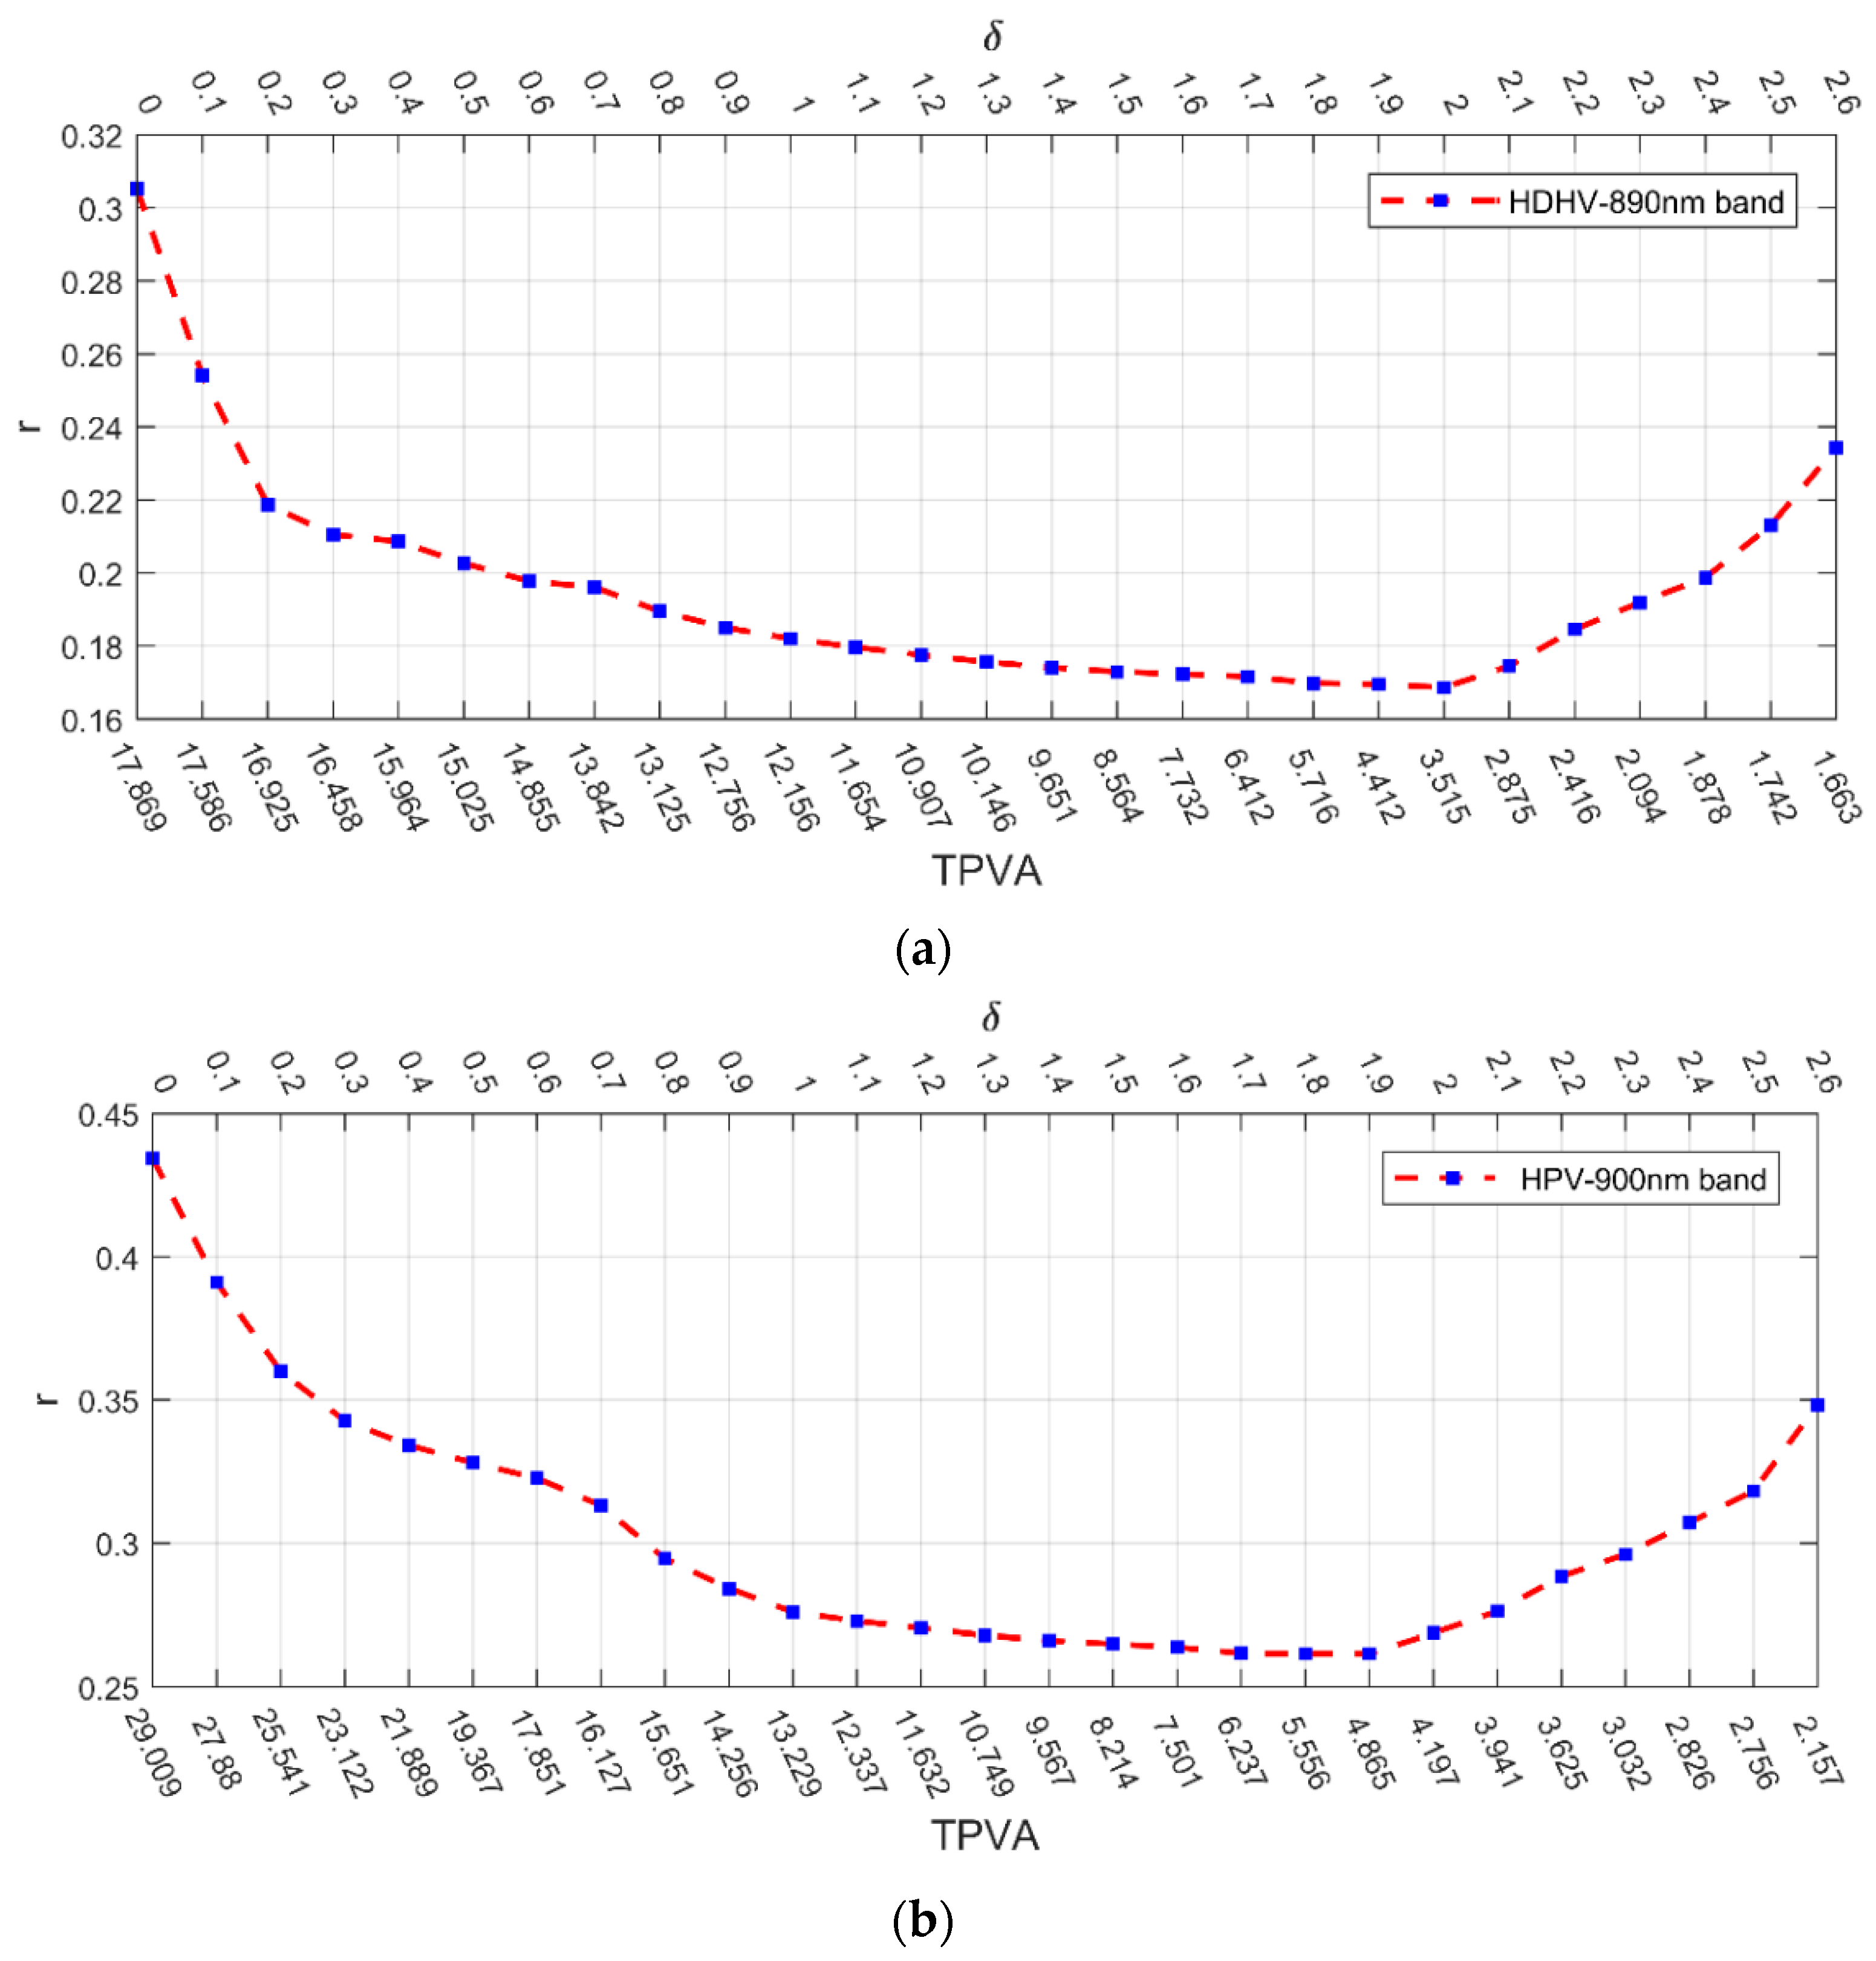
The best performing band in the identification phase from the hyperspectral (HDHV—890 nm and HPV—900 nm) hand databases was chosen for analysis. Based on the local features extracted from these databases, the r values were calculated via Equation (8), where a smaller r value signifies a more discriminative local feature. Figure 15 depicts that after being convolved with different Gaussian filters, the r value first decreased and then increased, which indicates that the local features have the most discrimination in the optimal acutance range obtained from the previous subsection (see Table 2). Therefore, by adjusting image acutance, the local feature from the hyperspectral and multispectral hand databases become discriminative resulting in a better performance.

3.5. Computation Time

The average computation time of each stage (in general hyperspectral/multispectral hand recognition) for a single image is shown in Table 3. Here, a ROI extraction time is not calculated since the proposed acutance adjustment is performed on an extracted ROI, which means the proposed method is performed after ROI extraction. As the proposed method of acutance adjustment adds only around 0.0229 s on average for the three databases, it is considered acceptable in real-world applications.

4. Conclusions

This paper presents an approach to improve hyperspectral hand recognition by adjusting image acutance. First, a thresholded pixel-wise acutance value (TPAV) for evaluating the image acutance was proposed. Next, Gaussian filters were applied to change the image acutance via image convolution, which acts as a preprocessing phase for discriminative local feature extraction. Finally, for each band in a hyperspectral hand database, the optimal acutance range can be determined based on TPAV. Experiments were extensively conducted on HDHV and HPV databases. The results validated the hypothesis that there exists an optimal acutance range for hyperspectral hand biometrics to reach its peak performance. To assess the generalization ability of our method, the PolyU multispectral palmprint database was experimented and confirmed the hypothesis as well. Even though on average it takes 0.0229 s for acutance adjustment (for a single image from the three datasets), the final result afterwards is significantly improved compared to the original (with no acutance adjustment).
In the future, we will investigate the properties of each band in hyperspectral hand biometrics, in order to design a more powerful local feature extraction method to achieve more discriminative feature representation. Besides this, we will study how best to combine deep learning or local features from different bands to achieve a better biometrics system.

Author Contributions

W.N. and B.Z. conceived and designed the experiments; W.N. performed the experiments and analyzed the data; W.N. and B.Z. wrote the paper; S.Z. performed the experiments.

Funding

This research was funded by the National Natural Science Foundation of China (61602540).

Acknowledgments

This work was supported by the National Natural Science Foundation of China (61602540).

Conflicts of Interest

The authors declare no conflict of interest.

References

  1. Barra, S.; De Marsico, M.; Nappi, M.; Narducci, F.; Riccio, D. A hand-based biometric system in visible light for mobile environments. Inf. Sci. 2019, 479, 472–485. [Google Scholar] [CrossRef]
  2. Klonowski, M.; Plata, M.; Syga, P. User authorization based on hand geometry without special equipment. Pattern Recognit. 2018, 73, 189–201. [Google Scholar] [CrossRef]
  3. Guo, J.M.; Hsia, C.H.; Liu, Y.F.; Yu, J.C.; Chu, M.H.; Le, T.N. Contact-free hand geometry-based identification system. Expert Syst. Appl. 2012, 39, 11728–11736. [Google Scholar] [CrossRef]
  4. Gupta, P.; Srivastava, S.; Gupta, P. An accurate infrared hand geometry and vein pattern based authentication system. Knowl.-Based Syst. 2016, 103, 143–155. [Google Scholar] [CrossRef]
  5. Zhong, D.X.; Shao, H.K.; Du, X.F. A Hand-Based Multi-Biometrics via Deep Hashing Network and Biometric Graph Matching. IEEE Trans. Inf. Forensics Secur. 2019, 14, 3140–3150. [Google Scholar] [CrossRef]
  6. Fei, L.K.; Zhang, B.; Xu, Y.; Guo, Z.H.; Wen, J.; Jia, W. Learning Discriminant Direction Binary Palmprint Descriptor. IEEE Trans. Image Process. 2019, 28, 3808–3820. [Google Scholar] [CrossRef]
  7. Zhong, D.X.; Du, X.F.; Zhong, K.C. Decade progress of palmprint recognition: A brief survey. Neurocomputing 2019, 328, 16–28. [Google Scholar] [CrossRef]
  8. Jia, W.; Zhang, B.; Lu, J.T.; Zhu, Y.H.; Zhao, Y.; Zuo, W.M.; Ling, H.B. Palmprint Recognition Based on Complete Direction Representation. IEEE Trans. Image Process. 2017, 26, 4483–4498. [Google Scholar] [CrossRef]
  9. Fei, L.K.; Lu, G.M.; Jia, W.; Teng, S.H.; Zhang, D. Feature Extraction Methods for Palmprint Recognition: A Survey and Evaluation. IEEE Trans. Syst. Man Cybern. Syst. 2019, 49, 346–363. [Google Scholar] [CrossRef]
  10. Zhong, D.X.; Shao, H.K.; Liu, S.M. Towards application of dorsal hand vein recognition under uncontrolled environment based on biometric graph matching. IET Biom. 2019, 8, 159–167. [Google Scholar] [CrossRef]
  11. Wang, Y.D.; Xie, W.; Yu, X.J.; Shark, L.K. An Automatic Physical Access Control System Based on Hand Vein Biometric Identification. IEEE Trans. Consum. Electron. 2015, 61, 320–327. [Google Scholar] [CrossRef]
  12. Huang, D.; Zhang, R.K.; Yin, Y.A.; Wang, Y.D.; Wang, Y.H. Local feature approach to dorsal hand vein recognition by Centroid-based Circular Key-point Grid and fine-grained matching. Image Vis. Comput. 2017, 58, 266–277. [Google Scholar] [CrossRef]
  13. Wu, W.; Elliott, S.J.; Lin, S.; Yuan, W.Q. Low-cost biometric recognition system based on NIR palm vein image. IET Biom. 2019, 8, 206–214. [Google Scholar] [CrossRef]
  14. Yan, X.K.; Kang, W.X.; Deng, F.Q.; Wu, Q.X. Palm vein recognition based on multi-sampling and feature-level fusion. Neurocomputing 2015, 151, 798–807. [Google Scholar] [CrossRef]
  15. Ma, S.; Tao, Z.; Yang, X.F.; Yu, Y.; Zhou, X.; Li, Z.W. Bathymetry Retrieval from Hyperspectral Remote Sensing Data in Optical-Shallow Water. IEEE Trans. Geosci. Remote Sens. 2014, 52, 1205–1212. [Google Scholar] [CrossRef]
  16. Wang, W.X.; Fu, Y.T.; Dong, F.; Li, F. Semantic segmentation of remote sensing ship image via a convolutional neural networks model. IET Image Process. 2019, 13, 1016–1022. [Google Scholar] [CrossRef]
  17. Lakhal, M.I.; Cevikalp, H.; Escalera, S.; Ofli, F. Recurrent neural networks for remote sensing image classification. IET Comput. Vis. 2018, 12, 1040–1045. [Google Scholar] [CrossRef] [Green Version]
  18. Chen, G.Y.; Li, C.J.; Sun, W. Hyperspectral face recognition via feature extraction and CRC-based classifier. IET Image Process. 2017, 11, 266–272. [Google Scholar] [CrossRef]
  19. Ferrer, M.A.; Morales, A.; Diaz, A. An approach to SWIR hyperspectral hand biometrics. Inf. Sci. 2014, 268, 3–19. [Google Scholar] [CrossRef]
  20. Pan, Z.H.; Healey, G.; Prasad, M.; Tromberg, B. Face recognition in hyperspectral images. IEEE Trans. Pattern Anal. Mach. Intell. 2003, 25, 1552–1560. [Google Scholar]
  21. Wang, L.; Leedham, G. Near- and Far-Infrared Imaging for Vein Pattern Biometrics. In Proceedings of the 2006 IEEE International Conference on Video and Signal Based Surveillance, Sydney, Australia, 22–24 November 2006; p. 52. [Google Scholar]
  22. Fei, L.K.; Zhang, B.; Zhang, W.; Teng, S.H. Local apparent and latent direction extraction for palmprint recognition. Inf. Sci. 2019, 473, 59–72. [Google Scholar] [CrossRef]
  23. Zhang, D.; Zhenhua, G.; Guangming, L.; Lei, Z.; Wangmeng, Z. An Online System of Multispectral Palmprint Verification. IEEE Trans. Instrum. Meas. 2010, 59, 480–490. [Google Scholar] [CrossRef]
  24. Hong, D.; Liu, W.; Su, J.; Pan, Z.; Wang, G. A novel hierarchical approach for multispectral palmprint recognition. Neurocomputing 2015, 151, 511–521. [Google Scholar] [CrossRef]
  25. Guo, Z.; Zhang, D.; Zhang, L.; Liu, W. Feature Band Selection for Online Multispectral Palmprint Recognition. IEEE Trans. Inf. Forensics Secur. 2012, 7, 1094–1099. [Google Scholar] [CrossRef]
  26. Rice, A. A Quality Approach to Biometric Imaging. Available online: https://ieeexplore.ieee.org/document/307921 (accessed on 6 October 2019).
  27. Huang, D.; Zhu, X.R.; Wang, Y.H.; Zhang, D. Dorsal hand vein recognition via hierarchical combination of texture and shape clues. Neurocomputing 2016, 214, 815–828. [Google Scholar] [CrossRef]
  28. Wang, J.; Wang, G.; Zhou, M. Bimodal Vein Data Mining via Cross-Selected-Domain Knowledge Transfer. IEEE Trans. Inf. Forensics Secur. 2018, 13, 733–744. [Google Scholar] [CrossRef]
  29. Chuang, S.-J. Vein recognition based on minutiae features in the dorsal venous network of the hand. Signal Image Video Process. 2017, 12, 573–581. [Google Scholar] [CrossRef]
  30. Chen, K.; Zhang, D. Band Selection for Improvement of Dorsal Hand Recognition. In Proceedings of the 2011 International Conference on Hand-Based Biometrics, Hong Kong, China, 17–18 November 2011; pp. 1–4. [Google Scholar]
  31. Chen, X.; Zhou, Z.H.; Zhang, J.S.; Liu, Z.L.; Huang, Q.S. Local convex-and-concave pattern: An effective texture descriptor. Inf. Sci. 2016, 363, 120–139. [Google Scholar] [CrossRef]
  32. Liu, L.; Chen, J.; Fieguth, P.; Zhao, G.Y.; Chellappa, R.; Pietikainen, M. From BoW to CNN: Two Decades of Texture Representation for Texture Classification. Int. J. Comput. Vis. 2019, 127, 74–109. [Google Scholar] [CrossRef]
  33. Wu, X.Q.; Zhang, D.; Wang, K.Q. Palm line extraction and matching for personal authentication. IEEE Trans. Syst. Man Cybern. Part A Syst. Hum. 2006, 36, 978–987. [Google Scholar] [CrossRef]
  34. Zhang, D.; Kong, W.K.; You, J.; Wong, M. Online palmprint identification. IEEE Trans. Pattern Anal. Mach. Intell. 2003, 25, 1041–1050. [Google Scholar] [CrossRef] [Green Version]
  35. Xu, Y.; Fei, L.K.; Wen, J.; Zhang, D. Discriminative and Robust Competitive Code for Palmprint Recognition. IEEE Trans. Syst. Man Cybern. Syst. 2018, 48, 232–241. [Google Scholar] [CrossRef]
  36. Wang, Y.D.; Zhang, K.; Shark, L.K. Personal identification based on multiple keypoint sets of dorsal hand vein images. IET Biom. 2014, 3, 234–245. [Google Scholar] [CrossRef]
  37. Lee, J.C.; Lo, T.M.; Chang, C.P. Dorsal hand vein recognition based on directional filter bank. Signal Image Video Process. 2016, 10, 145–152. [Google Scholar] [CrossRef]
  38. Yao, Z.G.; Le Bars, J.M.; Charrier, C.; Rosenberger, C. Literature review of fingerprint quality assessment and its evaluation. IET Biom. 2016, 5, 243–251. [Google Scholar] [CrossRef]
  39. Abhyankar, A.; Schuckers, S. Iris quality assessment and bi-orthogonal wavelet based encoding for recognition. Pattern Recognit. 2009, 42, 1878–1894. [Google Scholar] [CrossRef]
  40. Abaza, A.; Harrison, M.A.; Bourlai, T.; Ross, A. Design and evaluation of photometric image quality measures for effective face recognition. IET Biom. 2014, 3, 314–324. [Google Scholar] [CrossRef] [Green Version]
  41. Wang, J.; Wang, G.Q. Quality-Specific Hand Vein Recognition System. IEEE Trans. Inf. Forensics Secur. 2017, 12, 2599–2610. [Google Scholar] [CrossRef]
  42. Zhang, K.N.; Huang, D.; Zhang, B.; Zhang, D. Improving texture analysis performance in biometrics by adjusting image sharpness. Pattern Recognit. 2017, 66, 16–25. [Google Scholar] [CrossRef]
  43. Krotkov, E. Focusing. Int. J. Comput. Vis. 1988, 1, 223–237. [Google Scholar] [CrossRef]
  44. Wang, H.-N.; Zhong, W.; WANG, J.; XIA, D. Research of measurement for digital image definition. J. Image Graph. 2004, 9, 828–831. [Google Scholar]
  45. Jain, A.K.; Duin, R.P.W.; Mao, J.C. Statistical pattern recognition: A review. IEEE Trans. Pattern Anal. Mach. Intell. 2000, 22, 4–37. [Google Scholar] [CrossRef]
  46. Russakovsky, O.; Deng, J.; Su, H.; Krause, J.; Satheesh, S.; Ma, S.; Huang, Z.H.; Karpathy, A.; Khosla, A.; Bernstein, M.; et al. ImageNet Large Scale Visual Recognition Challenge. Int. J. Comput. Vis. 2015, 115, 211–252. [Google Scholar] [CrossRef] [Green Version]
  47. Li, X.X.; Huang, D.; Wang, Y.H. Comparative Study of Deep Learning Methods on Dorsal Hand Vein Recognition. In Proceedings of the Chinese Conference on Biometric Recognition, Chengdu, China, 14–16 October 2016; pp. 296–306. [Google Scholar]
  48. Bishop, C.M. Pattern Recognition and Machine Learning; Springer: New York, NY, USA, 2006; pp. 186–189. [Google Scholar]
Figure 1. Image acutance adjusting phase in hyperspectral hand recognition.
Applsci 09 04178 g001
Figure 2. Acutance evaluations on an 850 nm dorsal hand vein region of interest (ROI) image using different methods. (a) Original ROI with Tenengrad = 6.992, edge acutance value (EAV) = 12.214, and thresholded pixel-wise acutance value (TPAV) = 15.226; (b) Rotated ROI with Tenengrad = 9.816 (+40.4%), EAV = 13.853 (+13.4%), and TPAV = 14.140 (−7.1%); (c) Noisy ROI with Tenengrad = 7.549 (+7.9%), EAV = 23.265 (+90.5%), and TPAV = 16.685 (+9.6%).
Applsci 09 04178 g002
Figure 3. Dorsal hand vein image from 850 nm with different TPAVs after filtering. (a) TPAV = 15.3242 from the original ROI; (b) TPAV = 6.7584 with δ = 1.8; (c) TPAV = 2.7206 with δ = 2.6.
Applsci 09 04178 g003
Figure 4. Palm vein image from 850 nm with different TPAVs after filtering. (a) TPAV = 20.2188 from the original ROI; (b) TPAV = 8.7939 with δ = 1.8; (c) TPAV = 1.7296 with δ = 2.6.
Applsci 09 04178 g004
Figure 5. The optimal acutance range of the image on the TPAV axis.
Applsci 09 04178 g005
Figure 6. Hyperspectral dorsal hand vein (HDHV) samples from different spectra. (a) 560 nm; (b) 660 nm; (c) 760 nm; (d) 860 nm; (e) 960 nm.
Applsci 09 04178 g006
Figure 7. Hyperspectral palm vein (HPV) samples from different spectra. (a) 560 nm; (b) 660 nm; (c) 760 nm; (d) 860 nm; (e) 960 nm.
Applsci 09 04178 g007
Figure 8. PolyU MPP (The Hong Kong Polytechnic University Multispectral Palm Print) samples from different spectra. (a) Red; (b) Green; (c) Blue; (d) NIR.
Applsci 09 04178 g008
Figure 9. Recognition rates (RR) with different acutance (corresponding to δ) for every band (spectrum) of HDHV using different local texture patterns. Results using the feature extraction methods of (a) regional local binary patterns (LBP); (b) deep features.
Applsci 09 04178 g009
Figure 10. Recognition rates (RR) with different acutance TPVA on a single band of HDHV with different local texture patterns. Results using the feature extraction methods of (a) regional LBP; (b) deep features.
Applsci 09 04178 g010
Figure 11. Recognition rates (RR) with different acutance (corresponding to δ) for every band (spectrum) of HPV using different local texture patterns. Results using the feature extraction methods of (a) CompCode; (b) deep features.
Applsci 09 04178 g011
Figure 12. Recognition rates (RR) with different acutance TPVA on a single band of HPV with different local texture patterns. Results using the feature extraction methods of (a) CompCode; (b) deep features.
Applsci 09 04178 g012
Figure 13. Recognition rates (RR) with different acutance (corresponding to δ) for every band (spectrum) of HPV using different local texture patterns. Results using the feature extraction methods of (a) CompCode; (b) deep features.
Applsci 09 04178 g013
Figure 14. Recognition rates (RR) with different acutance TPVA on the green band of HPV with different local texture patterns. Results using the feature extraction methods of (a) CompCode; (b) deep features.
Applsci 09 04178 g014
Figure 15. Discriminant proprieties with different acutance TPVA on (a) 890 nm band of HDHV database; (a) 900 nm band of HPV database. (The r value on the y axes is the ratio of within-class variance to between-class variance, where a smaller r value signifies a more discriminative property).
Applsci 09 04178 g015
Table 1. Results on representative spectral from the hyperspectral databases.
DatasetLocal PatternBand Optimal   Range   ( t 1 t 2 ) RR 1 (In Optimal Range)RR (Original Image)Improvement
HDHVReginal LBP890 nm3.515–6.4120.98330.95832.6%
All-0.95400.736529.5%
Deep feature890 nm3.515–6.4120.97500.95422.2%
All-0.84260.615436.9%
HPVCompCode900 nm4.865–6.2370.99280.791925.3%
All-0.89640.615245.7%
Deep feature900 nm4.865–6.2370.98090.789524.2%
All-0.73170.441465.7%
1 The best result in the optimal range.
Table 2. r values of single spectrum in optimal acutance range.
Spectrum Optimal   Range   ( t 1 t 2 ) r   1   ( In   Optimal   Range ) r (Original Image)
890 nm (HDHV)3.515–6.4120.16860.3052
900 nm (HPV)4.865–6.2370.26150.4344
1 The lowest value in the optimal range.
Table 3. Computation time (in seconds) of every stage in general hyperspectral/multispectral hand recognition (sans ROI extraction).
DatabaseAcutance AdjustingFeature ExtractionFeaturing MatchingTotal Time
HDHV0.02410.0153 10.01080.0502
HPV0.02250.0356 20.01350.0716
MPP0.02210.0345 20.01660.0732
1 Regional LBP method. 2 CompCode method.