1. Introduction
Although robots are widely used in underwater environments to create maps (topological maps or seafloor mosaics), these are typically created by a single robotic agent without interaction or support from other agents. Adding help from other agents can benefit the created map by enriching with more information from cameras with better resolution or even with information from other points of view. In addition to the use of other robotic agents, it can be helpful to include information captured by humans into the mapping process. A diver could provide images from parts of the coral reef that are of interest to other researchers. For example, while a robot can be programmed to follow a zig-zag trajectory above a coral reef, a human can navigate the same environment closer to certain species of coral, thereby providing detailed images from the areas of interest. However, creating a map of information from more than one agent is not trivial, specifically because it is necessary to recognize the same places in images taken with different cameras, under different environmental conditions, and with different points of view. Moreover, the information captured by a diver can be more challenging to handle with regard to point of view variations because it is more difficult for human explorers in these environments to maintain a constant orientation and distance with respect to the seafloor compared to robotic agents. Therefore, to recognize places in different images (loop closure detection), whether they are captured by the same agent or not, one of the most relevant challenges to tackle is generating a robust image description that allows the identification of two images taken from the same place despite changes in appearance and point of view. It also should be distinctive enough to discard two similar images from different places.
With respect to the image description, there are two main approaches: using a global descriptor for the whole image (e.g., Pyramid Histogram of Oriented Gradients [
1]) or describing an image with respect to the contained local features (e.g., Speed-Up Robust Features [
2]). However, combinations of both approaches can also be applied. One of the most known methods for visual place recognition is FAB-MAP [
3], where local features are used to generate a Bag of Visual Words (BoVW) [
4] to describe images with respect to the frequency of occurrence of features contained in a codebook or dictionary. This method uses a Chow-Liu tree to approximate the dependency between the occurrence of the detected visual features. They have obtained very good results for outdoor environments despite the existence of perceptual aliasing (i.e., images that are perceptually similar but from different scenes). A dictionary or codebook for this kind of method is a collection of representative visual features that can be found in the environment of interest and it is typically built by clustering similar local features extracted from a sample of images of the environment. The use of a dictionary helps to improve the efficiency of the method, as an image can be described only in terms of the presence of the features contained in the dictionary.
The overall performance of a Bag of Visual Words method depends on having good features in the codebook. It is important to mention that there are also approaches [
5,
6] that incrementally create a dictionary, i.e., they cluster similar features into visual words as they are extracted. If a feature is not similar to any of the existing features in the codebook, it is added as a new visual word. In [
5], instead of describing an image directly with regard to the frequency of occurrence of visual words, they focus on registering in which images each word from the vocabulary appears; this enables comparison between two images with respect to which visual words they share. Additionally, they used a Bayesian filtering technique to recognize previously seen places. Recently, the efficiency of incremental dictionaries has been improved by using binary features detected with ORB [
7]. Moreover, other approaches [
8] have shown that it is possible to use the Bayesian filtering technique without a dictionary. Instead, these store all of the features and index them within a kd-tree-based algorithm to match them efficiently.
It is important to remark that the aforementioned approaches describe the images with regard to local features extracted with methods such as SIFT [
9]. However, global image descriptors have also been used for place recognition. For example, in RatSLAM [
10] a scan line intensity profile is used to globally describe images extracted from a suburb. A scan line is a one-dimensional vector formed by summing the intensity values in each column of the image. In [
11], a patch-normalized reduced panoramic image of the surroundings is used directly as the descriptor. Despite the simplicity of the aforementioned descriptors, they both have been shown to perform well. However, for place recognition tasks, the global descriptors are more negatively affected if the images were captured from different points of view compared to describing scenes with local features. There are methods that combine both kinds of descriptors, for example in [
12], where they use a Pyramid Histogram of Oriented Gradients (PHOG) [
1] as a global descriptor to summarize neighboring images in the environment and local features detected with FAST [
13] and described using a binary descriptor to find the similarities between the images. Recently, Convolutional Neural Networks (CNNs) have been used to generate global descriptor for images. For example, a pre-trained CNN, OverFeat [
14], has been utilized to describe scenes and to match them to recognize places [
15]. In [
16], descriptors extracted from the CNN proposed in [
17] are thoroughly evaluated for visual place recognition tasks. They found that the use of CNN-based descriptors can improve the recognition of places when there are changes in points of view and appearance.
The previous approaches have focused on recognizing places by finding similarities between single images, however, other methods are based on matching sequences of images. The objective of matching sequences is to gain robustness against changes in the environment. For example, SeqSLAM [
18] has been used to recognize places across different hours of the day or seasons of the year. More recently, in [
19], they adapted SeqSLAM to include metric information and different filtering techniques to map outdoor environments. Inspired by SeqSLAM, other methods have been proposed that focus on reducing its time complexity. In [
20], they proposed the use of a particle filter to avoid computing matching scores for all of the candidate sequences in the map. Other methods search among sequences defined by the most likely initial matching images [
21]. An important drawback to notice is that those methods are designed to look for matching sequences in a given set of images obtained from a previous navigation in the environment.
Despite the extraordinary results obtained by the aforementioned methods, their direct application to underwater environments is not always possible, mainly due to the inherent challenges of these places such as changes in illumination, color degradation, variable conditions in the environment due to sea currents, and low density of reliable visual features for tracking. Despite of that, in [
22], the authors propose a method based on the use of an incremental BoVW to describe underwater imagery and generated good results. In [
23], they used a Bayesian filtering technique similar to the one proposed in [
8] to find loop closures in images obtained from explorations of coral reefs. There are other works that also perform mapping tasks in underwater environments using information from other sensors in addition to images. In [
24,
25] RatSLAM has been extended to underwater environments by combining information from cameras, Doppler velocity logs (DVLs), and inertial measurement units (IMU). In [
26] the problem of Simultaneous Localization and Mapping (SLAM) is tackled with a non-linear optimization framework adapted from [
27] fusing information from a sensor suite composed of stereo cameras, an IMU, a Sonar and a pressure sensor. These works have obtained very good results in challenging environments. However, in this work, we are interested on creating the topological maps only with images as this will facilitate the incorporation of information, particularly for humans as they will only required a camera.
In terms of multi-robot mapping, a remarkable system that has achieved good results in underwater environments is described in [
28]. They combine information from the cameras mounted on each robot with the relative positions between them being relayed by acoustic signals. They have applied this approach successfully to real-life scenarios, thereby obtaining 3D representations of the explored underwater environment. However, the application of this approach requires the use of information from other sensors, which may not be available in other multi-robot systems.
Another approach that creates a mosaic of the floor with images obtained from a multi-robot system is MGRAPH [
29]. This method fuses mosaics from a swarm of unmanned aerial vehicles to create a bigger representation of the environment. The place recognition component is based on directly matching ORB features between the current image and the ones near to it using geographic information obtained from a Global Positioning System mounted on each member of the swarm. While it has generated good results, this approach has only been tested in aerial robots. Conversely, the solution provided in [
30] relies only on visual information. They efficiently compare subsets of SIFT features extracted from the images to recognize places and obtain a mosaic of the seafloor. However, this method requires all of the images that will contribute to the map when creating it.
For this work, we are interested in creating and expanding topological maps of underwater environments using only visual information from different collaborative agents. Therefore, we required a solution able to recognize places despite changes in appearance and points of view. Moreover, we are interested in a solution that can create maps incrementally so a robotic agent can map the environment while it is exploring it. As we have described for the aforementioned approaches, the methods based on matching sequences of images have shown promising results when dealing with changes in appearance. However, these kinds of methods have two main drawbacks that must be tackled for our application: the methods are executed offline, that is, they require all of the images to create a map and the typical sequence-based approaches use global descriptors that may not optimally manage changes in point of view. To address these issues, we propose an incremental, sequence-based method for recognizing previously visited places that uses local visual features to improve the invariance to the point of view from which the scenes are captured. Our work is based on the idea of matching sequences of images from a similarity matrix like in FastSeqSLAM [
21]. We use a voting scheme combined with an inverted index of local features to incrementally calculate a similarity matrix, from which candidate sequences of matching images can be found by looking for the trajectory lines with the highest scores of similarity. In [
18], those trajectory lines are defined by a set of slopes within a certain range, however, as the similarity matrix is a raster 2D-structure, not all of these slopes will necessarily define different trajectories. In our work, we consider the similarity matrix as a raster image, therefore, we can define a sequence of images as a raster line in that matrix. The elements in the line are obtained by applying Bresenham’s line algorithm [
31]. It is worth noting that the similarity matrix obtained from the voting scheme and local features is sparse enough to only start looking for corresponding sequences of images at certain locations within the similarity matrix. It is important to mention that other algorithms for line detection in raster images, as some variations of the Hough transform [
32,
33] can be used. However, it will be necessary to execute any of these methods every time a new image is processed. On the other hand, the use of the Bresenham’s line algorithm allows to calculate the possible trajectories for searching for lines before starting the mapping method and only evaluate them in certain locations to find if a candidate line represents a sequence of matching images. We have also incorporated a visual odometry algorithm into our method that captures the approximate spatial distribution of the images with respect to the environment.
We have executed different experiments in real-life scenarios to evaluate the performance of our method for visual place recognition. In addition to the challenge of using images captured by different agents under varying conditions, we have evaluated the performance for visual place recognition when fewer images are utilized. This is intended to assess the applicability of our method to platforms where one must reduce the number of images to process due to computational or storage limitations. As we mentioned before, we intend for this method to be utilized directly on robotic platforms to create the map while exploring. The experimental results show that our method overcomes all of these challenges. Finally, we evaluated the impact of using a few images in the recovered spatial distribution of the maps obtained using our approach. We have found that there are small differences in the spatial distribution when using a few images but they are not impactful relative to the area covered by the map.
2. Method
In this section, we present our method for creating topological maps of a coral reef from visual information provided by different agents. The overview of the proposed method is presented in
Figure 1. The topological map is represented as a graph
with nodes
V and edges
E. Each of the nodes and edges of the graph contains the following information:
Nodes: Each node contains an identification number
l, an image
and its visual features
.
is the list of
coordinates of each visual feature and
is the list of 1D vectors describing the appearance of each feature. For this work, we have utilized SURF [
2] as feature extractor since it has shown good results for tracking in underwater environments [
34]. However, other methods can be used for extracting visual features. In addition to that information, the graph contains the pose
of the image with respect to the first node.
Edges: An edge contains the spatial relation between two nodes and , i.e., their relative position with respect to each other encoded as and , where is the center of the image with respect to the image and is the orientation of image i with respect to the x-axis of the image j and vice versa. An edge is added when a valid relative position between the node i and j exists.
With respect to the images, the following assumptions were taken into account:
The images are taken from above the coral reef with the image plane parallel to the seafloor.
During the exploration, the agent keeps approximately the same distance from the coral reef. However, in different explorations, the agent can move to other distances.
The images from a single agent should be presented to the method in the same order as they were captured during the exploration. This is intended to exploit their temporal and spatial coherence.
The proposed method is intended to be used in an offline and online mode, that is, the map can be created once the exploration has finished and all of the images are available (offline mode) or while exploring the environment (online mode). To deal with both cases, the method is designed to process the images incrementally, that is, they are processed one by one as they are extracted from a camera during exploration or read from a storage device after exploring. Therefore, when processing image , we do not know any information about . The main parts of the method are described in detail in the following sections.
2.1. Keyframe Selection for Adding Nodes to the Map
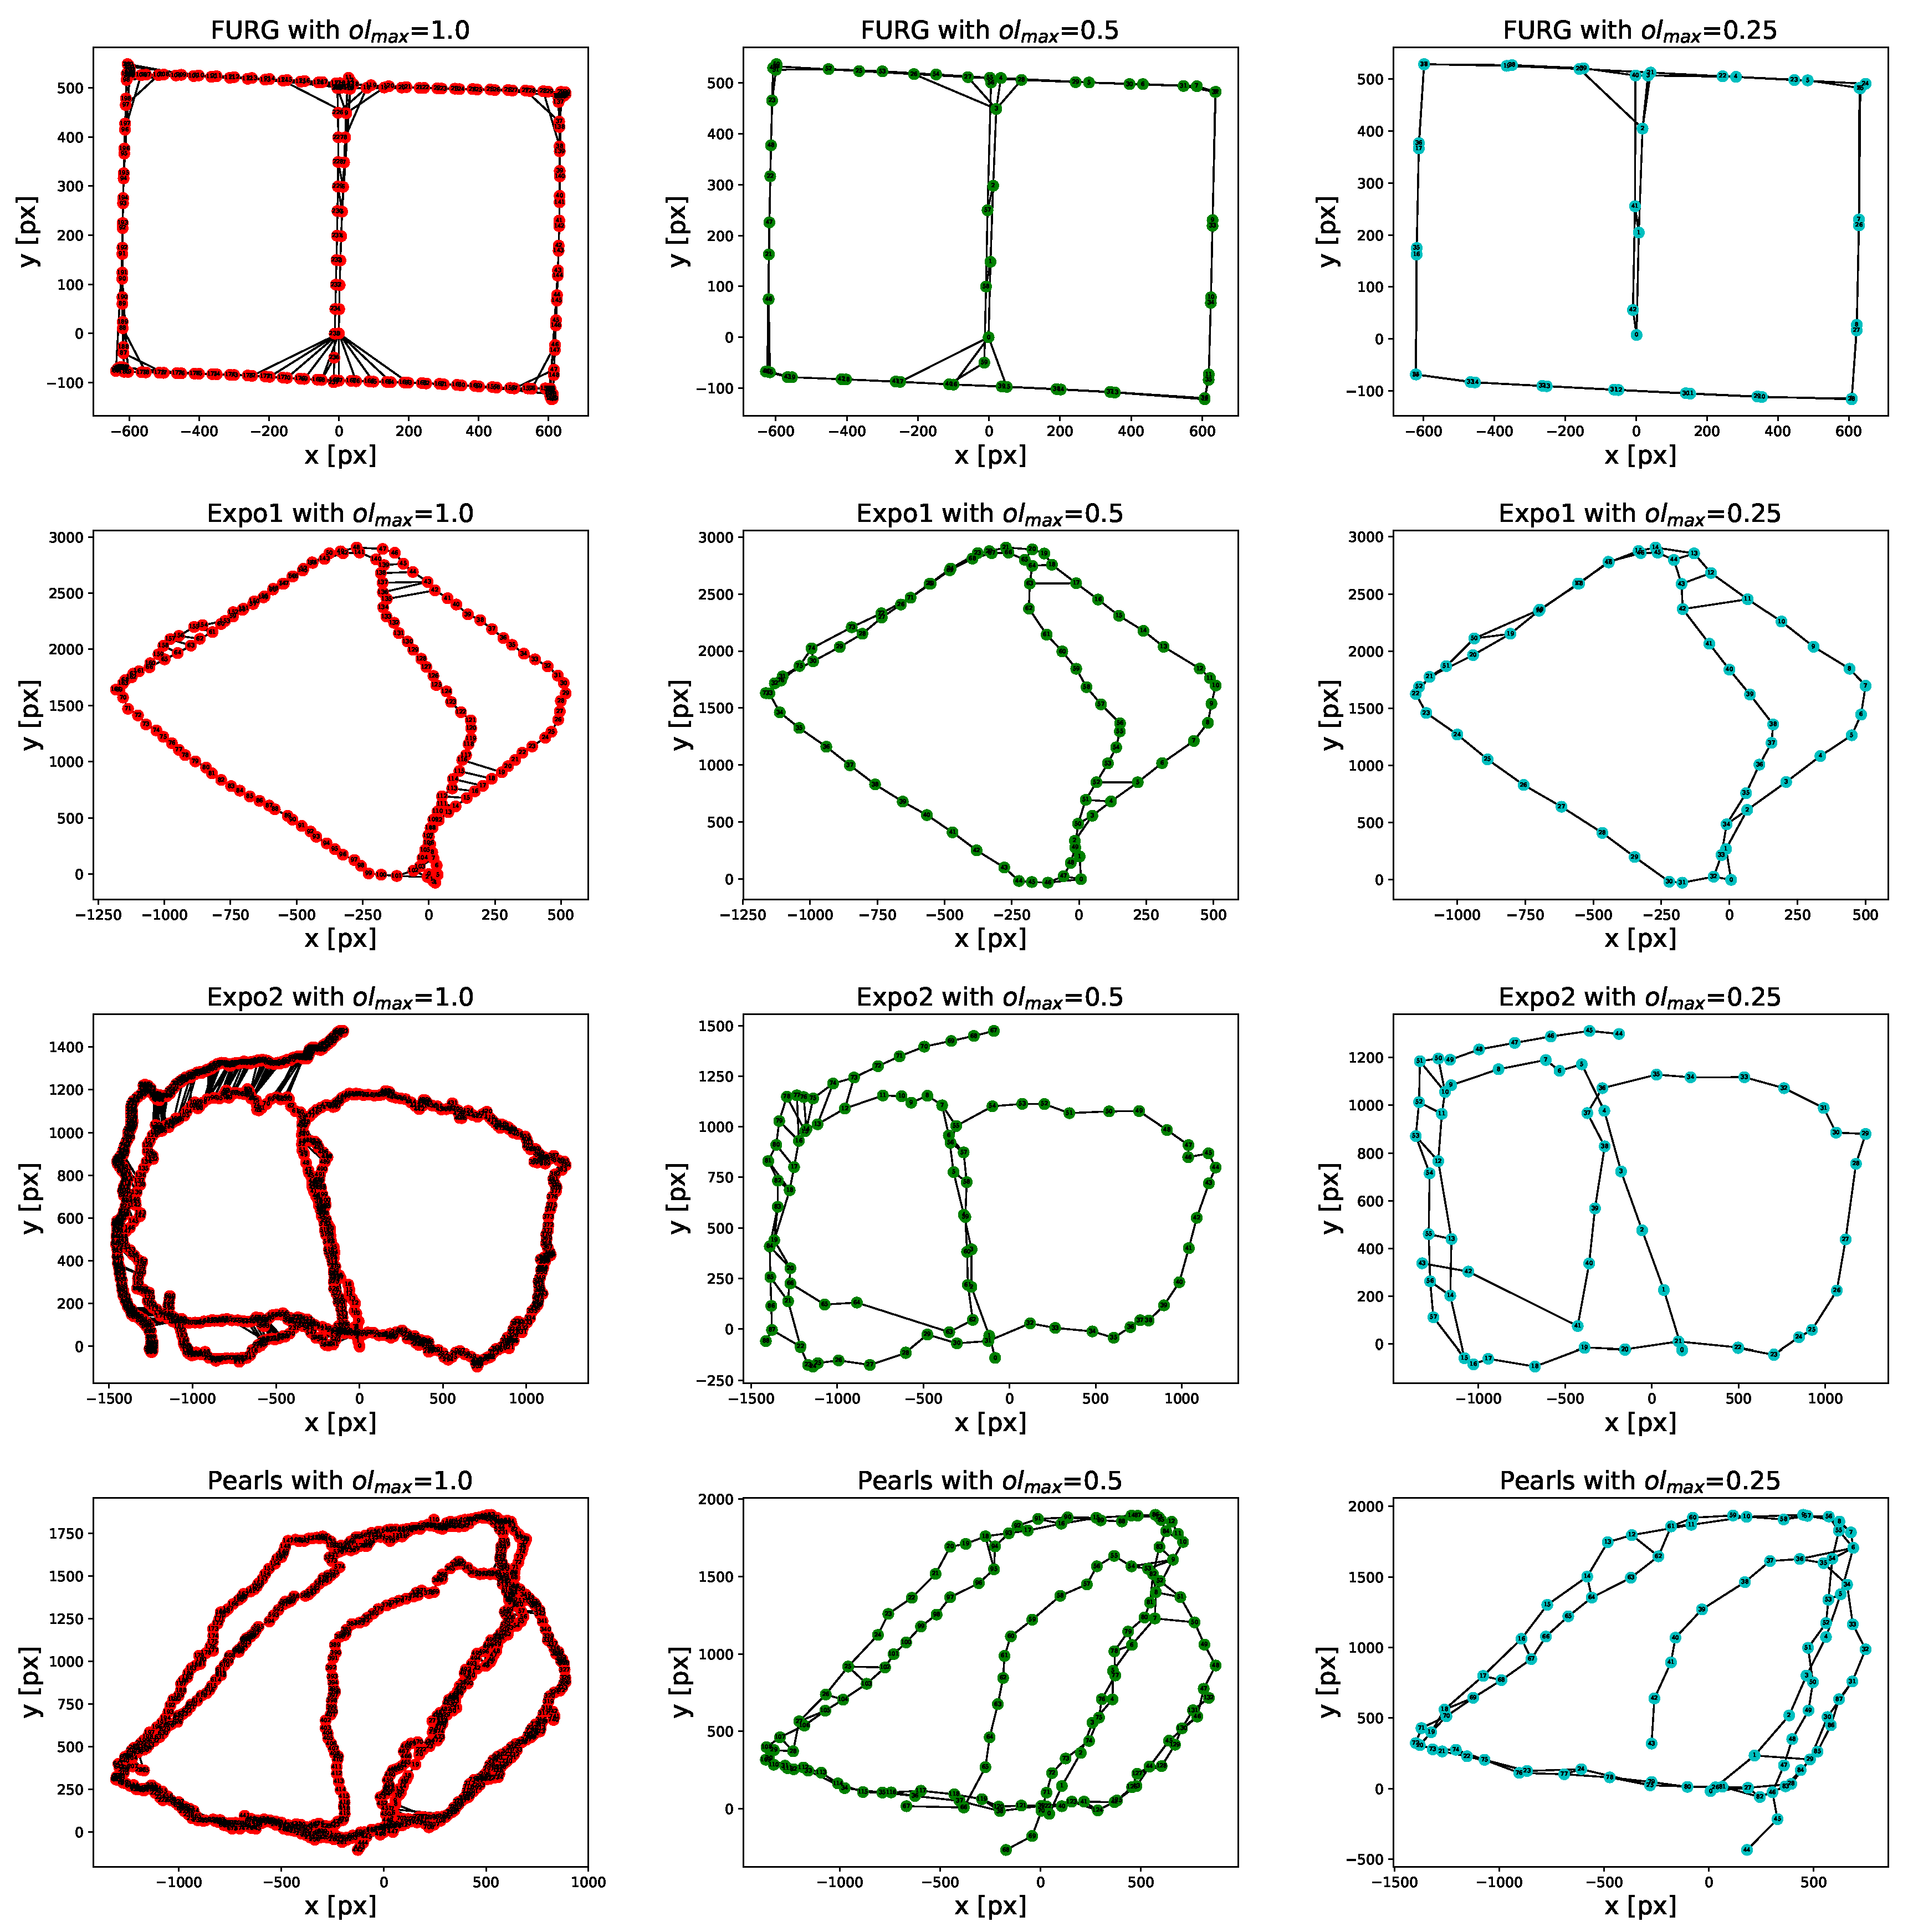
Although it is possible to add every image of the sequence to the map, it will increase the processing time as more information has to be processed. Additionally, considering the typical frame rate of the cameras (30 or 60 frames per second), it is very likely that consecutive images contains repeated visual information. Therefore, only certain images (keyframes) are added to the graph and used in the rest of the processing pipeline. In this work, the keyframe selection criteria is based on keeping the overlapping area between them less than a maximum value .
Let
be the image added as the last node in the graph and
the current image, then
is added to the graph if the overlapping area between both images is less than a threshold
. To calculate the overlap, the relative position of
with respect to
is required. This relation is encoded as a rigid transformation
defined as:
where
and
. Then, this transformation is applied to the four corners of
to obtain the corners’ position of
with respect to
, as shown in
Figure 2. The overlap is calculated as the intersecting area of the rectangles defined by the two sets of corners divided by the area of
. In the case of raster images (e.g., those obtained from digital cameras), the overlapping area can be calculated by simply counting the pixels in the intersecting area.
To find a rigid transformation between two images and , we need to find the common visual features in both of them by following the next procedure:
For each visual feature descriptor
in
, its two most similar descriptors
and
in
are found. If the ratio between
is less than a threshold
, then the pair of indexes
is stored in a set
. The matching of descriptors is efficiently performed using the Fast Library for Nearest Neighbors search (FLANN) [
35]. This is specialized to work on high-dimensional spaces, which is the case for the 64-dimensional descriptors obtained with SURF.
Step 1 is applied to obtain the pairs of corresponding features from image to and stored in .
Only the pairs of indexes that appear in both and are kept and stored in a set m.
Given the set of matching features
m, the rigid transformation in (
1) can be estimated by finding the matrix
that minimizes the following expression:
where
is the Euclidean norm. It is important to mention that the features’ positions
f are extended to be of the form
so they can be multiplied by the rigid transformation as defined in (
1).
Although
can be estimated directly from
and
there can be some cases where not enough corresponding features are found, causing a bad estimation of the rigid transformation. That is why
is calculated by concatenating all the rigid transformations between consecutive frames from
to
:
where
k is the index of the next image in the sequence after image
was added to the graph. This way, the rigid transformation is more likely to be correctly estimated as the displacement between consecutive images
and
is smaller than between the last keyframe
and the current image
. Then, if the overlap between
and
is less than the maximum overlap
,
and its associated visual features are used to created a node
. Otherwise, image
is not added to the graph, but its rigid transformation is preserved to estimate the transformation from the next image. The position for the new added node is obtained from the rigid transformation:
where
can be obtained from the pose information in
with the expression (
1). The pose in
can be extracted from the rigid transformation
with the following expression:
An edge
is also added to graph with the relative positions between node
and
which can be obtained from
. The pose
and
can be obtained from
and its inverse
by following the expression (
5) respectively.
This process can be executed as the images are read from the storage or a camera and does not depend on knowing information about the next frame. Finally, it is important to mention that when the graph is empty the first image is added directly as node with pose .
2.2. Sparse Similarity Calculation
Before recognizing previously visited places, a measure of similarity between the images in required. Ideally, the features in an image
would be compared against all the other images, thus obtaining a similarity matrix
S. Each entry
in this matrix contains the similarity between the node
i and
j. However, the process of directly comparing the features from every image is computationally expensive. An alternative is to calculate an approximation
to that similarity matrix
S as shown in
Figure 3.
The similarity matrix is updated every time a new node is added to the graph. Let be the last added node to the graph and the set of all nodes from 0 to with the number of ignored nodes before the last one (this is to avoid recognizing recently added images since they are likely to be similar to the one currently being added). We initialize a vector of votes with zeros. Then, for each descriptor , the most similar descriptor and the second most similar descriptor from all the features in the set are obtained, being M and N the images where these features appear. If is less than a threshold we sum 1 to the Mth entry in v. To find the two most similar descriptors we utilized FLANN.
After the vector of votes has been calculated, it is normalized in the range
. Then, it is added as the last row in the matrix
. We add the necessary zeros into the matrix to keep a consistent dimension since every newly stacked vector of votes is larger than the previous one. An example of a similarity matrix obtained with this voting scheme is shown in
Figure 3. Despite the noisy entries with high similarity values, the diagonals resultant from the sequences of similar images can still be observed. In the next section, we present a method to deal with these noisy entries by looking for predefined sets of lines with high similarity.
2.3. Matching Sequences of Images
As seen in
Figure 3, the obtained similarity matrix is sparse, as only a few entries contain non-zero values. It can be seen that line-like patterns tend to appear in the matrix. Lines out of the main diagonal indicate sequences of different images taken from the same place. Looking for those line-like patterns is the core idea to match sequences of images in some approaches, for example, in SeqSLAM [
18], a set of lines, defined by a range of slopes (determined by a minimum and a maximum slope as well as an increment), is utilized to look for possible sequences in the similarity matrix. These slopes are related to the speed of the camera traversing the environment. However, in imagery obtained from underwater explorations the speed of the camera is more difficult to enclose in a range, as it can be significantly affected by external forces such as strong currents (either when attached to a robot or held by a diver) in the environment. Additionally, when the camera is looking downwards and the exploring agent travels through the same place in the opposite direction that it previously did, the generated images in the sequence will have a reversed order. Therefore, it may be necessary to define the set of lines to look for in a different way.
Other approaches use graph-searching techniques to find the sequences of images in the similarity matrix that minimize a certain cost function [
36,
37]. By doing this, they can look for other more general patterns for sequences of similar images instead of just lines, however, the computational cost of searching for the shortest path in graph-based solutions is higher than simply evaluating a predefined set of lines, as in SeqSLAM. For this work, we have followed the approach presented in SeqSLAM in respect of looking for lines, but instead of using a set of lines defined in a range of slopes, we look for all the possible set of lines starting at a certain point in the similarity matrix. This way we can search for line-like independently of the speed of the camera or its direction when traversing the environment. To do this, we treat the similarity matrix as a raster image and use Bresenham’s line algorithm [
31] to define the set of lines representing the possible sequences of similar images. Bresenham’s line is a computer graphics algorithm that is used to draw lines efficiently between two points in a raster image.
To reduce the computational cost of calculating the lines every time they are needed, we generate them at the beginning of the algorithm. To do this, a grid of
rows and
columns is defined with the
coordinate in the middle of the bottom row as shown in
Figure 4. The value of
d indicates the length of the sequence to be found. Then, we apply the Bresenham algorithm to the pair of points defined by
and every point
in the perimeter of the grid. The Bresenham algorithm will generate a sequence of integer coordinates
for every pair of points. The set of all base lines
will be denoted as
C.
To incrementally find a matching sequence of images in
, it is only necessary to find lines starting in the last row of the similarity matrix. Only the entries
in the last row with similarity values higher than a threshold
are taken into account as starting points. Let
be the set of sequences obtained from translating
C to every starting point
. The set
can be obtained from
C by adding
to every coordinate pair in it. After that, the line
with the highest average sequence score from all
is obtained. If the average score of
is greater than a minimum value
the pair of images in that line are considered to be a matching sequence. Then, the matching node for
is
, where
is the second coordinate in
’s starting point. The process of finding the matching sequence is depicted in
Figure 5.
To confirm that node
and
represent the same place, a valid relative position between them should exists. To do find that relative position we apply the same process described in
Section 2.1. If a valid relative position is found, edge
is added to the graph to connect both nodes.
2.4. Graph Optimization and Scale Adjusting
The process described so far is useful to obtain a topological representation of the environment. However, some spatial inconsistencies can arise from accumulation of small errors when concatenating the relative positions between nodes. This is more notorious when recognizing previously visited places.
To improve the spatial consistency of the topological map, a graph-based position adjustment method can be used. In
Figure 6 we show an example of a topologically correct map and its associated mosaic with spatial inconsistencies after a previously visited place has been recognized and how it can be corrected with a graph-based position adjustment method.
To correct the spatial inconsistencies in our map, a graph-based position adjustment method, akin to the one presented in [
38], has been utilized. The main idea is to find the poses
for each node
i in the graph
in such a way that the following expression is minimized:
where
are the pair of nodes connected by the edges in the set
E. The difference function
is defined as:
The function
calculates the error between the position difference of
with respect to
; and their relative position in edge
. In Equation (
6), a matrix
is required, which is defined as the inverse of the covariance matrix
associated to the relative position
. In this work, we assume that the covariance matrix is defined as
. Although more complex models can be utilized, we have obtained good results using that simple definition. For this paper, we have employed
.
Given the definition of
and
;
can be found by minimizing the non-linear expression in (
6). We have follow the procedure described in [
38], which is based on approximating (
7) by its first order Taylor expression around the nodes’ positions in the graph before the adjustment, that is,
where
and
are the positions before adjustment and
is the Jacobian of
with respect to
evaluated in
and
is the Jacobian of
with respect to
evaluated in
. After substituting the linear approximation (
8) in (
6), a quadratic expression in terms of
and
is obtained. That expression can be differentiated for all
to obtain a system of linear equations and solved by any proper method to obtain
for every node
i in the graph. The adjusted position
for a node
i is obtained from:
This procedure is executed only when a previous visited place is recognized. The presented process is useful to correct spatial inconsistencies due to cumulative errors in the concatenation of rigid transformations, however, another source of spatial inconsistencies is the scale difference between the images from the same place.
Figure 7 contains an example of images taken from the same place but at different distances away from the scene.
The issue of different scales between images from the same scene occurs when dealing with images from different explorations, as we have assumed that during the same exploration, the agent will remain at a constant distance from the coral reef. To tackle this issue, we calculate the relative scale between the images from the two explorations. We will denote the map obtained from a previous exploration as
and
as the one currently being created. To calculate the relative scales between
and
, first, we need to recognize the same place in both maps. This is achieved by executing the procedure in
Section 2.3. Once the same place in both graphs has been identified, the scale
between both images can be estimated by solving the same expression in (
2) with
defined as:
As we assumed that the distance from the camera to the coral reef is kept constant during the same exploration, we only need to calculate the relative scale between and the first time that the same place is recognized. Once and the transformation between a pair of images from and have been obtained, it is only necessary to rescale the relative positions from all the edges in including the one that will be created when new images are processed. After that, every time the graph-based pose adjustment method is executed, will be automatically aligned with respect to .
5. Conclusions
In this paper, a novel method is proposed for creating topological maps of underwater environments using visual information provided by different exploring agents. As the visual information that is utilized was captured under different conditions and by different agents, a robust method to recognize previously seen places is needed. Without a robust approach, the collaboration between different agents to create a map would be more difficult. Our solution centers on sequence-based methods since they have shown good results in challenging environments with strong changes in appearance. Moreover, our method deals with images incrementally, which allows it to create a map online. Toward this end, we calculate the similarity matrix required in sequence-based methods, but in an incremental manner. A voting scheme combined with local visual features is utilized to generate a similarity vector (containing the similarity between the current image and the previous ones) that is added as the last row in the current similarity matrix. The calculated matrix is sparse enough to only look for sequences of matching images at certain points. In addition to the topological information between the images, the map also incorporates an approximation of the spatial structure by concatenating the relative positions between images. To maintain consistency in spatial structure, every time a place from previous images is recognized, the positions in the graphs are adjusted. Finally, to reduce the amount of repeated information that is added to the map we used a sampling method that only adds consecutive images with maximum intersecting areas.
The proposed method has been evaluated with regard to the Precision-Recall ability to recognize previously visited places when using images captured by different agents and when varying the keyframe selection criteria. As presented in the results, the proposed approach manages those factors by striking a compromise between the Precision-Recall and the number of keyframes added to the map. After, we compared the spatial structure of the map obtained after reducing the number of keyframes. We observed that there is no significant difference between the spatial structures when our method uses fewer images than those contained in the original dataset.
In terms of future work, we are interested in testing other types of local features, distinctive enough to require only a few of them, thereby, improving the scalability of the proposed approach. In particular, we are interested in testing the use of features obtained using deep convolutional neural networks as these have shown promising results in matching visual patterns.


