Abstract
Life sign detection is important in many applications, such as locating disaster victims. This can be difficult in low signal to noise ratio (SNR) and through-wall conditions. This paper considers life sign detection using an impulse ultra-wideband (UWB) bio-radar with an improved sensing algorithm for clutter elimination, harmonic suppression and random-noise de-noising. To improve detection performance, two filters are used to improve SNR of these life signs. The automatic gain method is performed in fast time to improve the respiration signals. The spectral kurtosis analysis (SKA)-based windowed Fourier transform (WFT) method and an accumulator in the frequency domain are used to provide two distance estimates between the radar and human subject. Further, the accumulator can also provide the frequency estimate of the respiration signals. These estimates are used to determine if a human is present in the detection environment. Results are presented which show that the range and respiration frequency can be estimated accurately in low signal to noise and clutter ratio (SNCR) environments. In addition, the performance is better than with other techniques given in the literature.
1. Introduction
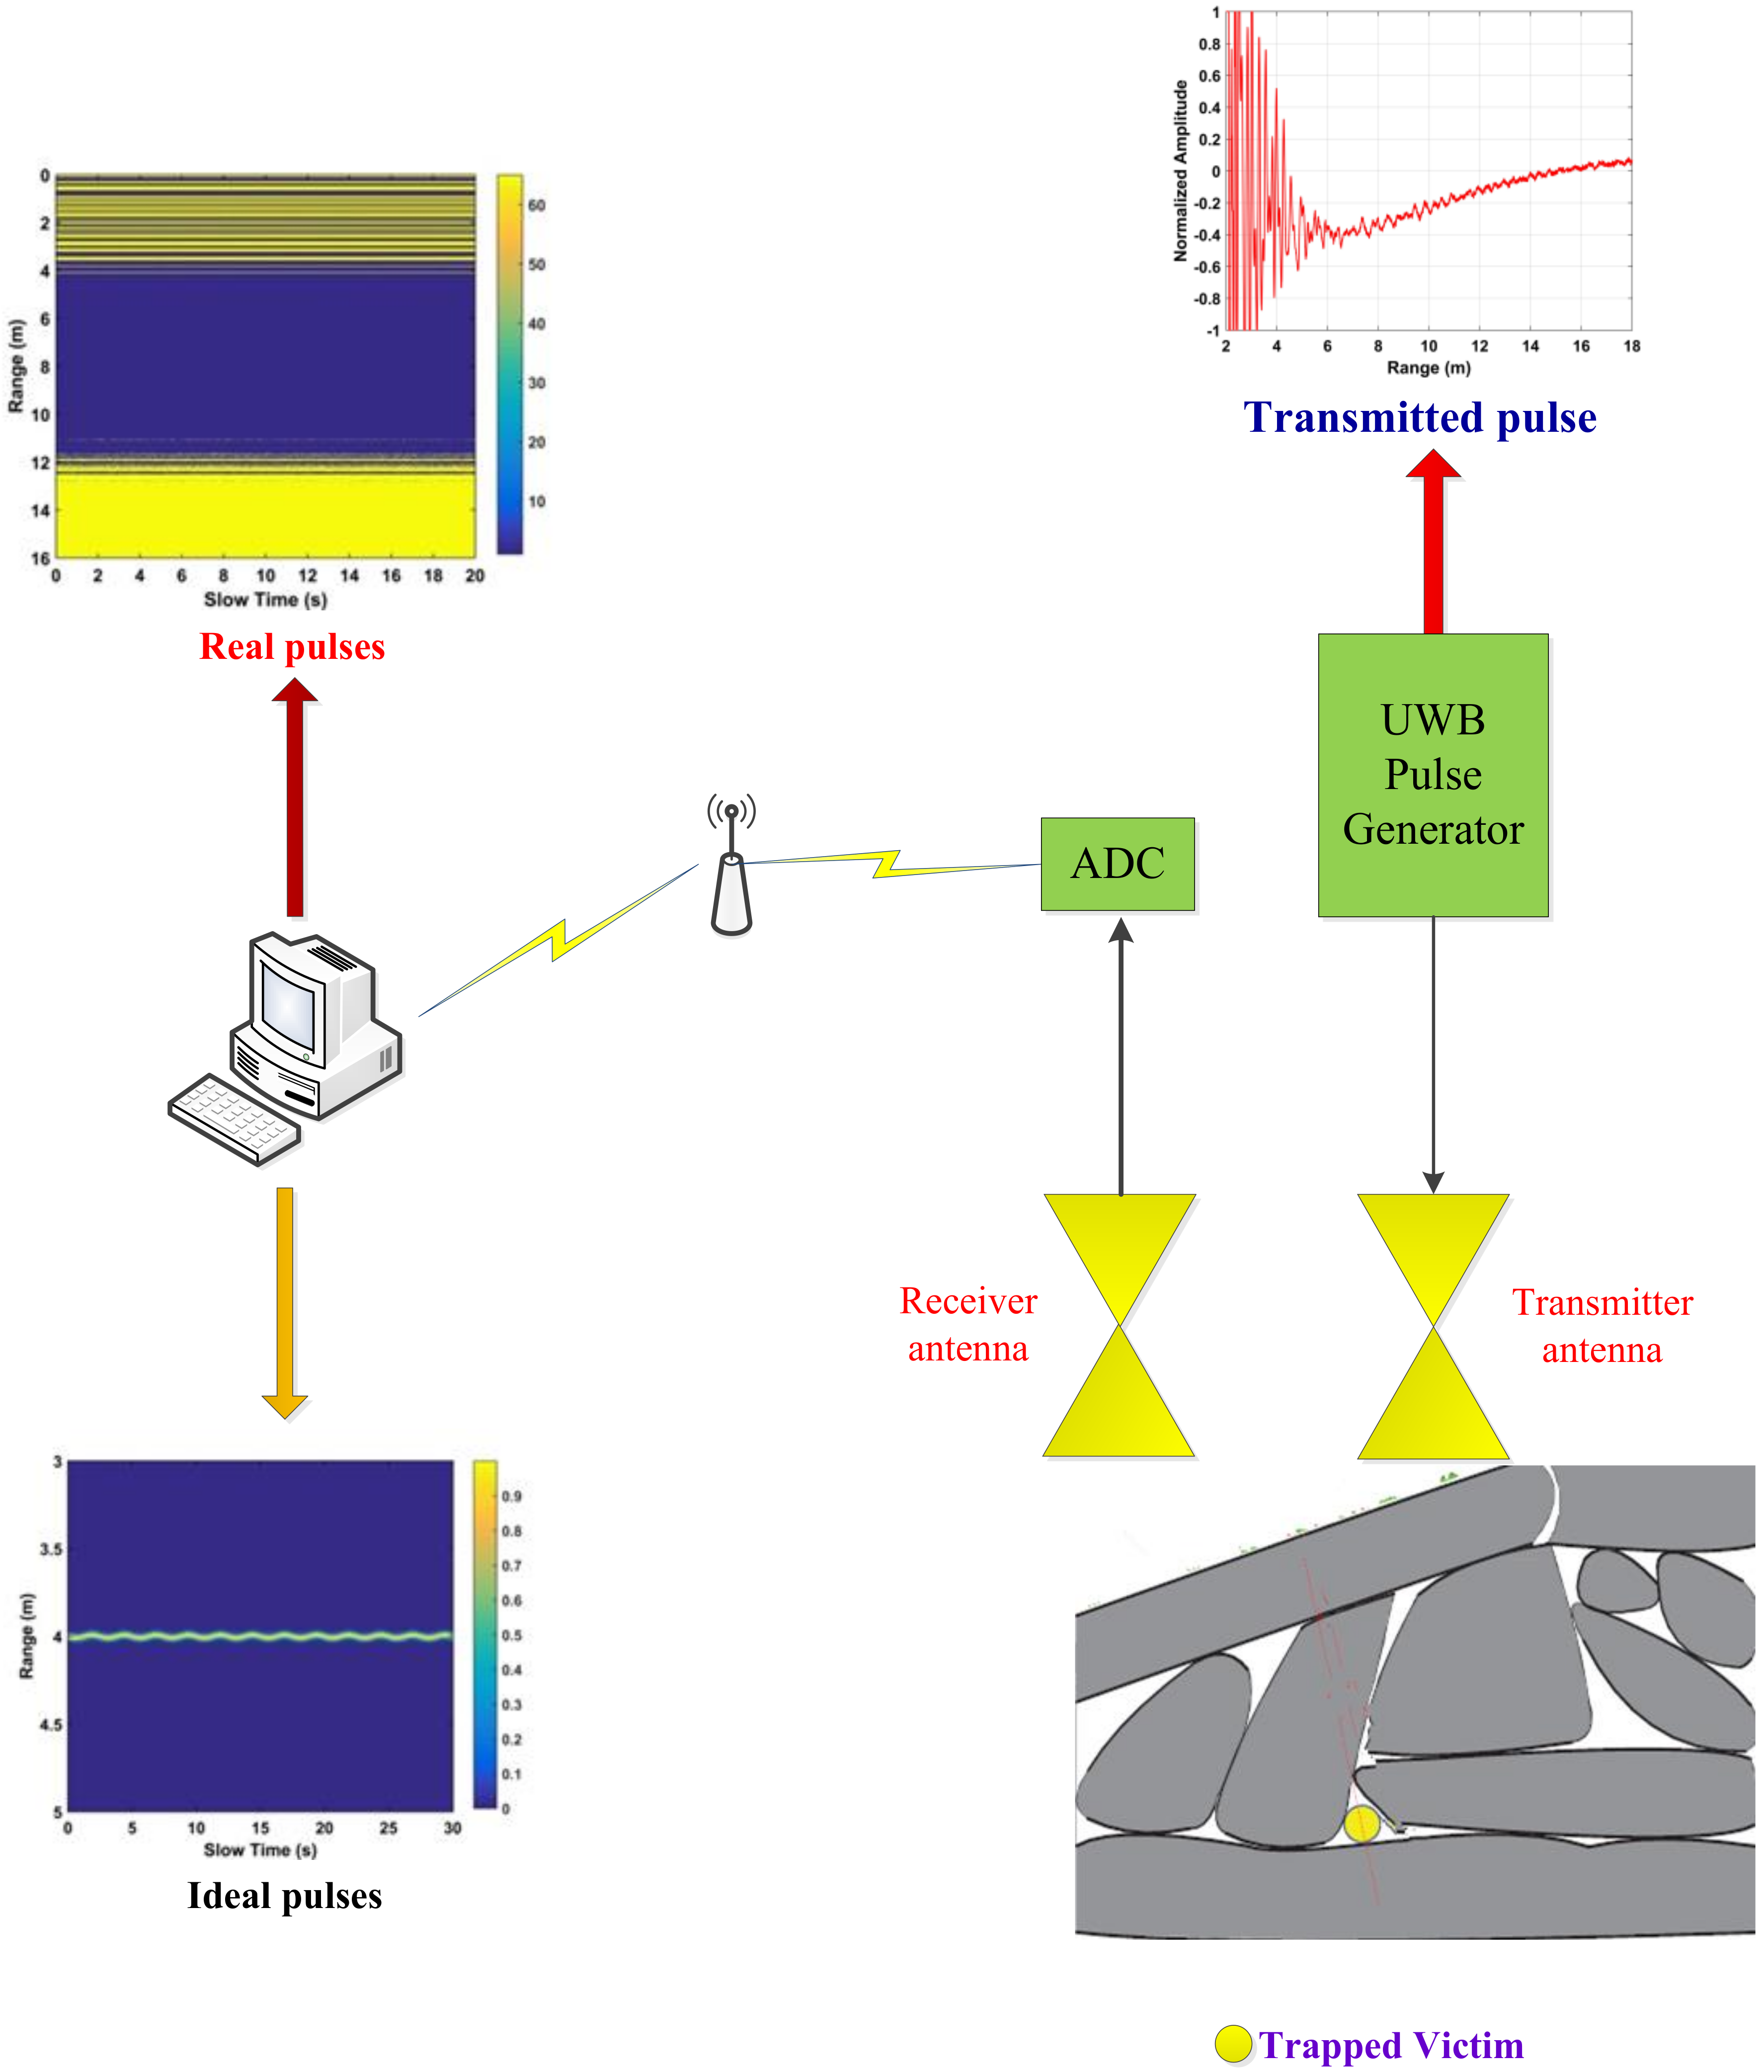
Natural disasters occur throughout the world and result in significant damage and loss of life. The detection of humans trapped in buildings and rubble in these situations is a significant challenge. As a result, non-contact detection of vital signs (VS) has received considerable attention in the literature [1,2,3,4,5]. Electromagnetic detection techniques are the most commonly employed. Ultra-wideband (UWB) radar has been used to track moving targets and for through-wall imaging because of the good permeability and excellent resolution [6,7,8,9,10,11,12,13]. As a result, it has been proposed for vital sign detection [14,15,16,17,18,19,20,21,22] as shown in Figure 1. In [14], respiration-like clutter was suppressed using an adaptive cancellation method. A short-time Fourier Transform (STFT) was used for VS detection in [15]. However, these methods cannot accurately estimate the frequencies of VS signals due to the presence of harmonics. Further, STFT performance is sensitive to the window length. Ensemble empirical mode decomposition (EEMD) and a frequency window were used to remove clutter and harmonics in [17], but this increases the receiver complexity. An adaptive Kalman filter was developed to extract respiration signals from UWB radar data in [19]. An extended complex signal demodulation (CSD) technique was considered in [20] to eliminate the wrapped problem with the DACM algorithm. To avoid the codomain restriction in arctangent demodulation (AD), an extended differentiate and cross-multiply (DACM) method was proposed in [21].
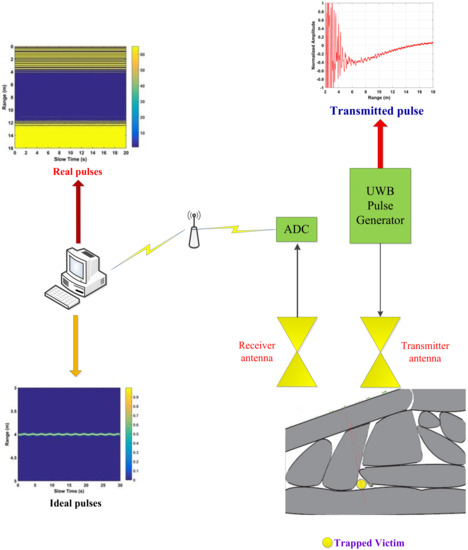
Figure 1.
The model for vital sign detection using an UWB radar.
Existing vital sign detection techniques are not suitable for trapped victims because they consider only some of the issues, such as removing clutter, determining respiration characteristics, and heart rate estimation [23,24,25,26,27,28,29,30,31,32,33,34,35,36,37,38,39,40,41]. An algorithm for vital sign detection based on radar data was developed in [16]. However, this approach is complex and frequently produces false-positive results. The fast Fourier transform (FFT) and Hilbert-Huang transform (HHT) have been used to analyse respiration signals [23,24]. Adaptive clutter cancellation has been proposed to remove respiration-like clutter [26]. The respiration period was estimated in [28] for an additive white Gaussian noise (AWGN) environment [28]. Respiration detection in low signal to noise and clutter ratio (SNCR) conditions was considered in [29] using singular value decomposition (SVD). The method proposed in [34] to detect signs of life is only effective over short distances and in high signal to noise ratio (SNR) environments. The effects of static clutter have been mitigated using linear trend subtraction (LTS) [35]. A higher order cumulant (HOC) method was used in [37] to extract vital sign information by exploiting the fact that the HOC of Gaussian noise is zero. Further, it was shown that this approach can be used for vital sign detection in other types of noise. Ensemble empirical mode decomposition was used in [38] for heart rate detection.
Accurate acquisition of vital sign information such as the respiration frequency is difficult in many environments and existing approaches are complex. Further, they are effective only over short distances and require a high SNCR. Thus, in this paper, a new method is proposed to accurately detect vital signs in low SNCR environments such as long range and through-wall conditions. An automatic gain method is developed to improve the SNR. The kurtosis of the received signal is used in conjunction with a windowed Fourier transform (WFT) to enhance the performance. Further, a frequency accumulator is employed to obtain both the range and respiration frequency. The performance of the proposed system is verified experimentally with real test subjects using the UWB radar system designed by the Chinese Academy of Sciences.
The remainder of this paper is organized as follows. The UWB radar system model is presented in Section 2, and the proposed detection method is given in Section 3. The proposed system is evaluated in Section 4 and compared with several techniques presented in the literature. Finally, some concluding remarks are given in Section 5.
2. System Model
A UWB impulse radar detects changes in the propagation delay of signals reflected by targets such as respiration and heart rate signals. The range between the human chest and radar is [33,37]
where is an constant distance, and are the respiration and heart rate amplitudes, respectively, and and are the corresponding frequencies.
Assuming only one subject exists in the detection environment and all other objects are stationary, the radar impulse response is given by
where is the propagation delay, is the signal from the ith static target with amplitude and time-delay , and is the human motion signal with amplitude and propagation delay . Due to harmonic vibration, can be expressed as [33]
where = 3 × 10⁸ m/s is the speed of light, , , and .
The received signal is
where is the transmitted impulse signal. In discrete form, this can be expressed as [33]
where is the pulse repetition time, in fast time and in slow time. The sampling interval in fast time is and . is the desired human motion signal and corresponds to the static signals which are slow time-invariant.
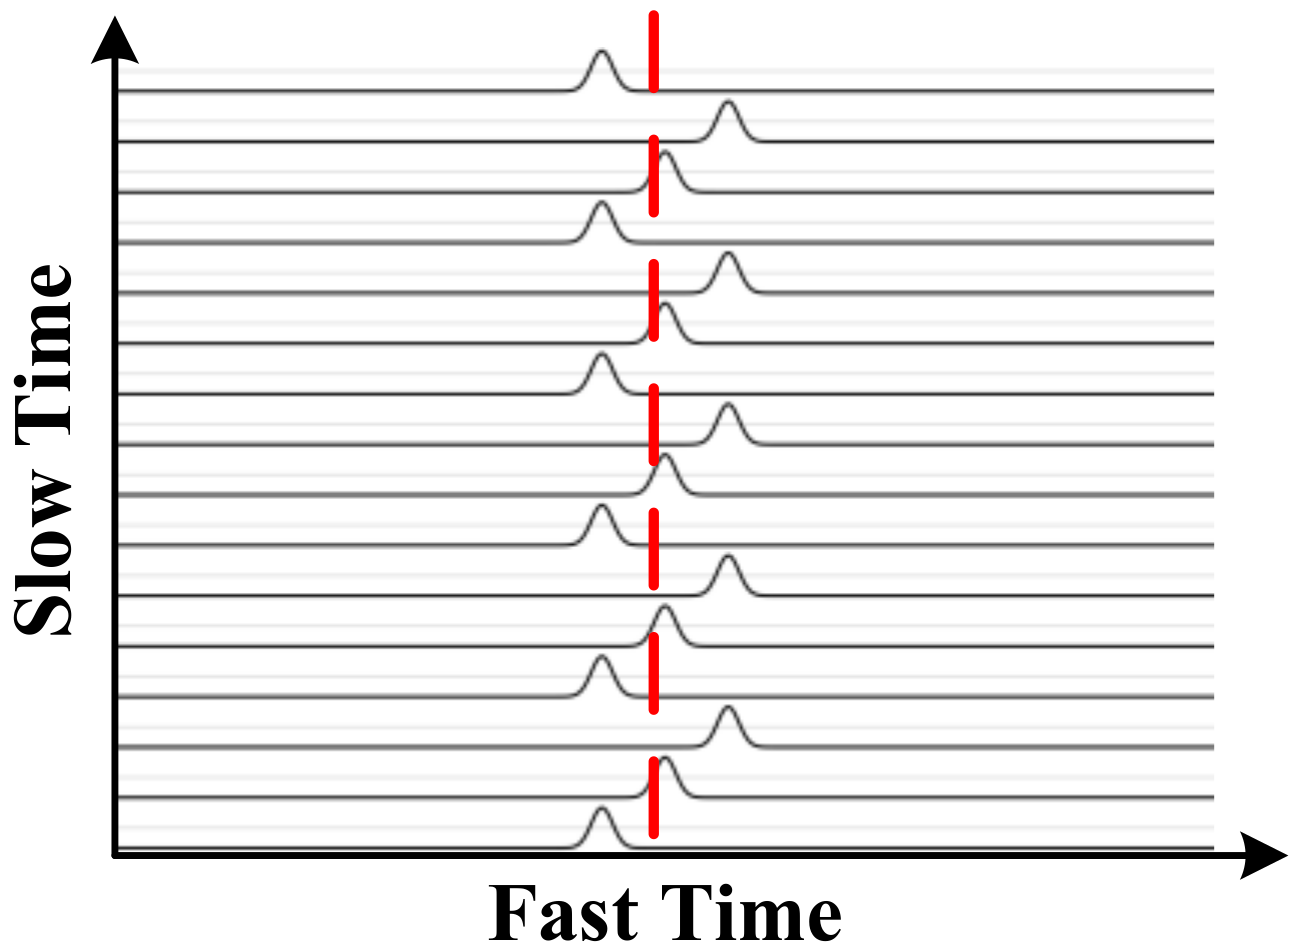
Figure 2 shows the received signal due to human respiration where the dashed line denotes a fast time bin. In a real environment, the received signal can contain static and non-static clutter, linear trend, human motion, and AWGN. Therefore, the received signal can be expressed as
where is the linear trend, is AWGN, is the non-static clutter, is other clutter (e.g., due to system electronics), and is the clutter caused by moving objects other than the target (e.g., persons in the environment). Figure 1 presents the ideal received signal matrix and the corresponding matrix with AWGN at an SNR of 0 dB is given in Figure 3. This shows that it is difficult to extract vital sign signals when the SNR is low. To avoid range ambiguities and frequency aliasing requires that
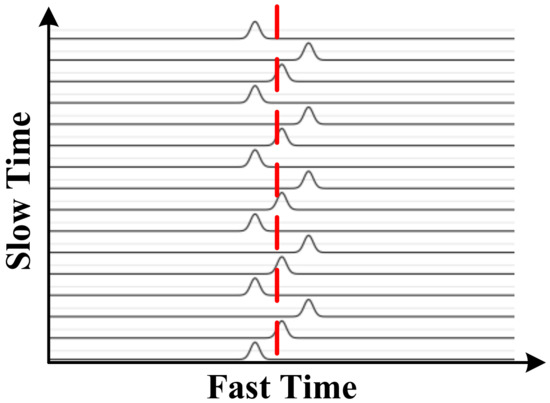
Figure 2.
The ideal pulses acquired from one human subject.
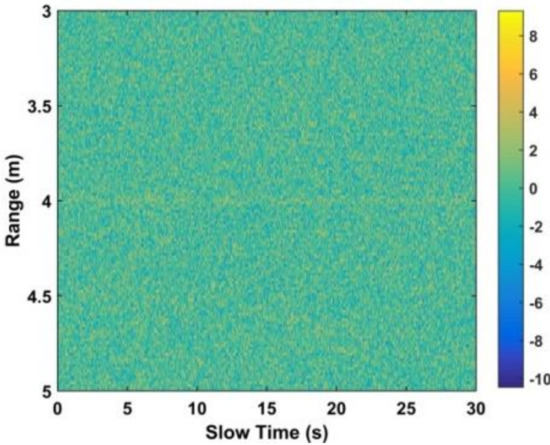
Figure 3.
The resulting matrix with AWGN at an SNR of 0 dB.
Further, the signals should be received within one pulse interval so that
where is the −6 dB UWB signal pulse width.
UWB Impulse Radar
The UWB impulse radar developed by the Key Laboratory of Electromagnetic Radiation and Sensing Technology, Chinese Academy of Sciences, is employed here. The radar parameters are given in Table 1. The center frequency is 400 MHz and the pulse repetition frequency (PRF) is 600 kHz. The data were obtained using six segments with a segment time window of 124 ns and Ms = 682 samples per segment. The number of samples in fast time is M = 4092 and NA samples were averaged during data acquisition. Thus, a signal is obtained every MsNA/PRF = 0.0341 s. The slow time sampling frequency is 29 Hz, so N = 512 pulses are received every 17.6 s. Both equivalent-time and real-time sampling [39] are employed as the performance is better than with an analog receiver employing only equivalent-time sampling [40]. Figure 1 gives the two-dimensional (slow time and range) matrix R obtained using the UWB radar with a subject at a distance of 6 m from the antenna in an outdoor environment (this will be described in Section 4). The vital sign signals are not apparent due to the significant signal attenuation which is typical of real environments. Therefore, a new method for vital sign detection is proposed in this paper.

Table 1.
The UWB impulse radar parameters.
3. Respiration Detection
In this section, the proposed algorithm for respiration detection is presented including clutter, linear trend, and interference suppression. Figure 4 gives a flowchart of this algorithm. In the proposed algorithm, the time-domain mean subtraction (TMS) is used to suppress the static clutters; the non-static clutters are removed by employing LTS method and a smoothing filter; the automatic gain algorithm is used to suppress the clutter caused by the system electronics. To suppress the clutters introduced by moving objects other than the detection target, there is only one target in the experiments. Meanwhile, a band-pass filter and a smoothing filter are used to suppress the clutters caused by some unknown moving targets. The spectral kurtosis analysis (SKA)-based WFT method and an accumulator in the frequency domain are used to provide two distance estimates between the radar and human subject. Further, the accumulator can also provide the frequency estimate of life signs. These estimates are used to determine if a human is present in the detection environment.
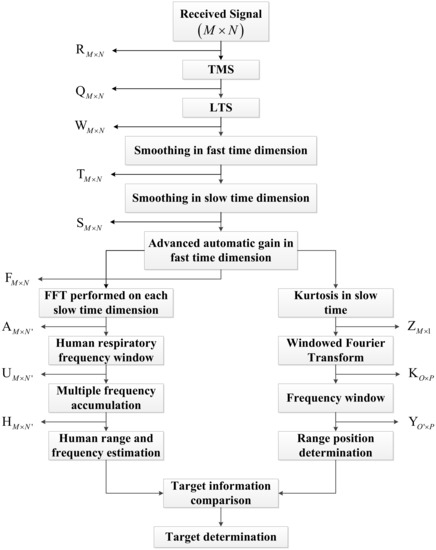
Figure 4.
Flowchart of the proposed method for human target detection.
3.1. Static Clutter and Linear Trend Suppression
TMS is used to suppress the static clutter which can be estimated as [33]
Removing the static clutter gives
While this effectively removes the static clutter, the linear trend which is inherent in radar signals still exists. The LTS method is employed to remove the linear trend which gives [36]
where ,, and .
3.2. SNR Improvement
The received signal depends on factors such as the dielectric constant, humidity, obstacle polarization, center frequency, and azimuth angle between the antenna and subject. These factors cannot be estimated accurately, so a matched filter is not suitable for detection. A good alternative is a band-pass filter such as a Butterworth filter, because it has a maximally flat magnitude response [41]. The transfer function of this filter is
where is the cutoff frequency and is the filter order. is used here considering the tradeoff between complexity and performance. The low-pass filter has normalized cutoff frequency 0.1037 and a high-pass filter has normalized cutoff frequency 0.0222. The normalized cut-off frequency can be expressed as
where is the cut-off frequency and is the sampling frequency in fast time.
Filtering is performed on in fast time for each slow time index n which gives
where . The filter coefficients are denoted by and . To suppress non-static clutter, a smoothing filter is used which results in
where , is the largest integer less than , and . Values of for are set to zero.
3.3. Respiration Signal Improvement
Automatic gain is performed on in fast time to improve the respiration signal which gives [41]
where is the first maximum of . If , then
where is the second maximum of and . This process is iterated until . The pseudo-code of this method is as follows
Two methods are considered for target detection, and the range and respiration frequency are estimated by comparing the corresponding results. In the next section, the high-frequency clutter is reduced using a priori knowledge of the respiration frequency. Then, the clutter is further reduced using frequency domain windowing.
3.4. Windowed Fourier Transform
Once the clutter and linear trend have been suppressed, AWGN given by is the main signal component that degrades detection performance [42]. To reduce the effect of AWGN, the slow time kurtosis is employed which is given by [43]
where E[] denotes expectation with respect to n. For a Gaussian distributed random variable, the kurtosis is three. Thus, the excess kurtosis is used here which is [44,45,46]
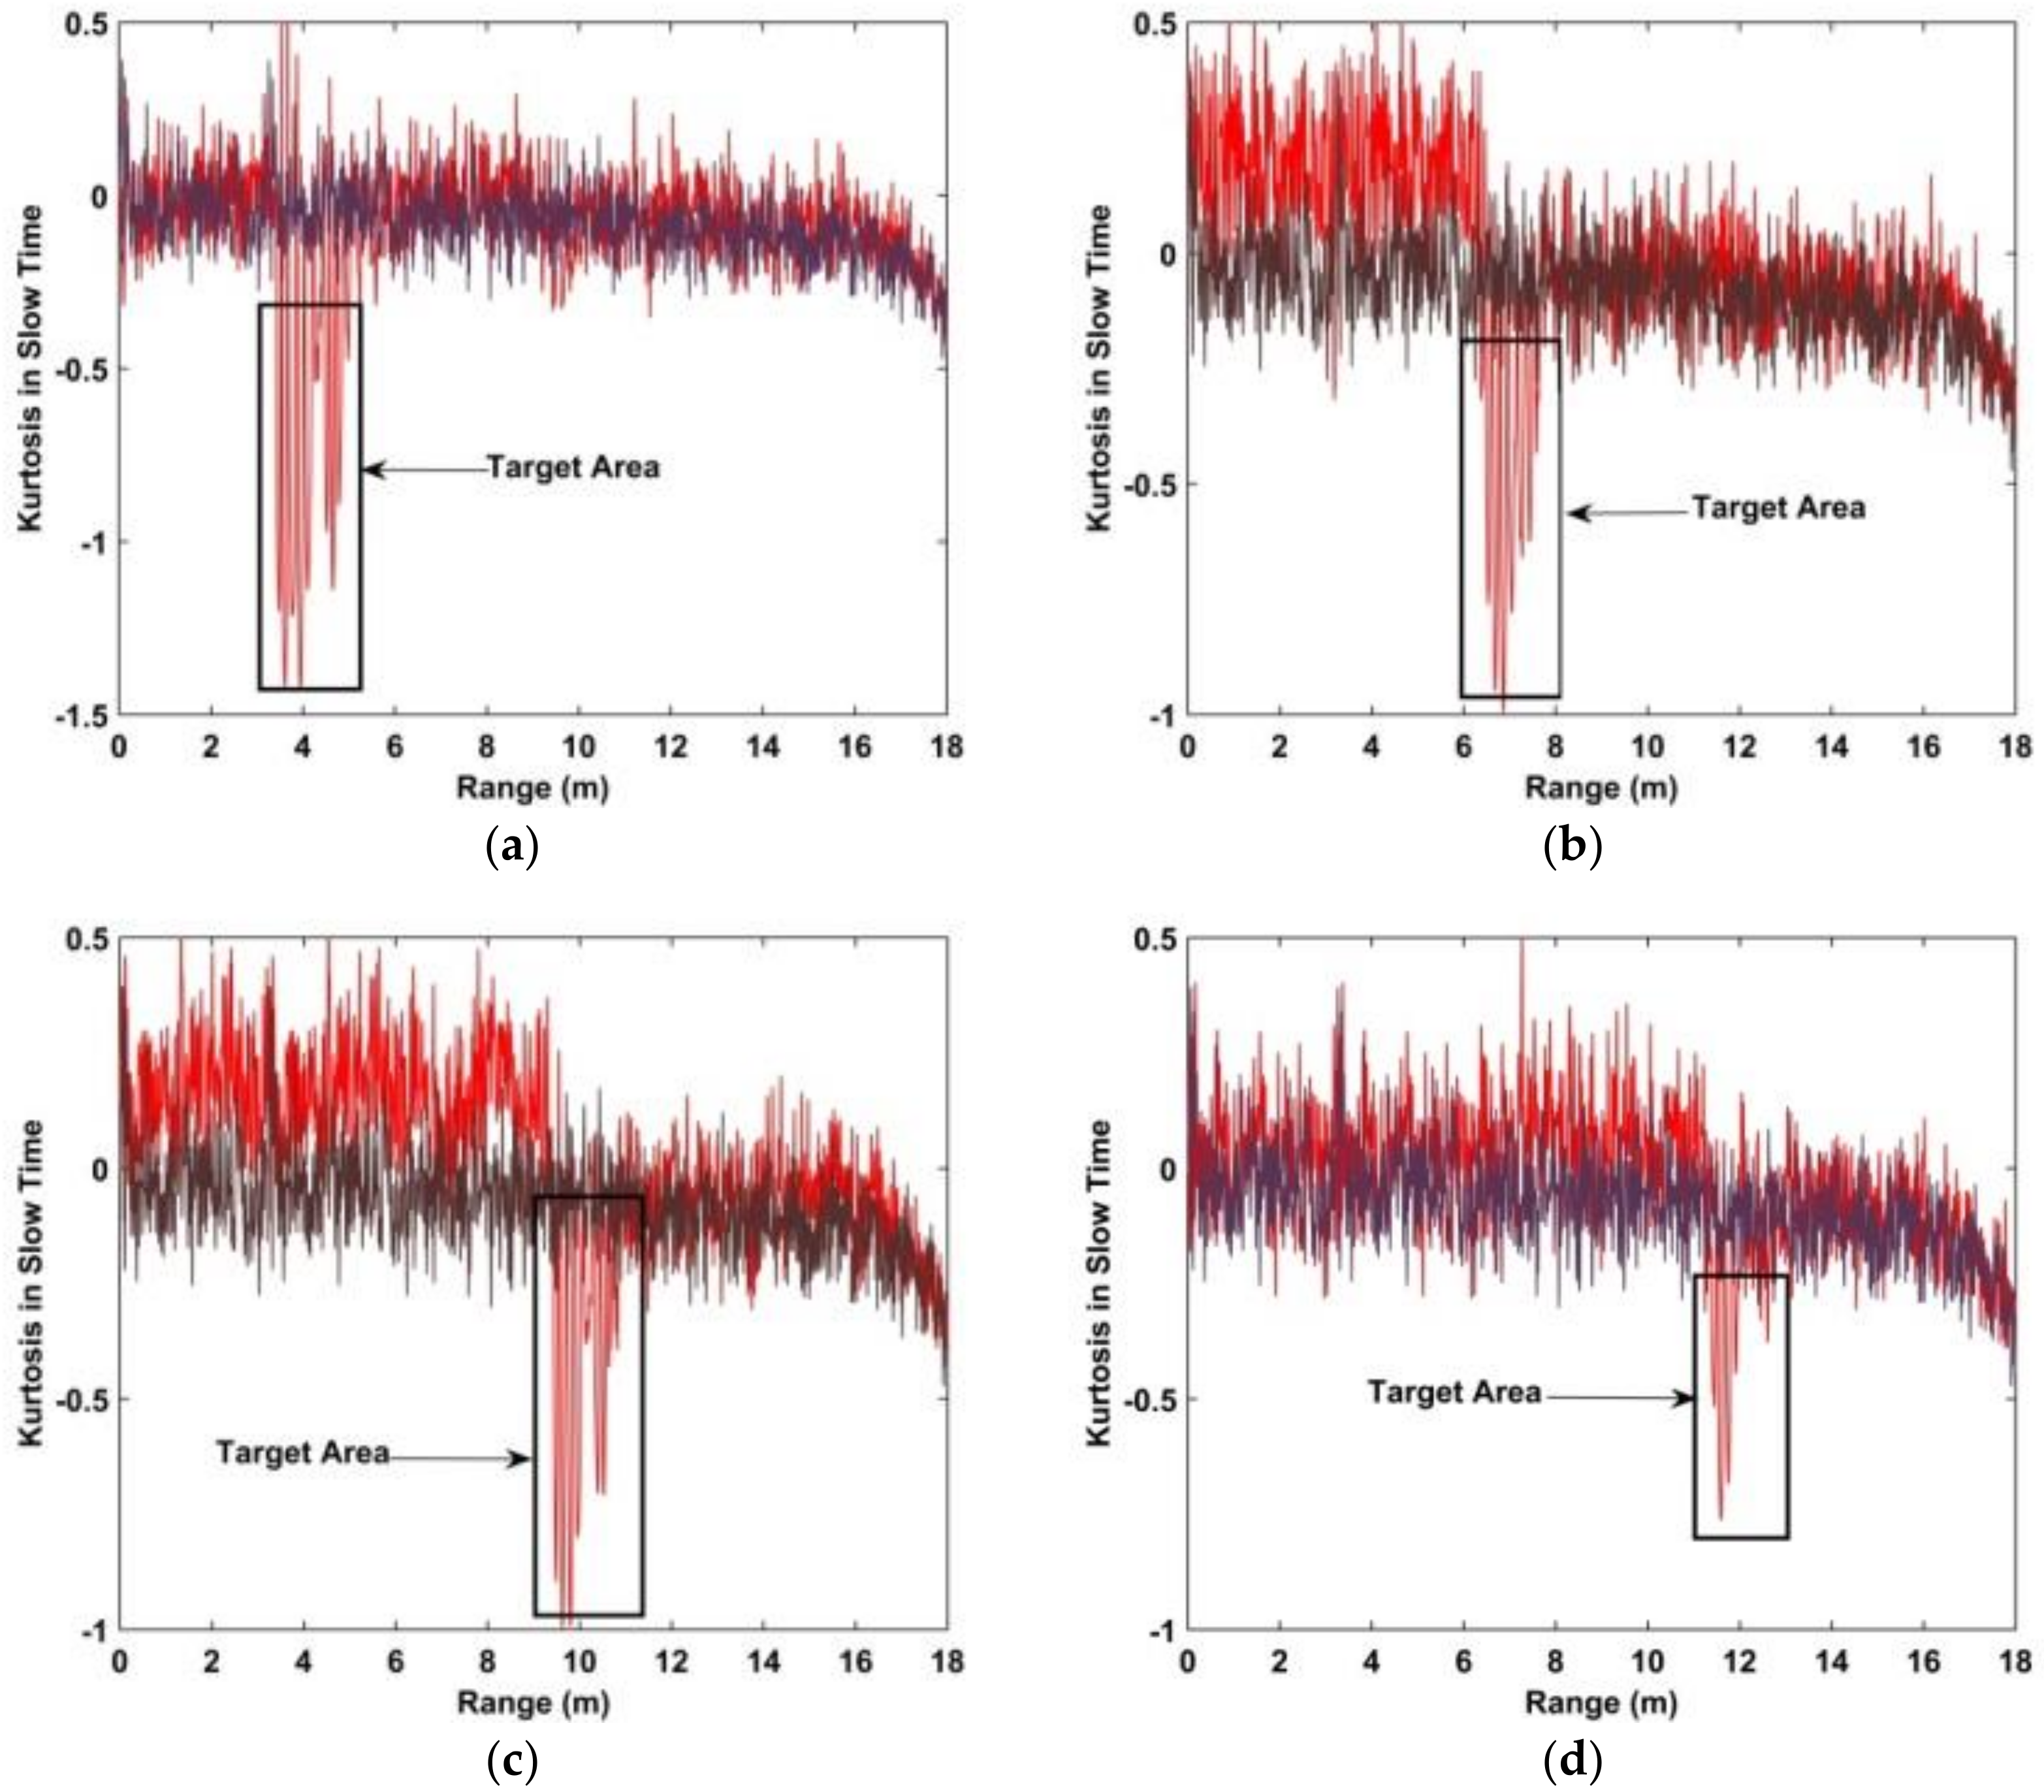
Excess kurtosis is denoted as kurtosis in the remainder of the paper. To illustrate the characteristics of the kurtosis, experiments were conducted outdoors with and without a female subject. The experimental setup is explained in detail in Section 4. The kurtosis is shown in Figure 5. The red lines indicate the kurtosis with a subject and the black lines without a subject. The distances between the antenna and test subject are 3 m, 6 m, 9 m, and 11 m. These results indicate that the kurtosis is negative when a subject is present, and near zero without a subject.

Figure 5.
The kurtosis of the received signal with (red) and without (black) a human subject. The distances between the antenna and subject are (a) 300 cm, (b) 600 cm, (c) 900 cm, and (d) 1100 cm.
An FFT is usually performed on in each slow time dimension to extract the respiration information. However, it cannot also be used to provide the range [47]. The windowed FFT (WFT) has been used to determine time variations [48,49]. Thus, in this paper, the range of the human subject is obtained from the discrete WFT (DWFT)
where p denotes the pth discrete frequency, , and is the Hamming window given by
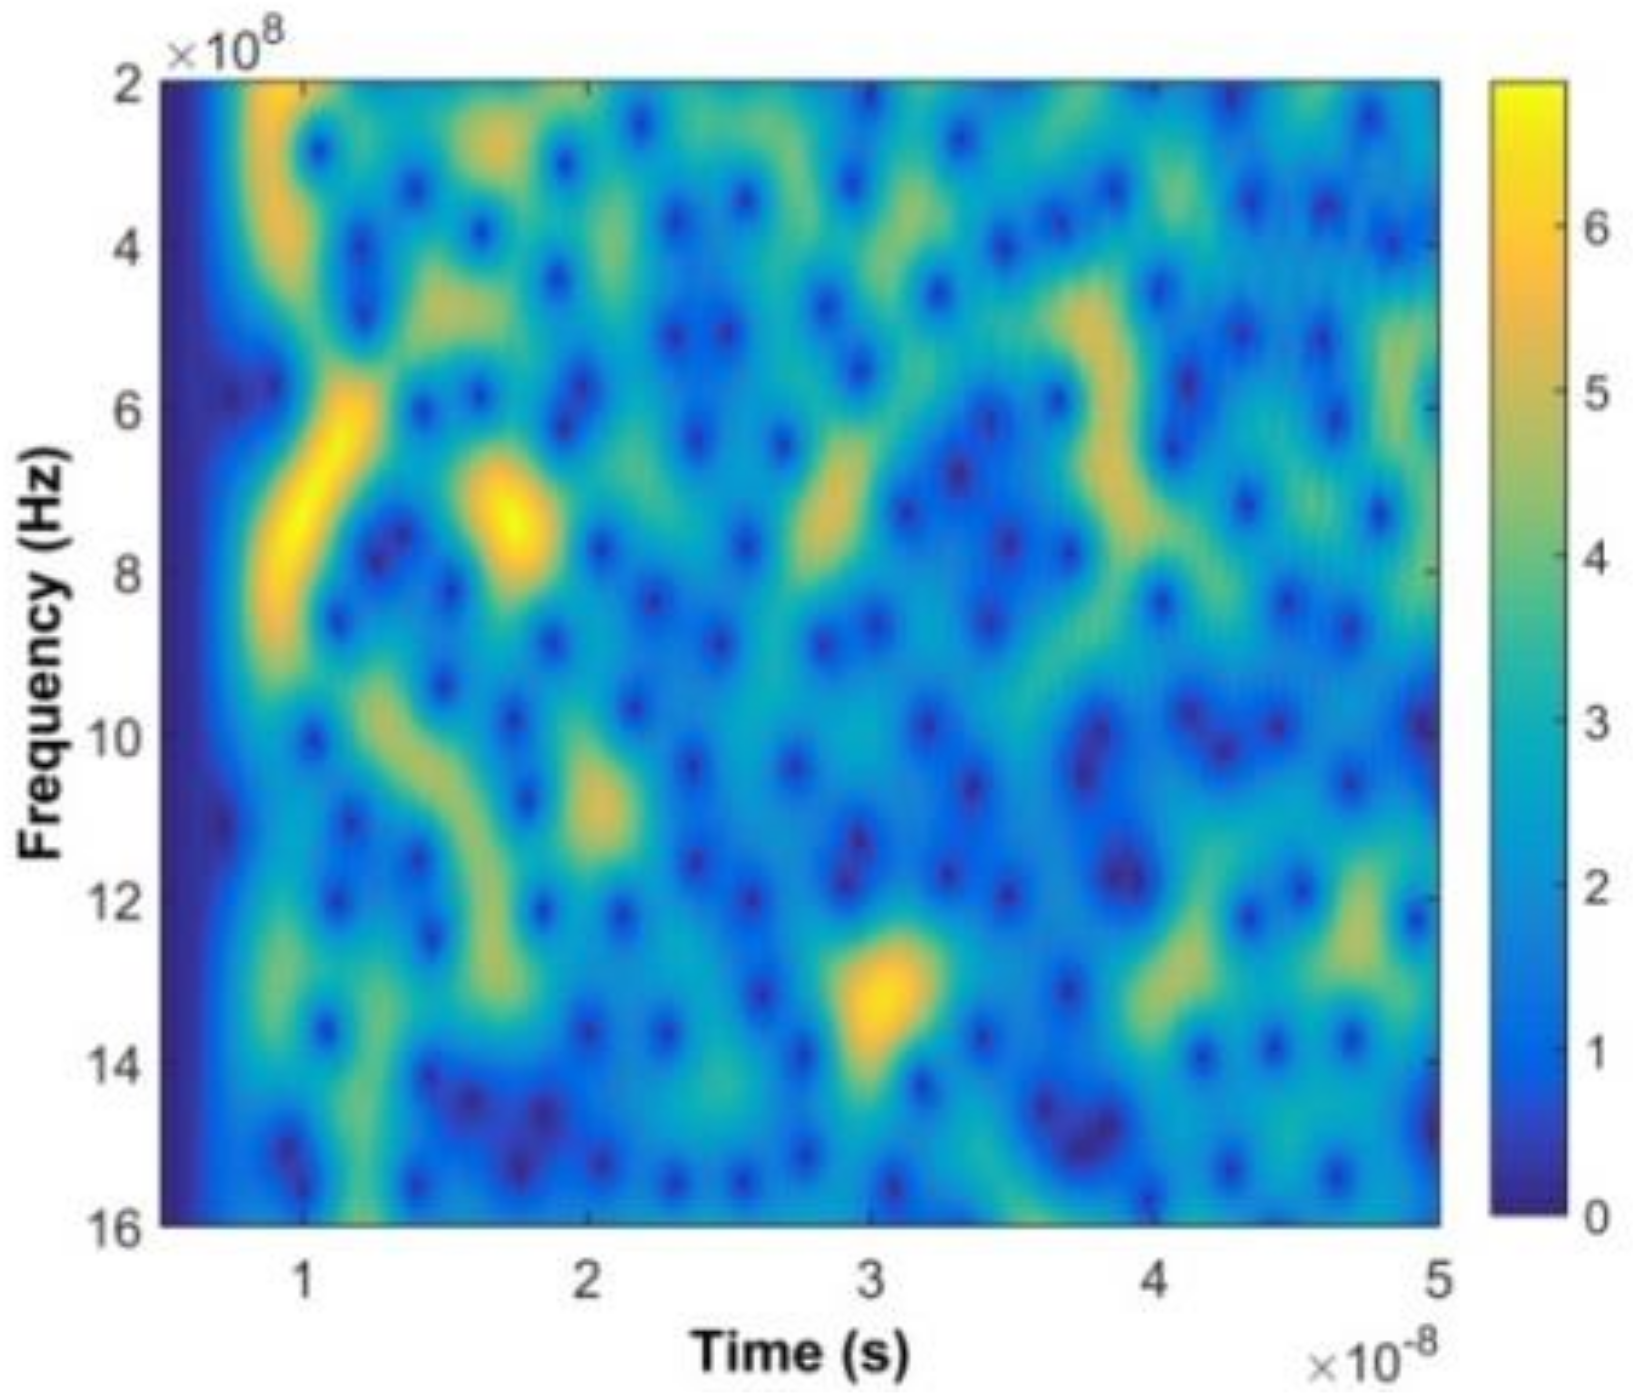
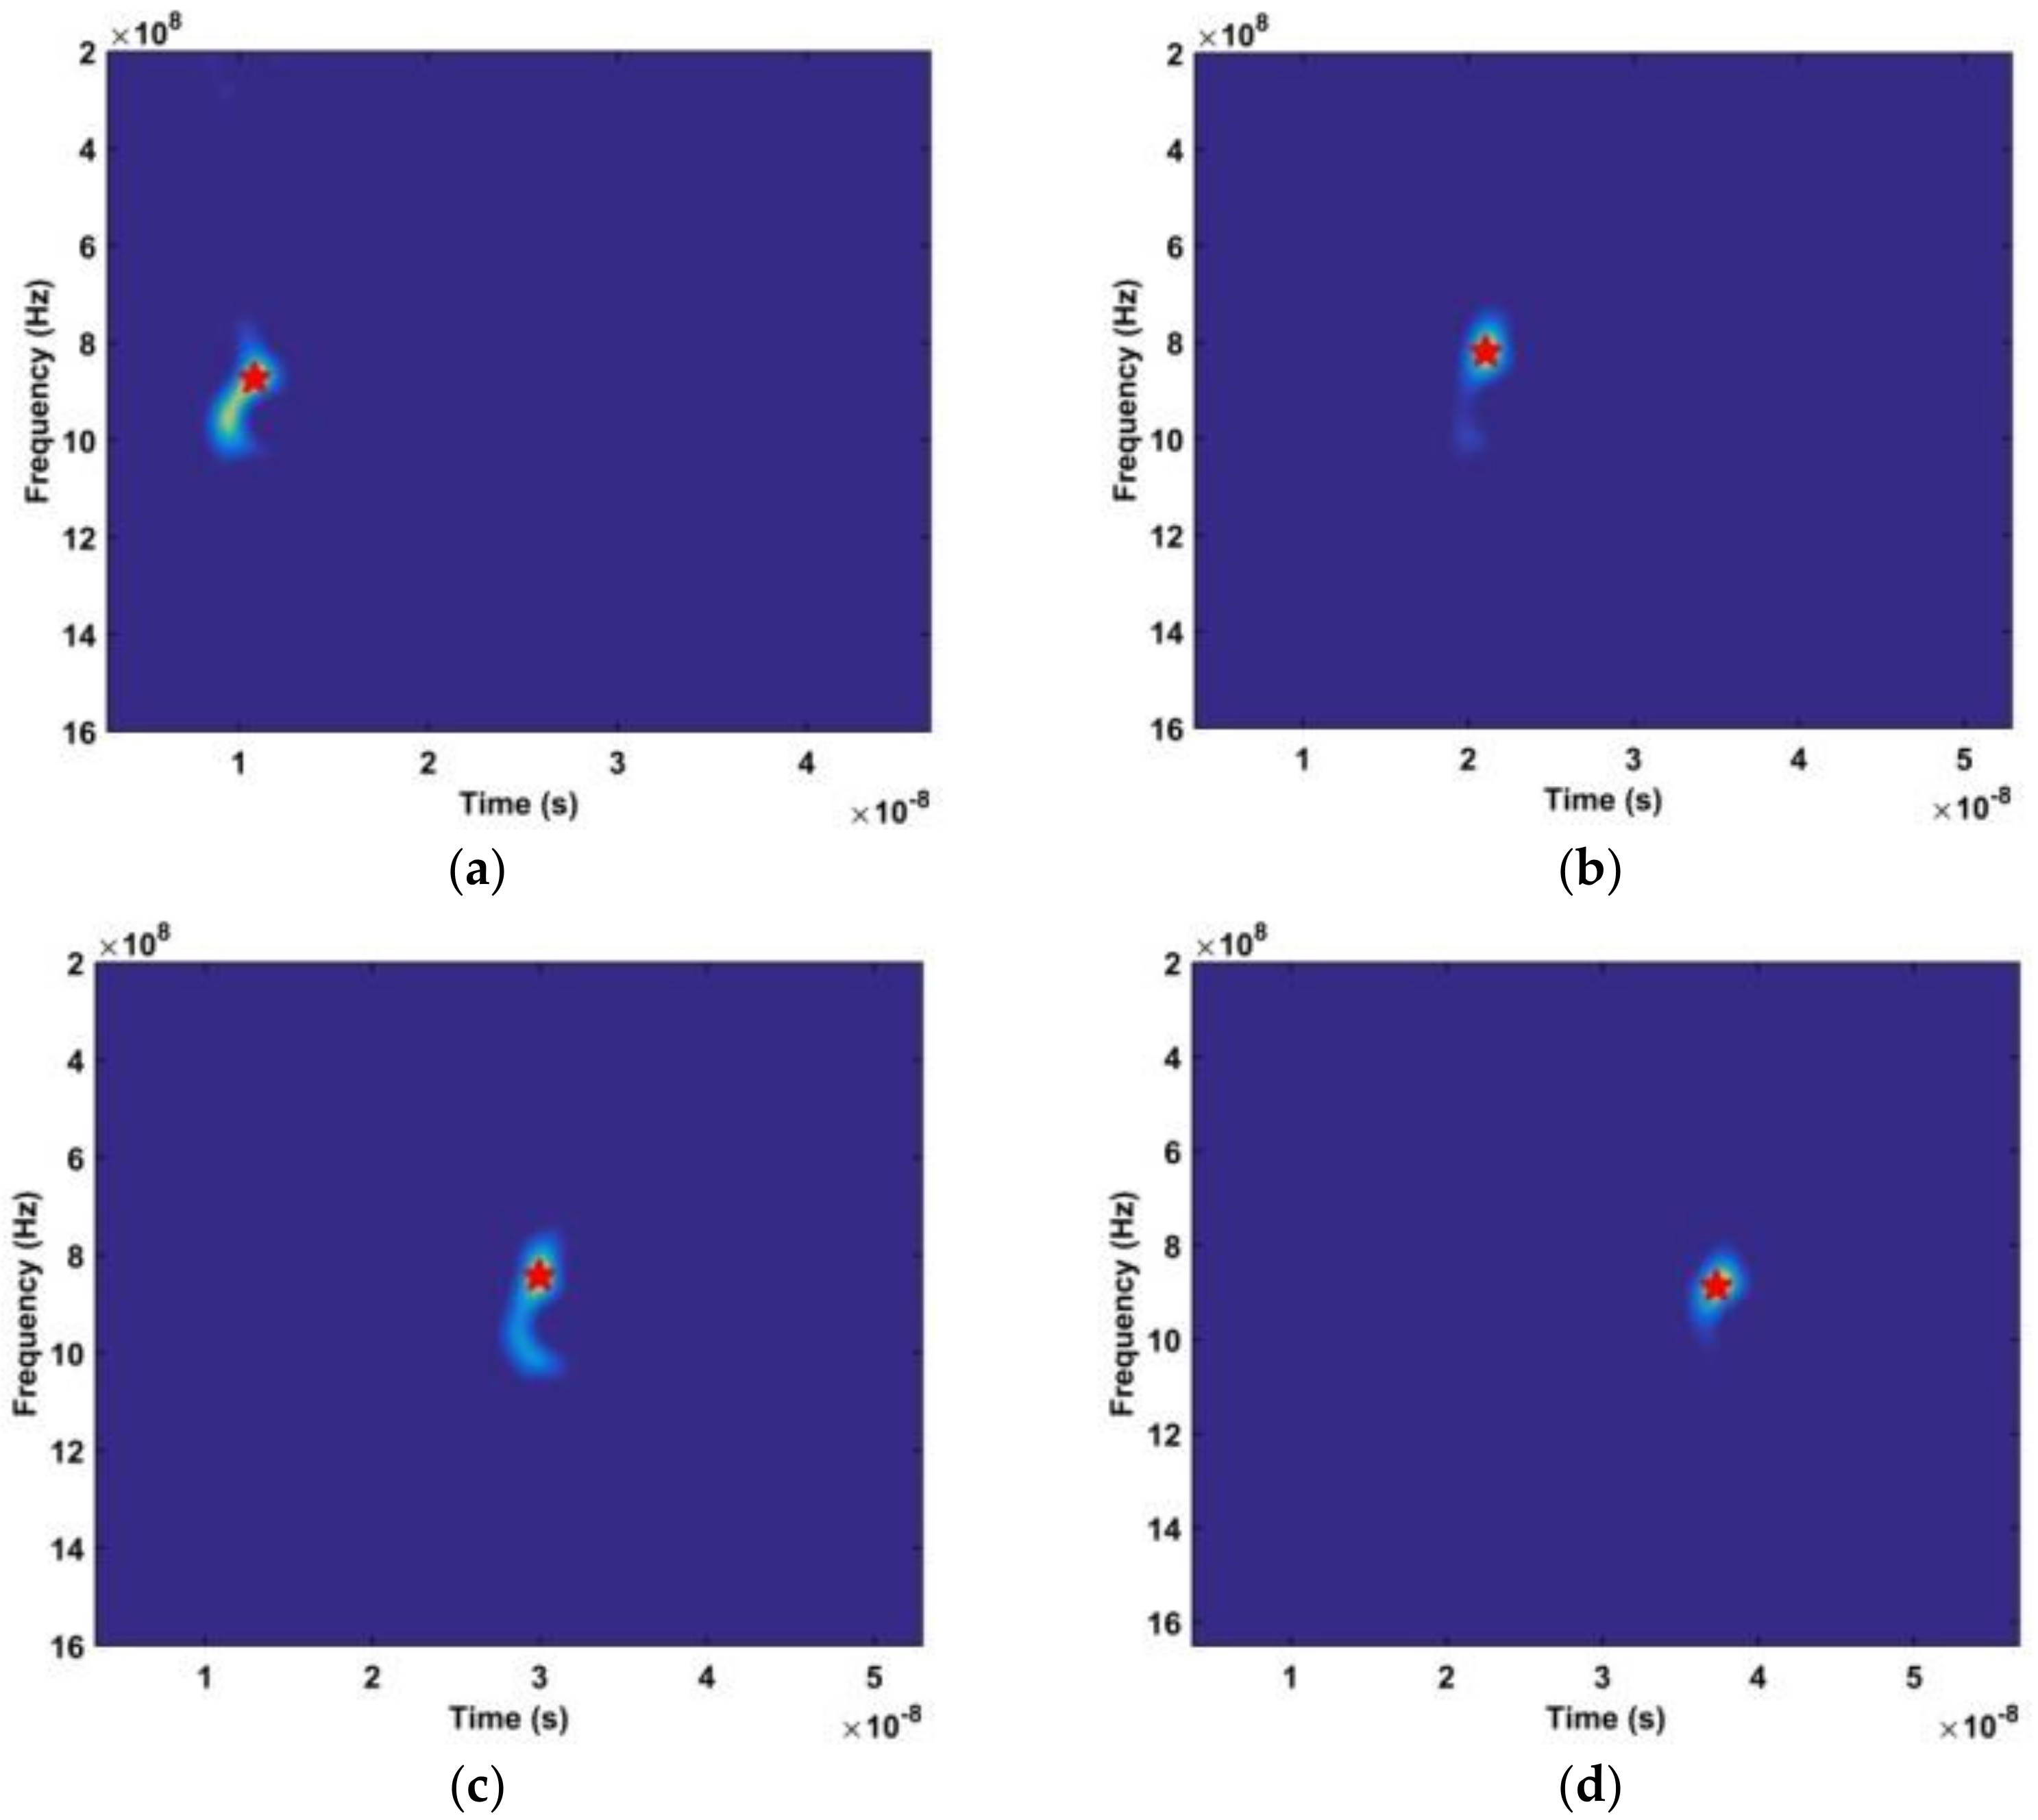
where , , and corresponds to the width of the window [50]. The result without a human subject is given in Figure 6, while the result with a subject is shown in Figure 7. The vertical axis is frequency and the horizontal axis is fast time. Comparing these results shows that the signal is periodic when a subject is present. The time-frequency characteristics of this periodic signal are shown in Figure 8.

Figure 6.
The time-frequency matrix without a test subject after the DWFT.
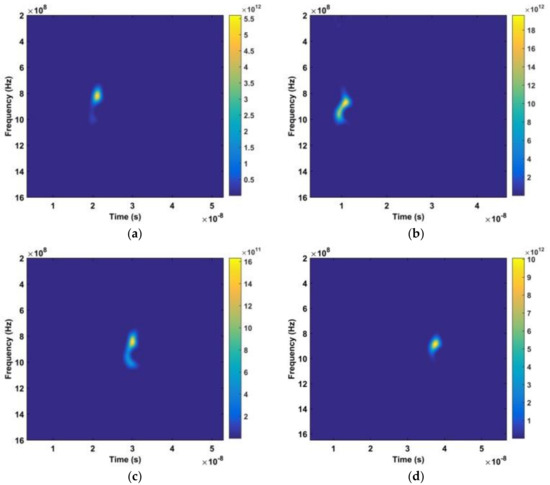
Figure 7.
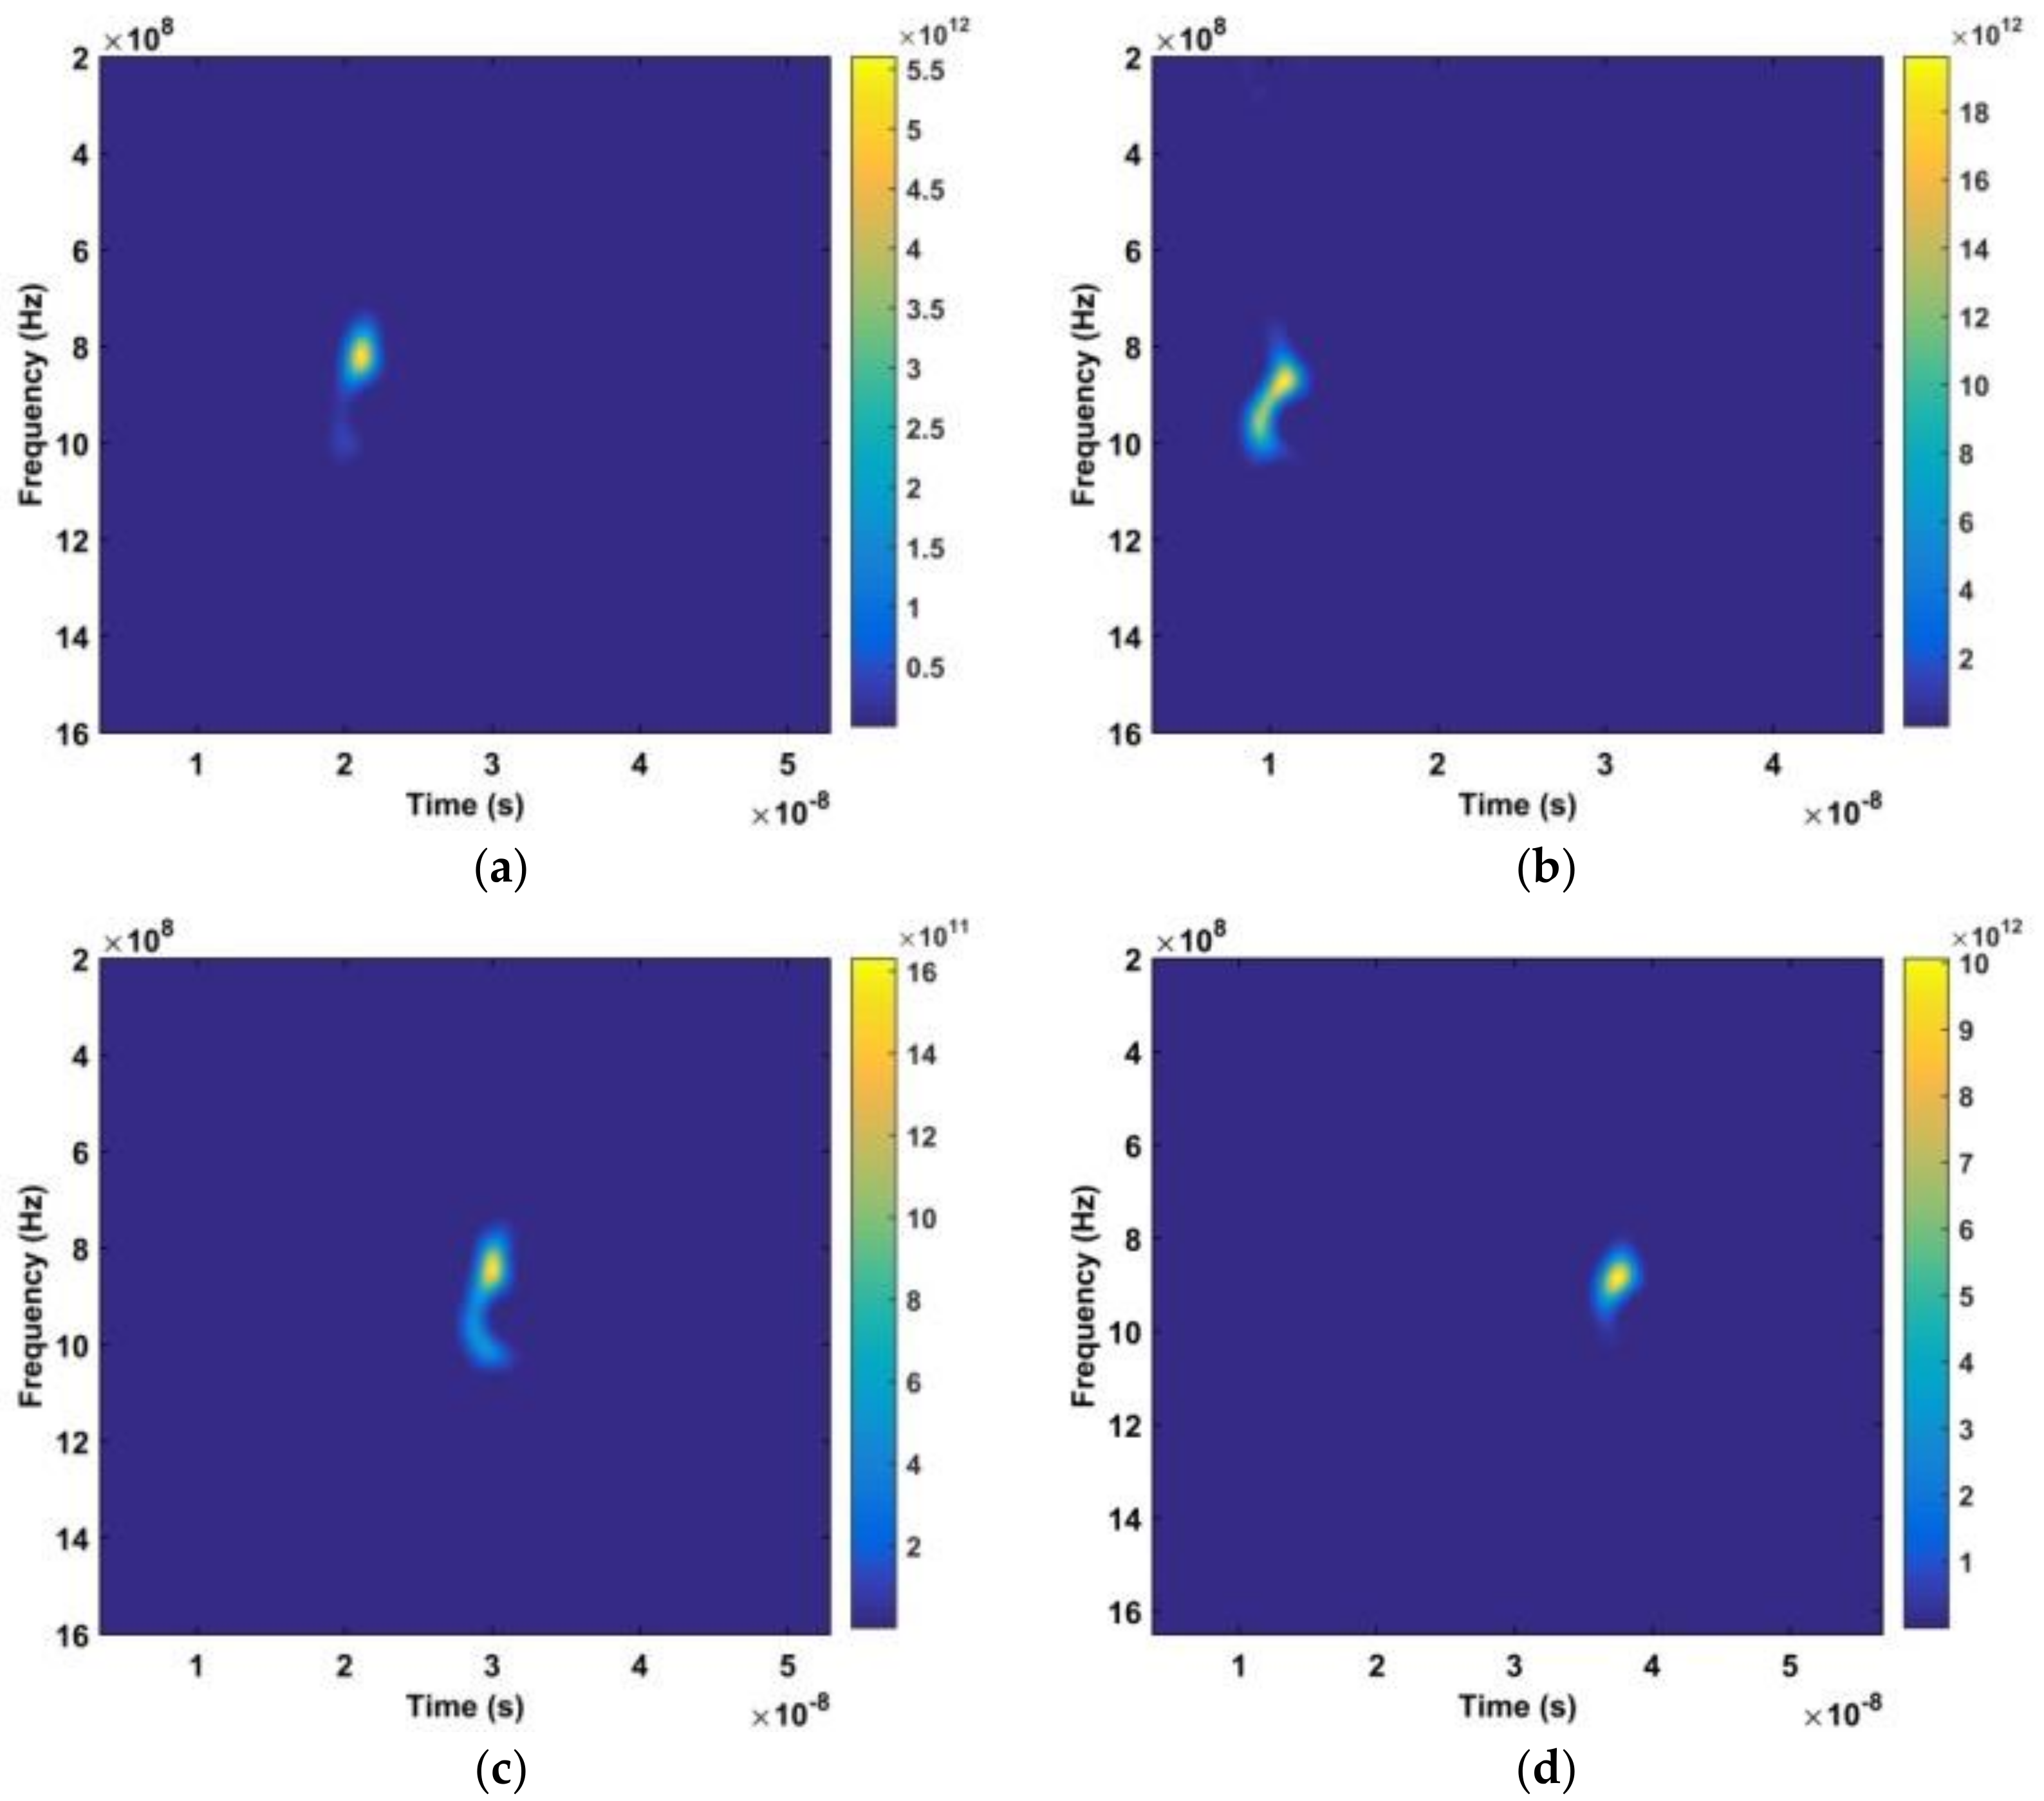
The time-frequency matrices obtained using the DWFT. The distances between the antenna and subject are (a) 300 cm, (b) 600 cm, (c) 900 cm, and (d) 1100 cm.
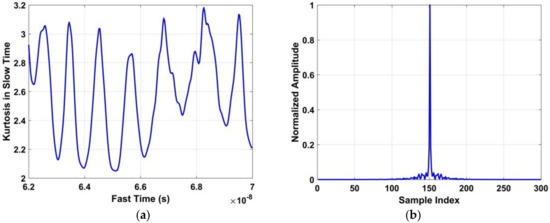
Figure 8.
(a) The time-domain signal obtained with a human target, and (b) the normalized amplitude of the periodic signal in the frequency domain.3.5. Frequency Accumulator
To obtain the range of the subject from , a frequency window of width 0.6 to 1.2 GHz is employed. If corresponds to the maximum amplitude index, then the estimated range is
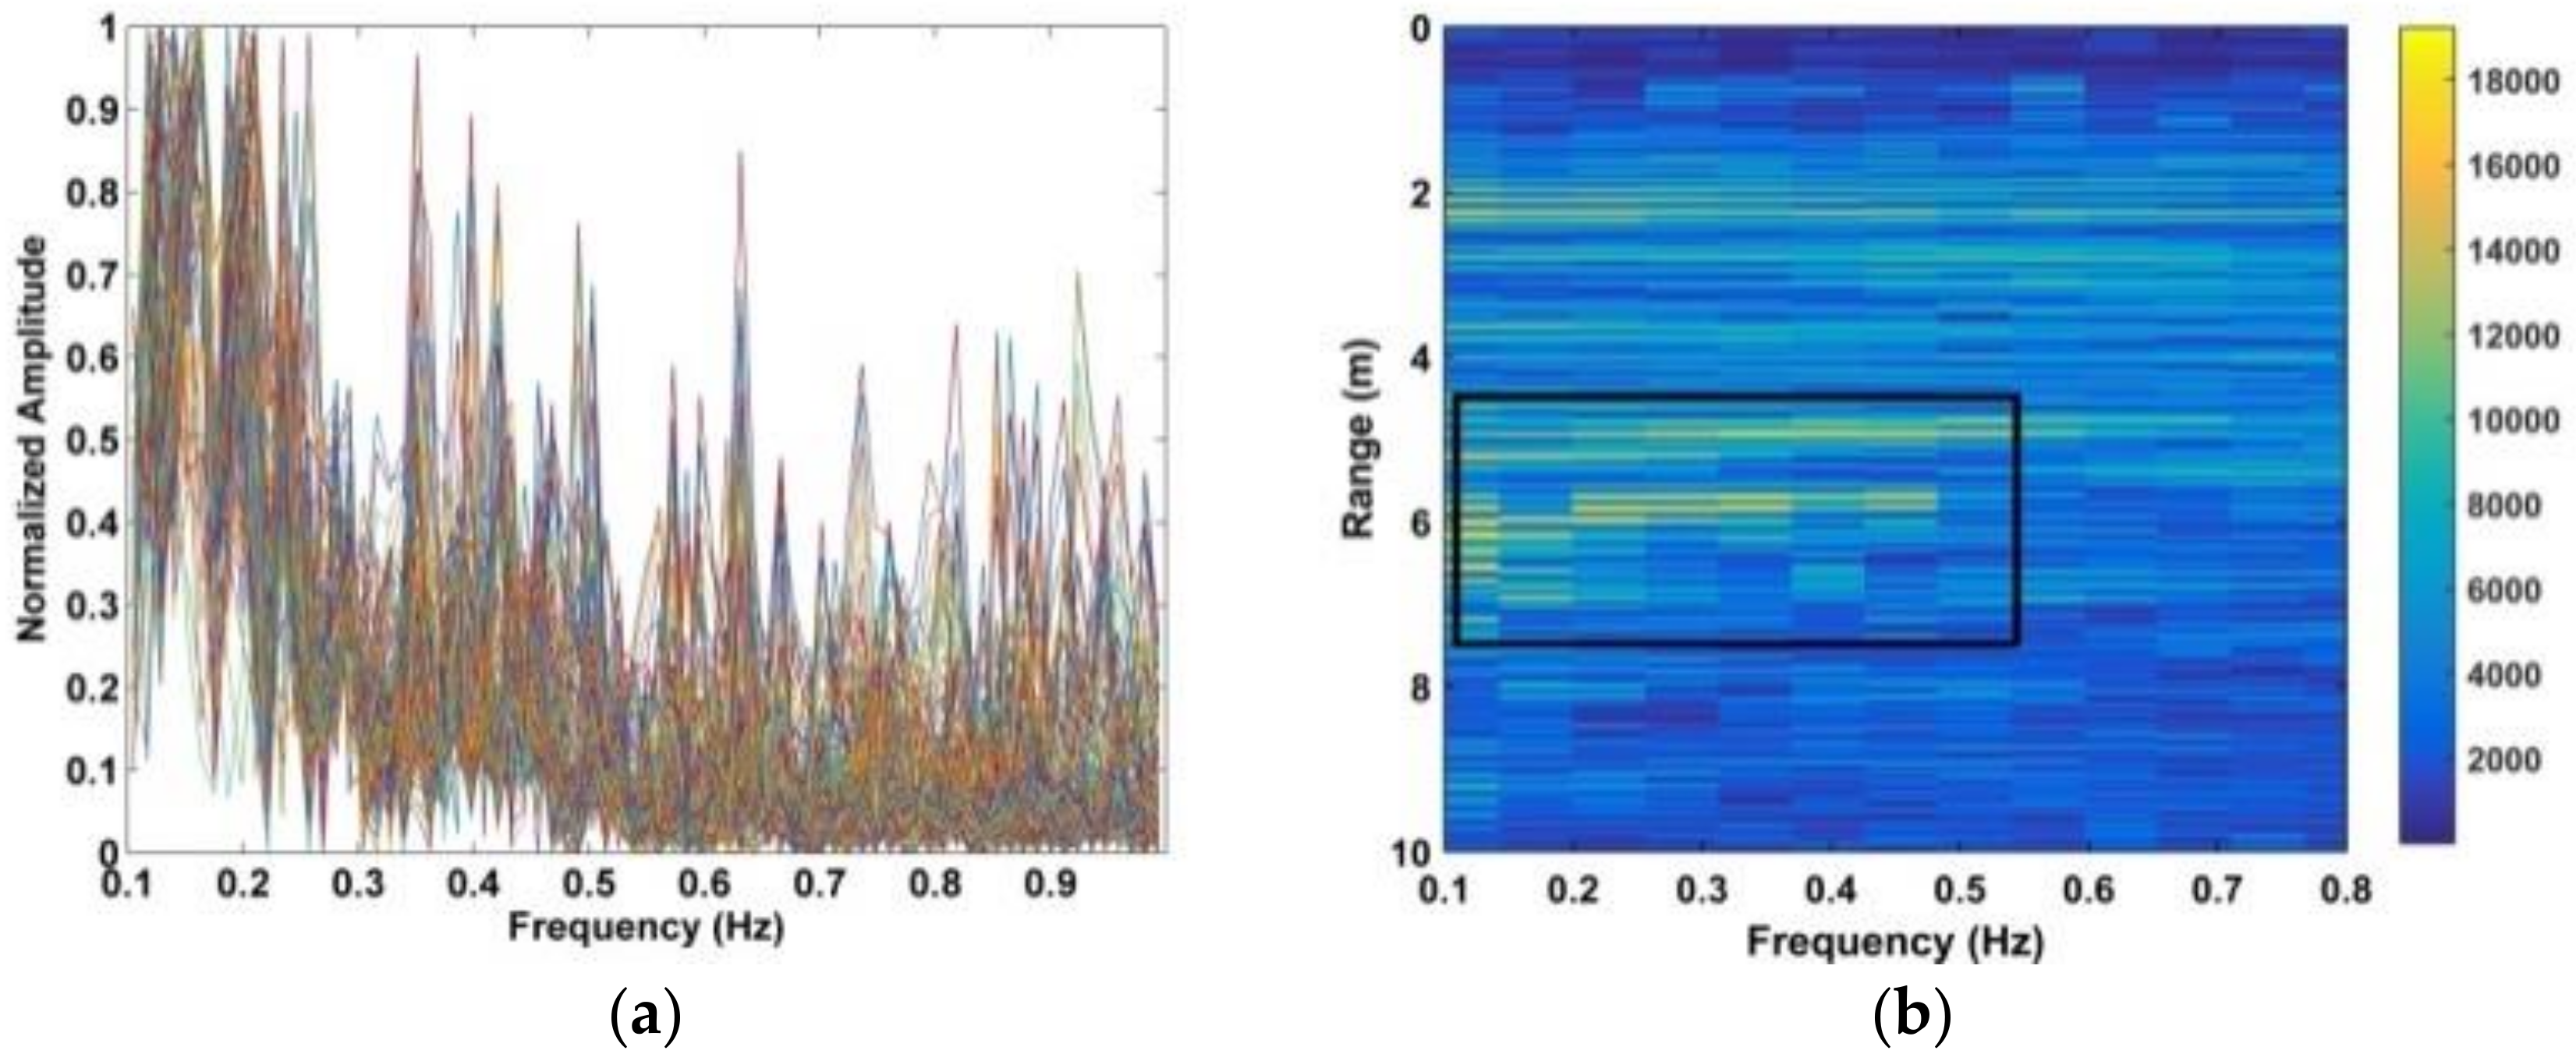
To improve the accuracy of the range estimate given by (23), a frequency accumulator is employed to eliminate the harmonics of the respiration signal. The frequency of this signal is typically in the range 0.2 Hz to 0.4 Hz [23,24]. After an FFT is performed on to obtain , a frequency window of width 0.1 Hz to 0.8 Hz is used. A typical output is shown in Figure 9a. The resulting matrix is where is the number of values between 0.1 to 0.8 Hz, is the index corresponding to 0.8 Hz, and is the index corresponding to 0.1 Hz. Then the following operation is performed [51]
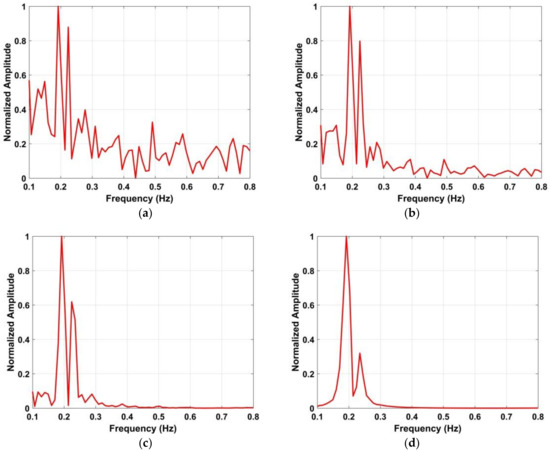
Figure 9.
Results after harmonic suppression with a human subject 6 m from the antenna (a) FFT, (b) one frequency accumulator, (c) two frequency accumulators, and (d) four frequency accumulators.
The frequency accumulator output is then
where .
The amplitude of versus frequency using a single frequency accumulator is shown in Figure 9b. There are signals with large amplitudes at several frequencies which make it difficult to estimate the respiration frequency. However, as shown in Figure 9c,d, the respiration signal is significantly enhanced using multiple frequency accumulators. Based on these results, the range and respiration frequency are obtained from after frequency accumulation, i.e., (24) and (25), is applied four times.
To further reduce the respiration harmonics, a length vector is obtained from which is given by
where . The normalized amplitude of is shown in Figure 10 using a data set obtained at a distance of 6 m between the antenna and subject. This shows that the harmonics are almost completely eliminated. The human respiration frequency can be estimated as
where , and is the index of the maximum . The distance estimates is then
where
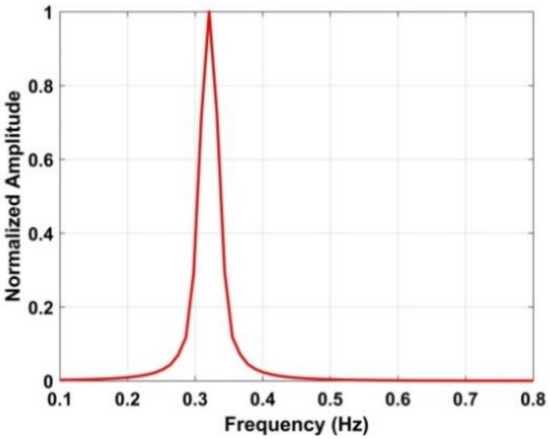
Figure 10.
The normalized amplitude using four frequency accumulators with a human subject 6 m from the antenna.
Equations (23) and (28) provide two range estimates and the difference between them is
This provides an estimate of the range error. As a result, it can be used as a basis for determining if a human subject is present by employing a suitable threshold. This will be examined in the next section.
4. Detection Performance and Discussion
In this section, three well-known methods, namely constant false alarm ratio (CFAR) [33], advanced method (AM) [36], and, multiple higher order cumulant (MHOC) [37] are considered to evaluate the performance of the proposed technique.
4.1. Experimental Setup
A series of experiments were conducted at the Institute of Electronics, Chinese Academy of Sciences in Beijing and the China National Fire Equipment Quality Supervision Centre in Shanghai. The experimental setup is shown in Figure 11.
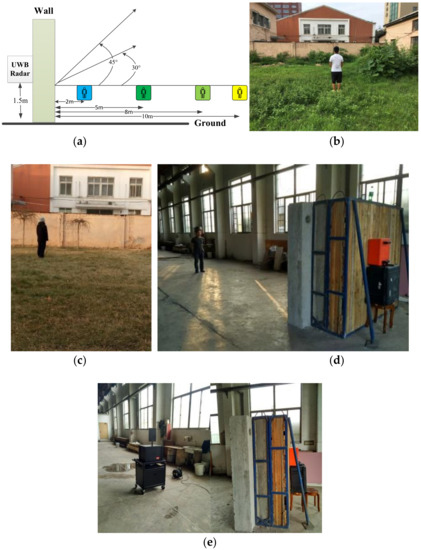
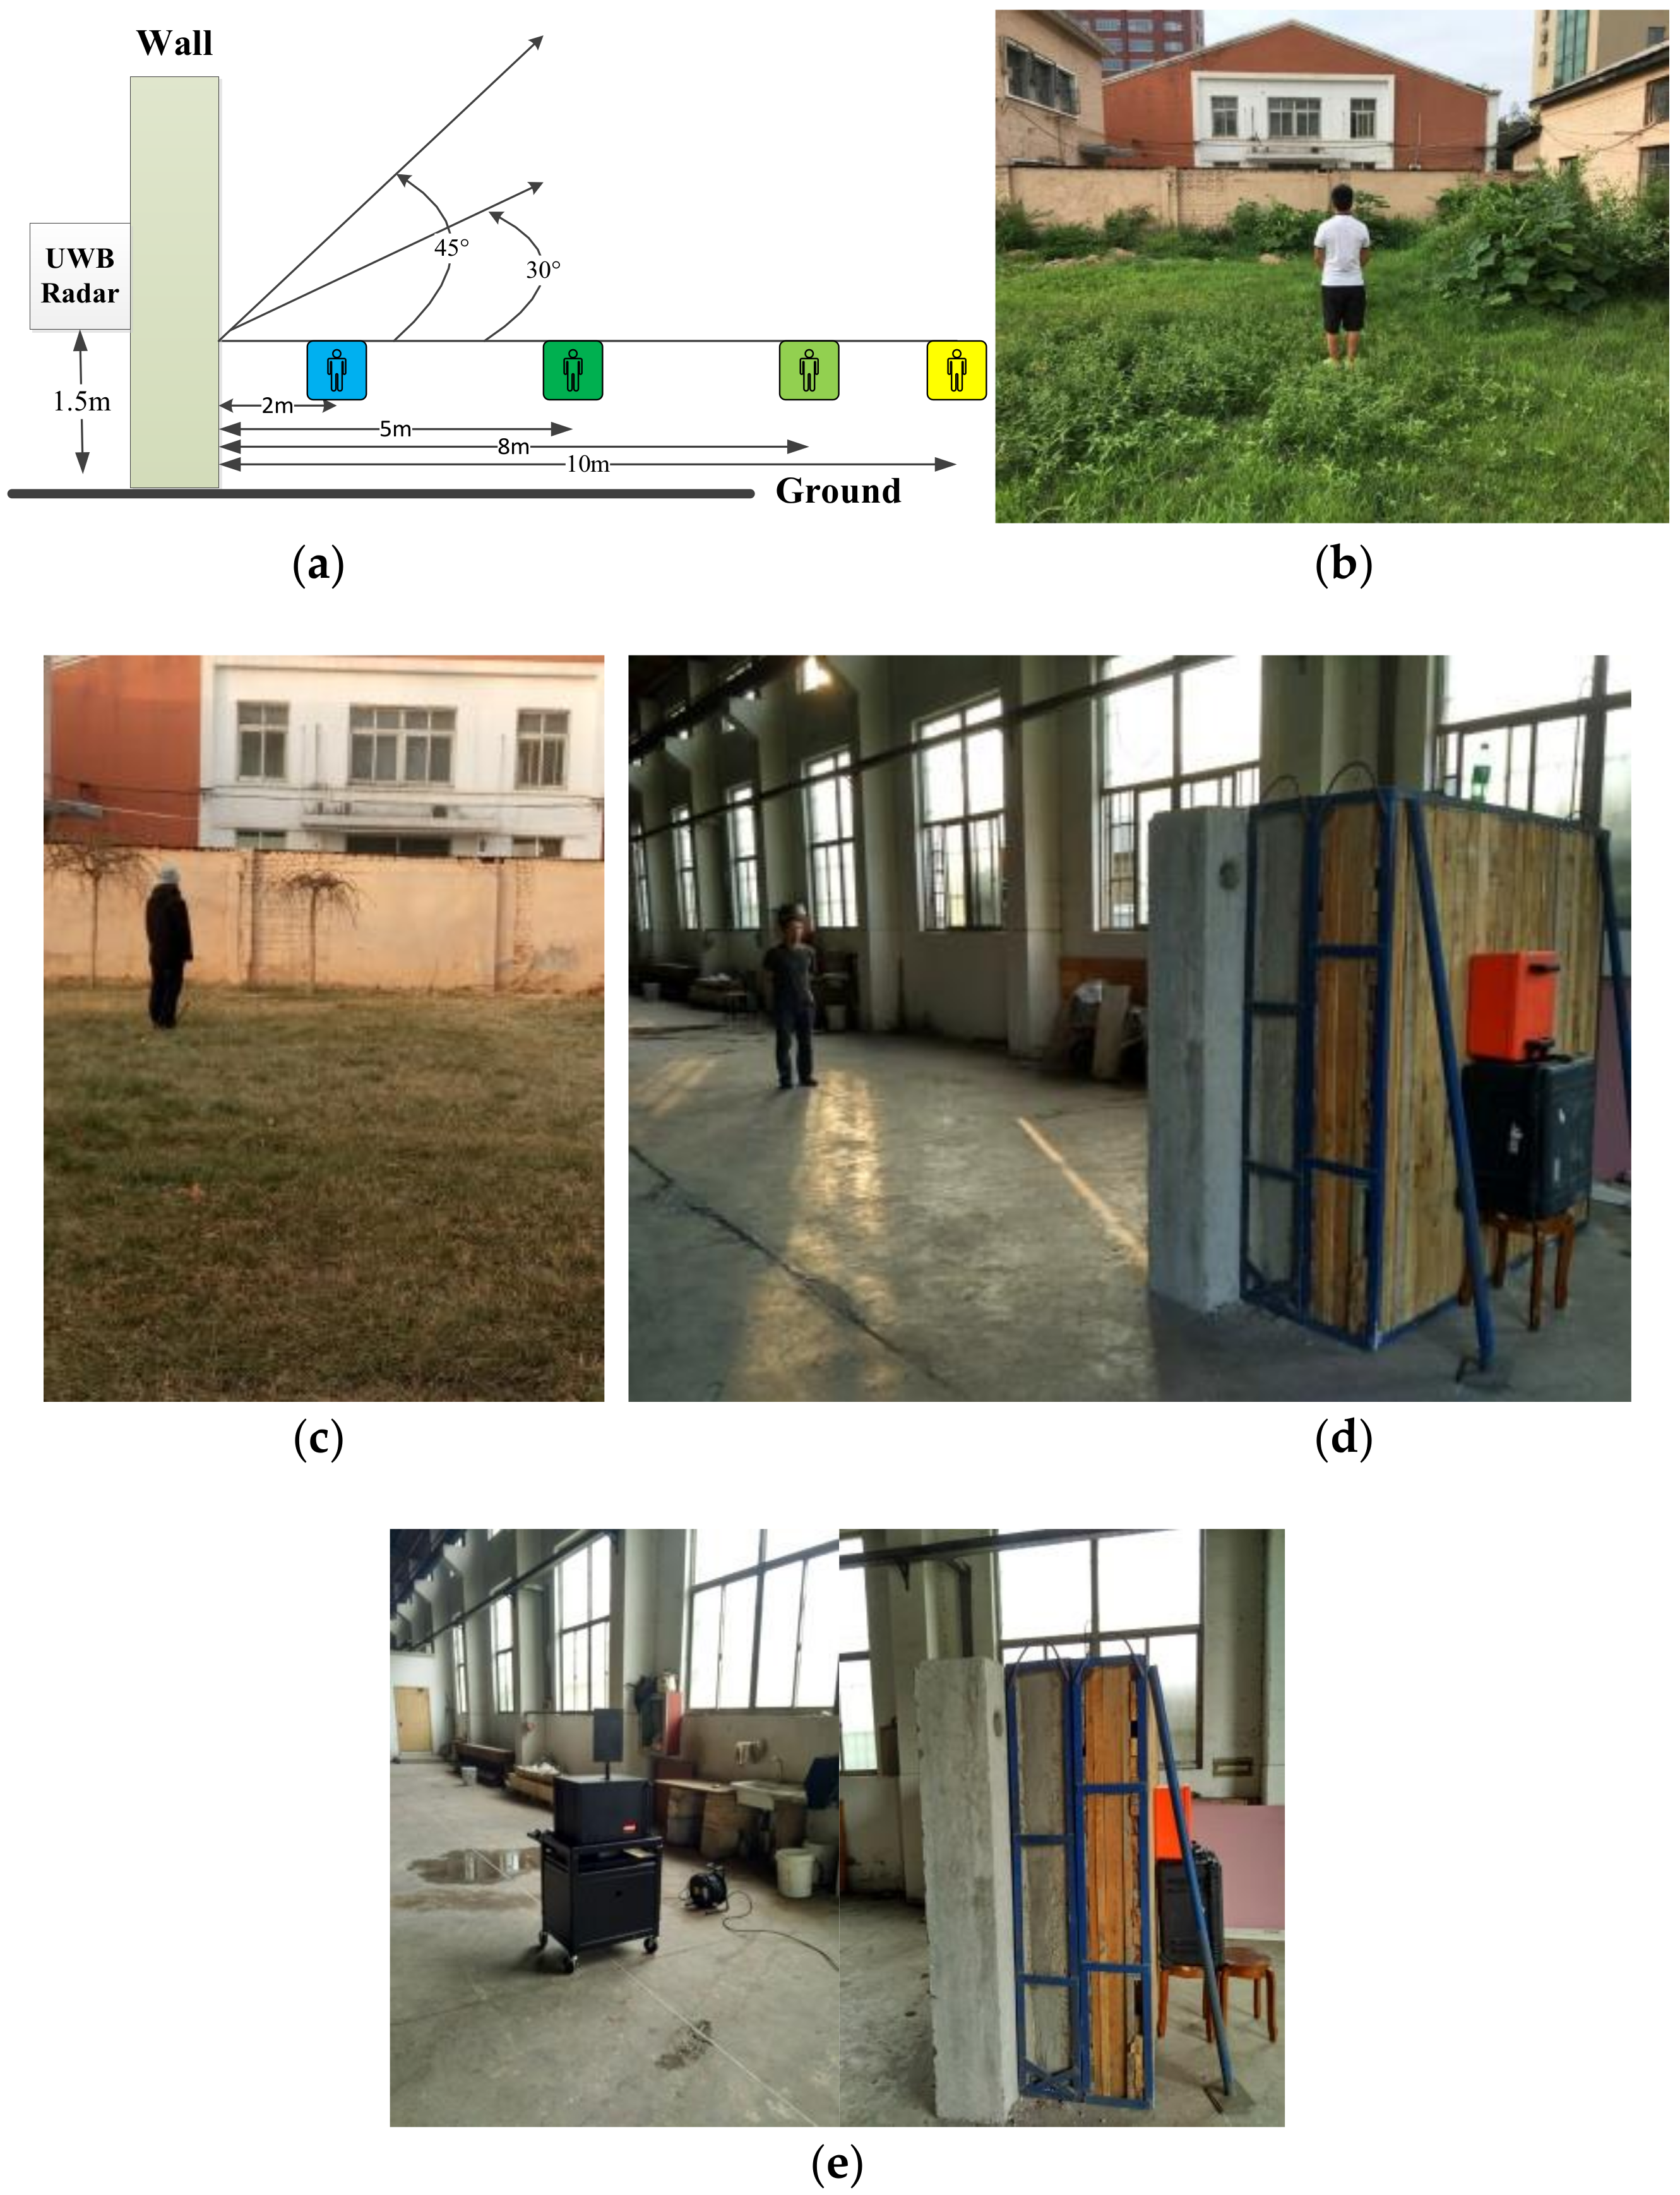
Figure 11.
The experimental setup for data acquisition, (a) the experiment model, (b) through-wall detection outdoors, (c) the azimuth angle experiment, (d) through-wall detection indoors, and (e) the actuator experiment.
The first experiment was performed outdoors at the Institute of Electronics, Chinese Academy of Sciences, with a male human subject as shown in Figure 11b. The subject stood behind the wall at distances of 300 cm, 600 cm, 900 cm, and 1100 cm from the radar facing the antenna. Disaster victims are typically buried in rubble composed of different building materials, so the wall consists of three common building materials, 30 cm of brick, 35 cm of concrete, and 35 cm of wood, for a total thickness of 1 m. The radar was installed on a table 150 cm above ground. The detection performance with the steps before the FFT as discussed previously were obtained using the outdoor experimental data for a female subject behind the wall facing the antenna at a distance of 600 cm from the antenna in Section 4.2, and Section 4.3 and Section 4.4 analyzed the detection results using the developed method based on the data acquired in this experiment.
The second experiment was carried out indoors with a different human subject standing behind the wall at distances of 700 cm and 1000 cm facing the antenna at the China National Fire Equipment Quality Supervision Center as shown in Figure 11d. The detection results using the data acquired in this experiment were given in Section 4.3 to validate the detection performance of the proposed algorithm.
In the third experiment, a male human subject stood at angles of 0°, 30° and 45° with respect to the antenna at the Institute of Electronics, Chinese Academy of Sciences, as shown in Figure 11c. The distance between the subject and antenna is 1100 cm, and the beam angle is 60°. Section 4.5 showed the influence of the azimuth angle between the subject and antenna on the detection performance.
The fourth experiment was carried out indoors at the China National Fire Equipment Quality Supervision Center using the actuator shown in Figure 11e to imitate human respiration. The actuator was placed on a desk 130 m above ground with a distance between the actuator and antenna of 400 cm and 700 cm. The fifth experiment was carried out outdoors at the Institute of Electronics, Chinese Academy of Sciences, using the actuator to imitate human respiration. The actuator was placed on a desk 130 cm above ground with a distance between the actuator and antenna of 1100 cm. The performance of the developed algorithm is validated using these data acquired from the actuator as shown in Section 4.6.
In the sixth experiment, six human subjects (four males and two females) were employed to acquire data using the outdoor setup. All subjects stood facing the antenna at distances of 300 cm, 600 cm, 900 cm, and 1100 cm from the wall. Three datasets were obtained for each subject and distance for a total of 72 datasets. All these datasets are used to determine if a human is present in the detection environment as in Section 4.7.
4.2. Initial Detection Performance
The detection performance with the steps before the FFT as discussed previously were obtained using the outdoor experimental data for a female subject behind the wall facing the antenna at a distance of 600 cm from the antenna. The results after removing the clutter and linear trend are shown in Figure 12a. This shows that the respiration signal is very weak and difficult to see. The results after filtering in fast and slow time are given in Figure 12b,c, respectively. This shows a further reduction in the clutter resulting in an improvement in the respiration signal. Figure 12d shows that the human respiration signal is enhanced by employing the advanced automatic gain method. While the interference introduced by moving objects can have a significant effect on the received signal, this can be avoided by prohibiting people from moving in the environment.
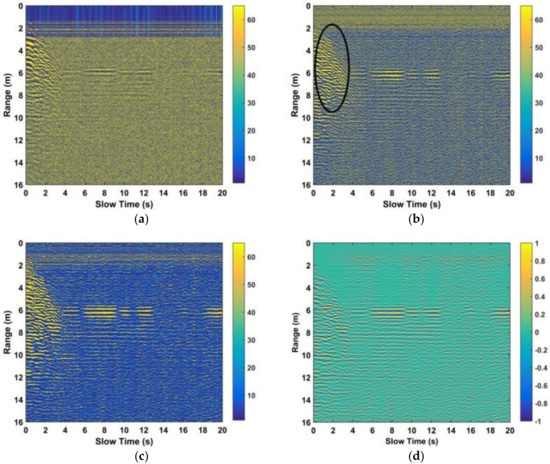
Figure 12.
(a) Range results after removing the static and non-static clutter and the linear trend, (b) after filtering in fast time, (c) after filtering in slow time, and (d) after respiration signal improvement using the data acquired with the human subject stood behind the wall at 600 cm from the radar facing the antenna.
4.3. Detection Performance
The improvement in SNCR using the proposed method is now illustrated using the datasets obtained using a human subject at distances of 300 cm to 1100 cm from the antenna in through-wall conditions. The well-known CFAR method is used as a reference. The Cramer-Rao low bound (CRLB) of an unbiased estimate of the variance of the respiration frequency is given by [37]
where MHz is the effective bandwidth, mm is the respiration signal amplitude, and is the number of pulses. This shows that increases as the SNR decreases, so the detection performance can be improved by increasing the SNR [37].
With no interference at the respiration frequency (which is reasonable), the SNR can be estimated as
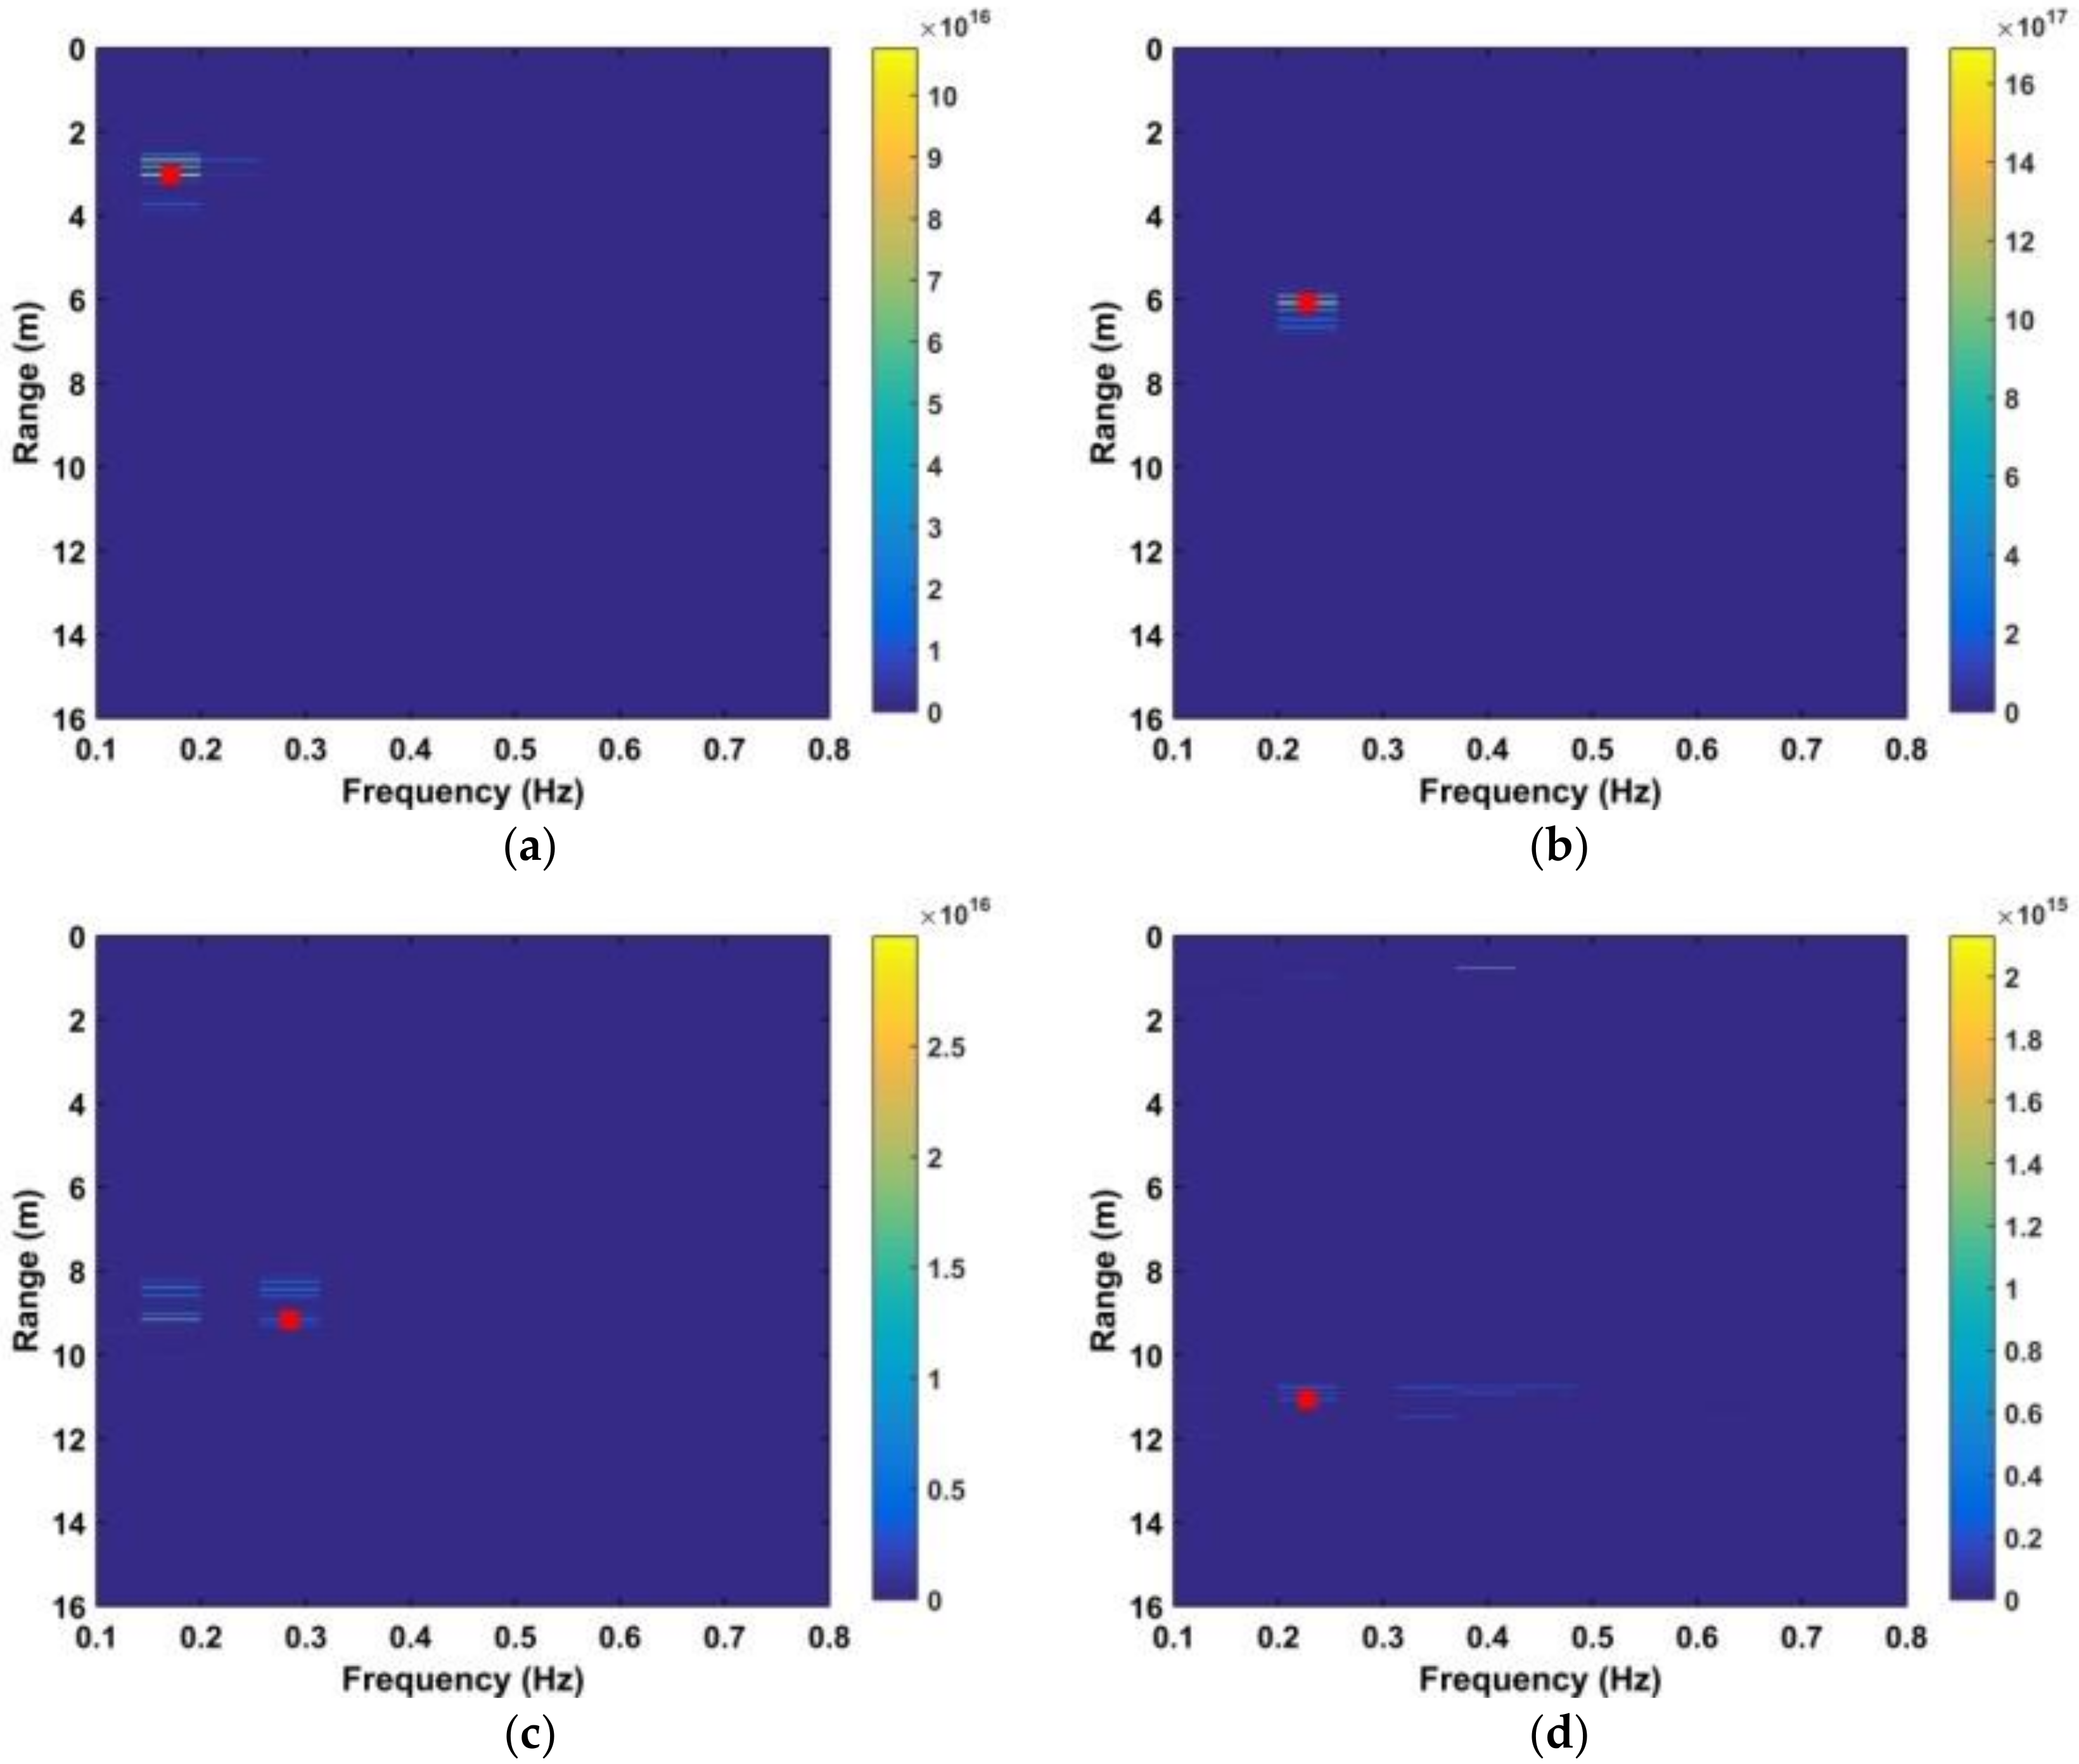
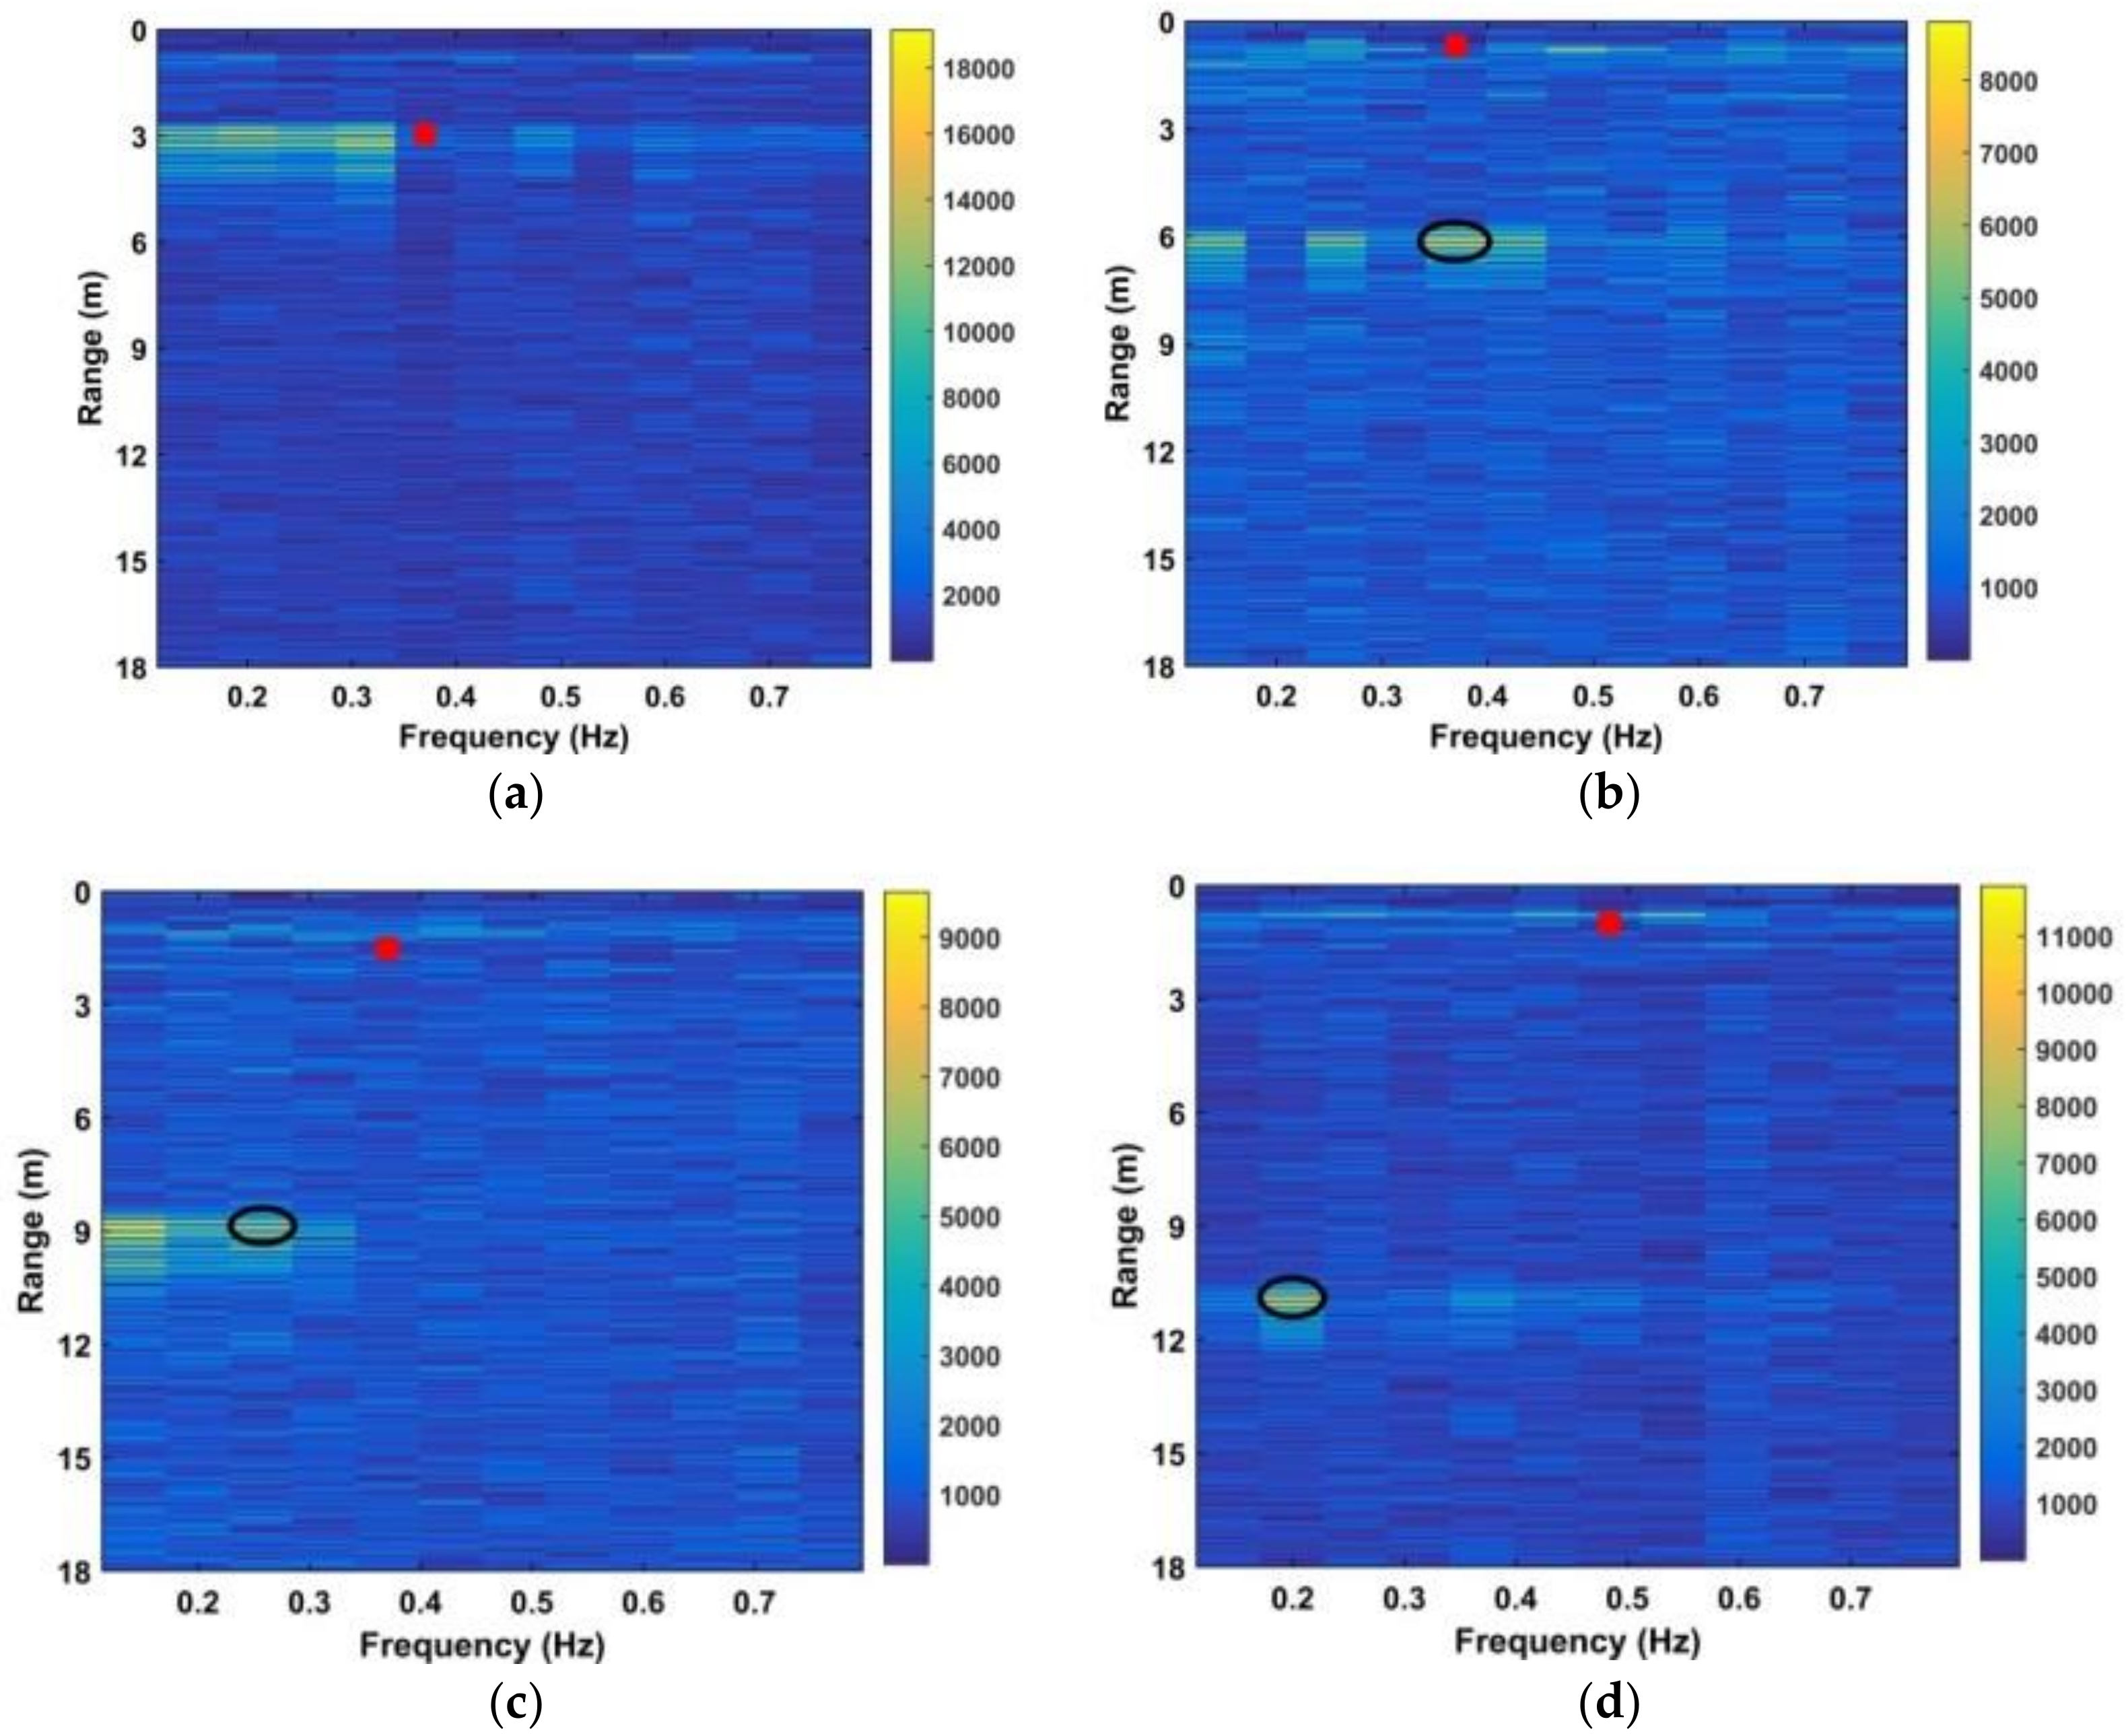
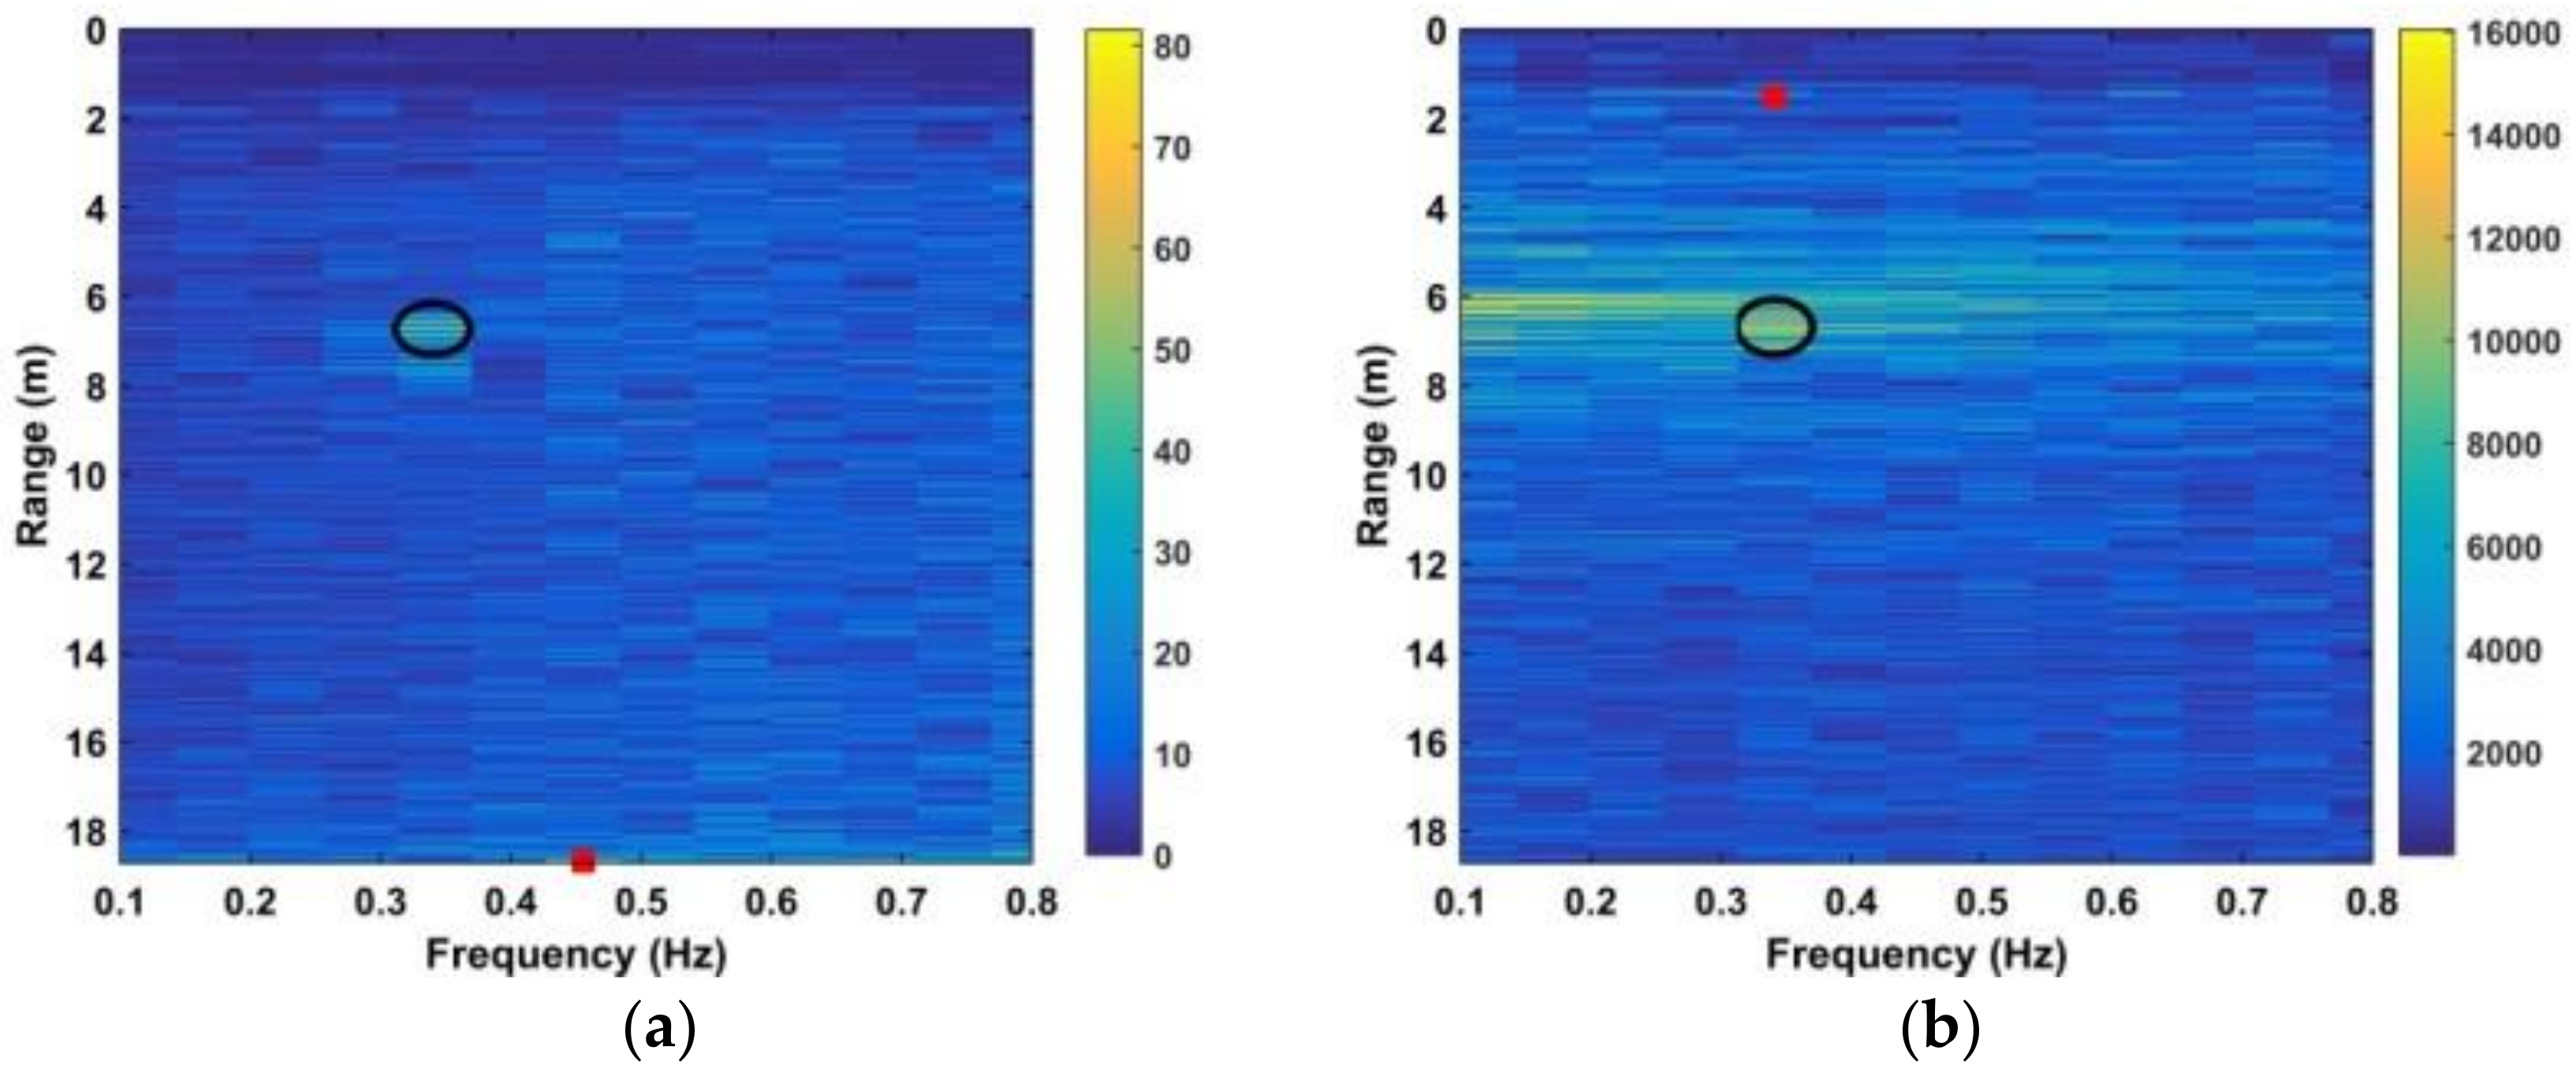
where and are given by (28) and (29), respectively. The SNR decreases with distance due to signal attenuation [37]. Thus, the improvement in SNR can be determined by considering the detection performance at different distances. The estimated range using four frequency accumulators is shown as red stars in Figure 13, while the estimated range using the DWFT is shown as red circles in Figure 14. The maximum error in the estimated range from (30) is 23.9 cm when the distance between the antenna and subject is 900 cm. Figure 15 gives the corresponding results with the CFAR method, and the results with the AM method are given in Figure 16.

Figure 13.
Results after four frequency accumulations at distances between the antenna and human subject of (a) 300 cm, (b) 600 cm, (c) 900 cm, and (d) 1100 cm.
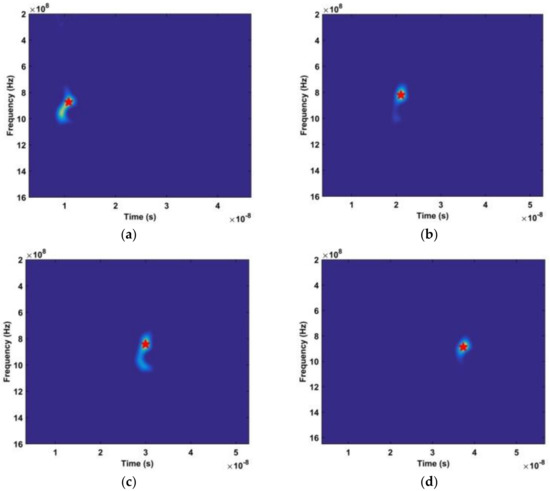
Figure 14.
Results after performing the DWFT with a human subject at distances between the antenna and human subject of (a) 300 cm, (b) 600 cm, (c) 900 cm, and (d) 1100 cm.
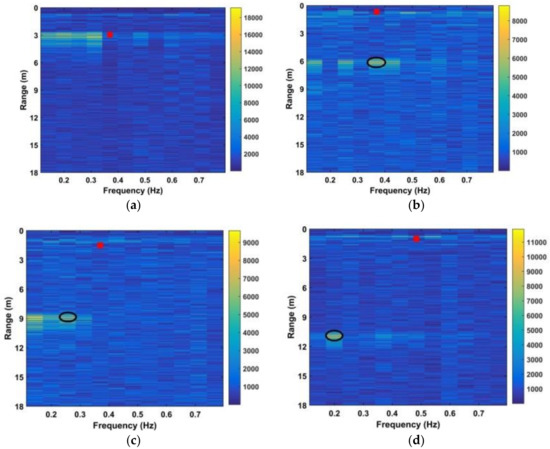
Figure 15.
Results using the CFAR method with a human subject at distances between the antenna and human subject of (a) 300 cm, (b) 600 cm, (c) 900 cm, and (d) 1100 cm.
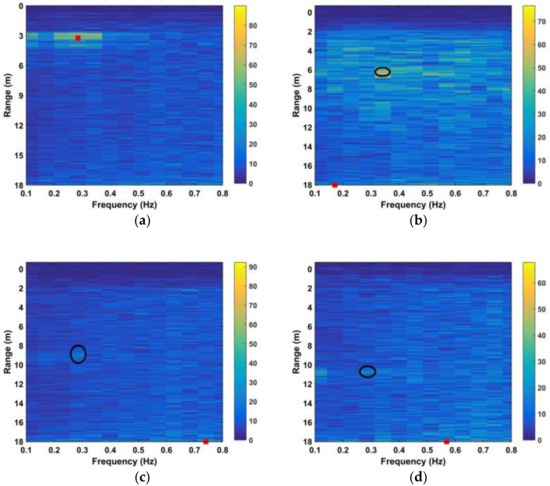
Figure 16.
Results using the AM method with a human subject at distances between the antenna and human subject of (a) 300 cm, (b) 600 cm, (c) 900 cm, and (d) 1100 cm.
The red squares denote the estimates while the black ellipses denote the true values. These results show that the subject range can be estimated accurately using the proposed method even at a distance of 1100 cm, while the CFAR method is only accurate at a distance of 300 cm. Table 2 presents the SNR values obtained using (32) for the CFAR, MHOC, AM, and proposed methods at distances of 300 cm, 600 cm, 900 cm, and 1100 cm. These results show that the proposed method provides the best SNR at all distances, while the CFAR method provides minimal SNR improvement. Although the MHOC and AM methods have a better SNR improvement than the CFAR method, it will be shown that they provide poor detection results in long-range conditions.
Table 2.
SNR (dB) versus range for different algorithms.
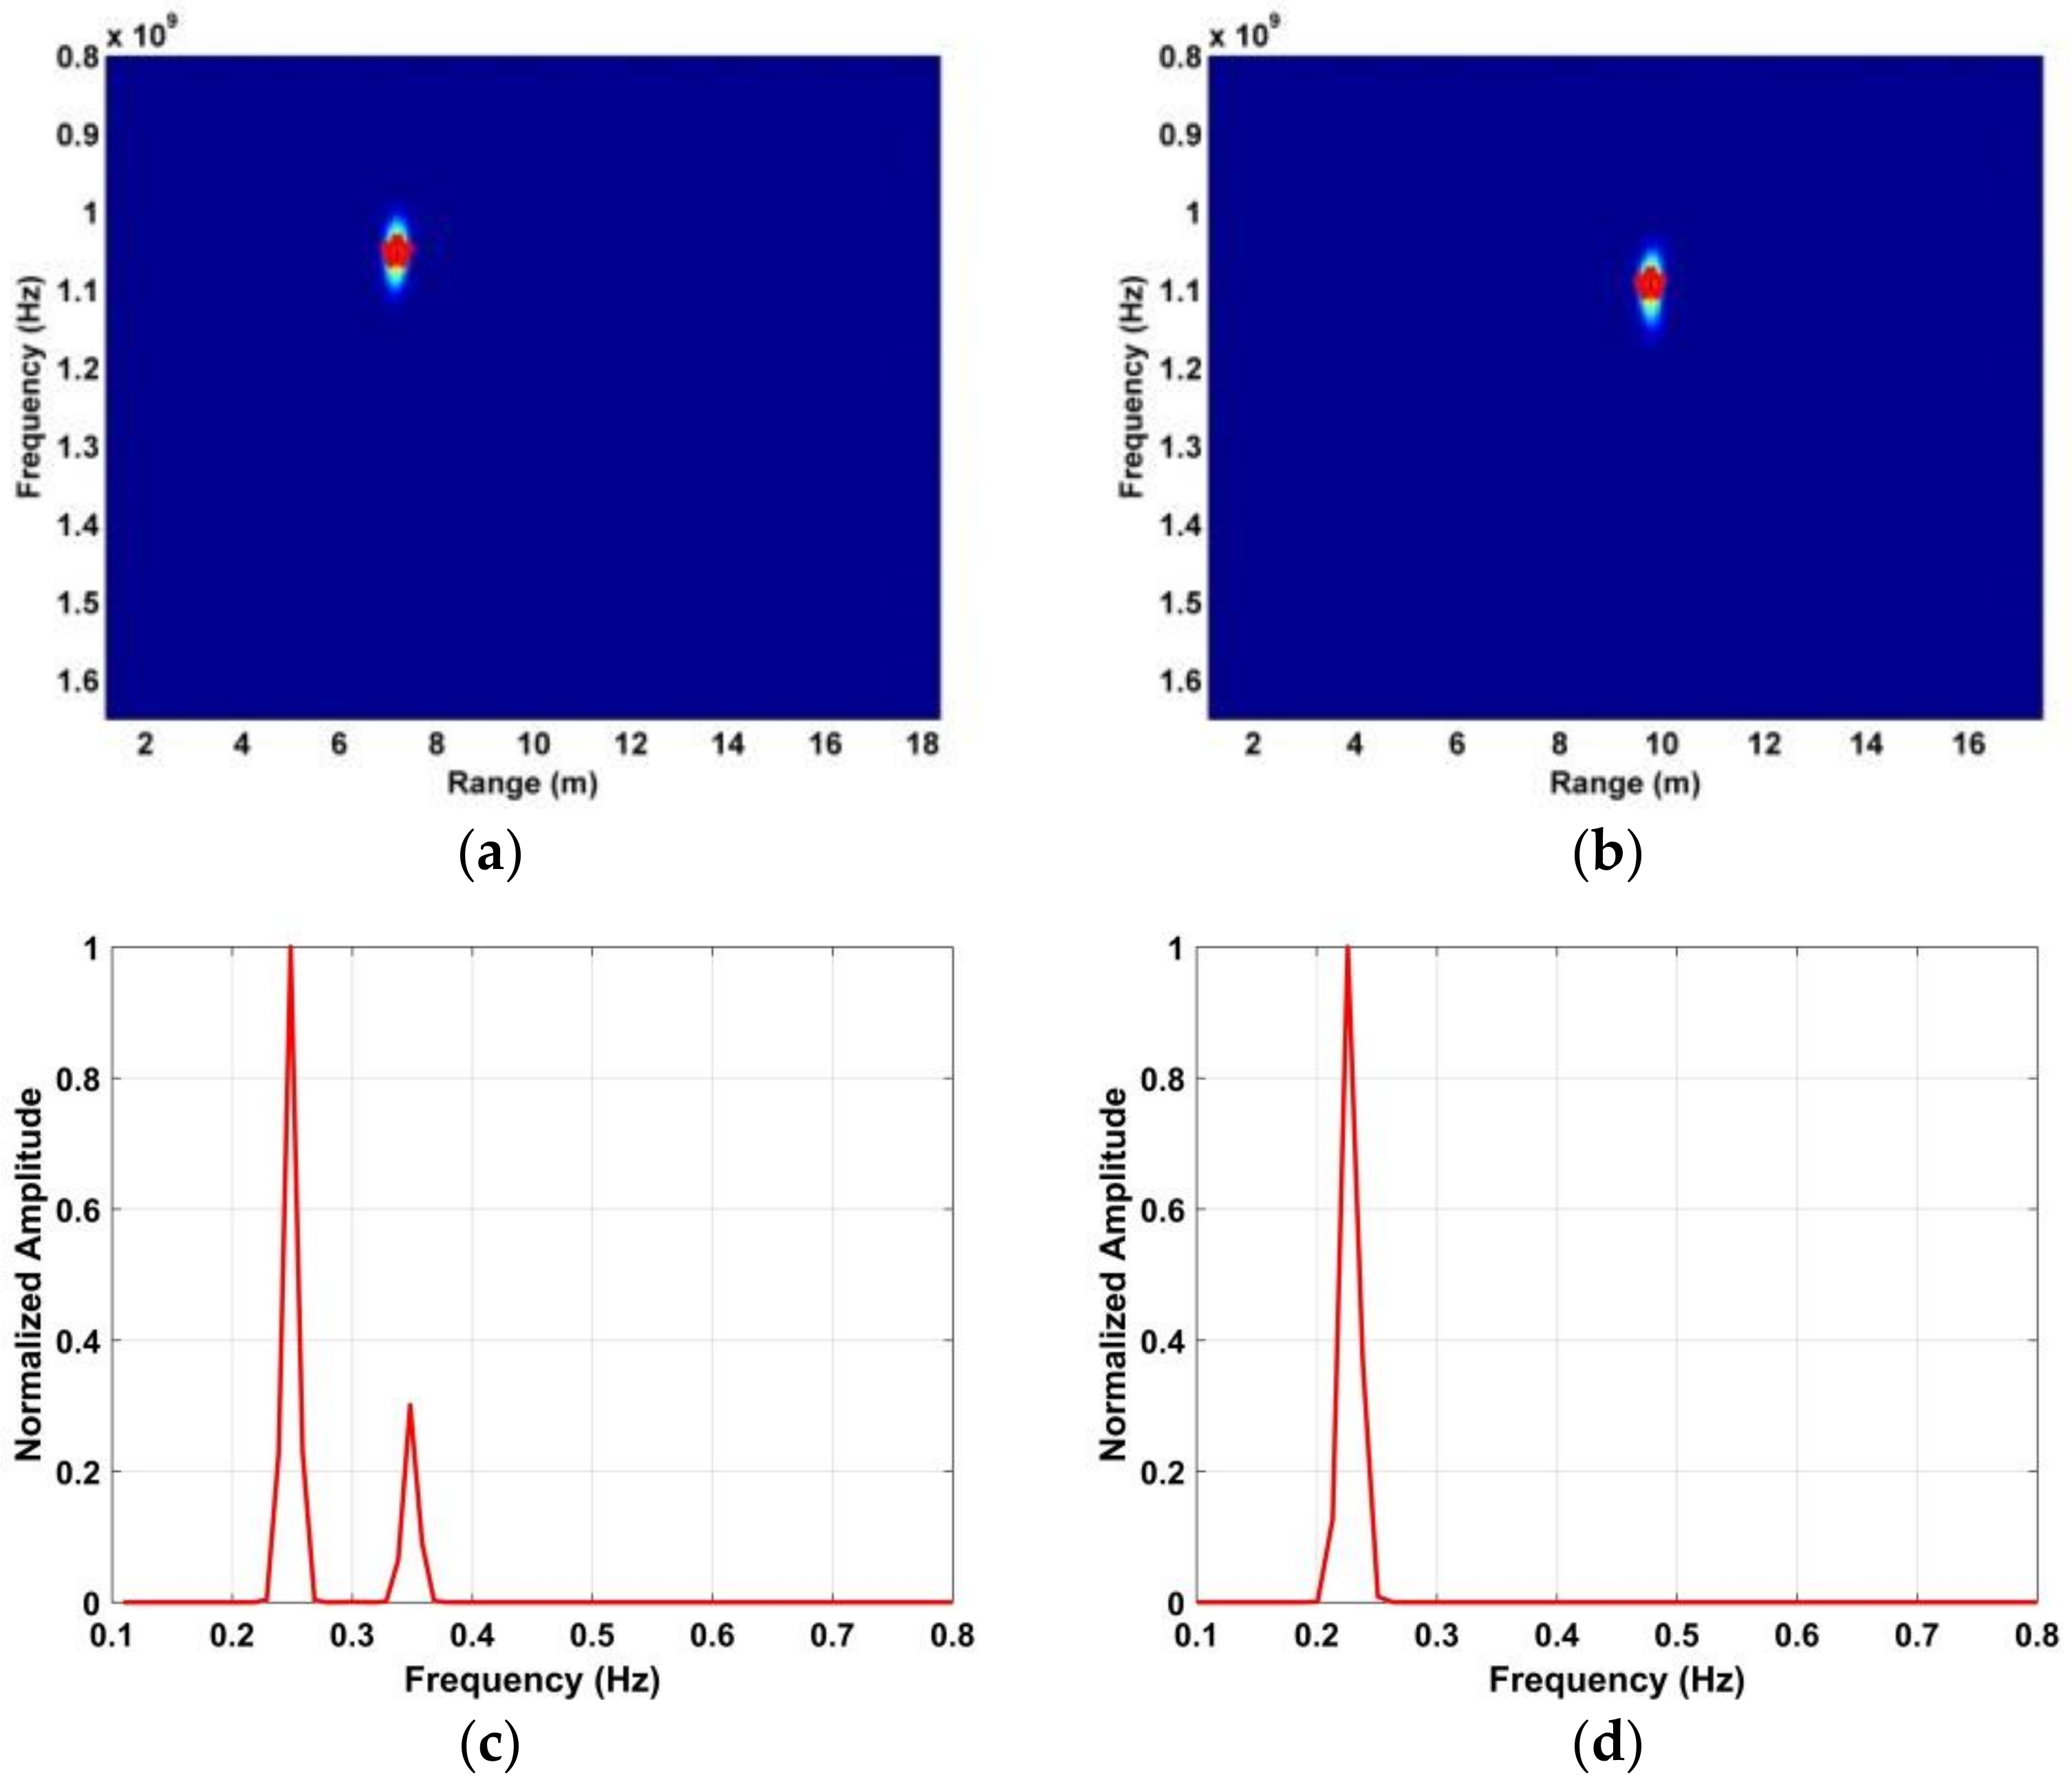
The experimental data obtained from the second experiment with the subject facing the antenna at distances of 700 cm and 1000 cm from the antenna in through-wall conditions was used to further validate the accuracy of the proposed method. The detection results are shown in Figure 17 and indicate that the range can be determined more accurately indoors. This is due in part to the presence of wind outdoors. For example, the maximum error obtained using (30) is only 6.24 cm when the distance between the antenna and subject is 1000 cm. The corresponding respiration frequency estimate is 0.235 Hz.

Figure 17.
Results after performing the DWFT with indoor data, (a) range estimation at 700 cm, (b) range estimation at 1000 cm, (c) frequency estimation at 700 cm, and (d) frequency estimation at 1000 cm.
4.4. Interference Suppression
In this section, the MHOC method for interference suppression is illustrated using the data for a human subject 600 cm from the antenna. Figure 18a shows the results after suppressing the harmonics using the MHOC method, and the corresponding area of interest in the range-frequency matrix is given in Figure 18b. The SNR obtained using (32) with the data for a human subject 600 cm from the antenna versus the number of times the frequency accumulator is employed is shown in Table 3. These results indicate that the SNR is significantly improved when the frequency accumulator is employed four times compared with only once or twice, and there is little improvement when it is used six times. Thus, the frequency accumulation method is employed four times in this paper.
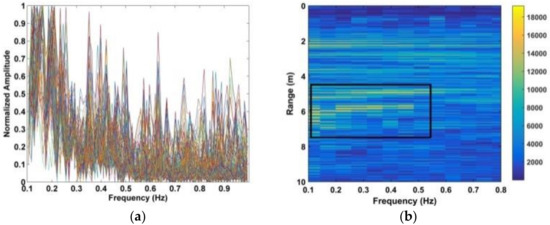
Figure 18.
(a) Respiration signal spectrum and (b) area of interest obtained using the MHOC method.
Table 3.
SNR with the frequency accumulation method.
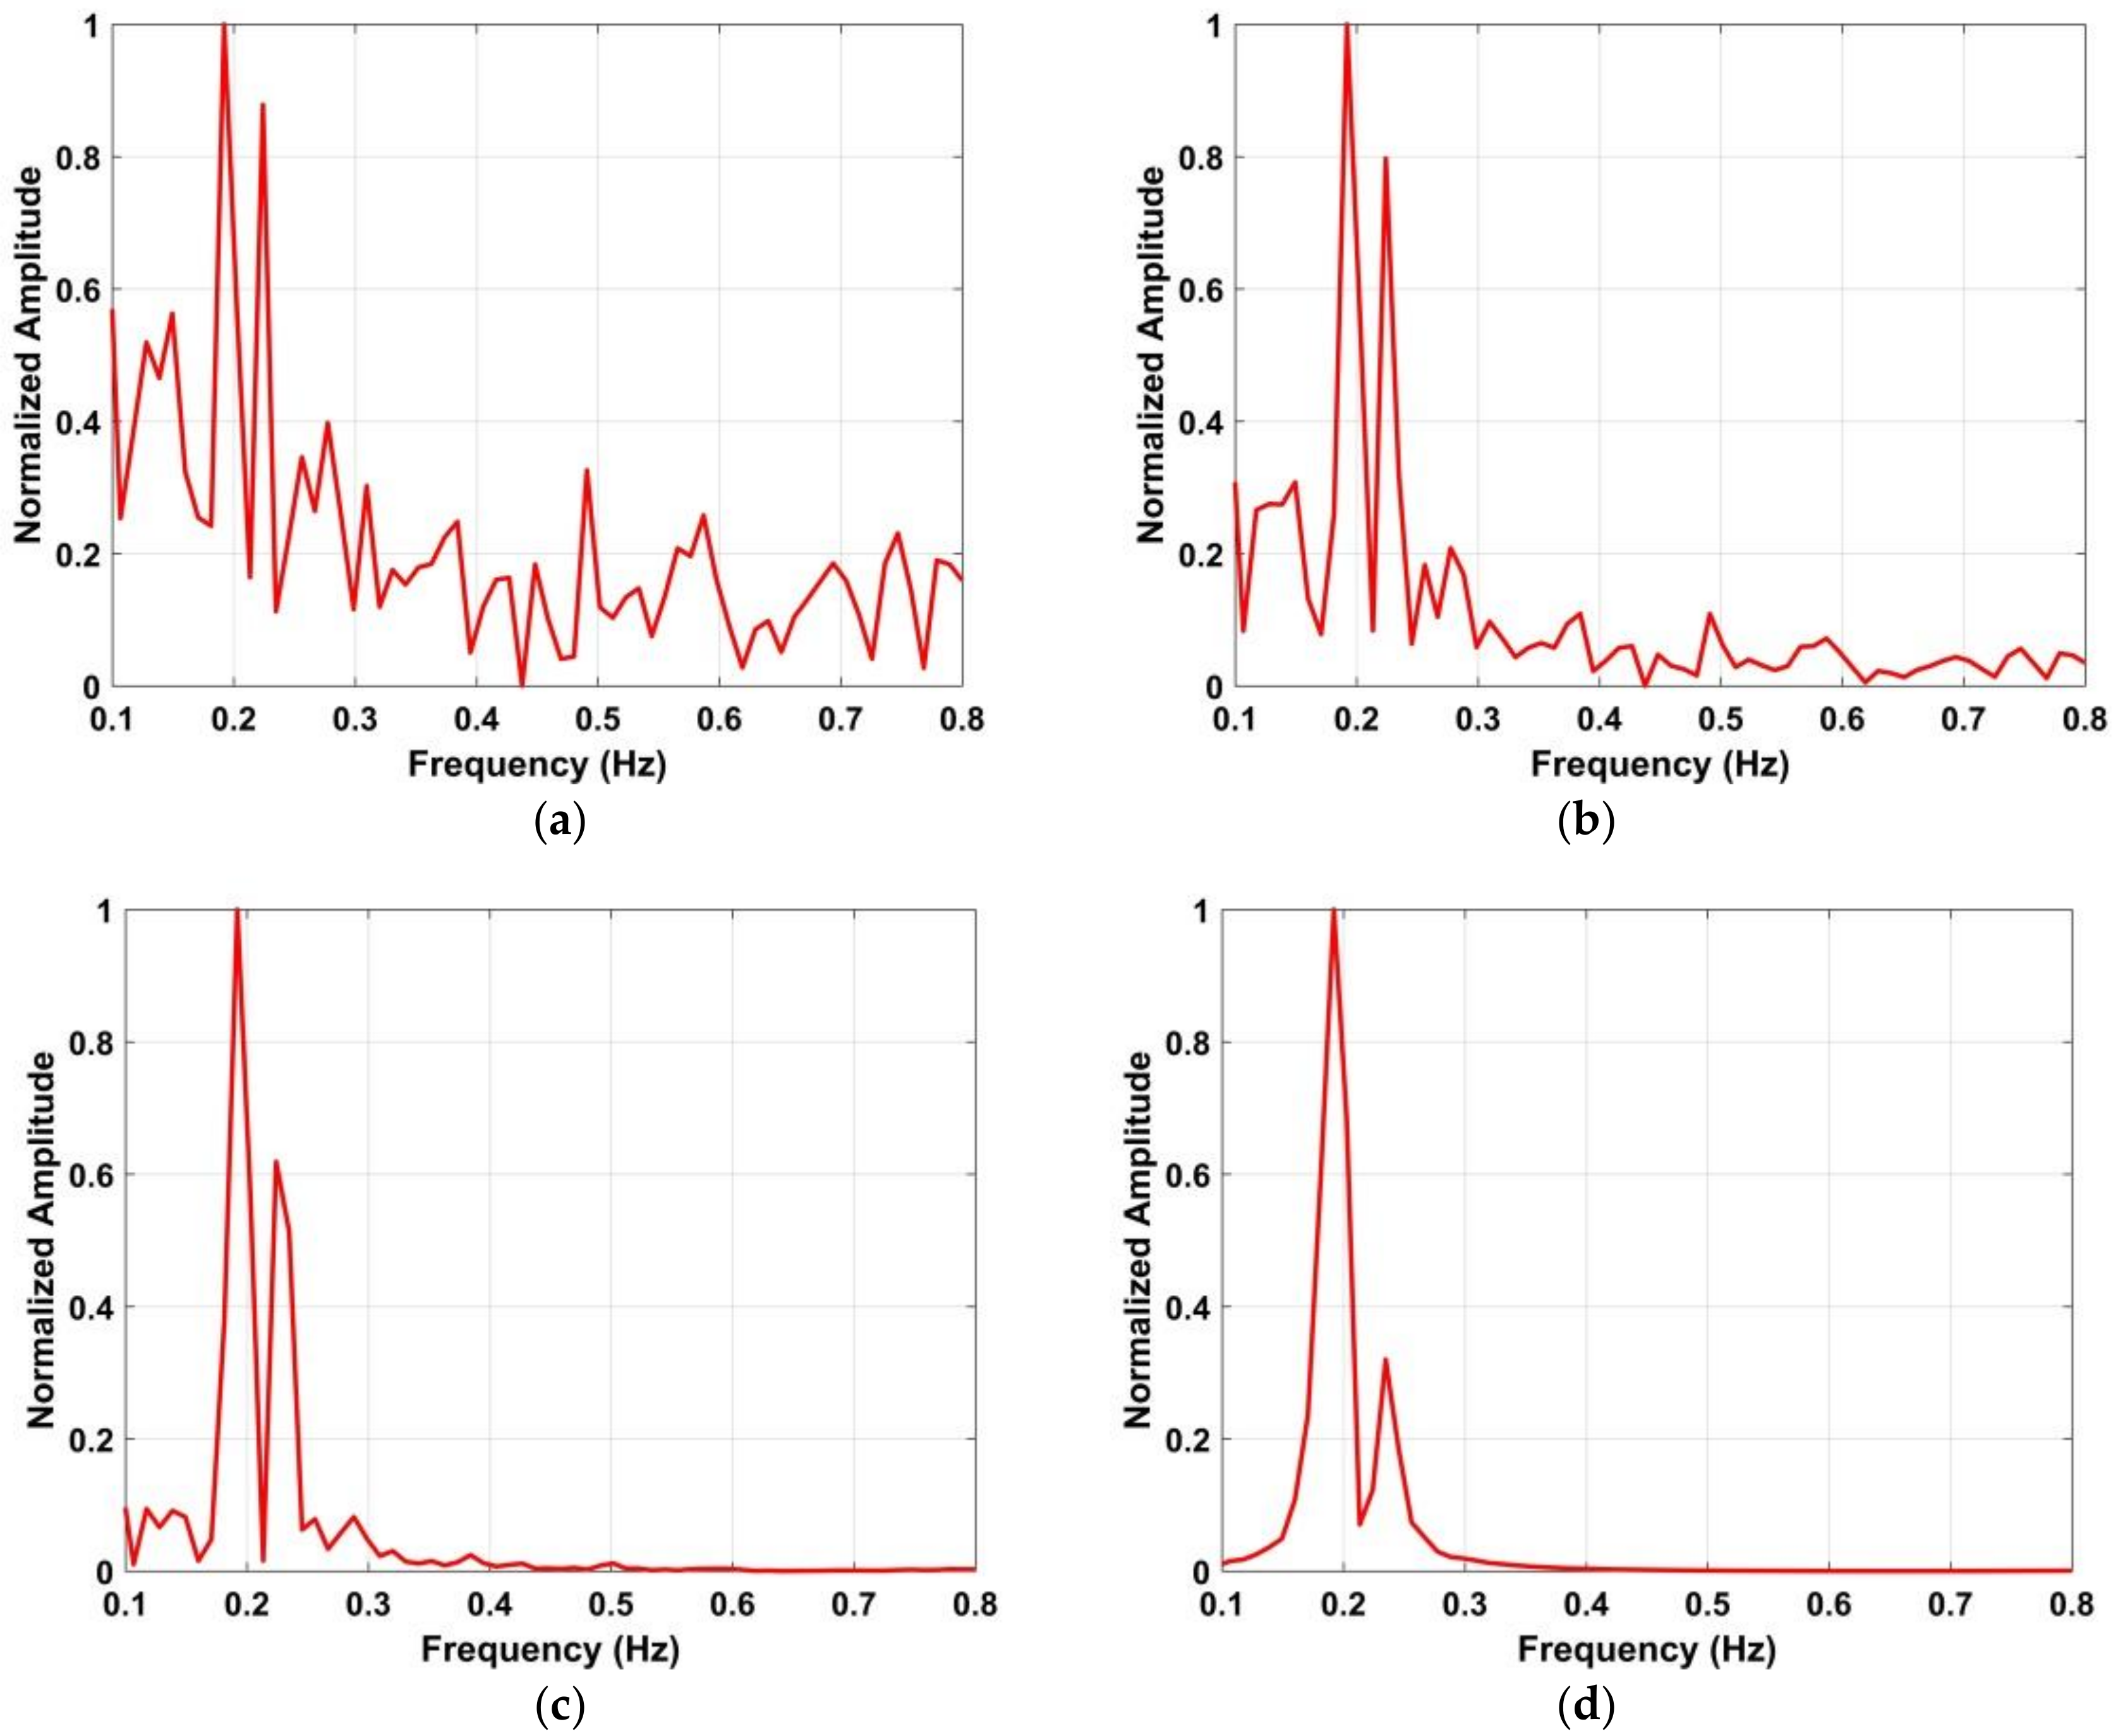
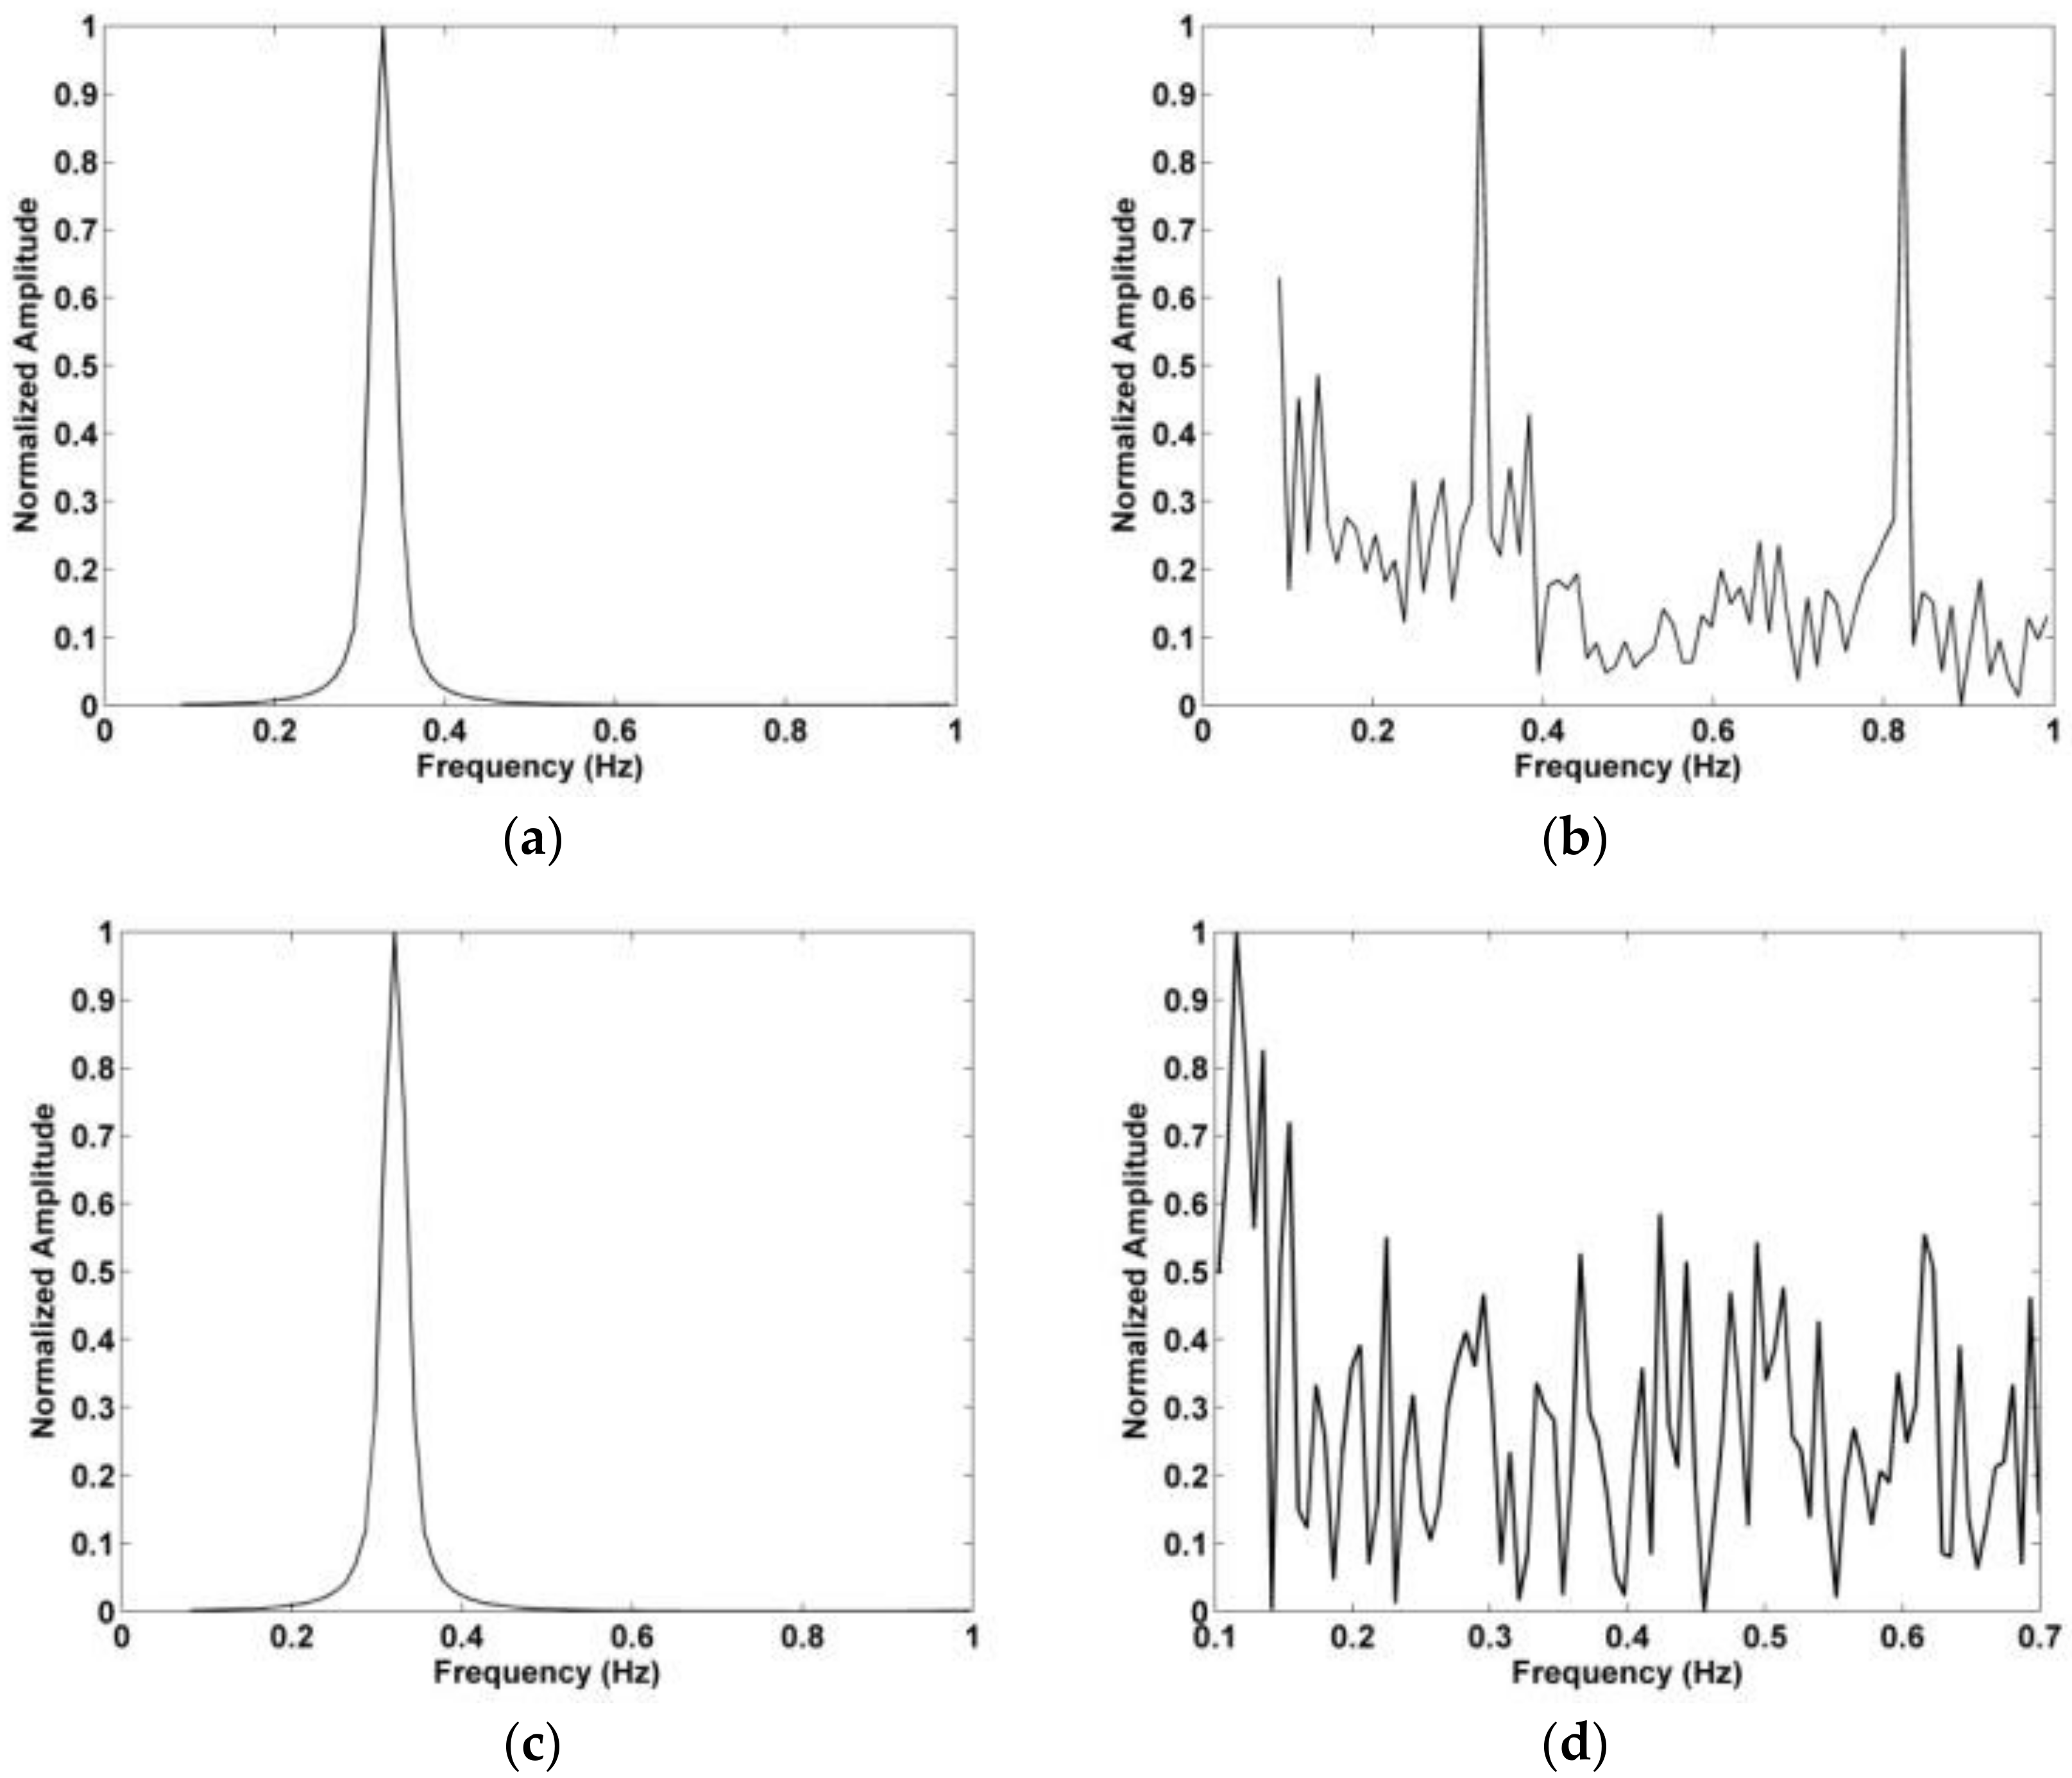
Figure 18 indicates that there still exist harmonics in the respiration frequency band after the frequency accumulator is employed. The results after suppressing the harmonics using the proposed method are shown in Figure 9d, and the corresponding normalized amplitude is shown in Figure 10. The normalized amplitude-frequency using the data with a distance between the antenna and human subject of 9 m and 11 m is shown in Figure 19. These results illustrate the effectiveness of the proposed method in interference and harmonic suppression. The respiration frequency can easily be determined to be approximately 0.3 Hz.
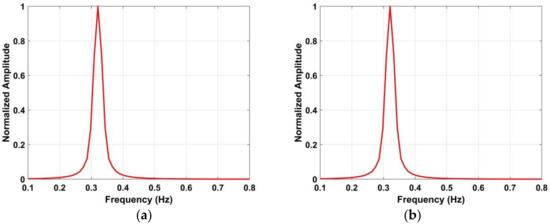
Figure 19.
The estimated human respiration frequency using the proposed method at distances between the antenna and human subject of (a) 900 cm, and (b) 1100 cm.
4.5. Detection Performance with Different Azimuth Angles
In this section, the influence of the azimuth angle between the subject and antenna on the detection performance is investigated. In this case, the subject is behind the wall at a distance of 1100 cm from the antenna. The detection performance with a 0° azimuth angle was discussed in the previous section. The results with an azimuth angle between the antenna and subject of 30° and 45° are shown in Figure 11a. After removing the clutter and linear trend, the corresponding normalized spectrums of the resulting signals using the proposed method are shown in Figure 20a. These results indicate that the amplitude of the respiration signal decreases as the azimuth angle increases.

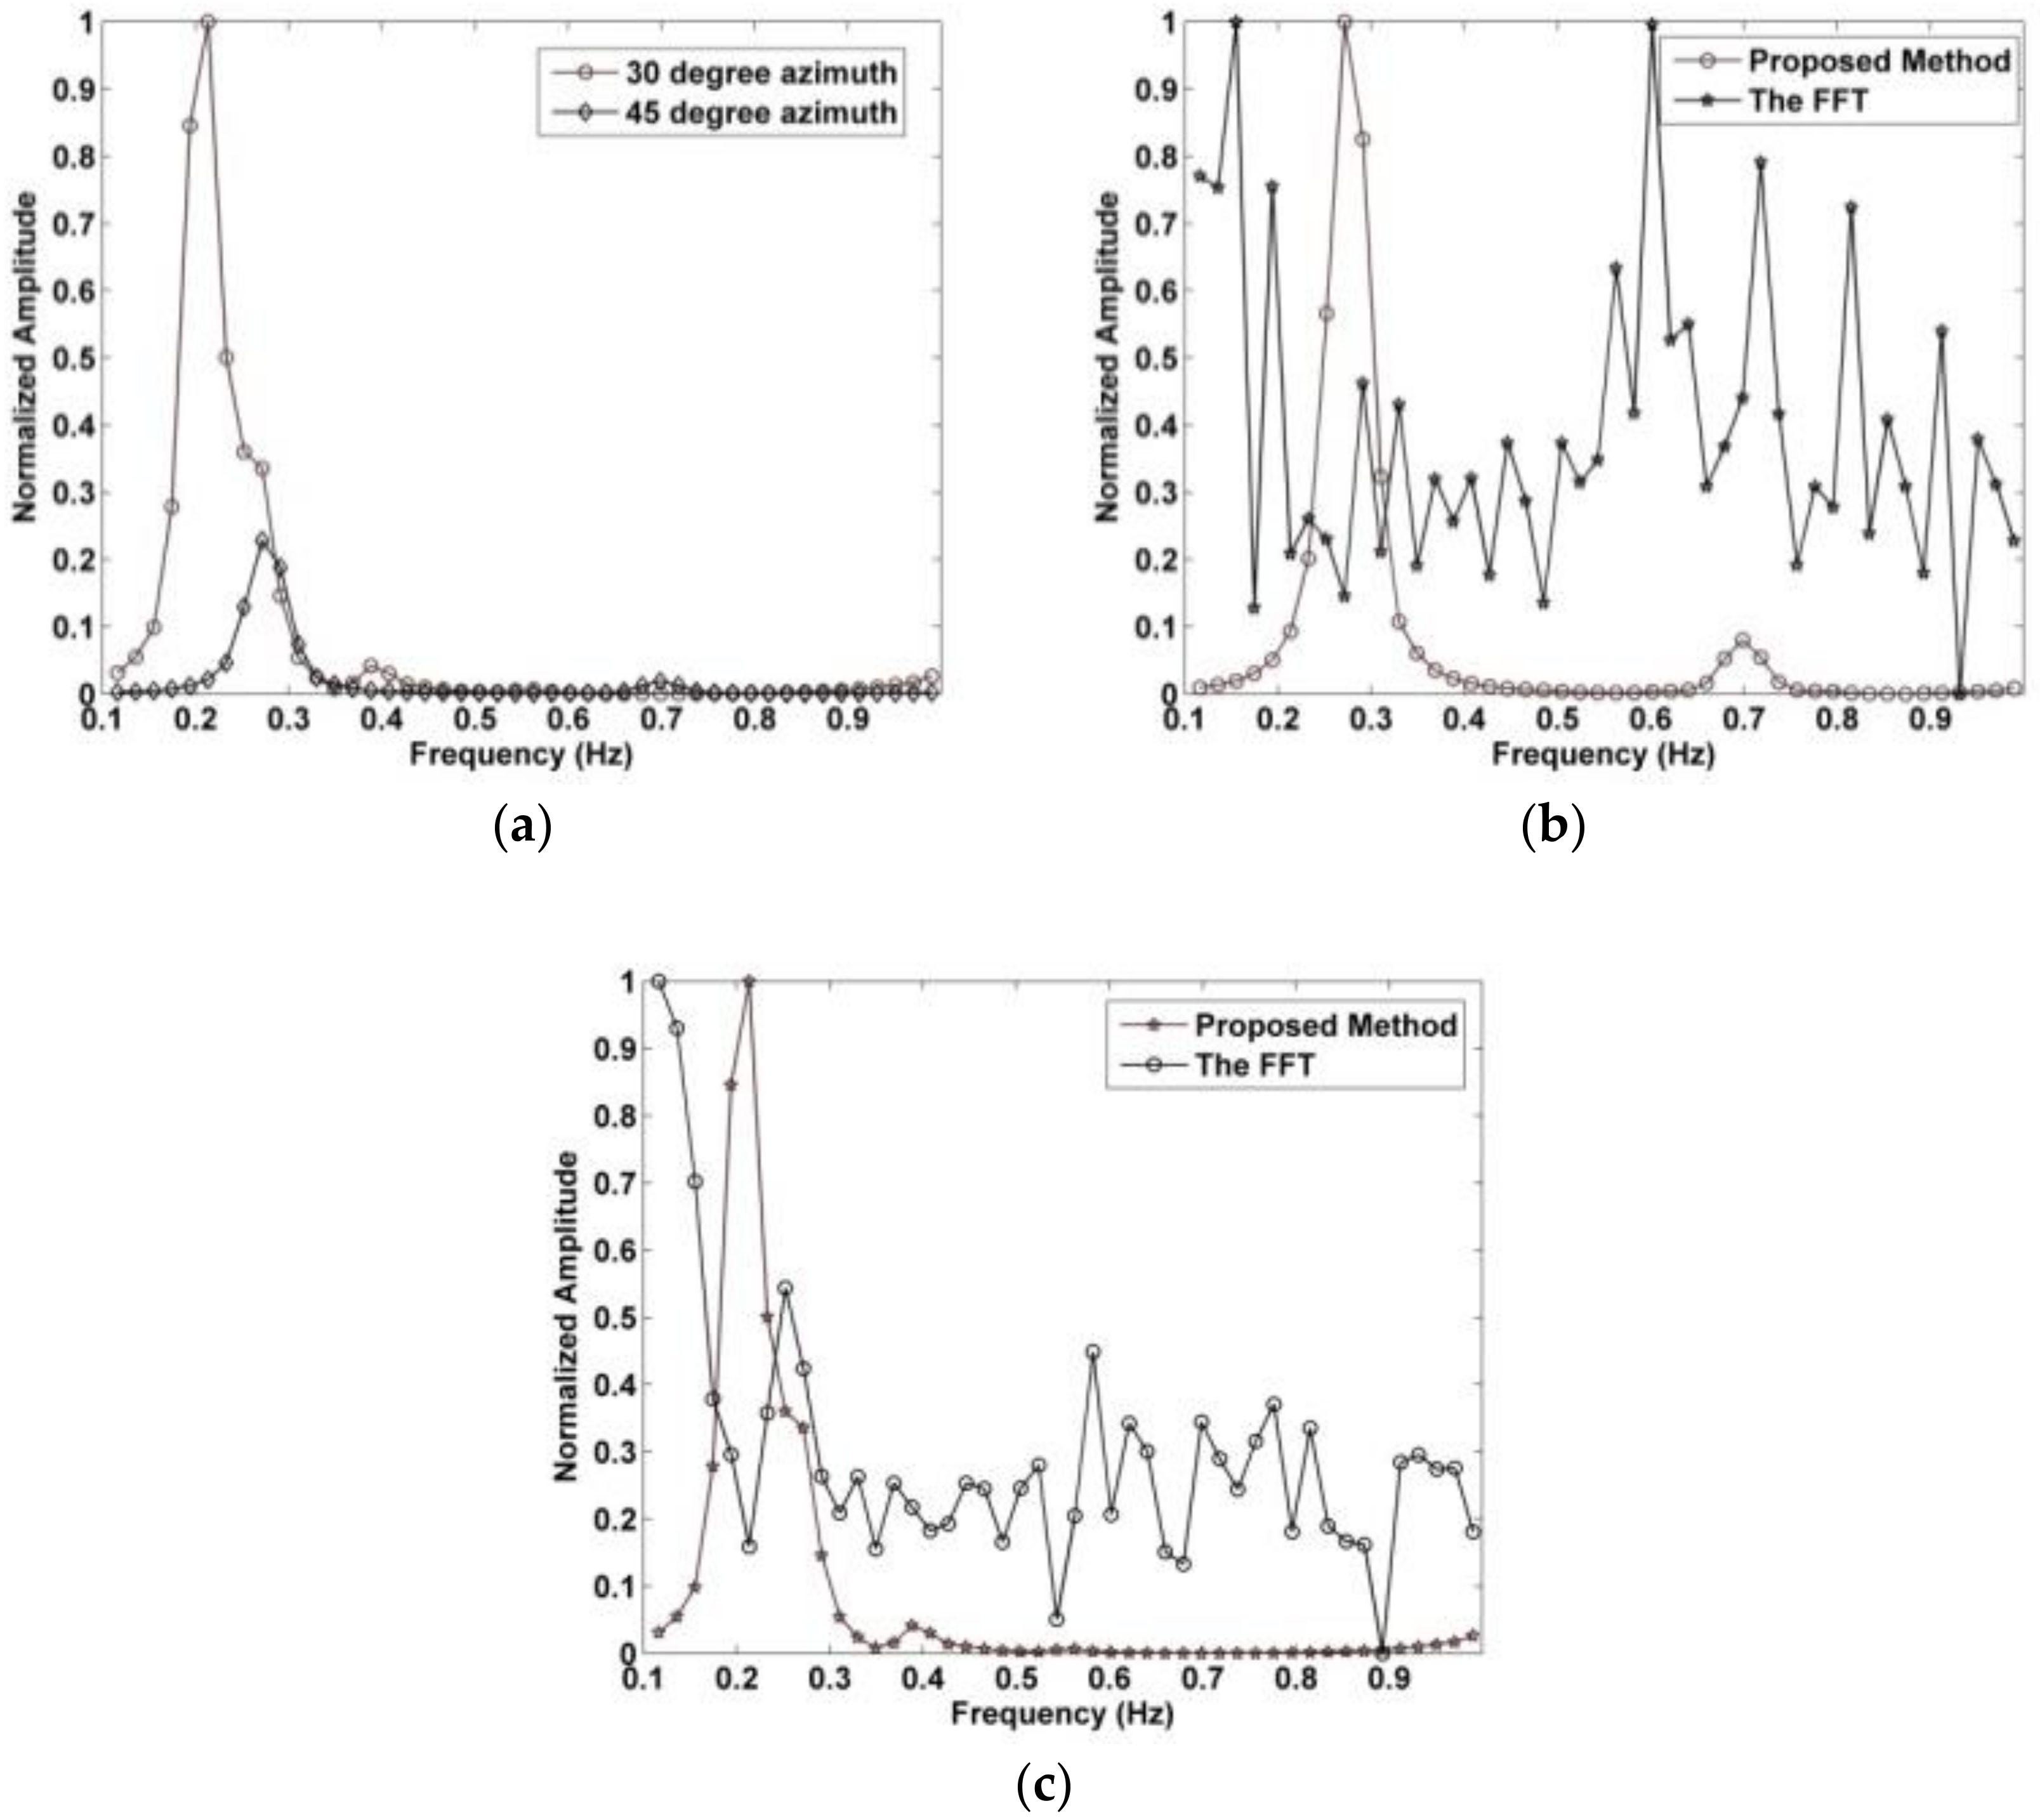
Figure 20.
The normalized respiration spectrum with (a) 30° and 45° azimuth angles using the proposed method, (b) the proposed and FFT methods at 45° azimuth angle, and (c) the proposed and FFT methods at 30° azimuth angle.
As stated previously, the periodic respiration signal is the most important and reliable indication of a trapped victim. The detection results obtained indicate that the largest signal amplitude is obtained with a 0° azimuth angle, i.e., when the subject is facing the antenna. Figure 20b shows the respiration frequency results using the proposed and FFT methods with a 45° azimuth angle, and the corresponding results with a 30° azimuth angle are given in Figure 20c. These indicate that the proposed method is much better at determining the respiration frequency than the FFT method. This is because it is better at suppressing the harmonics and interference.
4.6. Actuator Experiment
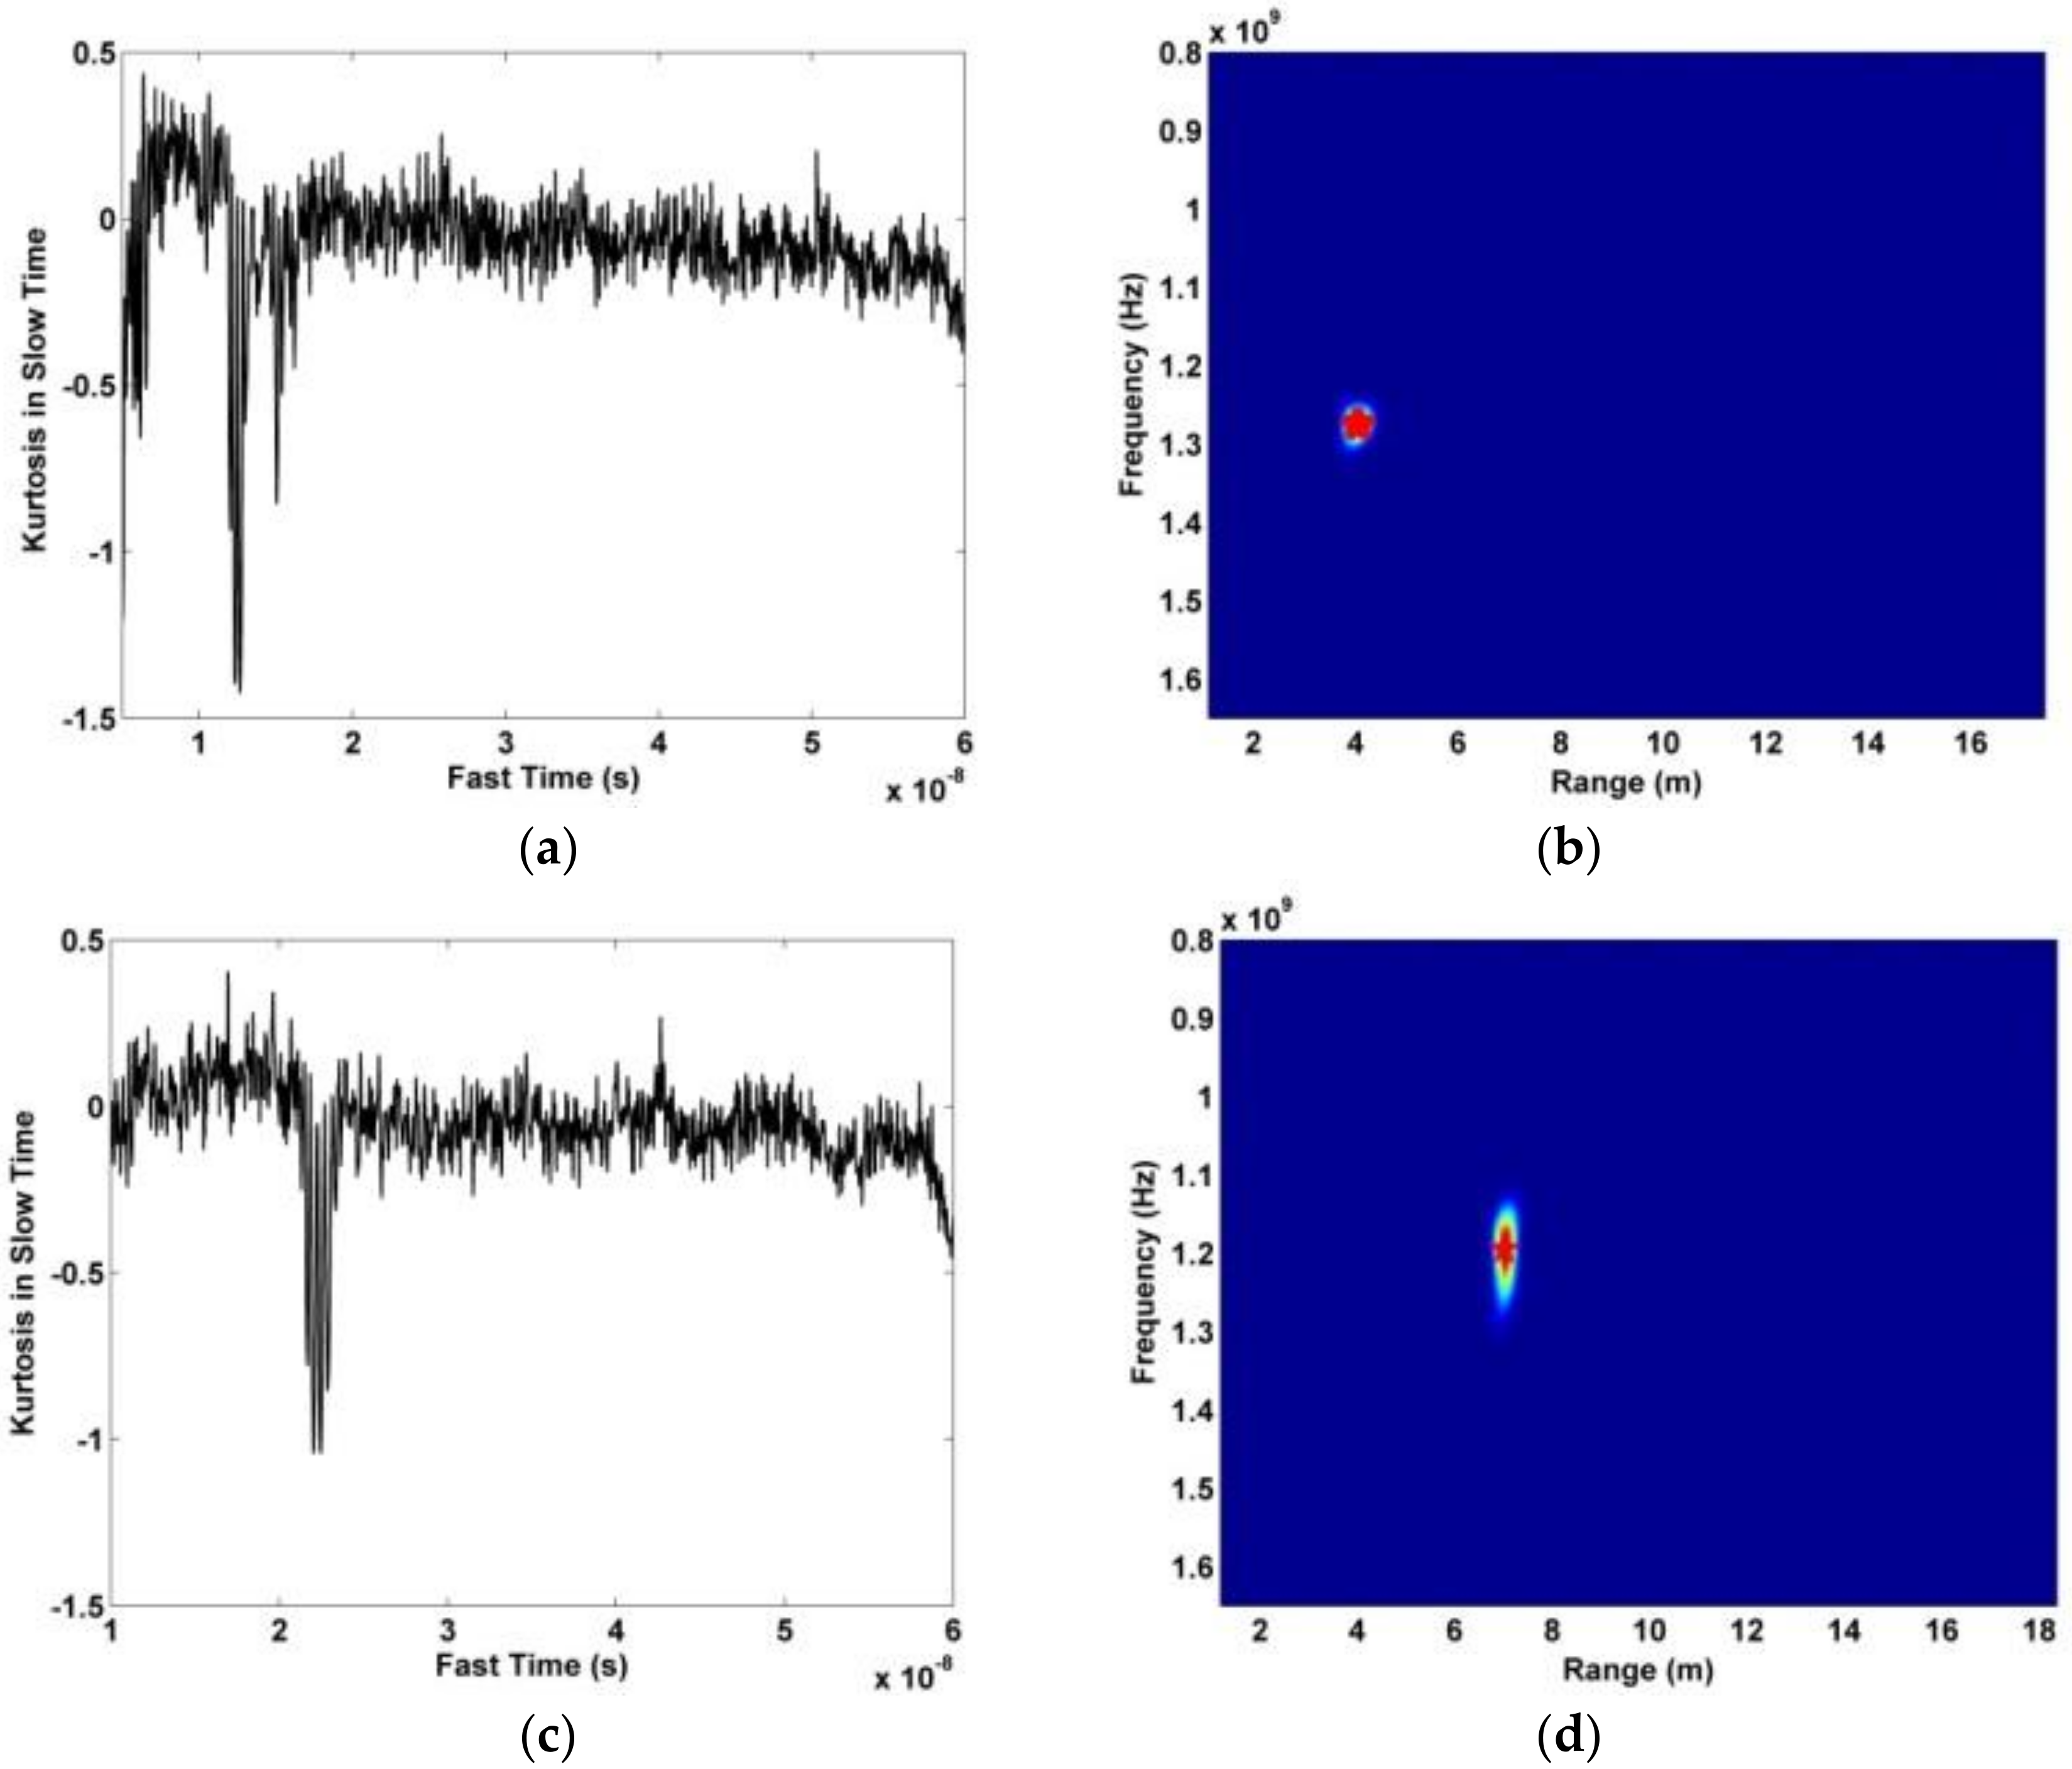
In this section, the data obtained using the actuator in an indoor environment is used to evaluate the proposed method. The actuator signal has an amplitude of 3 mm and a frequency of 0.333 Hz. In the experiment, the actuator is on a desk at a height of 1.3 m facing the antenna. The distance between the actuator and antenna was 400 cm and 700 cm. Figure 21a,b show the distribution of the kurtosis in slow time and the range estimation, respectively, at a distance of 400 cm. The corresponding results at a distance of 700 cm are given in Figure 21c,d. The error in the range estimates is 10.5 cm at 400 cm and 13.6 cm at 700 cm. The corresponding results with the AM and CFAR methods are given in Figure 22. The frequency estimation with the proposed and FFT methods is given in Figure 23. The estimated frequency with the proposed method is 0.321 Hz at both 400 cm and 700 cm, so the error is only 0.012 Hz. The results for the proposed method shown in Figure 23a,c show that the interference is significantly reduced compared to the results for the FFT method given in Figure 23b,d.

Figure 21.
Results for the actuator experiment, (a) kurtosis distribution at 400 cm, (b) range estimation at 400 cm, (c) kurtosis distribution at 700 cm, and (d) range estimation at 700 cm.
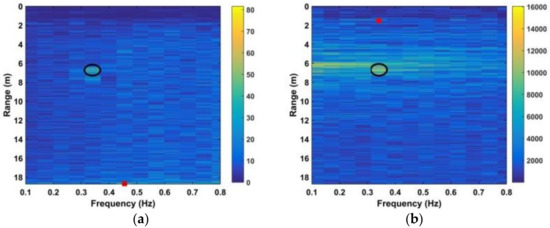
Figure 22.
Results for the actuator experiment at 700 cm using (a) AM method, and (b) CFAR method.

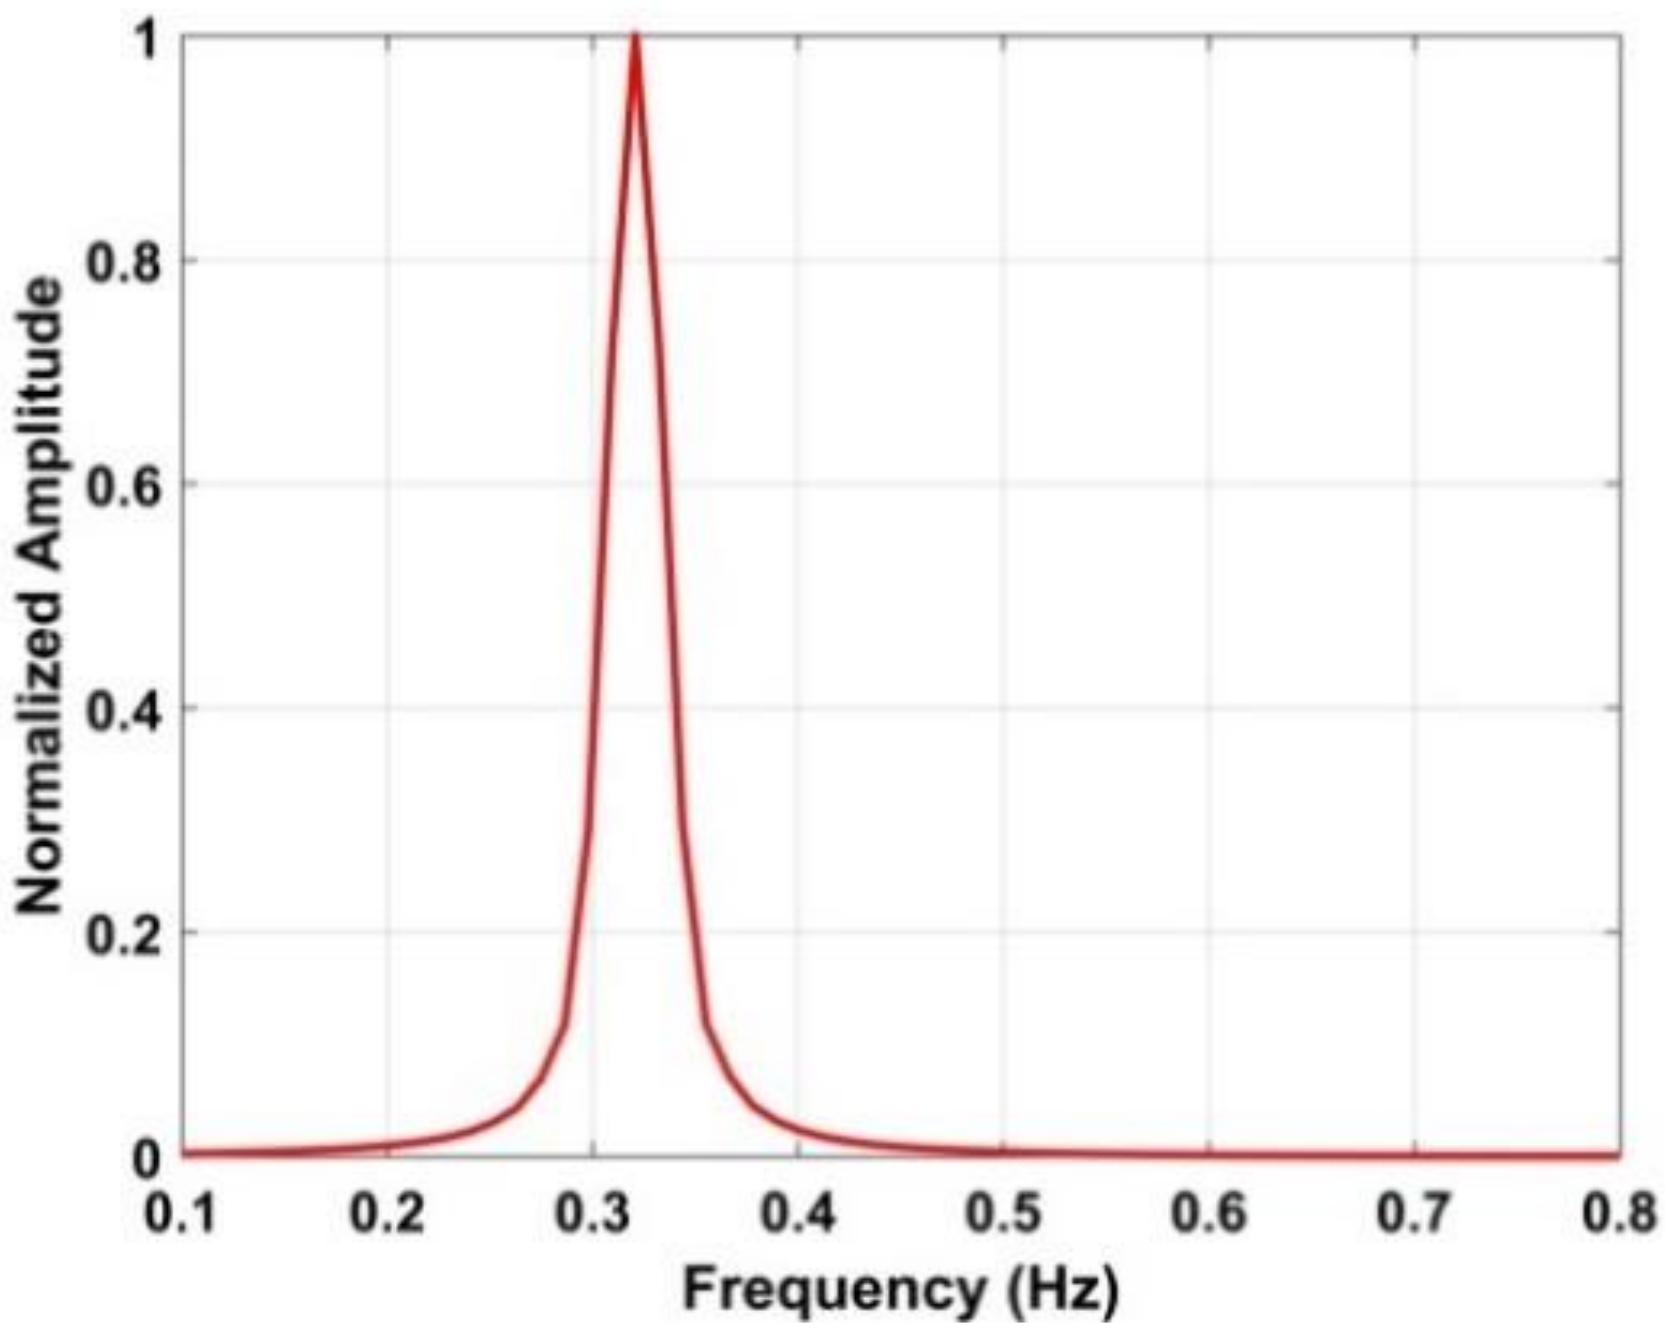
Figure 23.
(a) Frequency estimation using the proposed method at 400 cm, (b) frequency estimation using an FFT at 400 cm, (c) frequency estimation using the proposed method at 700 cm, and (d) frequency estimation using an FFT at 700 cm.
The SNR obtained using (32) with the data from the actuator 1100 cm from the antenna is shown in Table 4. The best estimate of the actuator frequency is 0.334 Hz which was obtained using the proposed method. This estimate has a deviation of only 0.12% while the estimate is 0.116 Hz using the FFT method with a deviation of 65%. Further, the SNR improvement is significantly higher with the proposed method.
Table 4.
Actuator experiment results with five methods.
4.7. Threshold Determination
A suitable threshold is required for reliable detection. A victim is assumed to be present if is less than the threshold. The data for all six human subjects were considered for this step. For each subject, three sets of data were obtained at distances between the antenna and subject of 300 cm, 600 cm, 900 cm, and 1100 cm, for a total of 72 datasets. Further, 10 sets of data were obtained without a subject present using (23) and (28) based on the acquired 10 datasets.
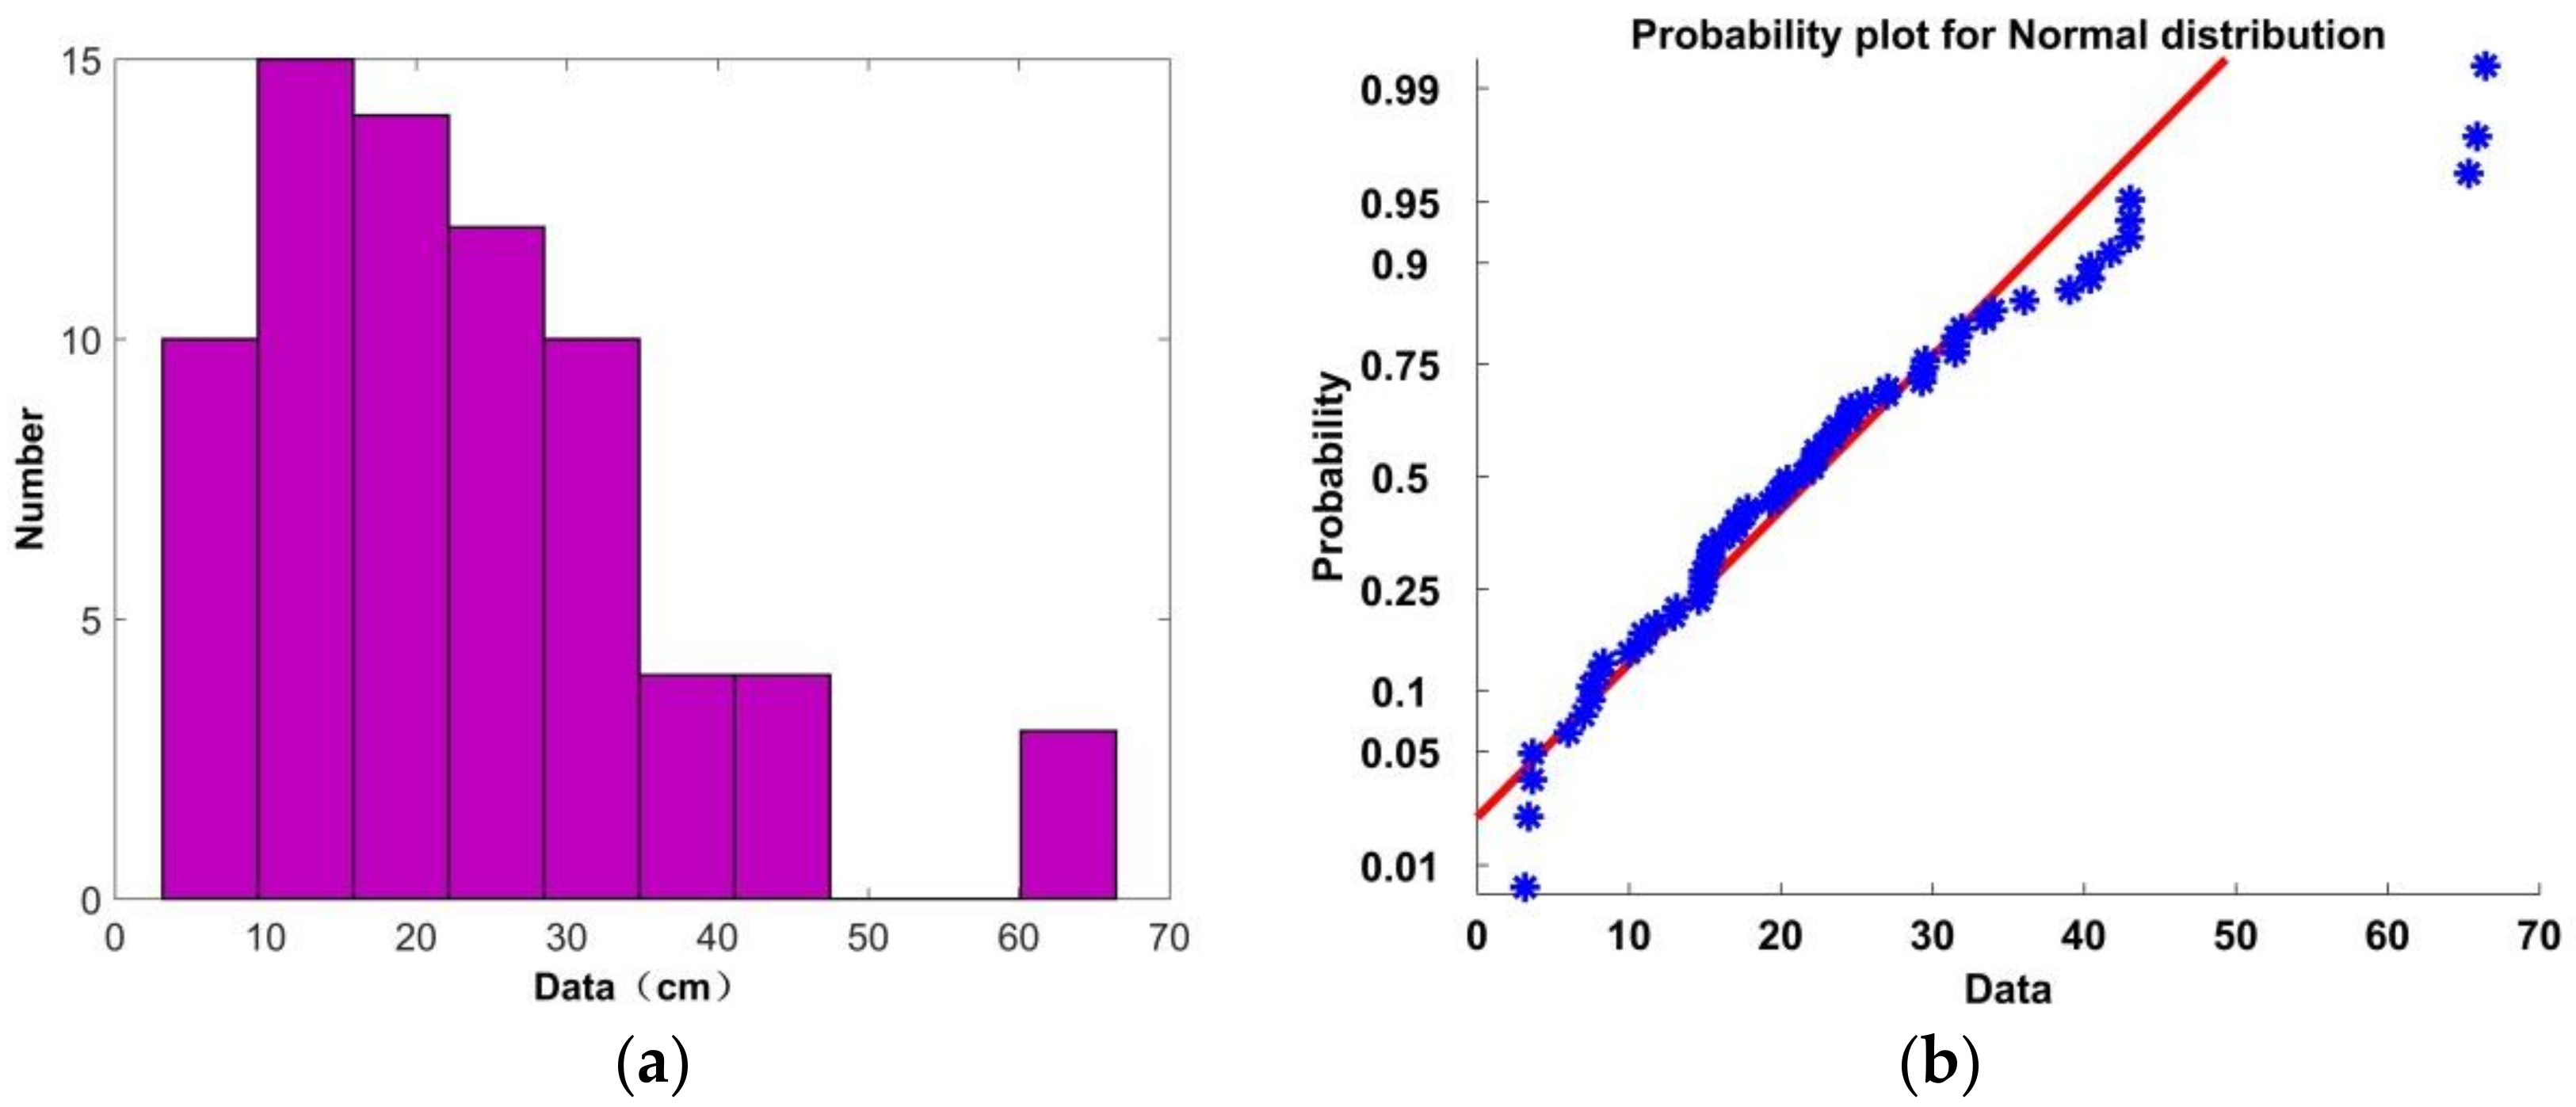
In theory, the error should be large when a subject is not present due to the random nature of the noise. A histogram of the range errors for the 72 sets of data is shown in Figure 24a, and the corresponding probability distribution is given in Figure 24b along with the associated Gaussian distribution. The red line denotes the Gaussian distribution, while the blue stars denote the distribution of the 72 errors. Based on these results, the error can be considered to be Gaussian distributed as 95% of the error values follow this distribution. Further, 68 of the 72 values are less than 45 cm. This indicates that the range of the victim can be determined accurately using (30). Table 5 shows the error when there is no subject present. These errors are much larger than when a subject is present, so the existence of a victim can be determined based on the error compared to a threshold, i.e., a victim exists if m.

Figure 24.
(a) Histogram of the range errors with the proposed method, and (b) the probability of error distribution.
Table 5.
Range estimates and errors without a human subject.
5. Conclusions
In this paper, a new human subject detection technique was presented which is based on the windowed Fourier transform (WFT) and a frequency accumulator. The range and respiration frequency of the subject were determined using UWB radar data. This provides a means of detecting trapped victims after natural disasters. The detection performance was evaluated and compared with three well-known methods. The results obtained show excellent suppression of clutter, linear trend, harmonics, and high and low-frequency interference. Further, the proposed method has low complexity. In summary, the developed detection algorithm of life signs provides a novel scheme for human subject detection via employing an UWB radar. With this motivation, the developed UWB radar can show better efficiency and effectiveness than other UWB radar systems. However, it is more challenging to acquire human respiration frequency when the subjects are moving or walking due to being in the same band as human breath with larger amplitudes. Thus, future work will focus on obtaining respiration signals when the subject is in motion such as walking and running. Further, techniques will be developed to identify human subjects from other living animals.
Author Contributions
Conceptualization, X.L.; methodology, X.L.; validation, X.L.; formal analysis, X.L.; investigation, X.L..; funding acquisition, S.Y. and H.Q.; writing-original draft preparation, X.L.; writing-review and editing, T.A.G.
Funding
This work was funded by the Nature Science Foundation of China under grant number 41527901, 61501424 and 61701462.
Conflicts of Interest
The authors declare no conflicts of interest.
References
- Zhao, H.; Hong, H.; Li, S.; Li, Y. Noncontact physiological dynamics detection using low-power digital-IF doppler radar. IEEE Trans. Instrum. Meas. 2017, 66, 1780–1788. [Google Scholar] [CrossRef]
- Mercuri, M.; Soh, J.; Pandey, G.; Karsmakers, P. Analysis of an indoor biomedical radar-based system for health monitoring. IEEE Trans. Microw. Theory Tech. 2013, 61, 2061–2068. [Google Scholar] [CrossRef]
- Kazemi, S.; Ghorbani, A.; Amindavar, H. Vital-sign extraction using bootstrap-based generalized warblet transform in heart and respiration monitoring radar system. IEEE Trans. Instrum. Meas. 2016, 65, 255–263. [Google Scholar] [CrossRef]
- Wang, J.; Wang, X.; Chen, L.; Li, C.; Ran, L. Noncontact distance and amplitude-independent vibration measurement based on an extended DACM algorithm. IEEE Trans. Instrum. Meas. 2014, 63, 145–153. [Google Scholar] [CrossRef]
- Singh, A.; Gao, X.; Yavari, M.; Zakrzewski, E. Data-based quadrature imbalance compensation for a CW Doppler radar system. IEEE Trans. Microw. Theory Tech. 2013, 61, 1718–1724. [Google Scholar] [CrossRef]
- Nijsure, Y.; Tay, W.; Gunawan, E.; Wen, F. An impulse radio ultrawideband system for contactless noninvasive respiratory monitoring. IEEE Trans. Biomed. Eng. 2013, 60, 1509–1517. [Google Scholar] [CrossRef] [PubMed]
- Li, J. Advanced signal processing for vital sign extraction with applications in UWB radar detection of trapped victims in complex environments. IEEE J. Sel. Top. Appl. Earth Obs. Remote Sens. 2014, 7, 783–791. [Google Scholar]
- Li, Z.; Li, W.; Lv, H.; Zhang, Y. A novel method for respiration-like clutter cancellation in life detection by dual-frequency IR-UWB radar. IEEE Trans. Microw. Theory Tech. 2013, 61, 2086–2092. [Google Scholar] [CrossRef]
- Hu, W.; Zhao, Z.; Wang, Y.; Zhang, H. Noncontact accurate measurement of cardiopulmonary activity using a compact quadrature doppler radar sensor. IEEE Trans. Biomed. Eng. 2014, 61, 725–735. [Google Scholar] [CrossRef]
- Tu, J.; Lin, J. Fast acquisition of heart rate in noncontact vital sign radar measurement using time-window-variation technique. IEEE Trans. Instrum. Meas. 2016, 65, 112–122. [Google Scholar] [CrossRef]
- Piuzzi, F.; Atanasio, P.; Pisa, S.; Pittella, E. A complex radar cross section measurements of the human body for breath-activity monitoring applications. IEEE Trans. Instrum. Meas. 2015, 64, 2247–2258. [Google Scholar] [CrossRef]
- Liang, X.; Zhang, H.; Ye, S.; Fang, G.; Gulliver, T.A. Improved denoising method for through-wall vital sign detection using UWB impulse radar. Digit. Signal Process. 2017, 74, 72–93. [Google Scholar] [CrossRef]
- Ren, L. Noncontact multiple heartbeats detection and subject localization using UWB impulse doppler radar. IEEE Microw. Wirel. Compon. Lett. 2015, 25, 690–692. [Google Scholar] [CrossRef]
- Sakamoto, T.; Aubry, P.; Okumura, S.; Taki, H. Noncontact Measurement of the Instantaneous Heart Rate in a Multi-person Scenario Using X-band Array Radar and Adaptive Array Processing. IEEE J. Emerg. Sel. Top. Circuits Syst. 2018, 8, 280–293. [Google Scholar] [CrossRef]
- Sun, L. Noncontact Vital Sign Detection based on Stepwise Atomic Norm Minimization. IEEE Signal Process. Lett. 2015, 22, 2479–2483. [Google Scholar] [CrossRef]
- Liang, X.; Zhang, H.; Lyu, T.; Gulliver, T.A. An improved algorithm for through-wall target detection using ultra-wideband impulse radar. IEEE Access 2017, 5, 22101–22118. [Google Scholar] [CrossRef]
- Liang, X.; Lyu, T.; Zhang, H. Through-wall human being detection using UWB impulse radar. EURASIP J. Wirel. Commun. 2018, 46, 1–17. [Google Scholar] [CrossRef]
- Zhao, H.; Hong, H.; Miao, D.; Li, Y. A Noncontact Breathing Disorder Recognition System Using 2.4-GHz Digital-IF Doppler Radar. IEEE J. Biomed. Health Inform. 2019, 23, 208–217. [Google Scholar] [CrossRef]
- Lazaro, A. Analysis of vital signs monitoring using an IR-UWB radar. Prog. Electromagn. Res. 2010, 100, 265–284. [Google Scholar] [CrossRef]
- Ren, L.; Wang, H.; Naishadham, M.; Kilic, O. Phase-based methods for heart rate detection using UWB impulse Doppler radar. IEEE Trans. Microw. Theory Tech. 2016, 64, 3319–3331. [Google Scholar] [CrossRef]
- Venkatesh, S.; Anderson, C.; Rivera, N.V.; Buehrer, R.M. Implementation and analysis of respiration-rate estimation using impulse-based UWB. In Proceedings of the 2005 IEEE Military Communications Conference, Atlantic City, NJ, USA, 17–20 October 2005; Volume 5, pp. 3314–3320. [Google Scholar]
- Ascione, M.; Buonanno, A.; D’Urso, M.; Angrisani, L. A new measurement method based on music algorithm for through-the-wall detection of life signs. IEEE Trans. Instrum. Meas. 2013, 62, 13–26. [Google Scholar] [CrossRef]
- Liu, L.; Liu, Z.; Barrowes, B. Through-wall bio-radiolocation with UWB impulse radar-observation, simulation and signal extraction. IEEE J. Sel. Top. Appl. Earth Obs. Remote Sens. 2011, 4, 791–798. [Google Scholar] [CrossRef]
- Liu, L.; Liu, Z.; Xie, H.; Amvrossios, C.B. Numerical simulation of UWB impulse radar vital sign detection at an earthquake disaster site. Ad Hoc Netw. 2014, 13, 34–41. [Google Scholar] [CrossRef]
- Rahman, M.; Mahdi, N.; Seyed, S.; Abdel, M. Resonator Based Switching Technique between Ultra Wide Band (UWB) and Single/Dual Continuously Tunable-Notch Behaviors in UWB Radar for Wireless Vital Signs Monitoring. Sensors 2018, 18, 3330. [Google Scholar] [CrossRef] [PubMed]
- Liang, X.; Wang, Y.; Wu, S.; Gulliver, T.A. Experimental Study of Wireless Monitoring of Human Respiratory Movements Using UWB Impulse Radar Systems. Sensors 2018, 18, 3065. [Google Scholar] [CrossRef] [PubMed]
- Lee, J.S.; Nguyen, C.; Scullion, T. A novel, compact, low-cost, impulse ground-penetrating radar for nondestructive evaluation of pavements. IEEE Trans. Instrum. Meas. 2004, 53, 1502–1509. [Google Scholar] [CrossRef]
- Conte, E.; Filippi, A.; Tomasin, S. ML period estimation with application to vital sign monitoring. IEEE Signal Process. Lett. 2010, 17, 905–908. [Google Scholar] [CrossRef]
- Liang, X.; Zhang, H.; Lyu, T.; Xu, L.; Cao, C.; Gulliver, T.A. Ultra-wide band impulse radar for life detection using wavelet packet decomposition. Phys. Commun. 2018, 4, 1–20. [Google Scholar] [CrossRef]
- Liang, X.; Deng, J.; Zhang, H.; Gulliver, T.A. Ultra-Wideband Impulse Radar Through-Wall Detection of Vital Signs. Sci. Rep-UK 2018, 8, 13367. [Google Scholar] [CrossRef]
- Guan, S.; Rice, J.A.; Li, C. Automated DC offset calibration strategy for structural health monitoring based on portable CW radar sensor. IEEE Trans. Instrum. Meas. 2014, 63, 3111–3118. [Google Scholar] [CrossRef]
- Zhang, Z. Human-target detection and surrounding structure estimation under a simulated rubble via UWB radar. IEEE Trans. Geosci. Remote Sens. 2013, 10, 328–331. [Google Scholar] [CrossRef]
- Xu, Y.; Wu, S.; Chen, C.; Chen, J.; Fang, G. A novel method for automatic detection of trapped victims by ultrawideband radar. IEEE Trans. Geosci. Remote Sens. 2012, 50, 3132–3142. [Google Scholar] [CrossRef]
- Xie, Y.; Fang, G. Equi-amplitude tracing algorithm based on base-band pulse signal in vital sign detecting. Electron. Inf. Technol. 2009, 31, 1132–1135. [Google Scholar]
- Nezirovic, A.; Yarovoy, A.G.; Ligthart, L.P. Signal processing for improved detection of trapped victims using UWB radar. IEEE Trans. Geosci. Remote Sens. 2010, 48, 2005–2014. [Google Scholar] [CrossRef]
- Tan, K.; Wu, S.; Chen, J.; Xia, Z.; Fang, G.; Meng, S. Improved human respiration detection method via ultra-wideband radar in through-wall or other similar conditions. IET Radar Sonar Navig. 2016, 10, 468–476. [Google Scholar]
- Xu, Y.; Dai, S.; Wu, S.; Chen, J.; Fang, G. Vital sign detection method based on multiple higher order cumulant for ultra-wideband radar. IEEE Trans. Geosci. Remote Sens. 2012, 50, 1254–1265. [Google Scholar] [CrossRef]
- Hu, X.; Jin, T. Short-range vital signs sensing based on EEMD and CWT using IR-UWB radar. Sensors 2016, 16, 2025. [Google Scholar] [CrossRef]
- Khan, F.; Cho, S.H. A Detailed Algorithm for Vital Sign Monitoring of a Stationary/Non-Stationary Human through IR-UWB Radar. Sensors 2017, 17, 290. [Google Scholar] [CrossRef]
- Rahman, M.; Ko, D.; Park, J. A Compact Multiple Notched Ultra-Wide Band Antenna with an Analysis of the CSRR-TO-CSRR Coupling for Portable UWB Applications. Sensors 2017, 17, 2174. [Google Scholar] [CrossRef]
- Lv, H.; Qi, F.; Zhang, Y.; Jiao, T. Improved Detection of Human Respiration Using Data Fusion Basedon a Multistatic UWB Radar. Remote Sens. 2016, 8, 773. [Google Scholar] [CrossRef]
- Liang, X.; Zhang, H.; Lv, T.; Gulliver, T.A. Extreme learning machine for 60 GHz millimetre wave positioning. IET Commun. 2017, 11, 483–489. [Google Scholar] [CrossRef]
- Liang, X.; Zhang, H.; Lv, T.; Gulliver, T.A. Energy detector based TOA estimation for MMW systems using machine learning. Telecommun. Syst. 2017, 64, 417–427. [Google Scholar] [CrossRef]
- Wu, S.; Yao, S.; Tan, K.; Xia, Z.; Meng, S.; Chen, J.; Fang, G. Study on a Novel UWB Linear Array Human Respiration Model and Detection Method. IEEE J. Sel. Top. Appl. Earth Obs. Remote Sens. 2016, 9, 125–140. [Google Scholar] [CrossRef]
- Jurjevcic, B.; Senegačnik, A.; Drobnič, A.; Kustrin, I. The characterization of pulverized-coal pneumatic transport using an array of intrusive electrostatic sensors. IEEE Trans. Instrum. Meas. 2016, 64, 3434–3443. [Google Scholar] [CrossRef]
- Antoni, J. The spectral kurtosis: A useful tool for characterising non-stationary signals. Mech. Syst. Signal Process. 2006, 20, 282–307. [Google Scholar] [CrossRef]
- Zhang, Y. 2-D entropy and short-time Fourier transform to leverage GPR data analysis efficiency. IEEE Trans. Instrum. Meas. 2015, 64, 103–111. [Google Scholar] [CrossRef]
- Allen, B. Short term spectral analysis, synthesis, and modification by discrete Fourier transform. IEEE Trans. Acoust. Speech Signal Process. 1977, 25, 235–238. [Google Scholar] [CrossRef]
- Wójcicki, K.; Milacic, M.; Stark, A.; Lyons, J. Exploiting conjugate symmetry of the short-time Fourier spectrum for speech enhancement. IEEE Signal Process. Lett. 2008, 15, 461–464. [Google Scholar] [CrossRef]
- Mak, J.C.C.; Bois, A.; Poon, J.K.S. Programmable multiring Butterworth filters with automated resonance and coupling tuning. IEEE J. Sel. Top. Quantum Electron. 2016, 22, 232–240. [Google Scholar] [CrossRef]
- Marple, L. Computing the discrete-time “analytic” signal via FFT. IEEE Trans. Signal Process. 1999, 47, 2600–2603. [Google Scholar] [CrossRef]


© 2019 by the authors. Licensee MDPI, Basel, Switzerland. This article is an open access article distributed under the terms and conditions of the Creative Commons Attribution (CC BY) license (http://creativecommons.org/licenses/by/4.0/).